outdoor patio heater - garden sun heater
TRANSCRIPT

Discussion
Pa
per|
Discussion
Pa
per|
Discussion
Paper
|D
iscussionP
aper|
SOIL Discuss., 1, 363–400, 2014www.soil-discuss.net/1/363/2014/doi:10.5194/soild-1-363-2014© Author(s) 2014. CC Attribution 3.0 License.
This discussion paper is/has been under review for the journal SOIL. Please refer to thecorresponding final paper in SOIL if available.
Global distribution of soil organic carbon,based on the Harmonized World SoilDatabase – Part 2: Certainty of changesrelated to land-use and climateM. Köchy1,*, A. Don1, M. K. van der Molen2,**, and A. Freibauer1
1Thünen Institute of Climate-Smart Agriculture, Bundesallee 50,38116 Braunschweig, Germany2Vrije Universiteit Amsterdam, Boelelaan 1085, 1081 HV Amsterdam, the Netherlands*now at: Thünen Institute of Market Analysis, Bundesallee 50, 38116 Braunschweig, Germany**now at: Wageningen University, P.O. Box 47, 6700 AA Wageningen, the Netherlands
Received: 8 August 2014 – Accepted: 21 August 2014 – Published: 3 September 2014
Correspondence to: M. Köchy ([email protected])
Published by Copernicus Publications on behalf of the European Geosciences Union.
363
Discussion
Paper
|D
iscussionP
aper|
Discussion
Paper
|D
iscussionP
aper|
Abstract
Global biosphere models vary greatly in their projections of future changes of globalsoil organic carbon (SOC) stocks and aggregated global SOC masses in response toclimate change. We estimated the certainty (likelihood) and quantity of increases anddecreases on a half-degree grid. We assessed the effect of changes in controlling fac-5
tors, including net primary productivity (NPP), litter quality, soil acidity, water-saturation,depth of permafrost, land use, temperature, and aridity, in a temporally implicit modelthat uses categorized driver variables associated by probabilities (Bayesian Network).The probability-weighted results show that, globally, climate effects on NPP had thestrongest impact on SOC stocks and the certainty of change after 75 years. Actual10
land use had the greatest effect locally because the assumed certainty of land usechange per unit area was small. The probability-weighted contribution of climate todecomposition was greatest in the humid tropics because of greater absolute effectson decomposition fractions at higher temperatures. In contrast, climate effects on de-composition fractions were small in cold regions. Differences in decomposition rates15
between contemporary and future climate were greatest in arid subtropical regionsbecause of projected strong increases in precipitation. Warming in boreal and arcticregions increased NPP, balancing or outweighing potential losses from thawing of per-mafrost. Across contrasting NPP scenarios tropical mountain forests were identified ashotspots of future highly certain C losses. Global soil C mass will increase by 1 % with20
a certainty of 75 % if NPP increases due to carbon-dioxide fertilization. At a certaintylevel of 75 %, soil C mass will not change if CO2-induced increase of NPP is limited bynutrients.
1 Introduction
Soil organic carbon (SOC) represents about three quarters to four fifths of the terrestrial25
organic carbon (C) mass (Prentice et al., 2001). The mean turnover rate of SOC is
364

Discussion
Pa
per|
Discussion
Pa
per|
Discussion
Paper
|D
iscussionP
aper|
slower than that of any other terrestrial organic pool (Reeburgh, 1997). Due to its size,small relative changes in the SOC mass can have large effects on atmospheric CO2concentration and hence on climate change.
Global SOC mass in five general circulation models (GCM) was projected to changeby between −46 and +51 Pg (Schaphoff et al., 2006) by the end of the century. Eleven5
earth system models even showed a range of projected changes between −72 and+253 Pg for a high-CO2 scenario (Todd-Brown et al., 2014). Projections also differin where changes occur (Sitch et al., 2008). The large variation in expected futurechanges is due to the balance of, on one hand side, different expected increases ofcarbon input from net primary productivity (NPP) by CO2 fertilization and higher tem-10
peratures and, on the other hand side, faster decomposition accelerated by highertemperatures (Davidson and Janssens, 2006; Smith et al., 2008). The point of balancemay vary over the course of time (Jones et al., 2005). Furthermore, although NPP mightincrease in the future because of increasing concentrations of CO2 in the atmosphere(CO2 fertilization), productivity may still be limited by the availability of nitrogen or other15
resources (Gedalof and Berg, 2010; Norby et al., 2010; Todd-Brown et al., 2014).With this wide range of projected changes in the global mass of SOC one may won-
der how likely increases or decreases of SOC stocks (mass of organic carbon pervolume of soil) are in response to potential changes in C input and climate across theworld? One way to address the certainty of projections is to obtain a frequency dis-20
tribution of the ensemble output of several models as has been done for changes inclimate (e.g., Power et al., 2011). This approach however cannot formally address theuncertainty in the parameters of the models. This rather requires consideration of thefrequency distribution of the values of many potentially controlling factors of the organiccarbon cycle.25
The effect of the frequency distribution of parameters on SOC stocks, the globalSOC mass, and SOC changes was assessed for one model (Hararuk et al., 2014)using a Markov Chain-Monte Carlo approach for model calibration. The distributionparameters in the model caused SOC losses ranging between 15 and 100 Pg for a
365
Discussion
Paper
|D
iscussionP
aper|
Discussion
Paper
|D
iscussionP
aper|
scenario implying high greenhouse-gas emissions and mean global temperature in-creases (“RCP8.5”). This study focused on the approach and a global perspective andleft out other import impacts that affect SOC stocks and masses regionally and globally.
For a richer picture of the change of global SOC mass, wetland soils, including peat-lands, which contain at least 6–12 % of the global SOC mass in the upper 1 m (depend-5
ing on the definition and estimated area of wetland, Köchy et al., 2014), and permafrostregions, containing about 40 % of the global SOC mass in the upper 1 m (Köchy et al.,2014) must be considered as well. Furthermore, SOC stocks are not only affected byclimate change but probably even more so by change in land use (Brovkin et al., 2013).This is especially true for organic soils because they contain > 15 % of the global SOC10
mass in the top 1 m (Köchy et al., 2014). SOC losses from organic soils in Scotland,for example, are expected to be ca. 3.5 times greater than losses from C-poor soils(Smith et al., 2010). In C-rich wet or water-logged soils, decomposition of organic mat-ter is slow because of lack of oxygen (Armentano and Mengeo, 1985; Mitra et al., 2005;Smith et al., 2008). Draining of wetlands exposes C to oxygen. Outside wetlands, con-15
version of natural forests to grassland or cropland causes drastic losses in temperate(Poeplau et al., 2011) and tropical regions (Holmes et al., 2006; Don et al., 2011).Organic matter in the soil can also be physically protected from microbial decomposi-tion by adsorption to soil particles (Six et al., 2002; Davidson and Janssens, 2006) orpermafrost.20
The relative impacts of climate change, land use change, and thawing of permafroston SOC stocks of mineral and organic soils have been studied with great detail only atsmall or regional scales (e.g. Grosse et al., 2011). There is a lack of a comprehensiveglobal assessment of the certainty of soil C changes (Vesterdal and Leifeld, 2007). Inthe present study we quantify the uncertainty of changes of present-day SOC stocks25
due to projected changes in climate and land use by aggregating the uncertainty orvariability in controlling variables, and their effects on SOC stocks. In addition, we iden-tify where soils are most likely to be vulnerable at the global scale and with relevanceto the global carbon cycle.
366

Discussion
Pa
per|
Discussion
Pa
per|
Discussion
Paper
|D
iscussionP
aper|
2 Methods
We assess the effects of climate (temperature, aridity), soil (acidity, permafrost, aero-bicity, C adsorption), vegetation (vegetation type, litter quality), and land use (via NPP,harvest index, and litter quality) on SOC stocks at a spatial resolution of pixels with 0.5◦
latitude by 0.5◦ longitude.5
For quantifying the certainty of SOC changes over a period of 75 years (2010–2085)we apply a quasi-steady-state three-pool model of SOC decomposition to historic SOCstocks within an environmental framework (Fig. 1) and compare differences betweenfuture reference and target conditions. Historic conditions correspond to SOC stocksof ca. 1950–2000 of the top 1 m under current (ca. 1980–2010) climate and land use.10
Future conditions are characterized by projected climate and land use of 2075–2100.Reference conditions imply no change in environment, whereas target conditions implychanges in climate, vegetation, and land use. For comparisons of reference and targetconditions, we keep local (within pixel) settings of soil pH, CEC, and constraints of O2availability (unless caused by a change of land use to or from wetland) constant.15
SOC stocks in reference and target conditions are prescribed by decomposition un-der constant ranges of monthly temperature, monthly precipitation, litter input, and landuse for 75 years starting with the historic SOC stock. (We account for the expectedgradual change in climate and land-use in an additional step.) We compare referencewith target SOC stocks after 75 years instead of steady-states with t →∞ in order to20
compare the same points of time across all soil conditions of the world in the spatialanalysis and for compatibility with the point of time of projected NPP and climate val-ues. Nonetheless, in our simulations of SOC stocks, a steady-state is reached within75 years in most mineral soils and non-extreme environments. In other words, by con-sidering a defined, limited time period we compare two possible outcomes (reference25
vs. target conditions) for the same year. This facilitates comparisons with projections ofC stocks for the end of the century by other authors.
367
Discussion
Paper
|D
iscussionP
aper|
Discussion
Paper
|D
iscussionP
aper|
In the following sections we describe first the core decomposition model and thenhow environmental factors affect the values of the decomposition parameters.
2.1 Characterization of the Harmonized World Soil Database
We consider three pools of SOC – fast (Cfast), slow (Cslow), and inaccessible – that dif-fer in their maximum annual decomposition fractions under optimal conditions. At the5
beginning of each year, above- and belowground coarse and fine litter (equal to NPPin the long term) is added to Cfast. Removal of C from the ecosystem by disturbances(e.g. fire) or harvest is taken into account in relation with land use and is described be-low. The Cfast pool is reduced by the annual decomposition fraction (Ff) and a fractionmoving from the fast to the slow pool (toslow). Litter quality controls toslow. The maxi-10
mum decomposition fraction is constrained by temperature, soil humidity, soil acidity,and oxygen availability. The constraints are jointly expressed as a fraction modifyingfactor (fmf) ranging between 0 and 1 (Fig. 2). The maximum decomposition fractionof the slow pool (Fs) is constrained in the same way as Ff. The inaccessible pool isthe fraction of SOC that is frozen, submerged in water, or adsorbed to soil matter and15
whose decomposition fraction we assume to be negligible within the time perspectiveof our study.
The total amount of C in the fast and slow pool after one year are
Cfast,t+1 = (Cfast,t +NPPt) · (1− fmf · Ff) · (1− toslow) and
Cslow,t+1 = Cslow,t · (1− fmf · Fs)+Cfast,t+1 · (1− fmf · Fs)20
with Cfast,t=0 = 0 and Cslow,t=0 =C0 ·af or the accessible fraction (af) of the initial total Cstock (C0). NPP is supplied by external models and described below in “NPP scenariosin the environmental framework”. After several decades, the sizes of the fast and slowpools depend mostly on the amount of annually added C, the decomposition fractions,25
and the distribution of matter between the fast and slow pools, but little on the initialamount of accessible C for not too small values of fmf (see Supplement 3 for a summary
368

Discussion
Pa
per|
Discussion
Pa
per|
Discussion
Paper
|D
iscussionP
aper|
equation). Limited substrate availability could reduce decomposition rates (Davidsonand Janssens, 2006; Kirschbaum, 2006) but contributed very little to the prediction ofexisting SOC stocks in an earlier version of the model. Therefore, substrate availabilitywas not included in the final version.
The values of the parameters and variables of the decomposition model are con-5
trolled by variables in the environmental framework characterizing the physical andbiotic environment in a particular location: soil, vegetation, climate, land use.
2.2 The environmental framework
The environmental variables and their causal relationships are described by a proba-bility network (Spiegelhalter et al., 1993) using Netica (version 5, Norsys, Vancouver,10
Canada). Probability networks, also known as Bayesian networks, associate classes(e.g., levels) of each variable, with probability distributions of their occurrence contin-gent on the occurrence of classes (levels) within other variables. These probabilitiescan be interpreted as certainties of potential outcomes. Joint probabilities of classesare calculated according to the laws of probabilities, or, in the case of continuous vari-15
ables, sampled by Monte-Carlo techniques. Probability networks allow the inclusionof the uncertainty or variability of variables and expert knowledge. The networks (onefor each of two contrasting NPP submodels in two NPP scenarios) with all probabilitytables and class borders are supplied in Supplements 1 and 2.
2.3 NPP scenarios in the environmental framework20
The strong effect of NPP via litter input on SOC stocks in models is well establishedand founded on theory (Todd-Brown et al., 2014). The long-term net effect of climatechange on NPP and, consequently, litter input, however, is still unclear. NPP mightincrease because of increasing concentrations of CO2 in the atmosphere (CO2 fertil-ization) but productivity may be limited by the availability of nitrogen or other resources25
(Gedalof and Berg, 2010; Norby et al., 2010; Todd-Brown et al., 2014). To present the
369
Discussion
Paper
|D
iscussionP
aper|
Discussion
Paper
|D
iscussionP
aper|
range of the effects of nutrient limitation and CO2 fertilization we used two contrastingscenarios of future NPP together with climate conforming to the A1B emission scenario(IPCC, 2000). The first scenario, “limited NPP”, represents a change in productivitycaused by temperature and precipitation alone, which could be similar to the net effectof CO2 fertilization and nutrient-constrained growth. This NPP is based on the empirical5
NCEAS model (Del Grosso et al., 2008, an extension of the Miami or Lieth model), afunction of mean annual temperature, mean annual precipitation, and vegetation type(Supplement 3: data processing and sources). The second scenario, “enhanced NPP”,represents an increase of productivity due to CO2 fertilization in addition to changesin temperature and precipitation without limitation of the additional growth by nutrients.10
This NPP is derived from LPJ, a process-based DGVM (Sitch et al., 2003; Gerten etal., 2004). In comparisons between the NPP scenarios we keep functional relations(e.g., decomposition fractions, fraction modifying factors, decomposability) and planttype composition within each vegetation type constant.
2.4 Environmental framework structure and parameterization15
The amount of C added to the accessible (fast and slow) pool is set equal to the NPPin natural ecosystems and consists of leaf litter, fine and coarse woody debris, and fineand coarse dead roots. C removal with harvested products and higher NPP input byagricultural fertilization must be accounted for in land use effects. We calculated theharvest factor, the mean ratio of NPP after harvest including agricultural fertilization20
(NPPt) to NPP of the potential zonal vegetation (NPP0) from a global database (Haberlet al., 2007) for each combination of 13 vegetation zones and six land use classes(zonal, built-up, herbaceous crops, pasture, woody crops/plantations, wetlands; Sup-plement 3, Table S4.2 in Supplement 4) for present environmental conditions. “Wet-lands”, an azonal land cover, is included in this list for convenience. The harvest factor25
allowed us to use existing models of NPP0 and apply it to future conditions. We notethat using this procedure glosses over regional differences within vegetation zones.
370

Discussion
Pa
per|
Discussion
Pa
per|
Discussion
Paper
|D
iscussionP
aper|
The fraction-modifying factor (fmf) aggregates the effects of temperature, soil mois-ture, oxygen availability, and soil reaction by multiplication similar to the rate-modifyingfactors in other decomposition models (e.g., Roth-C, Coleman and Jenkins, 1999).The probability distribution of fmftemperature (Fig. 2a) is a discretization of the equa-tion exp(−2.5+0.07 · temperature) on laboratory incubation data from several sources5
(Fig. 2 in Paul et al., 2002). We used laboratory data because we were interested in theeffect of temperature in isolation from other variables on the maximum decompositionfraction under optimal conditions. Our discretization of the temperature effect (Fig. 2a)encompasses many other empirical temperature functions that are used in establishedsoil C models like Roth-C, APSIM, or Century (Paul, 2001). In-situ microbial communi-10
ties might respond to increased constant temperatures with acclimation (Allison et al.,2010). Our approach considers monthly variation of temperatures and aridity and it isunclear from the current literature how strong acclimation is relative to this variabilityand how much current latitudinal patterns are caused by climate. We assume here thatthe class widths used in the parameterization of fmf (Fig. 2a) and distinction of monthly15
temperatures encompass sub-monthly effects of acclimation.The classification of the moisture effect (Fig. 2b) is associated with Walter and Li-
eth’s (1967) climatic aridity classes. These are arid: MMP/2 < MMT, dry: MMP/3 < MMT,moist: MMP > 100, and mesic: the remainder, where MMT is mean monthly air temper-ature (◦C) and MMP mean monthly precipitation (mm). In addition, “wet” is used for wet-20
land soils. The shape of the probability distribution associated with the aridity classescorresponds to the probability distribution of the 0.75–1.0 quantile range of laboratorydecomposition studies (Paul et al., 2002) and of subsamples of the moisture functionsin the decomposition models APSIM (Probert et al., 1998), ED-RAMS (Ise et al., 2008),and ECOSSE (SEERAD, 2007). We selected these models because they included re-25
lationships for water-saturated soils. To include seasonal effects, fmfs of temperatureand aridity were calculated by month, multiplied with each other for each month andaveraged (geometric mean) per quarter and then per year. Averaging was necessaryto reduce the complexity of the probability network to a level that could be calculated
371
Discussion
Paper
|D
iscussionP
aper|
Discussion
Paper
|D
iscussionP
aper|
with Netica. Oxygen availability refers to the Harmonized World Soil Database Supple-mentary Data that includes topographic position (Fischer et al., 2008). Changes in soilmoisture are reflected in the decomposition fraction and the accessible pool fraction.The probability distribution of oxygen availability was set so that completely anaerobicconditions reduce the maximum decomposition fraction to 1/7 (Freeman et al., 2001).5
Following the discussion of ECOSSE (SEERAD, 2007), we specified the probabil-ity distribution of the soil acidity effect so that decomposition fraction increases froma medium level within the aluminum-buffer pH range (acidic) to optimal within thecarbonate-buffer pH range (neutral) and decreases to low as soils become alkaline(pH > 8.5; Fig. 2d).10
Organic matter in the inaccessible C pool decomposes extremely slowly or not atall due to lack of oxygen in water-logged soils, permafrost or adsorption to soil parti-cles (Six et al., 2002). It can have a history of millennia, or, in the case of permafrost,can date back to the last interglacial period. We determined this quasi-constant poolas the fraction of SOC that is inaccessible in the top 1 m as the maximum of the15
fraction that is permanently water-logged and the fraction that is permanently frozen,plus the fraction of the remaining C protected by soil particle adsorption. We set thefraction of water-logged soil to 0.9–1.0 with 80 % probability for wetlands and to 0.0–0.1 with > 94 % probability for other land cover types (Table S4.6 in Supplement 4).The fraction of permafrost is calculated as a function of the number of days in a20
year with mean daily temperature > 0 ◦C (degree days, DD0), 1–0.02 ·√
DD0 (Anisi-mov et al., 2002). The fraction of SOC protected by particle adsorption is calculated,roughly following the SOCRATES model (Grace et al., 2006), as (0.14 ·CEC+40)/100if CEC < 100 mmol kg−1, else (0.04 ·CEC+50)/100 with a maximum of 1.
The decomposability of litter that controls the fractions of the slow and fast C pools25
depends on plant type and indirectly on vegetation type and land use (Tables S4.4 andS4.5 in Supplement 4). The classification of plant types and their association with de-composability is our interpretation of meta-analyses of leaf litter (Cornwell et al., 2008)and wood decomposition (Weedon et al., 2009). We estimated, based on studies in
372

Discussion
Pa
per|
Discussion
Pa
per|
Discussion
Paper
|D
iscussionP
aper|
many types of forests (Rodin and Bazilevich, 1967; Laiho and Prescott, 2004; Rice etal., 2004; Steinaker and Wilson, 2005), that leaf litter and fine root litter on the onehand and dead wood (above- and belowground) on the other hand contribute on aver-age equal proportions to litter input entering forest soils. About 10 % of the C allocatedto roots may be lost as easily decomposable exudates (van Hees et al., 2005). This5
is implicitly reflected in the fraction of total litter attributed to the high and very highdecomposability class and its fraction (not) going to the slow C pool (Table S4.5 inSupplement 4). The proportions of plant types within vegetation types (Table S4.2 inSupplement 4) are based on those reported in Sterling and Ducharne (2008), propor-tions of vegetation classes in the Global Land Cover Characterization (Loveland et al.,10
2000) – Global Ecosystem legend (plantations), USGS legend (tundra, wetlands), andpersonal experience for non-vascular plants.
Zonal vegetation of target conditions are linked to the reference zonal vegetation bytransition probabilities for each vegetation type (Gonzalez et al., 2010). Probability dis-tributions of target land use are contingent on reference land use, target temperature,15
and target aridity. We compared crop and pasture land use maps for 2000 and 2075 (deNoblet-Ducoudré and Peterschmitt, 2008) to calculate probabilities of changes amongland use classes for each cross-classification of reference temperature and aridity. Wemodified these probabilities and assigned probabilities for land use changes amongother classes according to a set of rules based on our experience (Table S4.3 in Sup-20
plement 4).
2.5 Calibration
The decomposition model was calibrated at the global scale (using half of the datapoints for training and the other half for validation) by systematically varying the decom-position fractions Ff and Fs in steps of 0.05. Smaller steps produced hardly perceivable25
changes to the output. We selected the combination of decomposition fractions sothat the HWSD-SOC stock classes across all pixels were predicted most often by themost probable reference SOC stock class. This resulted in maximum decomposition
373
Discussion
Paper
|D
iscussionP
aper|
Discussion
Paper
|D
iscussionP
aper|
fractions Ff = 0.75 – corresponding to a decomposition rate k = − loge(1− Ff) = 1.4 –and Fs = 0.35 (k = 0.4). Using these decomposition fractions and NPP0 (Haberl et al.,2007), the model correctly predicted 78 % of all HWSD-C stock classes (Fig. S3.6 inSupplement 3). Further details are provided in Supplement 3.
2.6 Presentation of results5
All variables in the model were associated with a frequency distribution that affected thecertainty of changes in SOC stocks. This paper focuses on the certainty of changes inSOC stocks. Therefore, we report and discuss the probability-weighted means of theirdistributions.
SOC stocks presented in this paper are averages across SOC stock classes (class10
borders: 0, 2, 5, 10, 15, 20, 30, 60, 80, 100 kg m−2) weighted by class probability.Changes in SOC stocks are expressed as half the mean of the frequency distributionof the differences between the reference and target SOC stock distributions throughoutthis paper. Using the half puts the numerical value of changes more in line with thegradual change between reference and target conditions as projected by GCM-DGVM15
combinations. We express the certainty of gains or losses as the certainty of the differ-ence between reference and target SOC stock being > 0. We call changes associatedwith a certainty P > 0.67 “fairly certain” and changes with P > 0.75 “highly certain”. 50 %certainty in this context would imply that losses and gains are equally certain. Thesecertainties are not expressions of statistical significance but represent the likelihood20
that a certain outcome (or distribution of outcomes) might be or become true given theassumptions and width of classes of the contributing variables. All reported SOC stocksfrom our simulations are standardized to the SOC stocks of the Harmonized World SoilDatabase, HWSD, as processed by Köchy et al. (2014) (Supplement 3, Fig. S3.3).
For examination of specific land use changes we examined individual pixels (Ta-25
ble S5.1, Fig. S5.1 in Supplement 5) including those used by Jones et al. (2005) andSchaphoff et al. (2006).
374

Discussion
Pa
per|
Discussion
Pa
per|
Discussion
Paper
|D
iscussionP
aper|
3 Results
3.1 Agreement of steady-state with HWSD stocks
We compared the SOC stocks for reference conditions to the SOC stocks calculatedfrom HWSD. We did not use observed time series of SOC for validation because ourstudy is aimed at assessing (un)certainties of effects and assumes constant condi-5
tions until a defined end-point. Our SOC stocks are the average of the class meanweighted by class probability. Since the ranges of SOC stocks in the higher classeswere broader than those in the lower classes (see Methods: Presentation of results),mean values tended to overestimate HWSD-SOC stocks. Almost half (47 %) of refer-ence stocks were within ±50 % of the HWSD stock; 78 % of reference stocks were10
within −50 %/+100 % of the HWSD stock. Nonetheless, absolute differences weresmall (Fig. S3.6 in Supplement 3). In more than half of all cases (53 %) the ab-solute difference was < | ±5 | kg C m−2 and in 88 % of the cases the difference was< | ±10 | kg C m−2. In our approach we use classes (i.e. ranges) of values to reflect,amongst others, uncertainty in measurements and local variation. This uncertainty af-15
fects the degree of agreement with HWSD-SOC stocks. If we had used single, weightedaverages of NPPt, fmf, accessible fraction, and toslow then 55 % of simulated C stockswould have been within ±25 % of HWSD stock and 79 % within ±50 % of HWSD C-stock (or rPearson = 0.89) with the absolute difference being < | ±2 | kg C m−2 in 55 %of all cases and < | ±5 | kg C m−2 in 89 % of all cases. The greatest sensitivity of the20
total reference SOC stock was, in decreasing order, to NPPt and NNP0, followed byvegetation zone, HWSD-SOC, and fmf (Supplement 3).
3.2 Effect of climate change on environmental factors
Climate change till the end of the century (i.e. changes in monthly temperatures andaridity) is reflected in changes of the fraction modifying factor (fmf) and the probabil-25
ities of shifts in vegetation zone and land use with secondary effects via plant type
375
Discussion
Paper
|D
iscussionP
aper|
Discussion
Paper
|D
iscussionP
aper|
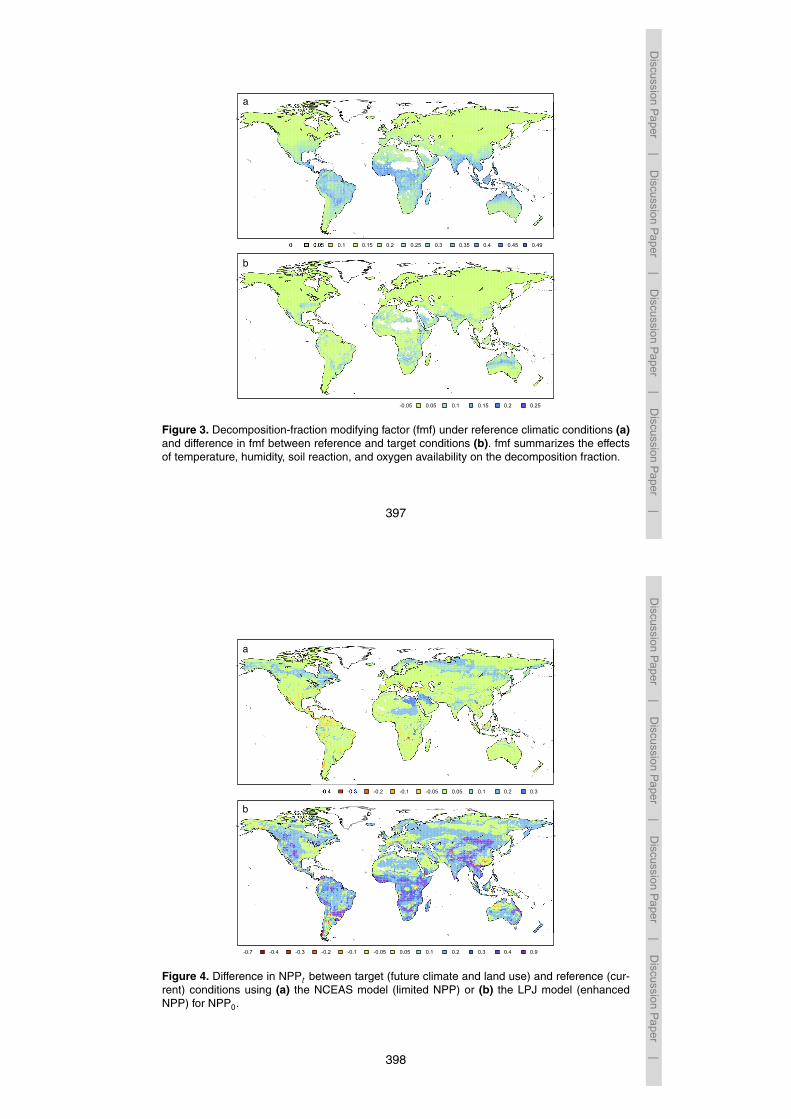
composition, decomposability, and proportion of C input going directly to the slow pool.In general, the differences in fmf between reference and target conditions were small(Fig. 3b). Strong increases were confined mostly to relatively arid tropical regions,where increases in winter precipitation were strong.
Increases in the depth of the active layer of permafrost were < 20 cm in most loca-5
tions. Increased thawing depth of 20–30 cm was projected only for the central Asianmountain ranges. Although permafrost soils were projected to thaw deeper, not allthawing regions were exposed to decomposition of more organic matter because theC was protected by high CEC.
Decomposability of litter varied between around 0.3 and 0.6 relative units, but10
changes in decomposability between reference and target conditions were compar-atively small (Supplement 4, Fig. S4.1). In the limited NPP scenario the low increaseof NPP had little effect on the plant type distribution so that changes of decompos-ability were within ±0.05 units. In the enhanced NPP scenario plant type distributionsshifted more strongly so that changes of decomposability ranged between −0.2 and15
+0.1 units. The greatest decreases (causing higher SOC stocks) occurred in tundrawhere the proportion of woody plants was projected to increase by external models.The greatest increases of decomposability occurred (1) in the southern boreal forestwhere deciduous trees replaced evergreen trees and (2) in those parts of the tropicalforests with a high probability that pristine forest is converted to cropland or perennial20
plantations.
3.3 Effect of climate and land use change on SOC stocks undercontrasting NPP scenarios
In the limited NPP scenario, NPPt changed little by the end of the century (Fig. 4a).Most notable were extensive increases in the boreal forest and scattered losses in trop-25
ical regions. Under limited NPP conditions, global SOC mass might decrease (P > 0.5)by a net mean of 21 Pg due to the effect of projected climate and land use change(Fig. 5a). At mid-latitudes (35–65◦ N) gains were greater than losses, whereas losses
376

Discussion
Pa
per|
Discussion
Pa
per|
Discussion
Paper
|D
iscussionP
aper|
were greater than gains between 30◦ N and 30◦ S. In most locations the certainty ofchanges was low (P < 0.67) (Fig. 6a). If we consider only SOC changes at a certaintylevel ≥0.75, the global change of SOC mass is 0 Pg (Fig. 5a), i.e. gains and losseswere balanced. Patches with highly certain losses occurred in high elevations of thenorthern Andes, New Guinea, and eastern central Africa. Locations with highly certain5
gains were high elevations in the southwestern USA, the highlands of southern Africa,and the central Asian mountain ranges.
In the enhanced NPP scenario, NPPt increased in almost all regions. The increaseswere greatest in the humid tropics and higher altitudes (Fig. 4b). The global SOC mass(0–1 m) might increase (P > 0.5) by a net mean of 55 Pg due to climate change, land10
use change, and CO2 fertilization (Fig. 5b). If we consider only changes at a certaintylevel ≥0.75 (Fig. 6b), the global net mean gain of SOC is 11 Pg (Fig. 5b). Regions withhighly certain losses and means of 2–10 kg m−2 were few and small, representing highelevations in the northern Andes, eastern Central Africa, and New Guinea. Highly cer-tain gains with means of 2–10 kg m−2 occurred in arid higher elevations of southeastern15
North America, southern Africa, central Asia, and scattered in other highlands.We located “hotspots” of SOC vulnerability where losses occurred across both NPP
scenarios. There was, however, little overlap across both NPP scenarios. In both NPPscenarios, SOC stocks are fairly certain to increase in northern Labrador (Canada)and the Chukotsky peninsula (most western tip of Siberia), whereas SOC stocks are20
fairly certain to decrease in parts of the mountain ranges of the northern Andes, inthe Ethiopian and eastern-central African highlands, and in the mountain range of NewGuinea (Fig. 5c). There was no discernable pattern of coincidence with current landuse. In the tropics 23 % of the 169 pixels with losses were located below 500 m altitude,19 % within 500–1000 m altitude, and 58 % within 1000–2500 m altitude, 84 % of the25
pixels were located on ridged terrain (Fig. 5c). Ten of the 23 pixels with gains in thetropics (43 %) were located at altitudes > 2500 m. Pixels outside the tropics showed nodiscernable patterns with topography.
377
Discussion
Paper
|D
iscussionP
aper|
Discussion
Paper
|D
iscussionP
aper|
3.4 Effect of climate change with enhanced NPP by vegetation zoneand by land use
In each vegetation zone the median net change of C stocks across all pixels was posi-tive (Fig. S4.3 in Supplement 4). For each vegetation zone as a whole, the direction ofnet change is uncertain due to the great environmental heterogeneity within each zone.5
Most changes between land use types across vegetation zones were similarly uncer-tain because of the great heterogeneity involved. Conversion of cropland to wetland,however, has a high certainty of C stock gains with a mean of 3 kg C m−2. Similarly,conversion of wetlands to crops is highly certain to incur losses of C with a mean of5 kg C m−2 across vegetation zones. Conversion of wetlands to pastures or plantations10
are also fairly certain to incur losses.In order to reduce the heterogeneity in the assessment, we also considered land
use changes within vegetation zones. The same patterns as reported above occurred.In addition, conversions from zonal vegetation to croplands were found to fairly cer-tainly incur losses in temperate vegetation zones and tropical forests and woodlands.15
In contrast, conversion from zonal vegetation to cropland in hot deserts is fairly certainto incur gains with a mean of 4 kg C m−2. This effect arises because the imposed landuse change assumes strong increases in C input in a region with natural low produc-tivity. Similarly, re-conversion of cropland to zonal vegetation is fairly certain to incurgains in C stocks in temperate forests and tropical deciduous and evergreen forests20
with means ranging between 2 and 3 kg C m−2. Obviously, the opposite was fairly cer-tain for hot deserts.
By inspection of individual pixels we reduced the spatial heterogeneity as far aspossible in our approach (Table S5.2 in Supplement 5). A general picture emerged.Changes with fairly or high certainty were associated with strong increases in NPPt.25
Almost all non-wetland tundra is currently not subject to land-use. Under target con-ditions, 15 % of the tundra is projected to be used as boreal forest plantations. Changesin fmf were small and increase in NPP0 balanced or overcompensated losses of thawed
378

Discussion
Pa
per|
Discussion
Pa
per|
Discussion
Paper
|D
iscussionP
aper|
fossil C. Increases in NPP0 and consequently SOC stocks were projected to be higherand gains fairly certain in alpine tundras of central Asia. In many arctic locations, SOCstocks would increase fairly certainly if the permafrost soil turned into wetlands.
Boreal regions would be increasingly used as timber plantations and probably asarable land. Timber harvesting of formerly pristine boreal forests is not likely to de-5
crease SOC stocks. Tree removal for cropping, however, reduces SOC stocks fairlycertainly in some pixels with mean losses of up to 5 kg m−2 compared to referenceconditions. Creation of wetlands in boreal forests, e.g. by thermokarst processes, wouldfairly certainly increase SOC stocks with a mean gain of 3 kg m−2.
In some pixels of temperate grasslands (steppes) in eastern Asia the projected in-10
crease in NPP was high and increase in SOC stock in grazed steppes (up to 6 kg m−2)was fairly certain. Where temperate grasslands are currently used as arable land andwere used for pasture or left to return to zonal vegetation, SOC stocks would increasewith fair or higher certainty. Conversion of cultivated steppe (perhaps former wet de-pressions, e.g., prairie potholes) to wetlands would fairly certainly increase SOC stocks15
by up to 5–6 kg m−2.SOC stocks in pixels with temperate forests also echoed the general picture that
higher inputs were associated with fairly or highly certain gains, so that conversionsto cropland or pastures often incurred losses (e.g. 5 kg C m−2) and land use changesto woody vegetation incurred fairly or highly certain gains of similar size. Pixels where20
changes in fmf were rather high for the vegetation zone showed that this was not suffi-cient for making decreases fairly certain if the increase of NPPt was not also low.
In dry tropical and subtropical regions encompassing desert, grassland, shrubland,and savanna, projected increases in productivity of zonal vegetation were high, gen-erally entailing highly certain increases in SOC stocks with means in the range of 2–25
6 kg m−2. In several shrubland pixels, zonal vegetation was projected to suffer fromstrong decreases in NPP, resulting in fairly certain decreases, especially when the landuse simultaneously changed to crops or pasture.
379
Discussion
Paper
|D
iscussionP
aper|
Discussion
Paper
|D
iscussionP
aper|
Pixels in tropical forest zones were characterized by projected changes in zonal NPPbetween −0.07 and +0.72 and increases in fmf between 0 and 0.22. In locations wherefmf increased strongly, reductions in NPP input due to land use change acerbated theloss of C from soil. Losses due to cropping were highly certain in most cases with meanlosses between 2 and 10 kg C m−2.5
4 Discussion
We assessed the certainty of changes in SOC stocks due to climate and land-usechange using a framework that explicitly considers the frequency distribution of valuesof controlling variables of decomposition processes. The greatest changes in meanSOC stocks after 75 years globally were due to absolute changes in NPP and thus C10
input to the soil. The effects of two contrasting global models of NPP on changes insoil C mass differed in sign (Fig. 5), showing the great importance of improving projec-tions of NPP, especially with respect to N limitation and CO2 fertilization. Direct climateeffects on mean decomposition fractions via temperature and moisture were great-est at the drier edge of the tropics (Fig. 3). The reason is that increased precipitation15
throughout the tropics (as projected by ensemble GCM results) had a greater effecton decomposition fractions in the drier regions than in the humid tropics. The globalpatterns of SOC stock changes in our study agree with results obtained by mechanis-tic earth system models (Todd-Brown et al., 2014) and underlines the validity of ourmodelling approach. At high latitudes the increase in temperatures were considerable,20
but the absolute effect of the increase on decomposition fractions remained small. Theslight negative effect on SOC stocks was matched or surpassed by greater input fromNPP. In warm regions, increases in temperature entailed relatively great decompositionfractions whose effects on SOC stocks were not necessarily matched by greater inputfrom NPP.25
Our results based on the limited NPP scenario (Fig. 5a) may be more likely if futureincreases of NPP are limited by nutrient availability despite CO2 fertilization (Norby et
380

Discussion
Pa
per|
Discussion
Pa
per|
Discussion
Paper
|D
iscussionP
aper|
al., 2010). The results based on enhanced NPP may become more likely if anthro-pogenic N deposition increases and alleviates nutrient limitations of growth (Hyvönenet al., 2007). The probability-weighted mean change of global SOC of 11 Pg (at alevel of 75 % certainty) in the elevated NPP scenario in our study, with considera-tion of wetlands, permafrost, and land use, corresponds to the lower end of the range5
of 15–100 Pg indicated by another study using frequency distributions for parameters(Hararuk et al., 2014) when both results are expressed as a fraction of the total SOCmass derived from the reference database used in each study (1061 and 1567 Pg).
Tropical mountain forests showed losses across both NPP scenarios and emergedas hotspots of SOC vulnerability. Most of these hotspots were characterized as zonal10
vegetation. Total modelled SOC loss in tropical hotspots (1 Pg, both NPP scenarios)comprised a small portion of the whole tropical loss (11 Pg, limited-NPP scenario; 6 Pg,enhanced-NPP scenario) on 2 % of the tropical land area.
SOC losses in identified hotspots were highly certain. Pixels with gains were lessconsistent among NPP scenarios. Only the easternmost tip of Siberia emerged as a15
hotspot of certain gains.The low certainty of SOC changes shown in this study reflects the limited certainty
of the key variables in the terrestrial C cycle and their future changes, especiallycurrent SOC stocks, NPPt, and decomposition fractions. The uncertainty is unfortu-nately greatest for the location, spatial extent, and actual stock of C-rich soils (Köchy20
et al., 2014). Our study includes only part of the uncertainty in NPP0 expressed by thevariability among different global climate models linked to different vegetation models(Schaphoff et al., 2006; Sitch et al., 2008). This uncertainty is exacerbated by the needto estimate the harvest factor for future conditions. Currently, human activity reducesglobal NPP0 by 24 % (Haberl et al., 2007). This fraction can be expected to increase25
in the future with increasing global populations. The uncertainty regarding the effectof temperature and moisture on decomposition fractions at the global scale and atlong time scales is still great (Kirschbaum, 2006). Reported large-scale correlationsbetween temperature or moisture and decomposition fractions (or rates) have been
381
Discussion
Paper
|D
iscussionP
aper|
Discussion
Paper
|D
iscussionP
aper|
suggested to be spurious due to differences in litter quality and moisture along latitudi-nal gradients (Giardina and Ryan, 2000). This view has been contested (Davidson etal., 2000). Our model framework on the one hand supports a strong positive associ-ation between litter quality and aridity across vegetation zones. On the other hand, itshows only a weak association between litter quality and mean annual temperature and5
thus latitude. At the global scale, temperature sensitivity may be lower (Q10 = 1.4–1.9,Hararuk et al., 2014; Ise and Moorcroft, 2006) than generally assumed from short-term incubation studies (Q10 ≥ 2) and that maximum decomposition occurs at greatersoil moisture than assumed in most models (Ise and Moorcroft, 2006). If temperaturesensitivity at the global scale is indeed lower than generally assumed, decomposition10
fractions in warm regions would not increase as much as projected and tropical SOCstocks would decrease less strongly.
Differences in global climate models and vegetation models cause spatial variationin projected distributions of plant types (Alo and Wang, 2008; Gonzalez et al., 2010). Inaddition, global vegetation models do not account for adaptation of species in response15
to climate change. Our sensitivity assessment showed that plant types had an overallsmall effect on decomposition fractions via litter quality. This was mostly due to the factthat the woody fraction of NPP is the strongest predictor of litter quality at the globalscale but did not change drastically in most places. The moderate sensitivity of SOCstocks to plant types suggests that our conclusions about changes of SOC stocks and20
their certainty are robust to uncertainties in the global distribution of plant types.Changes in SOC stocks after 75 years due to changes in land use were on average
small because the average probabilities of land use change per vegetation zone that weapplied to each pixel were low. This effect is also exemplified by a retrospective studywhere drastic deforestation of Amazonian forest only caused a net decrease of 0.5 %25
of C stocks across the whole study area (Holmes et al., 2006). Quantitative, spatiallyexplicit projections of the change of land use towards the end of this century requiresocio-economic models linked to vegetation models, which adds another layer of com-plexity and uncertainty. Instead, we examined different prescribed land use changes
382

Discussion
Pa
per|
Discussion
Pa
per|
Discussion
Paper
|D
iscussionP
aper|
in individual locations. For tree-dominated ecosystems SOC stocks decreased in theorder zonal > plantation > pasture > annual crops, emphasizing that C input is one ofthe most important driving variables for predicting the net rate of SOC change; thegreater the remainder after harvest, the greater the increase (or the smaller the losses).Draining wetlands is exposing SOC and was linked to considerable and highly certain5
C-losses in all vegetation zones. Our model suggests that agroforestry producing suf-ficient C input or wetland cropping (rice paddies) may be ways to conserve SOC andextract food at the same time. Our modelling results agree in trend with reviews onland use change effects in temperate and tropical regions (Don et al., 2011; Poeplauet al., 2011). In contrast, our results do not show the great increases (> 100 %) in SOC10
stocks after conversion from cropland to grassland or forest in temperate zones and ourprojected increases for land use changes in tropical regions are greater (by a factor of1.5–2) than those reported by Don et al. (2011).
The goal of our assessment of SOC stocks was to identify patterns of fairly andhighly certain changes of SOC at the global scale. The SOC stocks and their changes15
simulated by our model were within the wide range of outcomes produced by differentcombinations of global circulation models (Schaphoff et al., 2006), global vegetationmodels (Sitch et al., 2008), and different soil modules (Yurova et al., 2010) and sev-eral earth system models (Todd-Brown et al., 2014). The delicate balance betweenhigher NPP and higher decomposition rates as the main control of the gain or loss of C20
stocks that emerged from the aforementioned global studies was confirmed by our as-sessment. In addition, our study showed that the certainty for strong changes in SOCstocks is rather low.
Increasing aridity with climate change could substantially reduce SOC stocks in trop-ical peatlands (Li et al., 2007). Our framework allows attaching a probability to this.25
Assuming an SOC stock of 30 kg m−2 in evergreen tropical forest with 0.8–1.0 kg yr−1
NPP, a water table < 20 cm below ground and average annual temperature and aridity,our model projects a distribution of SOC stock with a mean of 24 kg m−2. If precipita-tion decreased so that the water table decreases to > 20 cm, the potential C loss due
383
Discussion
Paper
|D
iscussionP
aper|
Discussion
Paper
|D
iscussionP
aper|
to higher decomposition fractions would not be balanced by the higher NPP of 1.0–1.2 kg yr−1 projected for future conditions. The distribution of potential net losses has amean of 3 kg m−2, with a 68 % certainty that the losses are > 2 kg m−2.
In boreal and arctic regions we found few hotspots of vulnerability because increasesin decomposition fractions and exposed frozen soil were smaller than increases in pro-5
ductivity. Our assessment agrees with ensemble results of ten global climate models(Qian et al., 2010) incorporating CO2 fertilization of NPP. The ensemble results, how-ever, indicated that increases in NPP would level off towards the end of the 21st centurywhile C emissions would continue increasing, causing a net source in northern high lat-itudes in the following century. Loss of C stocks could be greater than simulated by our10
model because of additional heat produced by microbial activity (Khvorostyanov et al.,2008) and if permafrost thawing conforms more to Khvorostyanov et al.’s (2008) algo-rithm from a global circulation model (Poutou et al., 2004) than to the algorithm usedby us (Anisimov et al., 2002). Another study found higher C emissions in some loca-tions in the permafrost region that were not matched by increased NPP. It is however,15
unclear, if this local observation is representative for the heterogeneous thermokarstlandscape (Kuhry et al., 2010), where ponds from meltwater might limit C emissions(Moore and Knowles, 1989; Rouse et al., 1997). Spatially integrating measurementsusing eddy-flux methodology over a ca. 10 ha area in a Siberian tundra site (70◦50′ N,147◦30′ E, Parmentier et al., 2011) suggested that ecosystem C uptake would be low20
under climate warming, which is also projected by our assessment in both scenarios.The accumulation and preservation of high SOC stocks is to a large extent due to
conditions of low oxygen availability in wetlands. Existing global wetland maps showgreat heterogeneity in wetland extent and classification (Lehner and Döll, 2004; Köchyand Freibauer, 2010). For the purpose of soil C modelling, a (global) map indicating25
water table depth (and its variability) within the top 1 m may be more suitable thanthe combination of three indices, the index of O2 constraint, the “wet” moisture class,and water-table estimates per land use class, that we used in the absence of such amap. Such a map might be achievable by assimilation of remote sensing (Finn et al.,
384

Discussion
Pa
per|
Discussion
Pa
per|
Discussion
Paper
|D
iscussionP
aper|
2011) in wetland models (Fan and Miguez-Macho, 2011) and could provide the baseto incorporate effects of aridity in wetlands (Ise et al., 2008). Changes in aridity andsea level rise may create new and vast wetland areas. In arctic regions, wetland areamight increase due to thawing of permafrost soil, snowmelt, and flooding (Rouse etal., 1997). These wetland dynamics are commonly not taken into account in global C5
models. The probability tables used in our model can be a starting point for such globalmodelling activities.
5 Conclusions
Our assessment showed in a spatially explicit way the great uncertainties associatedwith potential SOC stock changes globally. Changes of SOC had a high certainty only10
in a few locations. In general, the strength of changes did not correlate with the cer-tainty of changes. Therefore, conclusions about local and global changes would differdepending on what level of certainty one accepts for accounting changes. This aspecthas been considered only via ensemble runs of models but not within models so far.Assessments of uncertainties within models could direct future research. The fertiliza-15
tion effect of CO2 on NPP in the long-term and its variation at the global scale is one ofthe major uncertainties. Global maps of current SOC stocks are derived from soil sur-veys dating as far back as the 1920s and complete information for C-rich soils comesfrom few soil profiles. Up-to-date records of up-to-date location, extent, and water tablevariation of wetlands at the global scale are incomplete. The same holds for permafrost20
and the active layer. Monitoring of these variables are crucial for decomposition mod-els, assessments of global SOC stocks, and certainty of changes.
The Supplement related to this article is available online atdoi:10.5194/soild-1-363-2014-supplement.
385
Discussion
Paper
|D
iscussionP
aper|
Discussion
Paper
|D
iscussionP
aper|
Author Contribution
M. Köchy devised the approach, designed and carried out the analyses and wrote themanuscript, discussions with A. Don, M. K. van der Molen and A. Freibauer greatly in-fluenced the parameterization of the environmental framework and design of the anal-ysis, A. Freibauer suggested the topic.5
Acknowledgements. We thank Wang et al. (2006), Gonzalez et al. (2010), Sterling andDucharne (2008), Haberl et al. (2007), Lehner and Döll (2004), and Paul et al. (2002) for pub-lishing or sharing their data.
ClimateWizard: We acknowledge the modeling groups, the Program for Climate Model Diag-nosis and Intercomparison? (PCMDI) and the WCRP’s Working Group on Coupled Modelling10
(WGCM) for their roles in making available the WCRP CMIP3 multi-model dataset. Supportof this dataset is provided by the Office of Science, US Department of Energy. ClimateWiz-ard was developed by Chris Zganjar (The Nature Conservancy, USA), Evan Girvetz (Universityof Washington), and George Raber (The University of Southern Mississippi). CCSM3 – Thesource of this material is the University Corporation for Atmospheric Research (UCAR); © 200215
University Corporation for Atmospheric Research; all Rights Reserved.LPJ: Data provided by Thomas Hickler, BIK-F, Frankfurt, Germany.The authors of this paper were partially funded by EU FP7 projects COCOS (grant 212196),
ICOS (grant 211574), GHG Europe (grant 244122), and BMELV/BMBF project FACCE MAC-SUR (031A103A). FACCE MACSUR – Modelling European Agriculture with Climate Change20
for Food Security is an international research project and a FACCE JPI knowledge hub. Thefunding agencies were not involved in study design, in the collection, analysis and interpretationof data, in the writing of the report, or in the decision to submit the article for publication.
386

Discussion
Pa
per|
Discussion
Pa
per|
Discussion
Paper
|D
iscussionP
aper|
References
Allison, S. D., Wallenstein, M. D., and Bradford, M. A.: Soil-carbon response to warming depen-dent on microbial physiology, Nat. Geosci., 3, 336–340, doi:10.1038/ngeo846, 2010.
Alo, C. A. and Wang, G.: Potential future changes of the terrestrial ecosystem based onclimate projections by eight general circulation models, J. Geophys. Res., 113, G01004,5
doi:10.1029/2007JG000528, 2008.Anisimov, O. A., Shiklomanov, N. I., and Nelson, F. E.: Variability of seasonal thaw depth
in permafrost regions: a stochastic modeling approach, Ecol. Model., 153, 217–227,doi:10.1016/S0304-3800(02)00016-9, 2002.
Armentano, T. V. and Mengeo, E. S.: Patterns of change in the carbon balance of organic10
soil-wetlands of the temperate zone, J. Ecol., 74, 755–774, 1985.Brovkin, V., Boysen, L., Arora, V. K., Boisier, J. P., Cadule, P., Chini, L., Claussen, M., Friedling-
stein, P., Gayler, V., van den Hurk, B. J. J. M., Hurtt, G. C., Jones, C. D., Kato, E., de Noblet-Ducoudré, N., Pacifico, F., Pongratz, J., and Weiss, M.: Effect of anthropogenic land-useand land-cover changes on climate and land carbon storage in CMIP5 projections for the15
twenty-first century, J. Climate, 26, 6859–6881, doi:10.1175/JCLI-D-12-00623.1, 2013.Coleman, K. and Jenkins, D. S.: RothC-26.3. A model for the turnover of carbon in soil,
Model description and users guide, IACR Rothamsted, Harpenden (United Kingdom), IACRRothamsted, 1999.
Cornwell, W. K., Cornelissen, J. H. C., Amatangelo, K., Dorrepaal, E., Eviner, V. T., Godoy, O.,20
Hobbie, S. E., Hoorens, B., Kurokawa, H., Pérez-Harguindeguy, N., Quested, H. M., Santi-ago, L. S., Wardle, D. A., Wright, I. J., Aerts, R., Allison, S. D., Bodegom, P. v., Brovkin, V.,Chatain, A., Callaghan, T. V., Sandra Díaz, G., Eric, Gurvich, D. E., Kazakou, E., Klein, J. A.,Read, J., Reich, P. B., Soudzilovskaia, N. A., Vaieretti, M. V., and Westoby, M.: Plant speciestraits are the predominant control on litter decomposition rates within biomes worldwide,25
Ecol. Lett., 11, 1065–1071, doi:10.1111/j.1461-0248.2008.01219.x, 2008.Davidson, E. A. and Janssens, I. A.: Temperature sensitivity of soil carbon decomposition and
feedbacks to climate change, Nature, 440, 165–173, doi:10.1038/nature04514, 2006.Davidson, E. A., Trumbore, S. E., and Amundson, R.: Biogeochemistry – Soil warming and
organic carbon content, Nature, 408, 789–790, doi:10.1038/35048672, 2000.30
387
Discussion
Paper
|D
iscussionP
aper|
Discussion
Paper
|D
iscussionP
aper|
Del Grosso, S., Parton, W., Stohlgren, T., Zheng, D., Bachelet, D., Prince, S., Hibbard, K., andOlson, R.: Global potential net primary production predicted from vegetation class, precipita-tion, and temperature, Ecology, 89, 2117–2126, doi:10.1890/07-0850.1, 2008.
de Noblet-Ducoudré, N. and Peterschmitt, J.-Y.: Designing historical and future land-covermaps at the global scale for climate studies, ENSEMBLES, available at: http://www.cnrm.5
meteo.fr/ensembles/public/data/LandUseMaps_Informations.pdf (last access: 28 July 2009),2008.
Don, A., Schumann, J., and Freibauer, A.: Impact of tropical land use change on soil organiccarbon stocks – a meta analysis, Glob. Change Biol., 17, 1658–1670, doi:10.1111/j.1365-2486.2010.02336.x, 2011.10
Fan, Y. and Miguez-Macho, G.: A simple hydrologic framework for simulating wetlands in cli-mate and earth system models, Clim. Dynam., 37, 253–278, doi:10.1007/s00382-010-0829-8, 2011.
Finn, M., Lewis, M., Bosch, D., Giraldo, M., Yamamoto, K., Sullivan, D., Kincaid, R., Luna,R., Allam, G., Kvien, C., and Williams, M.: Remote sensing of soil moisture using airborne15
hyperspectral data, GISci. Remote Sens., 48, 522–540, doi:10.2747/1548-1603.48.4.522,2011.
Fischer, G., Nachtergaele, F., Prieler, S., van Velthuizen, H. T., Verelst, L., and Wiberg, D.:Global agro-ecological zones assessment for agriculture (GAEZ 2008), IIASA, Laxenburg,Austria and FAO, Rome, Italy, IIASA, Laxenburg, Austria and FAO, Rome, Italy, available at:20
http://www.iiasa.ac.at/Research/LUC/External-World-soil-database/HTML/SoilQualityData.html?sb=11, 2008.
Freeman, C., Ostle, N., and Kang, H.: An enzymic “latch” on a global carbon store, Nature, 409,149, doi:10.1038/35051650, 2001.
Gedalof, Z. and Berg, A. A.: Tree ring evidence for limited direct CO2 fertilization of forests over25
the 20th century, Glob. Biogeochem. Cy., 24, GB3027, doi:10.1029/2009GB003699, 2010.Gerten, D., Schaphoff, S., Haberlandt, U., Lucht, W., and Sitch, S.: Terrestrial vegetation and
water balance – hydrological evaluation of a dynamic global vegetation model, J. Hydrol.,286, 249–270, doi:10.1016/j.jhydrol.2003.09.029, 2004.
Giardina, C. P. and Ryan, M. G.: Evidence that decomposition rates of organic carbon in mineral30
soil do not vary with temperature, Nature, 404, 858–861, doi:10.1038/35009076, 2000.
388

Discussion
Pa
per|
Discussion
Pa
per|
Discussion
Paper
|D
iscussionP
aper|
Gonzalez, P., Neilson, R. P., Lenihan, J. M., and Drapek, R. J.: Global patterns in the vulnera-bility of ecosystems to vegetation shifts due to climate change, Global Ecol. Biogeogr., 19,755–768, doi:10.1111/j.1466-8238.2010.00558.x, 2010.
Grace, P. R., Ladd, J. N., Robertson, G. P., and Gage, S. H.: SOCRATES – A simple modelfor predicting long-term changes in soil organic carbon in terrestrial ecosystems, Soil Biol.5
Biochem., 38, 1172–1176, doi:10.1016/j.soilbio.2005.09.013, 2006.Grosse, G., Harden, J., Turetsky, M., McGuire, A. D., Camill, P., Tarnocai, C., Frolking, S.,
Schuur, E. A. G., Jorgenson, T., Marchenko, S., Romanovsky, V., Wickland, K., P., French,N., Waldrop, M., Bourgeau-Chavez, L., and Striegl, R. G.: Vulnerability of high-latitude soilorganic carbon in North America to disturbance, J. Geophys. Res.-Biogeosci., 116, G00K06,10
doi:10.1029/2010JG001507, 2011.Haberl, H., Erb, K. H., Krausmann, F., Gaube, V., Bondeau, A., Plutzar, C., Gingrich, S., Lucht,
W., and Fischer-Kowalski, M.: Quantifying and mapping the human appropriation of netprimary production in earth’s terrestrial ecosystems, P. Natl. Acad. Sci. USA, 104, 12942–12947, doi:10.1073/pnas.0704243104, 2007.15
Hararuk, O., Xia, J., and Luo, Y.: Evaluation and improvement of a global land model againstsoil carbon data using a Bayesian Markov chain Monte Carlo method, J. Geophys. Res.-Biogeosci., 119, 403–417, doi:10.1002/2013JG002535, 2014.
Holmes, K. W., Chadwick, O. A., Kyriakidis, P. C., daSilva, F., Eliomar, P., Soares, J.V., and Roberts, D. A.: Large-area spatially explicit estimates of tropical soil car-20
bon stocks and response to land-cover change, Glob. Biogeochem. Cy., 20, GB3004,doi:10.1029/2005GB002507, 2006.
Hyvönen, R., Ågren, G. I., Linder, S., Persson, T., Cotrufo, M. F., Ekblad, A., Freeman, M.,Grelle, A., Janssens, I. A., Jarvis, P. G., Kellomäki, S., Lindroth, A., Loustau, D., Lundmark,T., Norby, R. J., Oren, R., Pilegaard, K., Ryan, M. G., Sigurdsson, B. D., Strömgren, M.,25
van Oijen, M., and Wallin, G.: The likely impact of elevated [CO2], nitrogen deposition,increased temperature and management on carbon sequestration in temperate and bo-real forest ecosystems: a literature review, New Phytol., 173, 463–480, doi:10.1111/j.1469-8137.2007.01967.x, 2007.
IPCC (Intergovernmental Panel on Climate Change): Emission scenarios. Summary for policy-30
makers. A special report of the IPCC Working Group III, IPCC, Geneva, Switzerland, 2000.
389
Discussion
Paper
|D
iscussionP
aper|
Discussion
Paper
|D
iscussionP
aper|
Ise, T. and Moorcroft, P. R.: The global scale temperature and moisture dependencies of soilorganic carbon decomposition: an analysis using a mechanistic decomposition model, Bio-geochemistry, 80, 217–231, doi:10.1007/s10533-006-9019-5, 2006.
Ise, T., Dunn, A. L., Wofsy, S. C., and Moorcroft, P. R.: High sensitivity of peat de-composition to climate change through water-table feedback, Nat. Geosci., 1, 763–766,5
doi:10.1038/ngeo331, 2008.Jones, C., McConnell, C., Coleman, K., Cox, P., Falloon, P., Jenkinson, D., and Powlson, D.:
Global climate change and soil carbon stocks; predictions from two contrasting models forthe turnover of organic carbon in soil, Glob. Change Biol., 11, 154–166, doi:10.1111/j.1365-2486.2004.00885.x, 2005.10
Khvorostyanov, D. V., Ciais, P., Krinner, G., Zimov, S. A., Corradi, C., and Guggenberger, G.:Vulnerability of permafrost carbon to global warming. Part II: sensitivity of permafrost car-bon stock to global warming, Tellus B, 60, 265–275, doi:10.1111/j.1600-0889.2007.00336.x,2008.
Kirschbaum, M. U. F.: The temperature dependece of organic-matter decompostion – still15
a topic of debate, Soil Biol. Biochem., 38, 2510–2518, doi:10.1016/j.soilbio.2006.01.030,2006.
Köchy, M. and Freibauer, A.: Global spatial distribution of wetlands, COCOS Report,D4.3a, Johann Heinrich von Thünen-Institut, Braunschweig, Germany, Johann Heinrichvon Thünen-Institut, available at: http://www.cocos-carbon.org/documents.html (last access:20
11 July 2011), 2009.Köchy, M., Hiederer, R., and Freibauer, A.: Global distribution of soil organic carbon, based on
the Harmonized World Soil Database – Part 1: Masses and frequency distribution of SOCstocks for the tropics, permafrost regions, wetlands, and the world, SOIL Discuss., 1, 327–362, doi:10.5194/soild-1-327-2014, 2014.25
Kuhry, P., Dorrepaal, E., Hugelius, G., Schuur, E. A. G., and Tarnocai, C.: Potential remobiliza-tion of belowground permafrost carbon under future global warming, Permafrost Periglac.,21, 208–214, doi:10.1002/ppp.684, 2010.
Laiho, R. and Prescott, C. E.: Decay and nutrient dynamics of coarse woody debris in north-ern coniferous forests: a synthesis, Can. J. Forest Res., 34, 763–777, doi:10.1139/X03-241,30
2004.Lehner, B. and Döll, P.: Development and validation of a global database of lakes, reservoirs
and wetlands, J. Hydrol., 296, 1–22, doi:10.1016/j.jhydrol.2004.03.028, 2004.
390

Discussion
Pa
per|
Discussion
Pa
per|
Discussion
Paper
|D
iscussionP
aper|
Li, W. H., Dickinson, R. E., Fu, R., Niu, G. Y., Yang, Z. L., and Canadell, J. G.: Future precipita-tion changes and their implications for tropical peatlands, Geophys. Res. Lett., 34, L01403,doi:10.1029/2006GL028364, 2007.
Loveland, T. R., Reed, B. C., Brown, J. F., Ohlen, D. O., Zhu, J., Yang, L., and Merchant, J. W.:Development of a Global Land Cover Characteristics Database and IGBP DISCover from5
1-km AVHRR Data, Int. J. Remote Sens., 21, 1303–1330, doi:10.1080/014311600210191,2000.
Mitra, S., Wassmann, R., and Vlek, P.: An appraisal of global wetland area and its organiccarbon stock, Curr. Sci., 88, 25–35, 2005.
Moore, T. R. and Knowles, R.: The influence of water table levels on methane and carbon10
dioxide emissions from peatland soils, Can. J. Soil Sci., 69, 33–38, doi:10.4141/cjss89-004,1989.
Norby, R. J., Warren, J. M., Iversen, C. M., Medlyn, B. E., and McMurtrie, R. E.: CO2 enhance-ment of forest productivity constrained by limited nitrogen availability, P. Natl. Acad. Sci. USA,107, 19368–19373, doi:10.1073/pnas.1006463107, 2010.15
Parmentier, F. J. W., van der Molen, M. K., van Huissteden, J., Karsanaev, S. A., Kononov, A. V.,Suzdalov, D. A., Maximov, T. C., and Dolman, A. J.: Longer growing seasons do not increasenet carbon uptake in the northeastern Siberian tundra, J. Geophys. Res., 116, G04013,doi:10.1029/2011JG001653, 2011.
Paul, K.: Temperature and moisture effects on decomposition, in: Net ecosystem exchange:20
workshop proceedings, edited by: Kirschbaum, M. U. F. and Mueller, R., CRC for GreenhouseAccounting, Canberra, 95–102, 2001.
Paul, K. I., Polglase, P. J., O’Connell, A. M. O., Carlyle, J. C., Smethurst, P. J., and Khanna, P.K.: Soil nitrogen availability predictor (SNAP): a simple model for predicting mineralisation ofnitrogen in forest soils, Aust. J. Soil Res., 40, 1011–1026, doi:10.1071/SR01114, 2002.25
Poeplau, C., Don, A., Vesterdal, L., Leifeld, J., van Wesemael, B., Schumacher, J., and Gensior,A.: Temporal dynamics of soil organic carbon after land-use change in the temperate zone– carbon response functions as a model approach, Glob. Change Biol., 17, 2415–2427,doi:10.1111/j.1365-2486.2011.02408.x, 2011.
Poutou, E., Krinner, G., Genthon, C., and de Noblet-Ducoudré, N.: Role of soil freezing in future30
boreal climate change, Clim. Dynam., 23, 621–639, doi:10.1007/s00382-004-0459-0, 2004.
391
Discussion
Paper
|D
iscussionP
aper|
Discussion
Paper
|D
iscussionP
aper|
Power, S. B., Delage, F., Colman, R., and Moise, A.: Consensus on twenty-first-century rain-fall projections in climate models more widespread than previously thought, J. Climate, 25,3792–3809, doi:10.1175/JCLI-D-11-00354.1, 2011.
Prentice, I. C., Farquhar, G. D., Fasham, M. J. R., Goulden, M. L., Heimann, M., Jaramillo, V. J.,Kheshgi, H. S., Le Quéré, C., Scholes, R. J., and Wallace, D. W. R.: The Carbon Cycle and5
Atmospheric Carbon Dioxide, in: Climate Change 2001: The Scientific Basis. Contribution ofWorking Group I to the Third Assessment Report of the Intergovernmental Panel on ClimateChange, edited by: Houghton, J. T., Ding, Y., Griggs, D. J., Noguer, M., van der Linden, P.J., Dai, X., Maskell, K., and Johnson, C. A., Cambridge University Press, Cambridge, UnitedKingdom, 2001.10
Probert, M. E., Black, A. S., and Conyers, M. K.: APSIM’s water and nitrogen modules andsimulation of the dynamics of water and nitrogen in fallow systems, Agr. Syst., 56, 1–28,doi:10.1016/S0308-521X(97)00028-0, 1998.
Qian, H. F., Joseph, R., and Zeng, N.: Enhanced terrestrial carbon uptake in the NorthernHigh Latitudes in the 21st century from the Coupled Carbon Cycle Climate Model Inter-15
comparison Project model projections, Glob. Change Biol., 16, 641–656, doi:10.1111/j.1365-2486.2009.01989.x, 2010.
Reeburgh, W. S.: Figures summerizing the global cycles of biogeochemically important ele-ments, Bull. Ecol. Soc. Am., 78, 260–267, 1997.
Rice, A. H., Pyle, E. H., Saleska, S. R., Hutyra, L., Palace, M., Keller, M., de Camargo, P. B.,20
Portilho, K., Marques, D. F., and Wofsy, S. C.: Carbon balance and vegetation dynamics inan old-growth Amazonian forest, Ecol. Appl., 14, S55–S71, doi:10.1890/02-6006, 2004.
Rodin, L. E. and Bazilevich, N. I.: Production and mineral cycling in terrestrial vegetations,edited by: Fogg, G. E., Oliver & Boyd, London, 1967.
Rouse, W. R., Douglas, M. S. V., Hecky, R. E., Hershey, A. E., Kling, G. W., Lesack, L., Marsh,25
P., McDonald, M., Nicholson, B. J., Roulet, N. T., and Smol, J. P.: Effects of climate changeon the freshwaters of arctic and subarctic North America, Hydrol. Process., 11, 873–902,1997.
Schaphoff, S., Lucht, W., Gerten, D., Sitch, S., Cramer, W., and Prentice, I. C.: Terrestrial bio-sphere carbon storage under alternative climate projections, Climatic Change, 74, 97–122,30
doi:10.1007/s10584-005-9002-5, 2006.SEERAD, Scottish Executive Environment and Rural Affairs Department: ECOSSE – Estimat-
ing carbon in organic soils, sequestration and emission, Edinburgh, vi+165, 2007.
392

Discussion
Pa
per|
Discussion
Pa
per|
Discussion
Paper
|D
iscussionP
aper|
Sitch, S., Smith, B., Prentice, I. C., Arneth, A., Bondeau, A., Cramer, W., Kaplan, J. O., Levis,S., Lucht, W., and Sykes, M. T.: Evaluation of ecosystem dynamics, plant geography andterrestrial carbon cycling in the LPJ dynamic global vegetation model, Glob. Change Biol., 9,161–185, doi:10.1046/j.1365-2486.2003.00569.x, 2003.
Sitch, S., Huntingford, C., Gedney, N., Levy, P. E., Lomas, M., Piao, S. L., Betts, R., Ciais,5
P., Cox, P., Friedlingstein, P., Jones, C. D., Prentice, I. C., and Woodward, F. I.: Evaluationof the terrestrial carbon cycle, future plant geography and climate-carbon cycle feedbacksusing five Dynamic Global Vegetation Models (DGVMs), Glob. Change Biol., 14, 2015–2039,doi:10.1111/gcb.2008.14.issue-9, 2008.
Six, J., Conant, R. T., Paul, E. A., and Paustian, K.: Stabilization mechanisms of10
soil organic matter: Implications for C-saturation of soils, Plant Soil, 241, 155–176,doi:10.1023/A:1016125726789, 2002.
Smith, J., Gottschalk, P., Bellarby, J., Chapman, S., Lilly, A., Towers, W., Bell, J., Coleman, K.,Nayak, D., Richards, M., Hillier, J., Flynn, H., Wattenbach, M., Aitkenhead, M., Yeluripati,J., Farmer, J., Milne, R., Thomson, A., Evans, C., Whitmore, A., Falloon, P., and Smith, P.:15
Estimating changes in Scottish soil carbon stocks using ECOSSE. II. Application, Clim. Res.,45, 193–205, doi:10.3354/cr00902, 2010.
Smith, P., Fang, C. M., Dawson, J. J. C., and Moncrieff, J. B.: Impact of global warming on soilorganic carbon, Adv. Agron., 97, 1–43, doi:10.1016/S0065-2113(07)00001-6, 2008.
Spiegelhalter, D. J., Dawid, A. P., Lauritzen, S. L., and Cowell, R. G.: Bayesian analysis in expert20
systems, Stat. Sci., 8, 219–283, doi:10.1214/ss/1177010888, 1993.Steinaker, D. F. and Wilson, S. D.: Belowground litter contributions to nitrogen cycling at a
northern grassland–forest boundary, Ecology, 86, 2825–2833, doi:10.1890/04-0893, 2005.Sterling, S. and Ducharne, A.: Comprehensive data set of global land cover change for land sur-
face model applications, Glob. Biogeochem. Cy., 22, GB3017, doi:10.1029/2007GB002959,25
2008.Todd-Brown, K. E. O., Randerson, J. T., Hopkins, F., Arora, V., Hajima, T., Jones, C., Shevli-
akova, E., Tjiputra, J., Volodin, E., Wu, T., Zhang, Q., and Allison, S. D.: Changes in soilorganic carbon storage predicted by Earth system models during the 21st century, Biogeo-sciences, 11, 2341–2356, doi:10.5194/bg-11-2341-2014, 2014.30
van Hees, P. A. W., Jones, D. L., Finlay, R., Godbold, D. L., and Lundström, U. S.: The carbon wedo not see – the impact of low molecular weight compounds on carbon dynamics and respira-
393
Discussion
Paper
|D
iscussionP
aper|
Discussion
Paper
|D
iscussionP
aper|
tion in forest soils: a review, Soil Biol. Biochem., 37, 1–13, doi:10.1016/j.soilbio.2004.06.010,2005.
Vesterdal, L. and Leifeld, J.: Land-use change and management effects on soil carbon seques-tration: forestry and agriculture, in: Greenhouse-gas budget of soils under changing climateand land use (BurnOut) ·COST 639, edited by: Jandl, R. and Olsson, M., Vienna, 25–32,5
2007.Walter, H. and Lieth, H.: Klimadiagramm-Weltatlas, Fischer, Jena, 1967.Weedon, J. T., Cornwell, W. K., Cornelissen, J. H. C., Zanne, A. E., Wirth, C., and Coomes, D.
A.: Global meta-analysis of wood decomposition rates: a role for trait variation among treespecies?, Ecol. Lett., 12, 45–56, doi:10.1111/j.1461-0248.2008.01259.x, 2009.10
Yurova, A. Y., Volodin, E. M., Ågren, G. I., Chertov, O. G., and Komarov, A. S.: Effects of vari-ations in simulated changes in soil carbon contents and dynamics on future climate projec-tions, Glob. Change Biol., 16, 823–835, doi:10.1111/j.1365-2486.2009.01992.x, 2010.
394

Discussion
Pa
per|
Discussion
Pa
per|
Discussion
Paper
|D
iscussionP
aper|
Figure 1. Network design. fmf: decomposition fraction modifying factor, F : decomposition frac-tion. Boxes with thick edges indicate directly supplied information. Boxes with dashed edges(on the target side) indicate values copied from the reference side. Shaded boxes indicatedependent variables.
395
Discussion
Paper
|D
iscussionP
aper|
Discussion
Paper
|D
iscussionP
aper|
32
1
Fig. 2. Probability distribution of four fraction-modifying factors (fmf). Box width within each 2
class of decomposition fraction controlling variable (x-axis) is proportional to probability of 3
the class of the fraction modifying factor. O2 constraint labels: no, moderate, severe, very 4
severe, rock or bare, permafrost, wetland. Note that the y-axes are not linear. 5
Figure 2. Probability distribution of four fraction-modifying factors (fmf). Box width within eachclass of decomposition fraction controlling variable (x axis) is proportional to probability of theclass of the fraction modifying factor. O2 constraint labels: no, moderate, severe, very severe,rock or bare, permafrost, wetland. Note that the y axes are not linear.
396
Discussion
Pa
per|
Discussion
Pa
per|
Discussion
Paper
|D
iscussionP
aper|
33
1
Fig. 3. Decomposition-fraction modifying factor (fmf) under reference climatic conditions (a) 2
and difference in fmf between reference and target conditions (b). fmf summarizes the effects 3
of temperature, humidity, soil reaction, and oxygen availability on the decomposition fraction. 4
0 0.05 0.1 0.15 0.2 0.25 0.3 0.35 0.4 0.45 0.49
-0.05 0.05 0.1 0.15 0.2 0.25
a
b
Figure 3. Decomposition-fraction modifying factor (fmf) under reference climatic conditions (a)and difference in fmf between reference and target conditions (b). fmf summarizes the effectsof temperature, humidity, soil reaction, and oxygen availability on the decomposition fraction.
397
Discussion
Paper
|D
iscussionP
aper|
Discussion
Paper
|D
iscussionP
aper|
34
1
Fig. 4. Difference in NPPt between target (future climate and land use) and reference (current) 2
conditions using a) the NCEAS model (limited NPP) or b) the LPJ model (enhanced NPP) for 3
NPP0. 4
-0.4 -0.3 -0.2 -0.1 -0.05 0.05 0.1 0.2 0.3
-0.7 -0.4 -0.3 -0.2 -0.1 -0.05 0.05 0.1 0.2 0.3 0.4 0.9
a
b
Figure 4. Difference in NPPt between target (future climate and land use) and reference (cur-rent) conditions using (a) the NCEAS model (limited NPP) or (b) the LPJ model (enhancedNPP) for NPP0.
398

Discussion
Pa
per|
Discussion
Pa
per|
Discussion
Paper
|D
iscussionP
aper|
Figure 5. Changes of soil organic carbon stocks and masses using (a) limited NPP and (b) en-hanced NPP. (c) consensus: locations where changes ≥ |1 kg m−2 | in both scenarios, overlaidon topography.
399
Discussion
Paper
|D
iscussionP
aper|
Discussion
Paper
|D
iscussionP
aper|
36
F 1
Fig. 6. Certainty of changes of SOC stocks using (a) limited NPP and (b) enhanced NPP and 2
(c) consensus: locations where certainties of both scenarios are > 0.66 (Plimited > 0.66 & 3
Penhanced > 0.66). 4
0.11 0.25 0.33 0.67 0.750.89 0.75 0.67 0.33 0.25
gainloss
0.09 0.1 0.25 0.33 0.67 0.75 0.9 0.970.91 0.9 0.75 0.67 0.33 0.25 0.1 0.03
gainloss
-1 -0.66 0.66 1
a
b
c
certainty
P | loss � 0.66 P | gain � 0.66
certainty
Figure 6. Certainty of changes of SOC stocks using (a) limited NPP and (b) enhanced NPPand (c) consensus: locations where certainties of both scenarios are > 0.66 (Plimited > 0.66 andPenhanced > 0.66).
400