outline
DESCRIPTION
Individual and contextual factors contributing in geographical variations in risk-behaviour among young adults in Norway. Sveinung Eiksund Research fellow, Department of Geography, NTNU Trondheim Presentation at the SRA-E 15th Annual Conference - PowerPoint PPT PresentationTRANSCRIPT

1
Individual and contextual factors contributing in geographical variations in risk-behaviour among young adults in Norway.
Sveinung EiksundResearch fellow, Department of Geography, NTNU Trondheim
Presentation at the SRA-E 15th Annual Conference ‘Innovation and Technical Progress: Benefit without Risk?’
Ljubljana, Slovenia. 11th – 13th September 2006

2
Outline
• Background and objectives• Traffic accident risk• Traffic accident patterns in Norway• Research methods• Results• Conclusions

3
Background
• Traffic risk is an important health risk
• Increased leisure time motorization, a consequence of wealth in an affluent society
• Strong focus on risk-reducing strategies in Norway
• Risit: Part of a extensive research programme on risk and safety in transport financed by the Norwegian Research Council
• Objective of this study:– describe differences in risk-culture affecting behaviour in traffic– approach high risk groups more efficient with risk reducing measures

4
Traffic accident risk• Causes and risk factors
• Explanations to differences in risk can be related to:– Physical-geographical– Socio-economical– Socio-cultural
• Road traffic accident risk can be divided into– System risk related to physical environment, the
vehicles and the road systems (underlying risk)– Risk related to perceptions, behaviour and attitudes
(culture)
• Risk-taking behaviour as risk-factors

5
Norway

6
Map 1:
Average rate for the period 1998 – 2004.
7
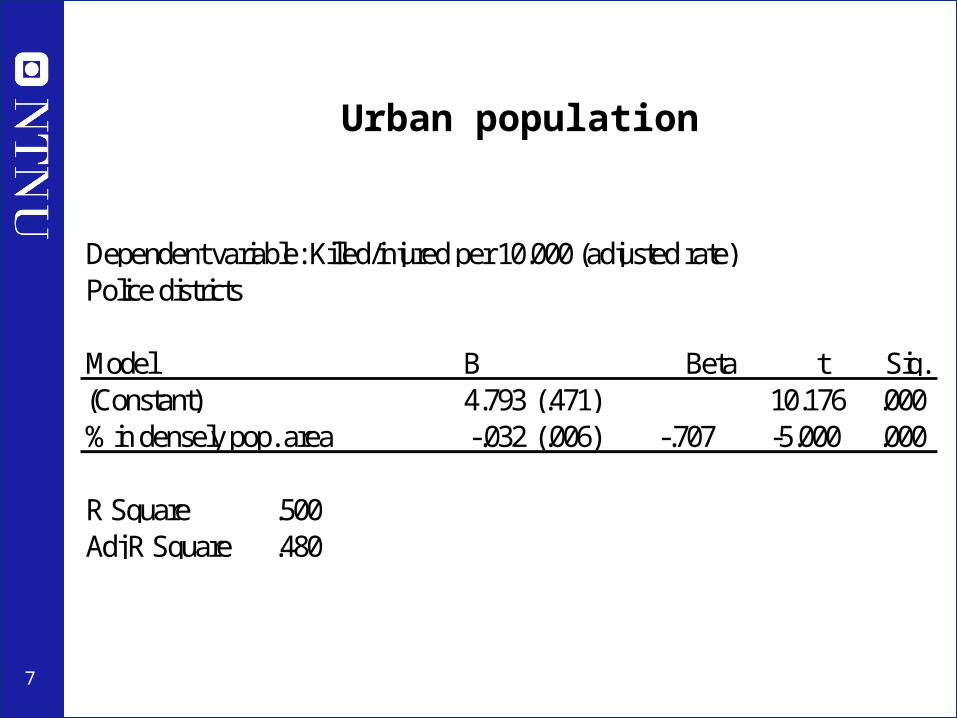
Dependent variable: Killed/injured per 10.000 (adjusted rate)Police districts
Model B Beta t Sig.(Constant) 4.793 (.471) 10.176 .000% in densely pop. area -.032 (.006) -.707 -5.000 .000
R Square .500Adj R Square .480
Urban population

8
Map 2:
Average rate for the period 1998 – 2004.

9
Road traffic and young people
• Many studies have shown highest rates for killed and serious injured in rural areas especially for young adults
• Higher rates in rural areas can relate to– Longer distances and higher speed limits– Less access to public transport– Driving as leisure time activity
• Higher rates for young people in general can be related to– Less experience / more mistakes– Higher risk tolerance and sensation seeking – Attitudes– Risk behaviour and peers risk behaviour

10
Road traffic and young people
• Many studies have shown highest rates for killed and serious injured in rural areas especially for young adults
• Higher rates in rural areas can relate to– Longer distances and higher speed limits– Less access to public transport– Driving as leisure time activity
• Higher rates for young people in general can be related to– Less experience / more mistakes– Higher risk tolerance and sensation seeking – Attitudes– Risk behaviour and peers risk behaviour

11
Research methods
• Questionnaire survey from 2004 among young adults aged 19-24 from (N=677) – 7 municipalities (predefined as 2 urban, 3 peri-urban, 2 rural)– Response rate 47 %
• Regression models– Dependent variables
• Self-reported speeding violations• Self-reported non-use of seat belts
– Control variables• Age, Sex, Education
– Independent variables• Attitudes (towards speeding and traffic rules and risk taking)• Behaviour in peer group (friends “accident history”)• Driving as a leisure time activity

12
Self-reported speeding violations
• Answered by 477 respondents (with drivers licence)• Measured with 4 specific questions on a scale 1 (never) – 5 (very often)• Average scores calculated for each individual
• Geographical gradient
AREA N Mean (Std)
Urban 147 2.5 (0.82)
Peri-urban 275 2.6 (0.78)
Rural 55 2.9 (0.91)

13
Self-reported speeding violations
Linear Regression Beta Sig.Peri-urban .094 .060Rural .181 .000 *** Adj. R Square .023(Constant) .000

14
Self-reported speeding violations
Linear Regression Beta Sig.Peri-urban .075 .114Rural .128 .007 **Age .100 .039 *Sex (male) .273 .000 ***Eduaction (primary) .088 .141Education (vocational) .227 .001 *** Adj. R Square .137Education (preperatory) .100 .149(Constant) .053

15
Self-reported speeding violations
Linear Regression Beta Sig.Peri-urban .075 .045 *Rural .083 .032 *Age .058 .134Sex (male) .161 .000 ***Education (primary) .048 .312Education (vocational) .087 .117Education (preperatory) .050 .367Attitude .541 .000 *** Adj. R Square .465Peer accidents .135 .000 ***Driving as leisure .099 .006 **(Constant) .398

16
Self-reported non-use of seat belts
• Answered by 505 respondents• Measured with 2 specific questions on a scale 1 (never) – 5 (very often)• Average scores calculated for each individual
• Geographical gradient
• Skewed distribution in dependent variable: Dichotomized
AREA N Mean (Std)
Urban 155 1.2 (0.54)
Peri-urban 290 1.5 (0.91)
Rural 60 2.0 (1.16)

17
Self-reported non-use of seat beltsLogistic Regression OR 95 % C.I.Urban 1,00 -2 Log likelih. 721,1Peri-urban 2,02 (1,33-3,06) Cox & Snell R2 .046Rural 4,61 (2,58-8,24) Nagelkerke R2 .065

18
Self-reported non-use of seat beltsLogistic Regression OR 95 % C.I.Urban 1,00Peri-urban 1,93 (1,25-2,96)Rural 3,78 (2,07-6,91)Female 1,00Male 2,57 (1,77-3,75)Education (university) 1,00 -2 Log likelih. 677,8Education (primary) 1,26 (0,58-2,72) Cox & Snell R2 .109Education (vocational) 2,01 (1,06-3,79) Nagelkerke R2 .154Education (preparatory) 1,12 (0,60-2,11)

19
Self-reported non-use of seat beltsLogistic Regression OR 95 % C.I.Urban 1,00Peri-urban 1,81 (1,16-2,84)Rural 3,11 (1,66-5,82)Female 1,00Male 2,17 (1,44-3,28)Education (university) 1,00Education (primary) 0,95 (0,42-2,13)Education (vocational) 1,29 (0,65-2,57)Education (preparatory) 0,87 (0,45-1,68)Attitude (continuos) 1,26 (1,08-1,48)Peer accidents NO 1,00 -2 Log likelih. 629,1Peer accidents YES 1,66 (1,12-2,46) Cox & Snell R2 .145Driving as leisure LOW 1,00 Nagelkerke R2 .204Driving as leisure HIGH 1,48 (0,97-2,26)

20
Conclusions
• There is a urban – rural pattern in traffic self-reported risk-taking behaviour among young adults.
• Attitudes, behaviour in peer groups and driving as leisure time activity contributes to explain variation in risk-behaviour in traffic.
• The urban-rural gradient in risk-behaviour is partly explained by the individual and contextual factors included in this study.
• Reduction of risk related to risk-taking behaviour can be targeted through enforcement or changes in attitudes towards road traffic safety.
• The higher risk-behaviour in rural areas seems to be part of strongly rooted cultures closely related to a rural lifestyle. Working towards changing this behaviour will probably challenge a rural lifestyle more than the urban.