outline of the contents of the essay - european...
TRANSCRIPT
EUROPEAN COMMISSION
Evolving pattern of intra-industry trade specialization
of the new Member States (NMS) of the EU:
the case of automotive industry
Elżbieta Kawecka-Wyrzykowska
Economic Papers 364| March 2009
EUROPEAN ECONOMY

Economic Papers are written by the Staff of the Directorate-General for Economic and Financial Affairs, or by experts working in association with them. The Papers are intended to increase awareness of the technical work being done by staff and to seek comments and suggestions for further analysis. The views expressed are the author’s alone and do not necessarily correspond to those of the European Commission. Comments and enquiries should be addressed to: European Commission Directorate-General for Economic and Financial Affairs Publications B-1049 Brussels Belgium E-mail: [email protected] This paper exists in English only and can be downloaded from the website http://ec.europa.eu/economy_finance/publications A great deal of additional information is available on the Internet. It can be accessed through the Europa server (http://europa.eu ) KC-AI-09-364-EN-N ISBN 978-92-79-11175-4 ISSN 1725-3187 DOI 10.2765/19388 © European Communities, 2009

Evolving pattern of intra-industry trade specialization of the new Member States (NMS) of the EU: the case of automotive
industry
Elżbieta Kawecka-Wyrzykowska (Warsaw School of Economics)
Paper prepared for the Workshop: “Five years of an enlarged EU – a positive-sum game”
Brussels, 13-14 November 2008
Abstract The paper investigates the development of intra-industry trade (IIT) of the NMS with major partners between 2000-2007. IIT is separated into horizontal and vertical components on the basis of differences in unit values. We have found that although inter-industry trade still accounts for almost 50% of the EU-10 countries’ trade, its share has been declining to the benefit of IIT shares (except for Malta). IIT accelerated in the post-accession period. In 2007, Slovenia and the Czech Republic recorded the highest IIT indices. Intra-industry trade of the EU-10+2 has been dominated by vertical-IIT, usually by low-quality VIIT. However, in almost all NMS, the share of high-quality vertical-IIT, as well as of horizontal-IIT in total trade increased. Thus, the pattern of NMS’ trade specialization has improved. Growing shares of IIT, in that of HIIT, reflect increasing similarities between EU-10 and the EU-15 and the convergence process of the NMS vis-à-vis EU-15 countries. In the automotive sector, the IIT indices were – generally – higher than in total trade, meaning deeper specialization. This phenomenon can be largely attributed to the high FDI penetration. JEL classification: F14; F15; F21; F 23 Key words: Intra-industry trade, new member states of the UE, EU enlargement, automotive sector, foreign direct investment. ____________________________ Acknowledgements: Data has been compiled by Łukasz Ambroziak and Maciej Sewerski, who are also the authors of tables and graphs. The author wishes to thank Professor Elżbieta Czarny from the Warsaw School of Economics for helpful comments.
Disclaimer: The views and opinions expressed here are the authors' only and should not be attributed to the European Commission.
2

Contents
Abstract ....................................................................................................................................................... 2
1. Introduction………………………………………………………………………………………...……4
2. Data sources and the coverage of the analysis ................................................................................ 6
3. Methodology ..................................................................................................................................... 7
4. Theoretical framework ..................................................................................................................... 9
5. Review of literature ........................................................................................................................ 11
6. Results of the measurement of changes in IIT intensity of the EU-10+2 countries .................... 14
6.1. Changes in the intensity of total IIT of the EU-10+2 countries.................................................. 14
6.2. Changes in intensity of VIIT and HIIT in the EU-10+2 countries in their total trade and in trade with the EU-15............................................................................................................................ 17
7. Intensity of IIT in the automotive industry and role of FDI......................................................... 22
7.1. Importance of FDI in the automotive industry in the EU-5 countries ........................................ 22
7.2. Intensity of intra-industry trade in automotive industry ............................................................. 24
8. Concluding comments.................................................................................................................... 28
9. Executive Summary...................................................................................................................... 298
10. Literature ………………………………………………………………………………………………………….…….31 11. Annexes…………………………..………………………….………………………………33
3

4

1. Introduction
Statistics reveal high growth of foreign trade of new Member States of the EU (NMS) in recent years, including the post-accession period1. In this paper we want to see whether the impressive quantitative changes of NMS’ trade are associated with changes in the pattern of trade specialization of those countries. The objective of the paper is to address the issue of accession effects on changes in intra-industry trade (IIT, called also two-way trade) which shows the extent to which bilateral imports and exports are matched within sectors.
Apart from total intra-industry trade changes of new Member States of the EU, we present indices of IIT developments in the automotive sector and try to identify the interrelations between IIT and FDI flows.
The main reason behind the interest in intra-industry trade is that closer analysis of changes of this type of trade allows for an insight into the changing patterns of specialization and scope of benefits from foreign trade. Increasing IIT implies structural convergence of economies. The higher the IIT, the more similar and higher developed are the trading partners. This, in turn, is an important consideration in terms of convergence process (catching up process) of the NMS vis-à-vis the EU -15 countries.
The main research hypothesis is that two-way trade has been an important engine of trade growth of the new Member States with their trading partners, reflecting their catching up with the EU-15 countries.
Theory and empirical research on international trade show that an important part of intra-industry trade flows is driven by foreign direct investments (FDI) as fragmentation of production and trade specialization proceeds – in particular, in more sophisticated industries - inside activities of transnational corporations (TNCs). As NMS have attracted relatively much FDI (in terms of their shares in total investments in the industries, shares in jobs, etc.) we ask whether those foreign investments stimulated intra-industry trade growth of those countries (taking as an example automotive industry). In this section of the study we test the hypothesis that FDI has positively impacted trade changes in the automotive sector, due to increase of intra-industry trade.
The study is structured as follows. Introduction is followed by sections 2 and 3 which inform on data sources, coverage of
the study and methodology. Sections 4 and 5 briefly summarize the theoretical framework of IIT and review the literature on IIT. In the main section 6, the results of various types of IIT
1 The average exports of the EU-10 countries in the period 2000-2003 developed at 15.2% per year while in the after-accession period (2004-2007) – at 19.4%. The respective average rates of growth of exports from the EU-15 amounted to 5.7% and 7.8%. With regard to imports to the EU-10 countries, the average growth over the years 2000-2003 achieved 12.1% and over the years 2004-2007 – 17.4%. Respective indicators for imports of the EU-15 countries amounted to: 5.7% and 8.8% (own calculations).
5

indices’ measurement are discussed. Section 7 focuses on interrelations between IIT and FDI in five Central European countries. Finally, the concluding remarks are provided.
2. Data sources and the coverage of the analysis The study is based on own calculations using EUROSTAT data (COMEXT trade data,
SITC Rev. 3), at five-digit level2. Therefore, no references were made to individual tables. Wherever the data source was different, the appropriate reference was done.
Generally speaking, the analysis focuses on 10 new Member States that joined the EU on 1 May 2004 (the EU-10). In majority cases also Bulgaria and Romania were included (+2) with regard to statistical data but they were treated separately as they joined the EU only in 2007 and many of the accession-related effects have not been identified in those countries yet. Whenever analysis related to all new Member States, the abbreviation EU-10+2 was used. In some cases it was necessary to underline that analysis was valid only for NMS originating from the Central and Eastern European countries (Cyprus and Malta have been market economies for many years and did not experience radical transformation) – then the abbreviation “CEECs“ was used for “Central and Eastern European countries”. The research on IIT in automotive industry covers five countries highly penetrated by FDI flows (the Czech Republic, Hungary, Poland, Slovakia and Slovenia), called the EU-5.
The analysis covers the period 2000-2007, i.e. four years of accession period of the EU-10 and four years preceding accession.
In all cases, the nominal values of trade (in euro) were taken into account. No reference was made to changes in the exchange rates of currencies of the analyzed countries and their impact on trade trends, because of lack of comparative data. It’s obvious, however, that such changes affected trade trends.3.
No quantitative comparisons were offered with the results of previous studies on IIT scope and trends, because calculations presented by other authors are usually based on different data sources or are presented at different levels of aggregation, or cover different periods and therefore are not fully comparable with this study. Instead, a brief overview of literature was presented.
2 Due to numerous calculations and a big number of tables, the study contains only some of them. More detailed calculations are presented in the Annexes. Some calculations have been skipped in this paper (they are referred to as “own calculations”). 3 For example, Polish Zloty appreciated from May 2004 to May 2007 by 26%, see: Economy and Foreign Trade of Poland in 2006, edited by J. Przystupa, Institute for Market, Consumption and Business Cycles Research, Warsaw 2006, p.60.
6
3. Methodology The first hypothesis on the importance of IIT in the process of enlargement was
tested by calculating various IIT indices in the NMS and their comparison with the pre-accession period as well as with respective indices for the old EU Member States.
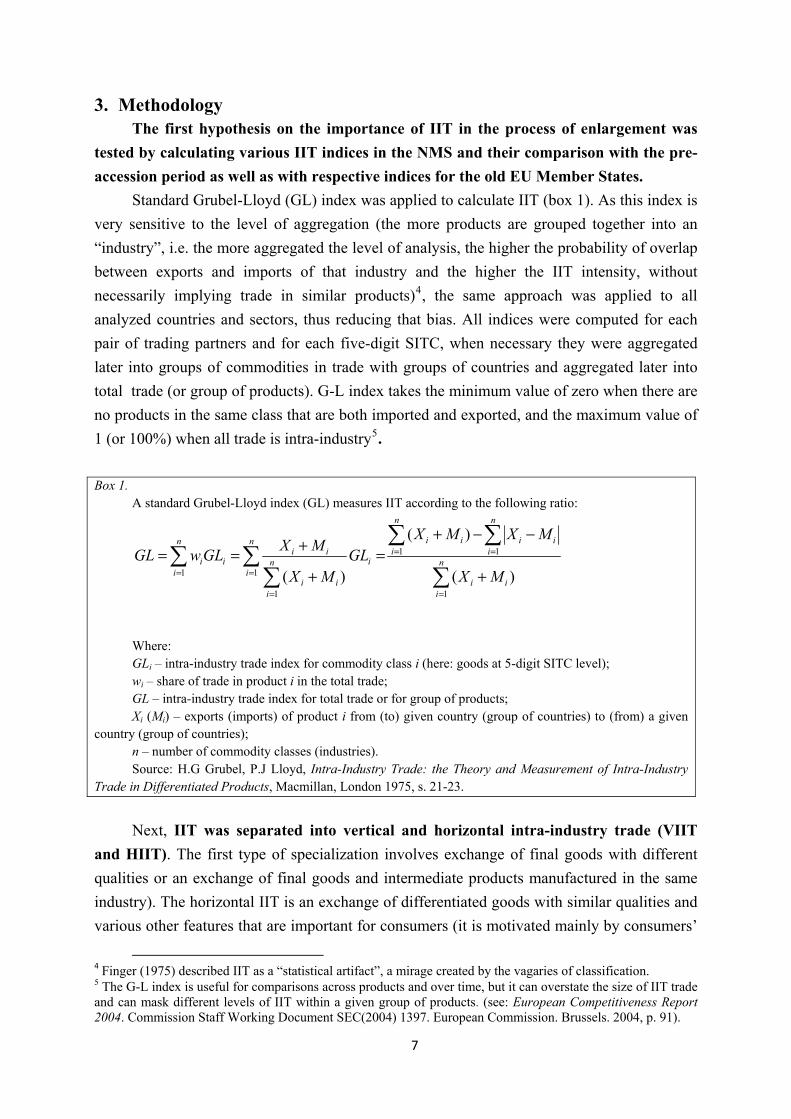
Standard Grubel-Lloyd (GL) index was applied to calculate IIT (box 1). As this index is very sensitive to the level of aggregation (the more products are grouped together into an “industry”, i.e. the more aggregated the level of analysis, the higher the probability of overlap between exports and imports of that industry and the higher the IIT intensity, without necessarily implying trade in similar products)4, the same approach was applied to all analyzed countries and sectors, thus reducing that bias. All indices were computed for each pair of trading partners and for each five-digit SITC, when necessary they were aggregated later into groups of commodities in trade with groups of countries and aggregated later into total trade (or group of products). G-L index takes the minimum value of zero when there are no products in the same class that are both imported and exported, and the maximum value of 1 (or 100%) when all trade is intra-industry5.
Box 1.
A standard Grubel-Lloyd index (GL) measures IIT according to the following ratio:
∑
∑ ∑∑ ∑
∑=
= =
= =
=
+
−−+=
+
+== n
iii
n
i
n
iiiiin
i
n
iin
iii
iiii
MX
MXMXGL
MX
MXGLwGL
1
1 1
1 1
1)(
)(
)(
Where: GLi – intra-industry trade index for commodity class i (here: goods at 5-digit SITC level); wi – share of trade in product i in the total trade; GL – intra-industry trade index for total trade or for group of products; Xi (Mi) – exports (imports) of product i from (to) given country (group of countries) to (from) a given
country (group of countries); n – number of commodity classes (industries). Source: H.G Grubel, P.J Lloyd, Intra-Industry Trade: the Theory and Measurement of Intra-Industry
Trade in Differentiated Products, Macmillan, London 1975, s. 21-23. Next, IIT was separated into vertical and horizontal intra-industry trade (VIIT
and HIIT). The first type of specialization involves exchange of final goods with different qualities or an exchange of final goods and intermediate products manufactured in the same industry). The horizontal IIT is an exchange of differentiated goods with similar qualities and various other features that are important for consumers (it is motivated mainly by consumers’
4 Finger (1975) described IIT as a “statistical artifact”, a mirage created by the vagaries of classification. 5 The G-L index is useful for comparisons across products and over time, but it can overstate the size of IIT trade and can mask different levels of IIT within a given group of products. (see: European Competitiveness Report 2004. Commission Staff Working Document SEC(2004) 1397. European Commission. Brussels. 2004, p. 91).
7

preferences for varieties or for characteristics of goods, e.g. cars of similar class and price range).
Horizontal and vertical IIT of the analyzed countries was measured by using the Hine, Greenaway and Milner (1998) methodology. According to this approach, distinction between HIIT and VIIT is based on assessment of product quality. To assess different qualities, the unit values were used. The underlying assumption is that relative prices are likely to reflect relative qualities of products. This approach, commonly adopted in literature, does not guarantee a clear distinction between trade flows (see box 2).
Box 2
Distinction between HIIT and VIIT Typically, trade flows are defined as horizontally differentiated when the unit value index (UV) is
inside the +/_15% range. When relative unit values are outside this range, products are considered as vertically differentiated. In other words, HIIT takes place when unit values of exports and imports are in the range of 0.85 and 1.15.
The unit value approach is usually criticized for at least two reasons. First, it’s a question of imperfections of trade statistics resulting from difficulties with right separation of products (unit values of two groups of products may also differ if the mix of products differs, so that one group may contain a higher proportion of high unit value items than the other one). Second, consumers may buy a more expensive product for reasons other than quality. In spite of such criticism, the unit value approach is commonly used in the literature.
Another aspect that can be considered as arbitrary is the 15% threshold of relative unit values. Sometimes, a higher than 15%, difference in unit values is accepted for calculations.
IIT is considered to be a HIIT if the following criteria are met:
αα +≤≤− 11 mi
xi
UVUV
IIT is vertical trade when:
α−≤ 1mi
xi
UVUV
or α+≥1mi
xi
UVUV
xiUV – unit value of exports for a product from industry i (here: goods at 5-digit level of SITC); m
iUV – unit value of imports for a product from industry i (here: goods at 5-digit level of SITC);
α – deviation of relative unit values of exports ⎟⎟⎠
⎞⎜⎜⎝
⎛m
i
xi
UVUV
, here: α=15%.
When unit value index is below 0.85 threshold, it’s considered to characterize low quality products (sold at a lower average price); when this index is above 1.15 ceiling, it is treated as an indicator of high quality products (sold at a higher average price).
Source: Hine R.C., Greenaway D., Milner C., Vertical and Horizontal Intra-Industry Trade: An Analysis of Country- and Industry-Specific Determinants, in: “Intra-Industry Trade and Adjustment”, Brülhart M., Hine R.C., Macmillan, London 1998, p. 70-97.
The second hypothesis on positive impact of FDI in the automotive industry on IIT
growth is tested in a very simply way, by comparing changing shares of FDI and of IIT in this sector in the EU-5 countries, highly penetrated by FDI.
8

4. Theoretical framework Standard trade theory (theory of comparative advantage) involves trade in homogeneous
products; hence, with perfect competition there is only inter-industry trade. This theory deals with various factors of international trade that are generated by the differences among countries.
For many years, more and more trade has been taking place between similar countries (mainly highly developed countries with similar patterns of economic structures). It includes often parallel export and import of products that belong to the same industry (IIT). Such trade cannot be explained by traditional trade theory.
The phenomenon of IIT was firstly noticed in trade among the members of the EEC. First papers covering the issue of parallel export and import of products that belonged to the same industry were presented by Verdoorn (1960) and Balassa (1966). Later research revealed IIT in relations between various other countries.
The important publication of Grubel and Lloyd on the concept and measurement of intra-industry trade (1975) stimulated enormous interest in this type of trade specialization and was followed by many theoretical and empirical studies on IIT.
The first models of IIT basing on monopolistic competition and product differentiation (as developed by Krugman, 1979 and 1980, Lancaster, 1980, and Helpman, 1981) assumed that goods are horizontally differentiated and IIT develops in monopolistically competitive markets. On the supply side, it’s driven by increasing returns to scale and on the demand side, it’s driven by diverse consumer preferences. Helpman and Krugman (1985) added factor endowment differences that explain the co-existence of inter- and intra-industry trade.
The other group of theories deals with vertical IIT. The theoretical model of IIT in vertically differentiated products was developed mainly by Falvey (1981), Falvey and Kierzkowski (1987) and Flam and Helpman (1987). These works showed significance of such factors affecting VIIT, as: differences in technology, income levels and income distribution, also the role of factor endowments.
The works of Abd-el-Raman (1991) and Greenway et alia (1994, 1998) established a method to separate vertical from horizontal IIT and suggested that matched exchange of vertically differentiated products is the dominant form of IIT, even in the trade among developed countries.
Let’s stress that the theoretical literature argues that HIIT and VIIT depend on different determinants, although some of them (e.g. factor endowments) can explain both, inter-industry and intra-industry trade. The role of different determinants of IIT was broadly presented, among others, by R. Loertscher and F. Wolter (1980). Apart from the IIT determinants mentioned above, other factors were also taken into account (e.g. geographical proximity, elimination of trade barriers) – box 3.
9

Box 3
Inter-industry trade (one-way trade) and intra-industry (IIT – two-way) trade Inter-industry trade reflects different factor (labour and capital) endowments and technology. It is
explained by a standard trade theory involving exchange of homogeneous products where perfect competition exists (it is dealt with mainly by the theory of comparative advantages).
Intra-industry trade usually is not based on comparative advantage, although some elements of comparative advantage may be also involved (especially, in the case of vertical IIT). To a large extent IIT is explained by factors such as economies of scale, income levels, innovations and demand for differentiated products, in some cases, also by comparative advantages.
From the point of view of this analysis, of crucial importance is the separation of IIT
into HIIT and VIIT, as suggested by Hine, Greenaway and Milner (1994, 1998) who also presented the methodology of such separation of IIT. Such an approach offers a better understanding of the nature of IIT specialization. It also allows to better assess countries’ catching up process. The reason is that HIIT is typical for countries with similar and highly developed patterns of economic structures. Such countries are able to produce differentiated goods, offered usually by well developed manufacturing sectors. Also, developed countries create the biggest demand for such products.
In particular, theory explains that horizontal intra-industry trade consists of exchange of varieties of goods with similar qualities and various other features that are important for consumers, and is driven mainly by economies of scale and consumers’ preferences for variety (e.g. cars of a similar class and price range). In turn, vertical IIT is an exchange of final goods with different qualities and prices (e.g. Italy exports high-quality clothing and imports low-quality clothing) or an exchange of final and intermediate goods produced in the same industry, driven mainly by different factor endowments, i.e. by comparative advantages (e.g. exchange of seats of the car for engines, thus reflecting exchange of cheap unskilled labour for highly qualified personnel)6.
Consequently we expect vertical IIT to be more pronounced between developing and developed economies than between developed countries. Less developed countries seldom possess the technology to produce goods that belong to the same statistical categories as goods exported by the developed countries. Less developed countries specialize usually in those stages of production in which they possess comparative advantage, e.g. cheap, unskilled labor. Thus, much of VIIT in those countries results from FDI and is conducted in the framework of global activities of TNCs (also, horizontal intra-industry specialization can be easily conducted by TNCs). It has been probably the case also in trade of the EU-10+2 countries. The inward foreign direct investments to those countries have increased rapidly
6 See more: Intra-Industry and Intra-Firm trade and the Internationalization of Production, in: Economic Outlook, No. 71, 2002, OECD, chapter VI.
10

over the recent years. As a result, we can expect IIT of those countries to have expanded. We elaborate on this hypothesis in section 7.
With regard to HIIT, theoretical models suggest that the more similar countries are in terms of their factor endowments and incomes, the higher the share of this type of trade. Thus, we should expect HIIT to be higher between developed countries than less developed countries, as developed countries display relatively high incomes and at the same time, similar pattern of economic structures7. As HIIT is usually correlated with economic similarities, increasing HIIT implies structural convergence of economies. In other words, HIIT can be treated as an indicator of convergence process. For the UE-10+2 countries, which are catching up countries and trying to reduce their economic distance vis-à-vis highly developed countries, one may expect the increasing intensity of total IIT (in particular, of HIIT) and respectively decreasing inter-industry type of specialization.
Let us stress, that increasing role of both types of IIT in total trade of a given country should be assessed explicitly positively as IIT is commonly considered as a specialization allowing for more trade benefits than the inter-industry trade. IIT enhances the gains from trade through better exploitation of economies of scale – rather than through comparative advantages. The reason is that in the case of IIT, producers usually concentrate on a limited number of products within any particular industry which leads to an increase of output because of the saving of fixed costs. IIT also stimulates innovations. Producing a greater variety and number of goods increases the general knowledge about technology, and greater knowledge implies smaller costs of knowledge accumulation8.
Another important positive aspect of IIT as compared to inter-industry trade is that it is less disruptive than inter-industry trade as the adjustments in production to ongoing competition and reallocation of resources take place within the same industry. This aspect of IIT is important for all countries but in particular for catching up countries which face more adjustment challenges than highly developed countries. In other words, increasing IIT reduces adjustment costs.
Thus, the practical implication is that high indices of IIT, typical for highly developed countries, translate into higher trade benefits for those countries and lower adjustment costs.
5. Review of literature Numerous studies have been conducted since the beginning of transformation of the CEECs to show both, changes in IIT of those countries and determinants of IIT growth. The
7 Intra-Industry … op.cit., OECD. However, IIT does not concern exclusively trade between high-income countries; the low-intermediate income countries play in some cases a dual role, competing with high income countries in certain segments of the market. 8 R.J. Ruffin, The Nature and Significance of Intra-Industry Trade, “Economic and Financial Review, Federal Reserve Bank of Dallas, Fourth Quarter 1999; Intra-Industry … op.cit., OECD.
11

stress in such analyses has been usually on CEECs’ trade with the EU Members States which is obvious taking into account the dominant role of the EEC/EU in trade of CEECs, as well as other factors (the economic weight of the EU, geographical proximity, deep liberalization and integration with the EU since the beginning of transformation, EU accession etc.) which have shaped those countries’ politics and economics.
Before the transformation started, the share of IIT was very low and horizontal IIT was almost non-existent (G. di Simone, 2007). The rapid growth of IIT between CEEC and the EEC/EU was observed already in the early years of transition. J. Gacs noted that the share of IIT in Hungarian trade with the EEC, measured according to NACE 3-digit level, increased from 40% in 1980 to 47% in 1988 and jumped to 53% in 19929. According to B. Kaminski (2001), the share of IIT increased between 1993 and 1998 for all CEECs except Bulgaria, Lithuania and Latvia. The largest increase in the value of G-L index at that time registered Estonia, followed by Slovakia, Czech Republic, Romania and Poland.
Around the middle of the 1990s, an increasing number of authors have found that the important part of the dynamic development of trade between the CEEC and the EU was the IIT, predominantly vertical IIT, e.g. C. Aturupane, S. Djankov and B. Hoekman (1999) who studied how country- or industry-specific factors affected the IIT between Eastern Europe and the European Union. The authors found “a statistically significant positive association between horizontal intra-industry trade (the exchange of close substitutes of similar quality) and foreign direct investment, product differentiation, and industry concentration”. They also found “a significant negative relationship for economies of scale and labor intensity”. 10
J. Fidrmuc, D. Grozea-Helmenstein and A. Wörgötter showed that reduction of trade barriers among CEECs and the EEC/EU resulted in increased IIT indices. They observed, however, that “the increase of intra-industry trade is not uniform, but reflects different patterns of integration and progress of industrial restructuring”. The authors found that “Hungary and Slovenia showed the largest growth of intra-industry trade that became very similar to intra-industry trade within the European Union”. However, “the Czech Republic had the highest share of intra-industry trade reaching 68 percent in the trade with the five selected EU-countries” 11.
Relative importance of vertical and horizontal IIT was analyzed by C. Aturupane, et alia (1999) who concluded that “the magnitude of IIT is relatively high in bilateral trade between the CEECs and the EU. Levels of total IIT are comparable to those observed for countries
9 J. Gacs, The Economic Interpenetration between the EC and Eastern Europe: Hungary, European Economy 1994, no. 6. 10 C. Aturupane, S. Djankov, B. Hoekman, Horizontal and Vertical Intra-Industry Trade between Eastern Europe and the European Union, Weltwirtschaftliches Archiv, 1999, Vol.135, No.1, pp. 62-81. 11 J. Fidrmuc, D. Grozea-Helmenstein, A. Wörgötter, Intra-Industry Trade Dynamics in the East-West Relations. Comparison of Austrian, Dutch, German, Italian and Swedish Trade with the CEEC, East European Series, No. 52, Institute for Advanced Studies, Vienna, December 1997.
12

such as Canada, Israel, Korea or Portugal. Most of the IIT is vertical in nature…. Horizontal IIT has been static over the 1990-1995 period for the majority of countries. However, for some countries such as the Czech Republic and Slovenia it has been growing rapidly and has attained levels that exceed those reported for countries such as Greece, Finland and Israel”12.
Also other authors, e.g. I. Ferto and K.A. Soos (2006) concluded recently that “intra-industry trade, which had been almost non-existent within the communist camp and also in the trade between its members and Western countries, has developed over the last one and a half decade both between former communist countries and (even more) between them and the old member countries of the European Union”13.
Quite recently, details of HIIT and VIIT between the former CEFTA countries and the EU were analyzed by S. Černoša (2007). He concentrated on production pattern (IIT specialization) of the Czech Republic, Hungary, Poland, Slovakia and Slovenia in foreign trade with EU Member States from 1995-2001 (across countries and twenty manufacturing activities: divisions 17-36 of the ISIC). This analysis revealed “the predominance of IIT specialization of the majority of the chosen manufacturing activities in the production of lower quality products”. It also found, however, “a few activities in each of the five observed former CEFTA countries, which, by contrast, showed predominant specialization in the production of higher quality products”. 14
A study on Poland’s IIT by E. Czarny and K. Śledziewska (2008) concluded that “in 2000-2006, the structure of Poland’s trade with the EU-15 improved. The share of vertical IIT in which Poland exported high-quality products grew consistently. ... Poland is no longer just a supplier of non-processed or low-quality goods and intermediates, It increasingly exports high-quality and technologically advanced products. This change is a result of modernization in the Polish economy thanks to an inflow of FDI, free trade and adjustments to EU standards after Poland’s entry to the single market”15.
Many studies concentrated on the role of FDI in trade changes. B. Kaminski (2001) found that countries which received relatively big inflows of FDI (as measured by FDI/GDP ratio) in the 1990s experienced also expansion of IIT. For earlier period, a similar conclusion was presented by B. Hoekman (1996) and C. Aturupane et. alia (1999): “After controlling for country-specific factors, we find a positive and significant relationship between FDI and product differentiation and both vertical and horizontal IIT”16. Contrary to majority studies, a very low interrelationship between FDI and IIT was found in Polish foreign trade by A.
12 C. Aturupane, S. Djankov, B. Hoekman, Horizontal … op.cit. 13 I. Ferto, K.A. Soos, The development of Intra-Industry Trade between the European Union and European Former Communist Countries before the 2004 Enlargement, INDEUNIS Papers, Hungarian Academy of Sciences, Institute of Economics, February 2006. 14 S. Černoša, Horizontal and Vertical Intra-Industry Trade between the Former CEFTA Countries and the European Union, Managing Global Transitions , 2007, vol. 5, No. 2. 15 Czarny E. Śledziewska K., Poland’s Intra-Industry Trade with the European Union at the Beginning of the 21th Century, in: Poland. Competitiveness Report 2008. Focus on Services, ed. by M.A. Weresa, World Economy Research Institute, Warsaw School of Economics, Warszawa 2008. 16 C. Aturupane, S. Djankov, B. Hoekman, Horizontal… op.cit.
13

Cieślik (2008): “It was found that although the activity of multinational firms is positively elated to the volume of bilateral trade between Poland and EU-15 countries, at the same time these firms do not seem to contribute to the development of the intra-industry-trade”17.
6. Results of the measurement of changes in IIT intensity of the EU-10+2 countries
6.1. Changes in the intensity of total IIT of the EU-10+2 countries
Though inter-industry trade (exchange of goods coming from different industries) still
accounts for almost 50% (on average) for the EU-10 group of countries, its share has been declining in all those countries (except for Malta) in recent years. Respectively, IIT has become more important for all EU-10 countries, but Malta, over the period 2000-2007 (also for Bulgaria and Romania). For the whole EU-10 group, the IIT index in their total trade increased from 42% in 2000 to 51% in 2007 – table 1 and graph 1.
In 2007, in all EU-10 countries, but Malta and Cyprus, IIT accounted from about 41% (the lowest share – in Slovakia) to 58% (the highest IIT intensity – in Slovenia and the Czech Republic) of total trade of those countries, while the share of inter-industry trade was respectively at about 59% and 42%. In Malta and Cyprus the respective indices of IIT were much lower: 16%-17%, lower even than in Bulgaria (32%) and Romania (33%) – table 1.
Generally speaking, countries with relatively high IIT shares in 2000 (the Czech Republic being a leader with the index at 51%) have not improved much these shares. The biggest increases of IIT indices took place in the Baltic countries - in Latvia, index has doubled in 2000-2007 (but the indices were calculated from a low initial level). In Malta a big decrease of IIT index was recorded (table 1).
17 A. Cieślik, Multinational firms and international fragmentation of production in Poland, in: Meeting Global Challenges, Working Papers of International Business, University of Gdańsk, Sopot 2008.
14

Table 1. Indices of various types of specialization of individual EU-10+2 countries in their total trade in 2000 and 2007 (%)
Type of specialization VIIT
Total trade Inter-
industry Intra-
industry (IIT) total VIIT total VIIT-low
quality VIIT-high
quality
HIIT Country Year
1=2+3 2 3=4+7 4=5+6 5 6 7 2000 100.0 84.8 15.2 12.4 10.8 1.6 2.8
Cyprus 2007 100.0 84.1 15.9 14.3 6.7 7.6 1.62000 100.0 49.2 50.8 38.5 27.7 10.8 12.3
Czech Rep 2007 100.0 42.8 57.2 39.8 18.8 21.0 17.42000 100.0 66.8 33.2 26.0 17.4 8.6 7.2
Estonia 2007 100.0 49.6 50.4 33.2 15.5 17.7 17.22000 100.0 55.9 44.1 34.1 17.2 16.9 10.0
Hungary 2007 100.0 48.2 51.8 37.6 19.9 17.7 14.22000 100.0 73.3 26.7 19.3 10.7 8.6 7.4
Lithuania 2007 100.0 54.9 45.1 28.5 17.0 11.5 16.62000 100.0 78.0 22.0 14.9 9.5 5.4 7.1
Latvia 2007 100.0 56.0 44.0 35.0 21.6 13.4 9.02000 100.0 42.8 57.2 54.4 53.3 1.1 2.8
Malta 2007 100.0 83.2 16.8 15.7 3.5 12.2 1.12000 100.0 60.7 39.3 31.2 19.3 11.8 8.1
Poland 2007 100.0 49.1 50.9 28.1 15.7 12.4 22.82000 100.0 65.9 34.1 26.5 16.8 9.7 7.6
Slovakia 2007 100.0 59.3 40.7 31.9 12.4 19.4 8.82000 100.0 55.8 44.2 29.9 17.3 12.6 14.3
Slovenia 2007 100.0 42.5 57.5 31.7 17.2 14.5 25.82000 100.0 58.1 41.9 32.3 20.4 6.9 9.6
EU-10 2007 100.0 49.3 50.7 33.3 16.9 9.5 17.42000 100.0 73.0 27.0 21.9 15.0 7.6 5.1
Bulgaria 2007 100.0 67.7 32.3 23.5 14.1 10.6 8.82000 100.0 78.1 21.9 19.1 11.5 11.9 2.8
Romania 2007 100.0 67.2 32.8 25.3 14.7 16.4 7.5 Graph 1: Intensity of intra-industry trade of the EU-10 countries in 2000 and 2007
Source: data of table 1 of Annex 1.
15

Increasing IIT in the years 2000-2007 hides the fact that the rapid increase of this type of trade specialization took place already in the 1990s, in the period of fast legal and real transformation-related adjustments and integration into the EU-15. At that time it was predominantly the growth of vertical IIT, driven mainly by FDI18. The reason behind this development of FDI and VIIT was first of all the need of Central European companies to obtain access to know-how, capital and distribution channels. These developments allowed for successful restructuring of many industries in the CEEC. As a result of accession, FDI flows and deepening of trade specialization have continued and accelerated. In all EU-10 countries, except for Malta, IIT shares in total trade (also in trade with major groups of partners) increased after accession faster than before 2004 (own calculations).
Let’s us notice, that despite relatively high increase, the IIT index is still lower in trade of EU-10+2 than in trade of the old EU countries (EU-15). The average share of IIT in the EU-10 trade with the EU-15 (the major trading partners) was 44% in 2007 (in intra-EU-10 trade it amounted to 49%) while the same index in intra EU-15 trade amounted to 59% (table 1 of Annex I and own calculations). Thus, the difference was not big. It’s also interesting to note that, in 2007, the IIT share was in several EU-10 countries higher than in some EU-15 countries. In such countries as the Czech Republic, Estonia, Hungary, Poland and Slovenia this index was above 50%. It was below 50% in the following EU-15 countries: Finland, Greece, Ireland, Luxembourg and Portugal (the lowest being in Greece – 20%). Thus, the share of intra-industry trade in total trade of many of the EU-10 countries is already at the level of some industrially advanced countries, such as Italy and Sweden19 – graph 2 and table 2 of Annex I.
Graph 2: IIT indices in the EU-10 countries and selected EU-15 countries* in 2000 and 2007 (%)
*For EU-15 countries – IIT in their intra trade
Source: data of table 2 of Annex 1.
18 See section 7 of this study. 19 The latter situation resulted from the fact that in majority of EU-15 the IIT indices were almost stable during the period 2000-2007 (in UK, Ireland, Luxembourg and the Netherlands they even decreased slightly).
16

6.2. Changes in intensity of VIIT and HIIT in the EU-10+2 countries in their total trade and in trade with the EU-15
In all EU-10+2 countries, intra-industry trade has been dominated all the time by
vertical trade (column 4 of table 1). From the point of view of type of specialization and gains from trade, the analysis of aggregated VIIT is not sufficient as it does not distinguish between types of goods traded. In order to have better insight into the type of specialization it is good to distinguish between VIIT specialization in low and high quality products (box 2).
Over the years 2000-2007, VIIT was dominated usually by specialization in production of low quality products (countries exported mainly low-quality products and imported high-quality ones). This was the situation in Hungary, Lithuania, Latvia, Poland and Slovenia. In some of those countries (Hungary, Latvia and Lithuania) the share of low quality VIIT even increased in 2007 as compared to 2000. Indices of low quality VIIT were higher than those of high quality VIIT in trade with all groups of countries, except of trade with non-EU countries in recent (table1 of Annex 1).
At the same time, the share of high quality VIIT has increased in all EU-10+2 countries, and in some countries very much: in Cyprus, the Czech Republic, Estonia Latvia, Malta, Slovakia intensity of this type of trade more than doubled! (in their total trade). Intensity of low quality VIIT usually also increased, but at much slower rate. As a result, in all six above mentioned countries, except for Latvia, the share of high quality VIIT has become higher than the share of low quality VIIT. This improvement (stronger position of specialization in high quality products) appeared only recently: seven years ago (in 2000), trade of all EU-10+2 countries was dominated by low quality VIIT (table 1).
Thus, over the years 2000-2007, the pattern of VIIT has improved in all countries of the group EU-10+2. Albeit low quality VIIT still dominates in trade of many of the EU-10+2 countries, the share of high quality VITT has increased and the distance between both types of vertical specialization was in 2007 much lower than in 2000 (respectively 7.4 p.p. and 13.5 p.p.)20.
Another positive trend has been a significant rise of HIIT: on average HIIT index almost doubled in the EU-10 countries: from 7% to almost 14% in the period 2000-2007. This improvement has resulted mainly from significant increase of the intensity of HIIT in trade of Poland, Estonia and Slovenia. Bulgaria and Romania followed this trend, albeit from much lower initial levels of HIIT index. Only Cyprus and Malta recorded decrease of HIIT share in their total trade.
20 The same conclusion for Poland results from calculations presented in: E. Czarny, K. Śledziewska, Poland’s Intra-Industry Trade … op.cit., pp. 84-108.
17

Summing up this part of the interpretation of statistical data, while VIIT of low quality products decelerated over the years 2000-2007, vertical IIT of high quality products as well as horizontal IIT developed faster in the same period. These different rates of growth of various types of IIT reflect positive changes of trade and production specialization in the EU-10 countries, involving specialization in more advanced products. Such positive changes in the pattern of trade specialization have taken place over 2000-2007 in almost all EU-10 countries. They, generally speaking, characterized also trade of Bulgaria and Romania
Slightly different observations can be made while analyzing trade of the EU-10+2 countries with the EU-15 countries which are the major trading partners of all EU-10+2 countries, but Malta21. First, the intensity of high quality VIIT increased in majority (but not in all) EU-10+2 countries, the exceptions being: Estonia, Hungary, Poland, Slovenia and Bulgaria (except for Bulgaria these were the countries with the highest indices of high quality VIIT specialization). The increase of this type of trade was, however, much lower than in the case of total trade of the EU-10 group (respectively by 0.1 p.p. and 2.6 p.p. - table 1 and 2). Second, changes relating to the low quality VIIT with the EU-15 countries were in the opposite direction in individual EU-10 countries, while in total trade of the EU-10 countries intensity of low quality VIIT has been steadily decreasing (except for Malta).
With regard to HIIT, the share of this type of trade almost doubled, both in total trade of the EU-10 group and in their trade with the EU-15 countries. This very positive upward trend of HIIT resulted mainly from huge expansion of this type of specialization in Poland, the biggest country of the analyzed group of the EU NMS. In Poland’s trade with the EU-15 the HIIT index increased from 5.2% in 2000 to 18.8% in 2007, and in total trade: respectively from 8.1% to 22.8%. As a result, HIIT intensity in total Poland’s trade has become in 2007 not much lower than the intensity of VIIT: 22.8% and 28.1%. Also in Hungary, the HIIT index in trade with the EU-15 increased impressively from 6.2%% in 2000 to 13.4% in 2007 (table 1 and 2). In several countries an opposite trend was registered: the share of HIIT has decreased over the period 2000-2007 in Cyprus, Lithuania and Slovakia in their trade with the EU-15.
21 In 2007, the share of the EU-15 amounted to 60% of exports and 59% of imports of the EU-10 countries on average, while in 2000 the respective shares were: 68% and 60%.
18

Table 2. Indices of various types of specialization of the EU-10 countries in trade with the EU-15 in 2000 and 2007 (%)
Type of specialization VIIT
Total trade Inter-
industry Intra-
industry (IIT) total
VIIT total VIIT-low
quality VIIT-high
quality
HIIT Country Year
1=2+3 2 3=4+7 4=5+6 5 6 7 2000 100.0 87.1 12.9 10.8 9.0 1.8 2.1
Cyprus 2007 100.0 86.1 13.9 13.3 7.9 5.4 0.62000 100.0 50.8 49.2 38.7 28.7 10.0 10.5
Czech Rep 2007 100.0 47.3 52.7 39.2 27.7 11.6 13.52000 100.0 75.9 24.1 20.3 10.2 10.2 3.8
Estonia 2007 100.0 66.5 33.5 28.0 18.0 10.0 5.52000 100.0 61.6 38.4 32.2 17.8 14.4 6.2
Hungary 2007 100.0 54.5 45.5 32.1 20.2 12.0 13.42000 100.0 82.3 17.7 13.6 8.9 4.7 4.1
Lithuania 2007 100.0 80.6 19.4 16.1 10.9 5.2 3.32000 100.0 90.3 9.7 8.7 6.5 2.2 1.0
Latvia 2007 100.0 81.7 18.3 15.5 12.9 2.5 2.82000 100.0 72.4 27.6 27.2 26.1 1.1 0.4
Malta 2007 100.0 83.9 16.1 15.1 2.6 12.6 1.02000 100.0 62.6 37.4 32.2 20.8 11.4 5.2
Poland 2007 100.0 55.1 44.9 26.1 16.2 9.9 18.82000 100.0 70.3 29.7 22.9 15.8 7.1 6.8
Slovakia 2007 100.0 64.9 35.1 29.7 15.0 14.7 5.42000 100.0 58.6 41.4 28.1 17.5 10.7 13.3
Slovenia 2007 100.0 56.0 44.0 26.5 17.1 9.5 17.52000 100.0 61.7 38.3 31.2 20.4 10.8 7.1EU-10 2007 100.0 56.0 44.0 30.3 19.4 10.9 13.72000 100.0 81.3 18.7 16.8 8.4 8.4 1.9
Bulgaria 2007 100.0 71.7 28.3 22.2 14.6 7.7 6.12000 100.0 80.0 20.0 17.5 9.7 7.8 2.5
Romania 2007 100.0 69.0 31.0 26.3 16.7 9.6 4.7 On average, the share of HIIT for the whole group EU-10 countries almost doubled:
from 7.1% in 2000 to 13.7% in 2007, the fastest being in the period after accession (own calculations).
Graph 3 presents in a concise way changes in types of the EU-10 trade specialization with the EU-15 in 2000 and 2007 (in %).
19

Graph 3. Changes in types of the EU-10 trade specialization with the EU-15 in 2000 and 2007 (%)
Source: data of table 2.
Despite that impressive HIIT intensity growth and very stable share of VIIT, the
absolute level of VIIT indices was in 2007 still much higher than the level of HIIT indices. This observation applies both, to EU-10 countries’ trade with the EU-15 and to their total trade. At the same time, the role of VIIT increased much in intra EU-10 countries’ trade, while the increase of HIIT has been almost negligible (graphs 4 and 5). Still, in 2007, the average index of HIIT for intra-EU-10 countries’ trade was slightly higher than HIIT index in the EU-10 countries with the old EU-15 Member States. `
20

Graph 4: Vertical IIT of the EU-10 in 2000 and 2007 Graph 5: Horizontal IIT of the EU-10 in 2000 and 2007
Source: data of table 1 of Annex 1.
Thus, changes in the pattern of intra-industry specialization were of different
character in the case of intra-EU-10 countries’ trade and their trade with the EU-15. Increase of intra-industry trade among the EU-10 countries was mainly of vertical character while the levels of intra-industry trade of those countries with their major trading partners (i.e. EU-15) grew first of all in horizontally differentiated products.
Substantial increase of HIIT intensity in the EU-10 countries’ trade with the EU-15 countries over the period 2000-2007 is consistent with the theory. As already mentioned, theoretical models suggest that horizontal specialization takes place first of all among countries with high level of incomes and similar economic patterns. As disparities between the EU-10+2 countries and the EU-15 (measured by GDP per capita in PPP terms) are getting lower, the NMS are becoming more similar with the old EU Members. Thus, increasing indices of HIIT in trade with the UE-15 countries confirm the convergence process of the EU-10+2 vis-à-vis the EU-15 group.
Such trend is clearly a positive development also because HIIT is more advanced type of trade, allowing for bigger trade benefits and lower adjustment costs. We may conclude, that relatively fast increase of this type of specialization in the EU-10 trade with the EU-15 allowed for smooth adjustments to challenges of the internal market of the EU, in particular since accession to the EU in 2004.
At the same time, the absolute level of HIIT indices for many EU-10 countries was higher in the analyzed period in their trade with other EU-10 countries than in trade with EU-15 partners (table 1 of Annex 1). This observation is also in line with the theory as the EU-10 countries – on average - are more similar between each other (as measured for example by pattern of production and the level of GDP per capita) than as compared with the EU-15. Exceptions are Malta, and Slovenia with higher HIIT indices in their trade with the EU-15 than in trade with the EU-10. One possible interpretation is that both countries are more similar with the EU-15 than with the EU-10 countries.
21

7. Intensity of IIT in the automotive industry and role of FDI As mentioned before, research on international trade shows that intensification of IIT
(in particular, VIIT) in more sophisticated manufactured products is often correlated with inflows of FDI22. The EU-10+2 countries have been recording for many years big inflows of FDI23. In this context we analyze in this section statistical data in order to identify the relationship between FDI and IIT in the automotive sector. The underlying assumption is that IIT (especially VIIT) in this sector is driven by TNCs’ activities. We concentrate on data for five new Member States (EU-5) where the automotive industry has been playing in recent years relatively big role in trade and FDI stock24 (table 3). They include: the Czech Republic, Hungary, Poland, Slovakia and Slovenia. Automotive sector has been identified for this case analysis for four reasons: 1/ it has attracted relatively big inflows of FDI to NMS as compared to other sectors (in some NMS – this sector has become the biggest recipient of FDI stocks), 2/ in developed countries this sector has been one of the engines of IIT growth, 3/ it is one of the mostly internationalized industries, 4/ this sector can be relatively easily identified for statistical comparisons (to compare FDI data and trade data).
7.1. Importance of FDI in the automotive industry in the EU-5 countries25 The automotive industry plays a very important role in Europe as an engine for
employment, growth and innovation. The importance of this derives to a large degree from many linkages within the domestic and international economy. For example, this sector creates demand for inputs from other industrial sectors (steel and metal products, high-tech manufacturing etc.)26. It also stimulates new types of activities, thus creating new jobs and incomes (e.g. car repair services, fuel stations, car wash facilities). Also, a high level of competition in the industry is forcing car producers to aggressively seek cost optimization. Competition is also a key factor of ongoing innovations, resulting in positive spillovers effects for the whole economies.
22 One of the reasons explaining high IIT intensity in such industries is that “sophisticated manufacturing products are more likely to benefit from economies of scale in production and are easier to “differentiate” to the final consumer, and so facilitate trade in similar products. More complex manufactured products which rely on many components and/or processes may also benefit more readily from splitting up production across countries”, see e.g.: Intra-Industry… OECD, op.cit. 23 Taking into account that FDI flows of all EU-10+2 are dominated by financial services, FDI impact on trade is lower than it might result from the size of total FDI flows. In this study we take into account only FDI in manufacturing sector. 24 Automotive goods are relatively important also in industrial trade of Estonia, Lithuania, and Latvia but the share of FDI in automotive sectors is here relatively low. Also, the absolute value of this FDI is very low (sometimes it may be just one foreign firm that invested in those countries) and any conclusions might be unrepresentative. 25 FDI in the automotive industry (in transport equipment) is understood here as investment in "motor vehicles and other transport equipment" and covers the whole DM group of NACE classification Rev. 1 (including NACE 34 and 35). 26 M. Tirpak, The Automobile Industry in Central Europe, IMF, November 2006, internet, p.4.
22

Enlargement has become a very important development for many EU-15 automotive industry firms27. Assembly plants and production of cars and their components in the region have clustered – mainly through FDI - in a relatively small area spanning West Slovakia, Eastern and Central Czech Republic, Southern Poland and Northern Hungary28. The automotive industry had accumulated around 7.9% of the total inward FDI stock in the EU-5 and 22.4% of FDI in manufacturing sector. Three countries: the Czech Republic, Poland and Hungary attracted almost the same value of FDI stock in this industry: around 5 700.0 millions of euro in each of them by the end of 2006. In all those countries, the automotive industry was number one recipient of industrial FDI (in Hungary accounting for 29% of FDI in industrial sector). The same three countries absorbed the majority of FDI stocks in automotive industry (almost 94% of total FDI in this sector in 2006) - table 3.
Table 3. FDI inward stock in automotive industry* (2001 and 2006, millions of euro and %)
Mln euro % % of
FDI in manufacturing
Total FDI
2001 2006 2001 2006
2001
2006 2001 2006
Inward FDI stock per capita
(2006)
Rank in 2006 (share of FDI in automotive
industry in total manu-
facturing FDI)
Czech Rep. 2,192.0 5,700.3
28.5
31.3
19.0
26.1 7.1 9.4
557
1.
Hungary 2,833.1 5,683.1 36.7 31.2 24.4 29.1 9.1 9.2 563 1. Poland 2,421.7 5,692.1 31.4 31.2 14.7 17.8 5.2 6.1 149 1. Slovakia 141.3 879.0 1.8 4.8 5.9 16.3 2.2 3.0 163 5. Slovenia 127.6 271.2 1.6 1.5 9.5 10.8 4.3 4.0 135 4. EU-5 7,715.7 18,226.7 100.0 100.0 17.8 22.4 6.4 7.9 x x *"Motor vehicles and other transport equipment", DM NACE (NACE 34 and 35) The share of Slovakia’s automotive industry’ FDI in manufacturing and in total FDI is for 2006 underestimated because of not fully comparable definition of FDI as compared to other EU-5 countries. Source: Own calculations based on WIIW data.
The automotive sector is highly penetrated by foreign capital. Data for 2001 (the latest year available)29. shows that foreign penetration was very high in the automotive industry in Slovakia and Hungary (98% of total investments in this industry), in Poland (95%) and in the Czech Republic (94%). Slovenia is the only country with a relatively significant automotive industry, but lower FDI in this sector. Also, foreign investors owned the majority of the equity capital in the EU-5 countries, accounted for more than 90% of sales and export
27 European Competitiveness Report 2004. Commission Staff Working Document SEC(2004)1397, European Commission. A more general impact of the “EU-factor” on CEEC’s FDI is analyzed in: B. Kaminski, How Accession to the European Union has Affected External Trade and Foreign Direct Investment in Central European Countries, Policy Research Working Paper, No. 2578, April 2001. 28 M. Tirpak, The Automobile Industry in Central Europe …op.cit. 29 High foreign penetration indicators are probably generally true also for recent years, taking into account fast increase of FDI in this sector, as documented in table 1 of Annex II.
23

sales in the analyzed countries, except for Slovenia, where these indicators were lower (between 77% and 86%)30.
7.2. Intensity of intra-industry trade in automotive industry In table 4 we compare the intensity of total IIT and IIT in automotive industry with the
shares of automotive industry in industrial trade and in FDI in 2000 and 2007 in the EU-5. A number of observations can be made here.
Four countries with the highest indices of IIT in total trade in 2007, i.e. Slovenia, the Czech Republic, Hungary and Poland also recorded the highest indices of IIT in automotive products – columns 1 and 4 of table 4. At the same time, in three of those countries: Hungary, Poland and Slovenia, indices of IIT in the automotive sector outpaced much the total IIT indices (by more than 20 p.p.), meaning deeper specialization in automotive trade than in total trade. The intra-industry trade accounted for more than 70% of the automotive trade of those countries! (see also graph 6). The situation was different in the Czech Republic and Slovakia, but IIT share in the automotive sector was there not much lower than in total trade. Also, in all those countries automotive goods played quite big role in total industrial trade and this role has increased over the years 2000-2007 (columns 5 and 6 of table 4) which confirms a leading role of the automotive industry in total trade development.
Table 4. Indices of total IIT and IIT in automotive industry as compared to the share of automotive industry in industrial trade and in FDI in 2000 and 2007 (%)
Intra-industry automotive trade Share of automotive goods in industrial trade
IIT (total trade)
HIIT VIIT Total IIT in automotive
products Exports
Imports
Share of automotive FDI in total FDI
stock (manufacturing)*
1 2 3 4=2+3 5 6 7 Czech Rep ...2000 50.8 8.6 47.8 56.4 16.8 8.1 19.0...2007 57.3 22.8 31.6 54.4 17.7 9.6 26.1Hungary …2000 44.1 12.9 36.5 49.4 9.2 8.1 24.4… 2007 51.9 0.3 73.6 73.9 11.6 9.5 29.1Poland …2000 39.2 0.4 81.4 81.8 10.7 9.6 14.7…2007 50.8 68.2 9.3 77.5 15.0 11.2 17.8Slovakia …2000 34.1 5.4 33.5 38.9 23.6 14.6 5.9…2007 40.7 2.1 33.5 35.6 26.5 16.5 16.3Slovenia …2000 44.2 57.8 11.3 69.1 11.9 13.0 9.5…2007 57.5 67.7 12.1 79.8 19.1 18.9 10.8EU-5 …2000 43.1 10.8 49.7 60.5 13.4 9.5 17.8…2007 51.9 32.5 30.3 62.8 16.8 11.6 22.4
*2001 instead of 2000 and 2006 instead of 2007
30 WIIW data base, cited from: European Competitiveness Report 2004 …op.cit., p. 190.
24

Graph 6. HIIT and VIIT indices in automotive industry in individual EU-5 countries in 2000 and 2007 (%)
Source: data of table 4.
Deeper analysis reveals that in three out of five analyzed countries, intra-industry trade
in the automotive sector was in 2000-2007 mainly of vertical character (in the Czech Republic, Hungary and Slovakia). As already mentioned, this type of trade results often from intra-firm trade and is usually the evidence of big role of TNCs. As presented in table 3, Hungary was a country with the biggest share of FDI in automotive industry in 2007 (29% of FDI in manufacturing sector) and the highest share of VIIT in this sector (on average in 2000-2007). The role of IIT (totally of vertical character, as the share of HIIT decreased much) substantially increased in this country over the years 2000-2007.
Two other countries with relatively big FDI in the automotive sector (as compared to total FDI in manufacturing and in terms of FDI in this sector per capita): the Czech Republic and Poland recorded decreasing VIIT intensity over the period 2000-2007. In both countries, reduced share of VIIT over the period 2000-2007 was compensated by fast increase of HIIT. This was the situation first of all in Poland, where index of VIIT was in 2007 dramatically lower as compared with 2000 (81.4% and 9.3% respectively) and the index of HIIT increased impressively (from 0.4% to 68.2%) – columns 3 and 2 of table 4 (see also graph 6). Part of the explanation can be parallel export and import of final products (similar cars, being close substitutes), which has been confirmed by Polish statistics31. Poland has exported in recent
31 In the first half of 2008, around 94% of cars produced in Poland was exported! At the same time, almost all cars sold on Polish market were of foreign origin, a big part of them being used cars (e.g. in the years 2002-2003 they accounted for about 40% of registered cars in Poland). The reason seems to be the fact that cars produced in Poland (3-4 types) do not fit the consumers’ preferences. Also, imported cars are considered to be of better
25

years many cars originating in FDI-based firms; at the same time, imports have been partly composed of used, but relatively new, cars. Their prices are not substantially different from prices of new cars exported from Poland and the unit values of exports and imports are in the range of +/-15% (i.e. a threshold between VIIT and HIIT). All that translates probably into high HIIT indices. Also, due to FDI, Poland increased much production and exports of car engines and other parts while such products were also imported, to be assemblied in firms in Poland and next exported32. Also in the Czech Republic, decrease of VIIT index in the automotive industry was accompanied by an impressive increase of HIIT, thus reflecting changing type of specialization in this sector (table 4).
The low – and even decreasing share of intra-industry trade in Slovakia – as compared to the neighboring countries – can be explained to a great extent by this country’s deep specialization in assembling cars on the basis of imported parts and components and next, their exports. Such flows of goods did not translate into higher VIIT (and total IIT) because of relatively detailed SITC classification (at 5-digit level) applied in this study (sensitiveness of IIT indices to the level of statistical aggregation of products was explained in section 3).
Concluding, the simple comparison between FDI role in the automotive industry and IIT intensity, applied in this study, does not allow for far reaching conclusions relating to the impact of FDI and transnational corporations on the type of trade specialization. Partly it’s a question of methodological character. Let’s stress once again (see remarks in footnote 5) that IIT indices are useful for comparisons over time (or across products) but have deficiencies when we want to compare the absolute level of IIT between industries or the absolute level of types of IIT (VIIT versus HIIT)33. However, comparing the above presented data on FDI penetration in the automotive industry in the EU-5 countries and trends in IIT in this sector we may conclude that the above analysis confirms positive relationship between FDI and IIT changes in the case of automotive sector. Countries with relatively highest foreign investments in the automotive sector (Hungary, the Czech Republic and Poland) record usually higher IIT indices in this sector than in total trade (recently, the exception has been the Czech Republic). Intra-industry trade in the automotive sector, highly penetrated by FDI,
quality than domestic products (in the case of the same type of a car). It happens also, that imported cars are cheaper. 32 Deeper analysis shows that horizontal IIT in Poland has accounted in the years 2000-2007 for increasing share of trade in motor vehicles (final products) and automotive parts and components and majority of this trade is probably related to TNCs activities (own calculations). The same has been true for the Czech Republic. 33 Of key importance is the concept of an “industry” and the way an industry is statistically identified (the level of aggregation of trade data). Usually, an industry is understood as a group of products which are close substitutes in terms of their utility for consumers (or production techniques). It’s assumed often that 3-digit level of SITC classification and 4-digit of CN classification is sufficient to identify an “industry”. In many cases it includes, however, products which can be hardly recognized as close substitutes (e.g. SITC 793 – ships and boats includes so different products as yachts, ships, tanker ships, rafts, lifeboats etc.). Lower aggregation – as applied in this study (at 5-digit level) – allows for more detailed analysis across “industries” understood as “close substitutes” (crucial for the concept of IIT) but does not capture many products which traditionally are considered as belonging to the same industry.
26

is not, as suggested by some previous studies (see overview of the literature in section 5), mainly of vertical character. In some countries, fast increase of horizontal intra-industry trade in the automotive sector has been recently recorded. This may be a natural evolution of trade specialization in new Member States, in line with their catching up process. Part of increasing HIIT is related to TNCs’ activities and part – probably not (e.g. exports of new cars from Poland and imports of used cars). In order to have better understanding of interrelations between FDI and IIT, more research is required.
27

8. Concluding comments Intra-industry trade has driven trade developments of the EU-10+2 countries in recent
years. Its share in total trade of the EU-10 countries increased from 42% in 2000 to 51% in 2007. The analysis has shown that in all countries, but one (Malta), the evolution of trade specialization has been clearly in one direction, consisting in increasing role of IIT, i.e. more advanced and usually more beneficial type of trade than inter-industry specialization.
Such trend means that the EU-10 countries have made great strides in changing their production structures and making their economies more similar to the EU-15 economies. It illustrates the quite quick catching up process of new Member States towards the old EU Members.
Fast development of IIT made adjustments of the EU-10+2 countries to the EU internal market relatively smooth, as resources did not need to be re-allocated between industries. This positive phenomenon is of crucial importance if we remember that competition takes place in more and more demanding and uncertain international environment, including globalization processes, huge expansion of new emerging markets (e.g. China, India), widening of the EU internal market (following enlargements in 2004 and 2007) and recent financial and economic crisis in the world economy. Those huge challenges risk costly adjustments for all economic agents. Development of intra-industry trade allows to mitigate the adverse effects of such adjustments.
The conclusions of this study follow the conclusions of previous authors stressing the increasing role of IIT for the new EU Member States (mainly CEECs). A new element is a relatively quickly changing pattern of specialization of majority of the NMS towards more horizontal IIT trade, usually typical for more developed countries. Increasing share of high quality VIIT was also identified. Moreover, this study seems to confirm the important role of FDI for IIT growth, as identified earlier by numerous authors.
28

9. Executive Summary Phenomenon of increasing IIT in international trade has been a fact documented in
numerous papers and studies. Relatively fast growth of IIT has been revealed in the present study also in the case of the new Member States of the European Union (EU-10+2 countries) over the years 2000-2007.
Although inter-industry trade still accounts for almost 50% (on average) of the EU-10 trade, its share in overall trade of the EU-10 and in trade with all main groups of partners has been declining since 2000 to the benefit of IIT shares (except for Malta). The same trend has been true for Bulgaria and Romania. IIT accelerated in the post-accession period as compared with the pre-accession period. This acceleration included all major trading partners of the EU-10+2 countries. The average IIT index for the EU-10 countries (in their total trade) increased from 42% in 2000 to 51% in 2007.
Such change should be assessed univocally positively as IIT offers more trade benefits than the inter-industry trade specialization. Also, relatively fast increase of IIT, in particular in the post-accession period, made easier adjustments in NMS’ firms to challenges of the single European market.
Many factors have contributed to increased role of IIT in the analyzed period, i.e. in the years 2000-2007 in the new Member States of the UE. The most important was probably earlier restructuring of those economies resulting from their broad opening up to the world economy, from EU-accession prospect which pressed firms in the past to be more competitive in order to stay on the market, and FDI inflows.
In all EU-10 countries, but Malta and Cyprus, IIT accounted in 2007 between 41%-57% (Slovakia and the Czech Republic being the extreme examples) of total trade, while the share of inter-industry trade was respectively 59%-43%. In Malta and Cyprus the respective indices of IIT were much lower: 16%-17%, lower than in Bulgaria (32%) and Romania (33%).
Despite relatively high increase, the IIT index is still lower in trade of NMS than in trade of the old EU Member States. This distance has been, however, rapidly decreasing. The average IIT share in the EU-10 trade with the EU-15 was 44% in 2007 (in intra-EU-10 trade it amounted to 49%) while the same index in intra EU-15 trade amounted to 59%. Thus, the difference was not big. It’s also interesting to note that, in 2007, the IIT share was in several EU-10 countries higher than in some EU-15 countries. In such countries as the Czech Republic, Estonia, Hungary, Poland and Slovenia this index was above 50%, it is higher than in some EU-15 countries, such as: Finland, Ireland, Luxembourg, Portugal and Greece (the lowest being in Greece – 20%). This comparison illustrates the increasing similarity of the EU-10 with the EU-15 and quite quick catching up process. This development can be also seen in Bulgaria and Romania but the similarity of those countries vis-à-vis the EU-15, as measured by HIIT indices, is much lower than in the majority of the EU-10 countries.
29

Intra-industry trade of the EU-10 has been dominated so far by VIIT. For all EU-10 countries, indices of VIIT were much higher in the whole period than indices of HIIT and this applied generally to their trade with all partners. The observation was true also for Bulgaria and Romania, and the gap between VIIT and HIIT level for those two countries was much bigger. For the whole group of the EU-10 countries, the share of VIIT in their total trade was in 2007 almost two times higher than that of HIIT (33% and 17% respectively).
One of the developments in the intra-industry trade of the EU-10+2 countries in 2000-2007 is that in several of the EU-10 countries (but neither in Bulgaria nor in Romania), the increased indices of IIT (over 2000-2007) resulted almost totally from increment of HIIT, considered as a more advanced type of trade specialization, and not of VIIT. The most impressive contribution of HIIT increase was in Poland: from 8% to 23% in Poland’s total trade (while the VIIT index decreased from 31% to 28%).
The absolute level of all HIIT indices in all EU-10 is relatively low, but two countries: Poland and Slovenia recorded very high growth of HIIT indices in 2000-2007 (by almost 200% and 100% respectively! in their trade with all partners) and in 2007 achieved quite good performance of this type of specialization: in Slovenia – 26% and 23% in Poland.
When VIIT is deeper analyzed, it appears that this type of intra-industry trade was dominated usually by low quality products (exports of low quality products and imports of high quality products). At the same time, however, the share of high quality VIIT increased in all EU-10+2 countries in their total trade (in trade with the EU-15 this observation applied to all countries except for Estonia, Hungary, Poland, Slovenia and Bulgaria, thus countries with the highest shares of such products in 2000, except for Bulgaria). In several countries this growth was impressive (more than by 100% in the years 2000-2007!). Thus, over the years 2000-2007, the pattern of VIIT has improved in total trade of all countries of the group EU-10+2.
Changes in the pattern of intra-industry specialization were of different character in the case of intra-EU-10 countries’ trade and their trade with the EU-15. Increase of intra-industry trade among the EU-10 countries was mainly of vertical character while the levels of intra-industry trade of those countries with their major trading partners (i.e. EU-15) grew first of all in horizontally differentiated products. Substantial increase of HIIT intensity in the EU-10 countries’ trade with the EU-15 over the period 2000-2007 confirms better, than increase of total IIT intensity, the convergence process of the EU-10+2 with the EU-15 group.
It’s commonly accepted that FDI flows and related TNC’s activities belong to the major determinants of world trade flows in recent years. In relatively short time they have contributed to multiplying trade flows. One of the results is stronger internationalization of production on the world scale. The role of FDI in five new Member States of the UE (the Czech Republic, Hungary, Poland, Slovakia and Slovenia: EU-5) was analyzed in the automotive sector. Automotive sector was chosen to identify relations between FDI and IIT
30

because it is highly penetrated by FDI and a good candidate for IIT development (in developed countries it has been one of the engines of IIT growth).
Four countries with the highest indices of IIT in total trade 2007, i.e. Slovenia, the Czech Republic, Hungary and Poland recorded at the same time the highest indices of IIT in the automotive sector. At the same time, the latter indices outpaced much the total IIT indices (except for the Czech Republic, but the gap was there modest), meaning deeper specialization in automotive trade than in total trade.
The analysis has revealed that IIT in automotive sector was mainly (in some cases – almost exclusively) of vertical character, except for Slovenia and Poland in 2007. As this type of trade results often from intra-firm trade and is the evidence of big role of transnational corporations (TNCs), the automotive intra-industry trade in majority of the EU-5 countries seems to be driven by affiliates of TNCs.
In Poland and Slovenia, majority of IIT in automotive sector consisted, in recent years, of HIIT. Polish case shows that part of this trade (part of passenger cars’ trade) was not related to FDI as imports included relatively big portion of used cars. However, in Poland and in other countries, horizontal IIT accounted for increasing share of trade in automotive parts and components and majority of this trade was probably related to TNCs activities (including, among others, big exports of car engines and other parts produced in Poland and later assemblied in other countries, and imports of other automotive parts used for final production of other brands of cars produced in Poland).
Concluding, the above analysis seems to confirm positive relationship between FDI and IIT changes in the case of automotive sector. Countries with relatively highest foreign investments in the automotive sector (Hungary, the Czech Republic and Poland) record higher IIT indices in this sector than in total trade (recently, the exception has been the Czech Republic). In some NMS, intra-industry trade is mainly of vertical character. In some other countries, fast increase of horizontal intra-industry trade in the automotive sector has been recently recorded. This may be a natural evolution of trade specialization in new Member States, in line with their catching up process. Part of increasing HIIT is related to TNCs’ activities and part – probably not (e.g. exports of new cars from Poland and imports of used cars). Further research is necessary to establish better role of FDI in intra-industry trade development and production specialization changes.
31

10. Literature Abd-el-Rahman, K,. Firms’ Competitive and National Comparative Advantages as Joint Determinants of Trade Composition, Weltwirtschaftliches Archiv 127(1), 1991. Aturupane C., Djankov S., Hoekman B., Horizontal and vertical intra-industry trade between Eastern Europe and the European Union, Weltwirtschaftliches Archiv, vol. 135, No. 1, 1999. Balassa, B., Tariff reductions and Trade in Manufactures Among Industrial Countries, American Economic Review, vol. 56 (3), 1966. Černoša S., Horizontal and Vertical Intra-Industry Trade between the Former CEFTA Countries and the European Union, Managing Global Transitions, 2007, vol. 5, No. 2. A. Cieślik, Multinational firms and international fragmentation of production in Poland, in: Meeting Global Challenges, Working Papers of International Business, University of Gdańsk, Sopot 2008. Czarny E. Śledziewska K., Poland’s Intra-Industry Trade with the European Union at the Beginning of the 21th Century, in: Poland. Competitiveness Report 2008. Focus on Services, ed. by M.A. Weresa, World Economy Research Institute, Warsaw School of Economics, Warszawa 2008. Economy and Foreign Trade of Poland in 2006. edited by J. Przystupa, Institute for Market, Consumption and Business Cycles Research. Warsaw 2006. European Competitiveness Report 2004. Commission Staff Working Document SEC(2004) 1397. European Commission. Brussels. 2004. Falvey, R. Commercial policy and intra- industry trade, Journal of International Economics, 1981, 11(4). Falvey, R. and Kierzkowski, H. Product Quality, Intra-Industry Trade and (Im)Perfect Competition. in Kierzkowski, H. (ed.), Protection and Competition in International Trade, Oxford, Blackwell, 1987. Ferto I., Soos K.A., The development of Intra-Industry Trade between the European Union and European Former Communist Countries before the 2004 Enlargement, INDEUNIS Papers, Hungarian Academy of Sciences, Institute of Economics, February 2006. Fidrmuc, J., Grozea-Helmenstein D., Wörgötter A., Intra-Industry Trade Dynamics in the East-West Relations. Comparison of Austrian, Dutch, German, Italian and Swedish Trade with the CEEC, East European Series, No. 52, Institute for Advanced Studies, Vienna, December 1997. Finger, J. M., Trade Overlap and Intra-industry trade, Economic Inquiry 13, 1975. Flam, H. and Helpman, E., Vertical Product Differentiation and North-South Trade, American Economic Review, 76(5), 1987. Gacs J., The Economic Interpenetration between the EC and Eastern Europe: Hungary, European Economy 1994, No 6. Greenaway, D., Hine, R.C. and Milner, C., Country-Specific Factors and Pattern of Horizontal and Vertical Intra-industry Trade in the UK, Weltwirtschaftliches Archiv , vol. 130, 1994.
32

33
Grubel H.G., Lloyd P.J., Intra-Industry Trade: the Theory and Measurement of Intra-Industry Trade in Differentiated Products, London: Macmillan, 1975. Havik K., McMorrow K., Global Trade Integration and Outsourcing: How Well is the EU Coping with the New Challenges?. European Economy No. 259. European Commission, Directorate-General for Economic and Financial Affairs. October 2006. Helpman, E., International trade in the presence of product differentiation, economies of scale and monopolistic competition: A Chamberlin-Hecksher-Ohlin approach, Journal of International Economics, 11 (3), 1981. Heplman, E., Krugman, P., Market Structure and Foreign Trade, Harvester Wheatsheaf, Brighton, (1985). Hine R.C., Greenaway D., Milner Ch., Vertical and Horizontal Intra-Industry Trade: An Analysis of Country- and Industry-Specific Determinants, in: Intra-Industry Trade and Adjustment, Brülhart M., Hine R.C., Macmillan, London 1998. Hoekman B., Intra-Industry Trade, Foreign Direct Investment and the Reorientation of East European Exports, CEPR Discussion Paper, no. 1377, CEPR, London. 1996. Hunya G., Database on Foreign Direct Investment in Central, East and Southeast Europe, WIIW Vienna, June 2008. Intra-Industry and Intra-Firm trade and the Internationalization of Production, Economic Outlook No. 71. OECD, 2002. Kaminski B., How Accession to the European Union has Affected External Trade and Foreign Direct Investment in Central European Countries, Policy Research Working Paper, No. 2578. April 2001. Krugman, Paul R., Increasing Returns, Monopolistic Competition, and International Trade, Journal of International Economics 9, 1979. Krugman, Paul R., Scale Economies, Product differentiation, and the Pattern of Trade, American Economic Review 70, 1980. Lancaster, K., Intra-industry trade under perfect monopolistic competition, Journal of International Economics 10 (2), 1980. Loertscher R., Wolter F., Determinants of Intra-Industry Trade: Among Countries and across Industries, in: Weltwirtschaftliches Archiv, vol. 116/1980. Ruffin R.J., The Nature and Significance of Intra-Industry Trade”, Economic and Financial Review. Federal Reserve Bank of Dallas, Fourth Quarter 1999. Di Simone, G., Trade in Parts and Components and Central Eastern European Countries’ Industrial Geography, Department of Economics, University of Milan, May 2007. Tirpak M. The Automobile Industry in Central Europe. IMF. November 2006. Verdoorn, P. J., The Intra-Block Trade of Benelux, in E.A.G. Robinson (ed.), Economic Consequences of the Size of Nations, Macmillan, London, 1960.

Annexes Annex I.
Table 1. Indices of intra-industry trade of the EU-10 +2 countries with major trading groups of partners in 2000 and 2007 (%) IIT IIT vertical (low quality) IIT vertical (high quality) IIT horizontal World EU25 EU15 EU10 Other World EU25 EU15 EU10 Other World EU25 EU15 EU10 Other World EU25 EU15 EU10 Other
Cyprus 2000 15.2 13.2 12.9 3.3 10.3 10.8 9.3 9.0 1.8 6.9 1.6 1.7 1.8 1.5 1.5 2.8 2.1 2.1 0.0 1.9 2007 15.9 14.2 13.9 4.1 10.1 6.7 7.8 7.9 1.2 4.4 7.6 5.8 5.4 1.7 5.3 1.6 0.6 0.6 1.2 0.5 Czech R. 2000 50.8 53.2 49.2 41.7 24.6 27.7 29.6 28.7 11.4 11.5 10.8 10.5 10.0 11.9 9.0 12.3 13.1 10.5 18.4 4.1 2007 57.3 58.8 52.7 55.0 34.3 18.8 29.5 27.7 21.3 9.8 21.0 14.0 11.6 13.1 16.6 17.4 15.2 13.5 20.6 7.8 Estonia 2000 33.2 29.5 24.1 34.4 16.9 17.4 12.6 10.2 6.7 6.4 8.6 11.6 10.2 14.5 9.5 7.2 5.2 3.8 13.2 1.0 2007 50.4 42.6 33.6 44.0 45.9 15.5 18.7 18.0 17.7 5.5 17.7 15.7 10.0 19.1 11.1 17.2 8.2 5.5 7.3 29.2 Hungary 2000 44.1 40.7 38.4 33.7 22.4 17.2 17.2 17.8 7.8 10.3 16.9 14.4 14.4 12.8 8.3 10.0 9.1 6.2 13.1 3.9 2007 51.9 49.4 45.5 47.5 37.7 19.9 21.1 20.2 17.9 16.6 17.7 17.4 12.0 18.8 14.0 14.2 10.8 13.4 10.8 7.2 Lithuania 2000 26.7 23.3 17.7 24.8 20.4 10.7 11.1 8.9 10.2 9.6 8.6 6.1 4.7 8.5 7.6 7.4 6.1 4.1 6.1 3.2 2007 45.1 32.5 19.4 44.5 34.1 17.0 14.3 10.9 15.2 9.0 11.5 9.4 5.2 15.4 12.2 16.6 8.8 3.3 13.9 12.9 Latvia 2000 22.0 18.9 9.7 31.7 19.4 9.5 9.6 6.5 10.0 8.1 5.4 4.3 2.2 15.3 6.6 7.1 5.1 1.0 6.5 4.7 2007 44.0 35.8 18.2 46.4 33.4 21.6 25.3 12.9 34.4 8.6 13.4 5.1 2.5 6.5 18.9 9.0 5.4 2.8 5.5 5.9 Malta 2000 57.1 28.2 27.6 4.6 55.4 53.3 26.7 26.1 3.7 53.6 1.1 1.1 1.1 0.0 0.5 2.8 0.4 0.4 0.9 1.3 2007 16.9 16.3 16.1 8.6 10.5 3.5 2.9 2.6 0.5 2.8 12.2 12.8 12.6 7.2 6.6 1.1 0.5 1.0 0.9 1.2 Poland 2000 39.2 41.0 37.4 39.7 21.6 19.3 22.4 20.8 11.0 10.1 11.8 12.0 11.4 14.1 7.1 8.1 6.6 5.2 14.6 4.3 2007 50.8 49.9 44.9 48.8 34.8 15.7 16.7 16.2 12.1 9.9 12.4 11.7 9.9 18.4 14.2 22.8 21.4 18.8 18.3 10.7 Slovakia 2000 34.1 35.8 29.7 35.4 14.6 16.8 18.9 15.8 11.4 4.9 9.7 9.5 7.1 13.4 6.6 7.6 7.4 6.8 10.5 3.1 2007 40.7 42.9 35.2 48.8 17.5 12.4 14.8 15.0 20.5 5.2 19.4 20.1 14.7 20.2 9.1 8.8 8.0 5.4 8.1 3.3 Slovenia 2000 44.2 43.2 41.4 22.3 26.4 17.3 16.7 17.5 4.0 9.5 12.6 12.0 10.7 6.1 8.4 14.3 14.6 13.3 12.2 8.4 2007 57.5 47.6 44.0 33.7 35.9 17.2 23.6 17.1 16.3 14.9 14.5 9.8 9.5 7.3 16.1 25.8 14.2 17.5 10.1 4.9 EU-10 2000 41.9 41.8 38.3 36.6 23.1 20.4 21.4 20.4 10.3 11.6 11.9 11.3 10.8 12.5 7.4 9.6 9.1 7.1 13.8 4.1 2007 50.8 49.4 44.0 49.0 33.4 16.9 20.9 19.4 18.6 10.9 16.4 14.0 10.9 16.3 13.9 17.4 14.5 13.7 14.1 8.5 Bulgaria 2000 27.0 19.3 18.7 12.2 26.4 15.0 9.1 8.4 5.9 14.7 6.9 8.2 8.4 4.4 5.1 5.1 2.0 1.9 2.0 6.6 2007 32.3 28.5 28.3 17.6 26.9 14.1 13.7 14.6 9.6 7.4 9.5 8.0 7.7 4.9 6.9 8.8 6.8 6.1 3.1 12.6 Romania 2000 21.9 20.8 20.0 14.6 13.9 11.5 11.2 9.7 8.0 7.3 7.6 7.9 7.8 3.0 3.4 2.8 1.7 2.5 3.6 3.2 2007 32.8 32.5 31.0 25.7 24.0 14.7 15.9 16.7 14.6 8.4 10.6 9.9 9.6 5.8 7.5 7.5 6.8 4.7 5.3 8.2
34

35
Table 2. IIT indices of individual EU-15 countries in their mutual trade. 2000 2001 2002 2003 2004 2005 2006 2007 Austria 55.1 54.6 56.2 56.7 60.6 59.7 59.3 58.1 Belgium 63.1 62.9 64.8 65.3 65.6 65.3 65.1 65.5 Germany 63.8 64.6 65.7 66.2 65.6 64.7 65.1 64.9 Denmark 48.0 47.8 49.9 50.1 49.3 49.5 48.6 48.2 Spain 56.8 58.4 58.6 58.6 59.2 59.3 58.4 59.4 Finland 29.1 31.3 30.1 30.3 29.9 30.6 31.0 32.6 France 69.8 70.6 68.9 69.1 68.6 66.4 66.7 66.9 United Kingdom 60.8 56.7 55.1 57.3 58.5 57.0 54.0 58.8 Greece 15.2 15.5 16.2 17.2 18.3 19.4 19.3 19.5 Ireland 39.0 42.9 41.1 33.1 31.9 34.7 34.1 32.6 Italy 50.2 50.3 50.2 50.7 50.3 50.4 51.3 51.4 Luxembourg 33.3 37.9 37.9 37.0 32.6 29.9 33.9 32.9 Netherlands 58.9 57.0 60.5 60.4 58.5 54.4 55.6 58.7 Portugal 40.0 41.7 42.6 42.7 43.5 44.0 44.9 44.6 Sweden 48.6 49.1 50.1 50.7 51.3 51.3 52.9 54.3

Annex II. Table 1. Inward FDI stock in transport equipment* (in mln of euro) and % changes in 2001-2006
2001 2002 2003 2004 2005 2006 2007 2006/2001 change (in %) Czech Rep. 2 192.0 2 272.4 3 407.6 3 345.4 4 740.1 5 700.3 n.a. 260 Hungary 2 833.1 3 247.5 3 761.7 4 387.4 4 855.6 5 683.1 n.a. 201 Poland 2 421.7 2 280.3 2 760.5 4 465.1 4 975.4 5 692.1 n.a. 235 Slovakia 141.3 149.1 156.2 314.7 563.5 879.0 n.a. 623 Slovenia 127.6 54.4 124.9 197.3 256.1 271.2 n.a. 212 Lithuania 42.9 43.2 70.3 75.5 84.7 93.6 97.9 218 Latvia 2.0 3.0 1.2 7.9 12.7 15.1 19.5 735 Estonia 36.8 25.7 77.3 59.3 60.5 60.7 63.7 164 Bulgaria n.a. n.a. n.a. n.a. n.a. n.a. n.a. n.a. Romania n.a. n.a. 527.0 860.0 1112.0 1406.0 n.a. n.a.
Motor vehicles and other transport equipment", DM NACE (NACE 34 and 35) Source: Own calculations based on WIIW database
Table 2. Inward FDI stock in transport equipment* as % of total FDI inward stock
2001 2002 2003 2004 2005 2006 2007 Czech Rep. 7.1 6.2 9.5 8.0 9.2 9.4 n.a.Hungary 9.1 9.4 9.8 9.6 9.3 9.2 n.a.Poland 5.2 4.9 6.0 7.0 6.5 6.0 n.a.Slovakia 2.2 1.7 1.2 2.0 2.8 3.0 n.a.Slovenia 4.3 1.4 2.5 3.5 4.2 4.0 n.a.Lithuania 1.4 1.1 1.8 1.6 1.2 1.1 1.0Latvia 0.1 0.1 0.0 0.2 0.3 0.3 0.3Estonia 1.0 0.6 1.4 0.8 0.6 0.6 0.6Bulgaria n.a. n.a. n.a. n.a. n.a. n.a. n.a.Romania n.a. n.a. 5.5 5.7 5.1 4.1 n.a.*"Motor vehicles and other transport equipment". DM NACE (NACE 34 and 35) Source: Own calculations based on WIIW database
36

37