outlook 2020
TRANSCRIPT

OUTLOOK 2020
DSP EQUITY TEAM

2019, which otherwise would have been a flattish year going by the market returns till Sep’19, changed its track as the government announced a corporate tax cut which resulted in Nifty delivering ~ 13.5% (Source – MFIE) returns on a CY basis. Foreign fund flow also saw increased velocity since September and almost contributed ~50% (Source – Motilal Oswal research) of the total equity net flows for CY 2019.
2019 was indeed a bit challenging and perplexing from investor’s perspective. Anecdotally, most diversified investors investing across market capitalization failed to generate adequate returns because investing in top 15-20 names became the only sacred way of generating decent returns. GOOD QUALITY became the most used and abused word. Value kept becoming the value trap. Market levels lost all correlation with the real economy as we saw the lowest print on GDP growth while the market touched new highs.
Markets may have disappointed the wider participants on returns; however, on the positive side this market gets the credit for creating many experts / economists who can now very proficiently talk about the global economy including the US-China trade war, negative interest rates, geo-politics and what Indian government needs to do. As you see markets never disappoint anyone; either you become rich or wise!
Let us now reflect back to what we had said in our communication last year.
1. Continue to focus on building our research process: Most critical in an industry where passive funds threaten to usurp active managers. While the shift in India is nowhere near as pronounced as global trends, we recognize the need to be prepared for such an eventuality. Top quartile funds in the Indian mid cap and small cap space (including ours) have generated ~4-8% CAGR alpha over the benchmark in the last ten years, and we are constantly honing our research capabilities.
2. Focus on our philosophy and process despite Near-term volatility: Endure short-term turbulence for long-term gain.
3. Focus on companies: Focus on bottom-up company fundamentals over macros, such as elections, inflation, oil, currencies, GDP growth, etc.
We have taken few steps forward on all of these listed above. A lot of time has been spent towards sharpening an efficient research process and documenting investment philosophies. The research outcomes are being objectively measured and used in the analyst’s evaluation criteria. Our investment philosophy notes released thus far have been well appreciated by our clients for their simplicity and detail orientation. We continue to periodically review our philosophy and will share updates with investors. We are very happy to say that our approach has delivered quite satisfactory outcomes in 2019.
OUTLOOK 2020By Vinit Sambre

Return as on 31st Dec, 20181 Year Return
BenchmarkBenchmark
ReturnAlpha
DSP Equity Fund -7.4 Nifty 500 TRI -2.1 -5.3
DSP Equity Opportunities Fund -9.2 Nifty Large Midcap 250 TRI -5.1 -4.1
DSP Focus Fund -5.5 S&P BSE 200 TRI 0.8 -6.3
DSP Mid Cap Fund -10.1 Nifty Midcap 100 TRI -14.5 4.4
DSP Small Cap Fund -25.3 S&P BSE Small Cap TRI -22.8 -2.5
DSP Tax Saver Fund -7.6 Nifty 500 TRI -2.1 -5.5
DSP Top 100 Equity Fund -2.7 S&P BSE 100 TRI 2.6 -5.3
Source – MFIE, Return for regular plan and growth option are considered. Past performance may or may not be sustained in the future. For performance in SEBI prescribed format click here
Return as on 31st Dec, 20191 Year Return
BenchmarkBenchmark
ReturnAlpha
DSP Equity Fund 17.0 Nifty 500 TRI 9.0 8.1
DSP Equity Opportunities Fund 11.4 Nifty Large Midcap 250 TRI 6.0 5.4
DSP Focus Fund 18.0 S&P BSE 200 TRI 10.4 7.7
DSP Mid Cap Fund 9.2 Nifty Midcap 100 TRI -3.4 12.6
DSP Small Cap Fund 0.7 S&P BSE Small Cap TRI -5.9 6.6
DSP Tax Saver Fund 14.8 Nifty 500 TRI 9.0 5.9
DSP Top 100 Equity Fund 14.8 S&P BSE 100 TRI 10.9 3.9
Source – MFIE, Return for regular plan and growth option are considered. Past performance may or may not be sustained in the future. For performance in SEBI prescribed format click here
We recognize that 1 year is too early to judge and it is quite possible that our styles may underperform in some phase; however, our endeavor is to remain disciplined about our inputs and processes and keep focusing on improvement. As an additional step we have also taken up a major initiative in developing a strong data analytics platform so to institutionalize our winning processes.
OUTLOOK 2020

Long-Term Opportunities and Challenges
In our 2019 communication, we had spoken about our core long-term themes as given below.
Clearly, some of them might not have turned out exactly the way we anticipated but these continue to remain our core beliefs and is reflected in different proportions across our portfolios.
While we are confident of the themes mentioned above and our long-term positive view of the Indian markets, one data point which we are watching closely and are a bit worried about is the declining ROE trend of corporate India. Corporate India ROEs have fallen from 18.5% in FY09 to 11.9% in FY19 (Source – Motilal Oswal research). While there are valid arguments that the cost of capital has also fallen over time, the point that is worth noting is disruption in certain sectors which has led to excessive competition and loss of pricing power. Some examples are given below:
• Unhealthy competition from e-commerce players having excess capital to burn
• Telecom sector profit has fallen from 14,586 crs in FY10 to -21,412 crs in FY19 a massive 36,000 negative delta in profit (Source – Internal, Bloomberg. Nos taken for Bharti Airtel, Vodafone Idea and Reliance Communications). Remember, we are the country with lowest ARPUs in the world.
• Profit pools shifting from listed players to private unlisted companies for e.g. media business facing the onslaught from the likes of Netflix and other OTT platform as consumer habits change.
• Though at an early stage, rise of online retail led private labels are hurting growth and capital efficiency of listed apparel players.
• Finally, regulations hamper pricing power like price capping in case of pharmaceutical products.
OUTLOOK 2020

Due to these changes we see business cycles are becoming shorter and identifying a good long-term sustainable business is not as easy as it used to be 10-15 years back. This may be one of the reasons why few good businesses are richly valued today. These challenges don’t deter us and in-fact further bring about the importance of long-term alpha generating processes & philosophies, which we would like to be disciplined about.
Short-Term Outlook
Overall, global liquidity flow is likely to keep the equity markets buoyant in our view. We would ideally feel that the easy money which has chased financial assets across the world would have been better utilized if more productive assets could have got created globally as it would have created fundamental legs for longer and stronger equity rally. Hence, any pull back from easy money policy is a risk to the global equity markets.
In terms of other risks, we see no dearth of the same, be it US-China trade war issues, Brexit, slowing global growth, rise of income disparity, geopolitical tension, struggle to revive growth in India etc. All of these risks will ensure continuity of volatility and one way to cover some of these, especially the geopolitical risk, would be to allocate some portion of assets to gold.
For investors who are ready to look beyond these risks and are ready to allocate money for long-term, we urge them to consider the following investment avenues based on their risk appetite:
Investment Scenario Investment Avenue
Try to minimize fluctuationsDSP Dynamic Asset Allocation Fund
DSP Equity & Bond Fund
Long-Term Orientation + Try to take benefit of market correction
DSP Mid Cap Fund
DSP Small Cap Fund via SIP
Long-Term Orientation + Believe in large companies getting larger through market
share gain
DSP Top 100 Equity Fund
DSP Focus Fund
Long-Term Orientation + Undecided on allocation between large, mid and small
DSP Equity Fund
DSP Equity Opportunities Fund
Long-Term Orientation + Undecided on fund manager DSP Quant Fund
Remember, investors who had invested at the peak of 2008 rally didn’t make much return in the next ~6 years but are sitting on satisfactory gains today. Hence, it is always prudent to start investing today.
OUTLOOK 2020

FINANCIALS

FINANCIALS
OUTLOOK 2020
Banks
Within the lending space, we expect i) moderate credit growth, ii) stable margins, iii) improving asset quality trends which will result in improved profitability / return on assets albeit from a lower base. We believe large banks are better placed with strong core operating profitability, robust distribution franchise and healthy capital positions. Headline valuations for private banks appear rich; however, justified due to relatively better earnings visibility.
Industry Trends
Growth Outlook – We expect private lenders to continue gaining market share
Over the past four years while bank credit growth has remained subdued (exhibit below), we have seen private banks gain significant market share mainly driven by (a) retail lending and (b) rising share in large corporate lending as many PSU banks have been adversely impacted by weak capital positions and merger integration challenges.
Going forward, we expect bank credit growth to remain in 8-10% range for the next couple of years as (a) large corporates work on deleveraging and improving balance sheets, (b) wait for pick-up in capacity utilisation before planning for material private capex, and (c) witness some moderation in lending to NBFCs / HFCs off of a high base. Bank lending to NBFCs + other services segment (which mainly includes lending to HFCs) has increased from ~11% in Mar-16 to ~14.5% as of Nov-19. We continue to remain constructive on bank credit growth to retail segment with mid-high teens growth.
Asset Quality Outlook – Is the worst of asset quality behind us? – We believe the peak of the NPL cycle is behind us; however, the pace of decline may not be similar to past cycles
Headline non-performing loan data has peaked in our view with fresh additions moderating from the elevated levels seen in FY18. However, the pace of reduction is a function of recoveries which have been slower than expected especially after the implementation of
14
20 19
23
1517
33 32 31
25
21
17
23
1816 15
107
3
811
8 10
FY98
FY99
FY00
FY01
FY02
FY03
FY04
FY05
FY06
FY07
FY08
FY09
FY10
FY11
FY12
FY13
FY14
FY15
FY16
FY17
FY18
FY19 FY
2…FY
2…
Bank Credit Growth (%) Banking system Loan Market Share (%)
80 79 79 74 74 73 74 73 73 73 75 77 77 76 76 76 74 71 68 65 61 58 56
12 13 13 18 19 20 19 21 21 21 19 18 19 19 19 20 21 25 27 30 35 38 40
8 8 8 8 7 7 7 6 6 7 6 5 5 5 4 4 4 5 4 4 4 4 4
FY99
FY00
FY01
FY02
FY03
FY04
FY05
FY06
FY07
FY08
FY09
FY10
FY11
FY12
FY13
FY14
FY15
FY16
FY17
FY18
FY19
FY20
EFY
21E
PSU Banks Private Banks Foreign Banks
Source – RBI, DSP Investment Managers

FINANCIALS
OUTLOOK 2020
the Insolvency and Bankruptcy Code (IBC). Further reduction will be contingent on sizable resolutions within the infrastructure sector specifcally power; NBFCs; and the iron, steel and engineering sector. We remain less hopeful on resolutions with the construction sector, EPC players and large fraud / fund diversion cases. Overall recoveries in current cycle will not be higher than previously experienced level of 40-50%. Private banks are better placed in this context (exhibit below).
Valuation - Headline valuations appear expensive however, justified for relatively better earnings visibility
19.1
15.3
14.1
14.8
13.7
14.2
13.1
12.4
11.9
11.1
9.2
7.1
4.5
3.5
3.3 4.
8 6.3
5.4 7.
0 8.5 9.
8 11.1
11.5
12.1
12.4
11.3
9.7
9.3
FY94
FY95
FY96
FY97
FY98
FY99
FY00
FY01
FY02
FY03
FY04
FY05
FY06
FY07
FY08
FY09
FY10
FY11
FY12
FY13
FY14
FY15
FY16
FY17
FY18
1HFY
19
FY19
1HFY
20
Banking System Stressed Loans (%)
11.910.6
9.27.4
4.73.7 3.3
4.76.8 6.1
8.110.0
11.713.5 14.1
15.6 16.2 16.715.4
13.1 12.714.3
15.2
10.5
7.0
4.3 3.5 3.84.9 4.7
3.3 3.4 3.5 4.2 4.6 4.6 4.9 4.7 4.4 4.1 3.9 3.9
FY02
FY03
FY04
FY05
FY06
FY07
FY08
FY09
FY10
FY11
FY12
FY13
FY14
FY15
FY16
FY17
1HFY
18
FY18
1HFY
19
FY19
1HFY
20
PSB PB
Source – RBI, IBA;Note: PSB is public sector banks and PB is private banks; Stressed loans = Gross NPAs + Standard Restructured Advances
Stressed Loans (%)
1.0
1.5
2.0
2.5
3.0
3.5
Nov
-08
Sep-
09
Jul-1
0
May
-11
Mar
-12
Jan-
13
Nov
-13
Sep-
14
Jul-1
5
May
-16
Mar
-17
Jan-
18
Nov
-18
Sep-
19
Mean+1SD
Mean
Mean-1SD
Source – Morgan Stanley Research
Banking Sector 1yr Forward P/B (x) Private Banks 1yr Forward P/B (x)
1.3
Mar
-04
Mar
-05
Mar
-06
Mar
-07
Mar
-08
Mar
-09
Mar
-10
Mar
-11
Mar
-12
Mar
-13
Mar
-14
Mar
-15
Mar
-16
Mar
-17
Mar
-18
Mar
-19
0.81.01.21.41.61.82.02.22.42.62.8
FINANCIALS
OUTLOOK 2020
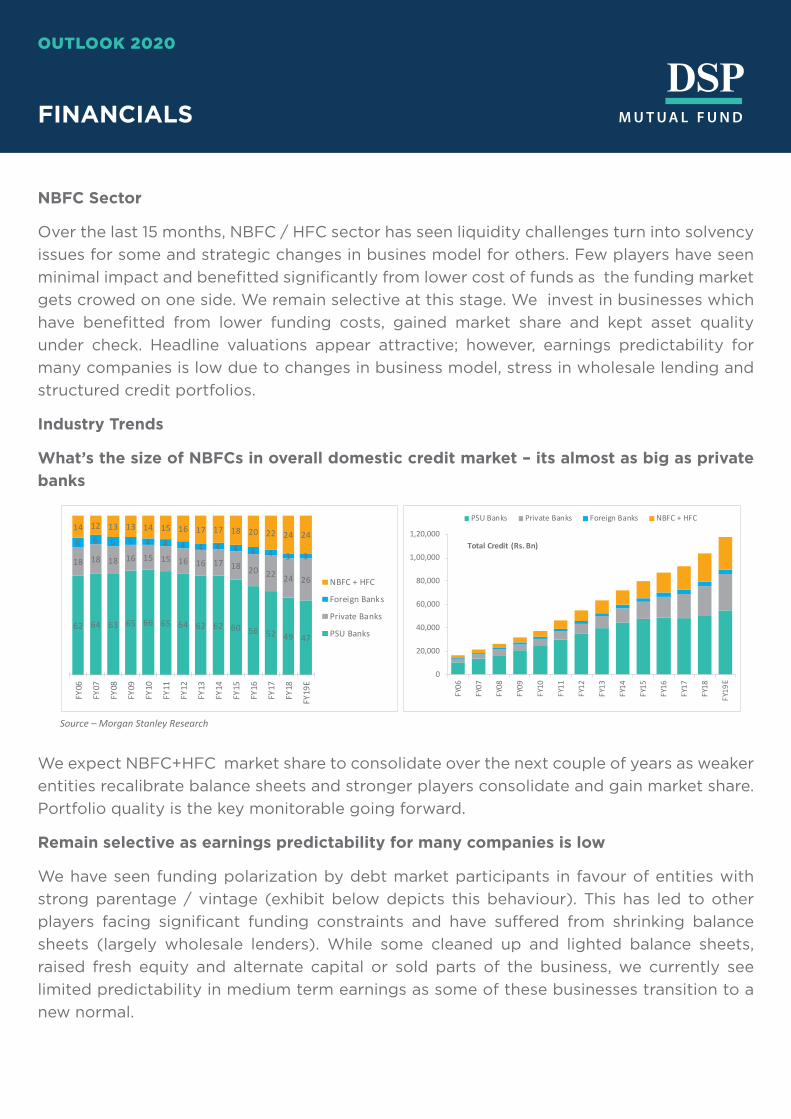
NBFC Sector
Over the last 15 months, NBFC / HFC sector has seen liquidity challenges turn into solvency issues for some and strategic changes in busines model for others. Few players have seen minimal impact and benefitted significantly from lower cost of funds as the funding market gets crowed on one side. We remain selective at this stage. We invest in businesses which have benefitted from lower funding costs, gained market share and kept asset quality under check. Headline valuations appear attractive; however, earnings predictability for many companies is low due to changes in business model, stress in wholesale lending and structured credit portfolios.
Industry Trends
What’s the size of NBFCs in overall domestic credit market – its almost as big as private banks
We expect NBFC+HFC market share to consolidate over the next couple of years as weaker entities recalibrate balance sheets and stronger players consolidate and gain market share. Portfolio quality is the key monitorable going forward.
Remain selective as earnings predictability for many companies is low
We have seen funding polarization by debt market participants in favour of entities with strong parentage / vintage (exhibit below depicts this behaviour). This has led to other players facing significant funding constraints and have suffered from shrinking balance sheets (largely wholesale lenders). While some cleaned up and lighted balance sheets, raised fresh equity and alternate capital or sold parts of the business, we currently see limited predictability in medium term earnings as some of these businesses transition to a new normal.
62 64 63 65 66 65 64 62 62 60 56 52 49 47
18 18 18 16 15 15 16 16 17 18 20 22 24 26
6 6 6 5 4 4 4 4 4 4 4 4 3 3
14 12 13 13 14 15 16 17 17 18 20 22 24 24
FY06
FY07
FY08
FY09
FY10
FY11
FY12
FY13
FY14
FY15
FY16
FY17
FY18
FY19
E
NBFC + HFC
Foreign Banks
Private Banks
PSU Banks
0
20,000
40,000
60,000
80,000
1,00,000
1,20,000
FY06
FY07
FY08
FY09
FY10
FY11
FY12
FY13
FY14
FY15
FY16
FY17
FY18
FY19
E
Total Credit (Rs. Bn)
PSU Banks Private Banks Foreign Banks NBFC + HFC
Source – Morgan Stanley Research

For NBFCs with access to funds, the key question will be avenues for growth in slowing economy. We remain biased towards businesses which have distribution advantages, funding cost advantages and have kept asset quality under check.
Insurance Sector
Within non-lending businesses, we remain very constructive on insurance businesses. Similar to banking sector, market share shift from PSU to private sector continues driving 15%+ new business premium growth and 20%+ earnings growth / value of new business (VoNB) growth. Regulatory changes in both life and general insurance on net basis have been favorable and hence, distribution franchise remains key for further market share gains. While valuation history is limited, we believe both segments are poised to deliver 20%+* earnings compounding for next three years.*Source – Internal
FINANCIALS
OUTLOOK 2020
32% 35% 38% 40% 44%38%
48% 45% 47%
30% 29% 28% 26% 23% 27% 29% 31% 33%
5%6%
6%
9% 10% 10%
3% 3% 3% 3%4%
5% 5%5% 4%
3%
4% 4% 4% 6% 13%13% 14%
15% 14%9%
8%11%
12%11% 18%
12% 14% 14%
19% 20% 20% 23%25%
34%36%
36% 35%56% 52%
47%42% 37% 34%
29% 29% 27%
44% 44% 44% 41%35%
21% 17% 14% 13%
0%
20%
40%
60%
80%
100%
201807 201808 201809 201812 201903 201906 201909 201910 201911 201807 201808 201809 201812 201903 201906 201909 201910 201911
Commercial Paper (Mix %) Debt other then Commercial Paper (Mix %)
HDFC Bajaj Housing HUDCO LICHF Others
Source – ACE MF, Morgan Stanley Research
Polariza�on in financing by mutual funds

CONSUMER STAPLES

CONSUMER STAPLES
OUTLOOK 2020
• Over the next year, rural growth is likely to show some signs of revival driven by government interventions, above average rainfall, good Rabi sowing season and higher inflation in agri commodities. This should lead to a pick-up in volume growth for FMCG companies over the next few quarters.
• Earnings growth expectations for most companies are now expected to be 8-10%, with mid-high single digit volume growth, supported by some margin improvement.
Long-Term Trends
• Size of the FMCG market in India is ~USD 72 bn (2018). Overall market is divided into Food & Beverages (~55% share), Home and Personal Care (~38% share), and Healthcare (~6%). The overall industry is expected to grow at ~10-12% over the next 10 years.
• Rural India which has ~67% of the overall population constitutes ~37% of the overall FMCG market. There is a significant growth potential led by rise in income levels and increased penetration. Urban India constitutes ~63% of the market. Premiumisation and increase in consumption are key growth drivers for the urban segment.
• General trade (unorganised retail, kirana stores) is the largest trade channel with ~87% share; however, modern trade channels (super-markets, grocery chains) have delivered robust growth over the last few years. Modern trade and e-commerce currently contribute ~11% and ~2%, respectively, of the overall industry.
Near-Term Trends
• Demand trends have steadily worsened for the sector over the last 6 months, primarily led by rural India. Rural growth has slowed from 1.5x urban growth to growing less than urban.
10.0% 9.8%
14.5% 14.5%12.7%
9.8%8.0%
13.5% 12.6%
20.0%18.5%
15.2%
10.3%
5.0%
1.4x
1.3x
1.4x1.3x
1.2x1.1x
0.6x
0.0x
0.2x
0.4x
0.6x
0.8x
1.0x
1.2x
1.4x
1.6x
0.0%
5.0%
10.0%
15.0%
20.0%
25.0%
1Q18 2Q18 3Q18 4Q18 1Q19 2Q19 3Q19
FMCG rural growth slowdown steeper than urban
Urban growth (LHS) Rural growth (LHS) Rural/Urban (RHS)
Source: Nielsen

• Larger companies have been relatively insulated, as smaller companies and unorganized players have been hit hard. Direct distribution is an advantage for the larger companies. Liquidity issues and higher channel inventory has further adversly impacted the smaller companies.
• Benign raw material inflation and an above average monsoon are the positive trends for the sector.
Valuation
Valuations are still above long-term average, but 15-20% below the peak levels seen in the last 1 year.
CONSUMER STAPLES
OUTLOOK 2020
10
20
30
40
50
60
70
Jan-
10
Jul-1
0
Jan-
11
Jul-1
1
Jan-
12
Jul-1
2
Jan-
13
Jul-1
3
Jan-
14
Jul-1
4
Jan-
15
Jul-1
5
Jan-
16
Jul-1
6
Jan-
17
Jul-1
7
Jan-
18
Jul-1
8
Jan-
19
Jul-1
9
Sector PE
Average
Max Min+1SD -1SD
Source: Internal
8.8% 8.5%
13.4% 12.0%10.0%
6.2%3.0%
2.8% 2.4%
3.1%3.8%
3.6%
3.8%
2.0%
0.0%2.0%4.0%6.0%8.0%
10.0%12.0%14.0%16.0%18.0%
1Q18 2Q18 3Q18 4Q18 1Q19 2Q19 3Q19
Overall FMCG Growth (Urban+Rural)
Volume growth Price growth
Source: Nielsen

AUTOMOBILES

AUTOMOBILES
OUTLOOK 2020
Marred by deceleration in economic growth and sector specific headwinds, 2019 was the worst year for automotive growth over the last two decades. Sector specific headwinds which intensified the slowdown include:
• Low risk appetite by financiers, especially NBFCs, which led to lack of financing to the less credit worthy. NBFCs have actively slowed down on disbursements.
• The possibility of a cut in GST rates for vehicles deferred purchases.
• Confusion in the mind of potential buyers over the advantages and implications (price, life, technological differences, potential discounts etc.) relating to the transition from BS4 norms to BS6.
However, we are noticing some green shoots:
• The Government has tried to resolve stress/liquidity/sentiments in the system. These measures include corporate tax rate cuts, quick GST refunds, commitment to pay infra bills on time, capital infusion in PSBs and ensuring the transmission of rate cuts in the monetary policy to consumers. Also, there has been some stability/improvement in liquidity amongst financiers which has started showing an improvement in retail sales and lower channel inventory.
35%39%
12% 9%
17%
-10%-20%
-10%
0%
10%
20%
30%
40%
50%
Q1FY19 Q2FY19 Q3FY19 Q4FY19 Q1FY20 Q2FY20
Annual disbursement growth rate
Source – Companies, Annual data for 7 NBFCs are taken into consideration for the purpose of the above calculation.

AUTOMOBILES
OUTLOOK 2020
Maruti’s recent retail sales growth has significantly improved Over H1FY20
• More clarity on emission norms and GST rates (no cuts).
• The last major hurdle which now remains to be crossed is the switchover to the BS6 emission norms in April 2020, which will lead to increase in vehicle prices. Mass market two-wheelers and commercial vehicles will see the highest increase in vehicle prices. We expect passenger car and selected auto component companies to do relatively better in the early part of the cyclical recovery.
0
20000
40000
60000
80000
100000
120000
140000
160000
180000
200000
-40
-30
-20
-10
0
10
20
Maru� Dealer Inventory (RHS) Maru� Retail YOY Growth (%)
Source – Company.
0%
2%
4%
6%
8%
10%
12%
14%
16%
2W PV petrol PV diesel LCV diesel MHCV diesel
Price hike for BS6 products Price increase (%)
Source – Companies.

AUTOMOBILES
OUTLOOK 2020
Beyond 2020: Cyclical Recovery, Strong Fundamentals
The worst seems to be behind us and FY21 should be better than FY20 with low to mid-single digit growth versus a double digit decline. FY22-23 should be even better for automotive demand and stock prices as we expect:
• Price hikes of the recent past (costs to comply with stricter emission, safety and other regulatory norms), to get absorbed with salary/wage growth over the period
• Latent demand to kick in
• Various headwinds mentioned above, to recede further, as the macro environment improves
Both the two-wheeler and passenger vehicles market in India have grown at a 9% CAGR over FY05-19. Both these segments are expected to end FY20 with a double digit decline. PVs with just a 10% household penetration have significant headroom for growth. We expect ~12% CAGR over FY20-23 for PVs. Two-wheelers, with 52% household penetration, should grow at a slower pace of ~7% over FY20-23. The sector is a play on the demographic dividends of India with the structural drivers of higher penetration, increasing premiumization and a cyclical recovery.
With the top 4 players accounting for more than 70% of market share for both 2w/PVs, competitive intensity is modest. Generally, Auto Sector ROEs have historically been above that of the broader market and this is a testimony to the strong fundamentals of the sector.
24.6
24.7
37.6
37.0
34.5
27.2
25.1
22.3
24.3
23.0
21.5
19.3
20.7
16.1
14.9
17.0
16.3
16.2
15.4
14.9
13.2
13.6
12.9
12.5
FY 0
8
FY 0
9
FY 1
0
FY 1
1
FY 1
2
FY13
FY14
FY15
FY16
FY17
FY18
FY19
Auto (Ex TTMT) RoE % Ni�y RoE (%)
*Excluding Tata Motors. Source – Motilal Oswal Research

AUTOMOBILES
OUTLOOK 2020
Valuation
Stocks in the sector are still significantly off their 2018 peaks, driven by lower volumes, consequent operating deleverage and multiple de-rating; mean reversion upon reversal of trend could provide upside potential. We expect select auto component players to benefit from the eventual revival in demand, increased geographic presence, diversification into new customers and an increasing trend of premium features in a typical automobile.
Valuations, as seen in trailing P/BV (good metric to compare vs previous down cycles) is quite enticing.
3.6
814.9
0.0
400.0
800.0
1,200.0
3.0
4.0
5.0
6.0
7.0
Dec-
09
Mar
-11
Jun-
12
Sep-
13
Dec-
14
Mar
-16
Jun-
17
Sep-
18
Dec-
19
PB (x) - LHS Automobiles Index
*Excluding Tata Motors. Source – Motilal Oswal Research
Trailing P/BV

BUILDING MATERIALS

BUILDING MATERIALS
OUTLOOK 2020
Cement
After a 6%/13% growth in volumes in FY18 /19, FY20 cement industry volumes are likely to end with a flattish YoY growth, impacted by slowdown in government infrastructure spending and weak household demand in both urban and rural markets.
We don’t expect much improvement from infrastructure spending (given weak government finances) or from urban real estate (developers are not yet out of the woods). However, a good monsoon may help rural household demand, which will help the industry post a mid-single digit growth in CY 2020.
However, what keeps us moderately positive on the sector:
• Prices of inputs like pet coke, coal and diesel have been favourable keeping costs under control, thus aiding operating margins
• Key players are either in capacity expansion mode or have leverage balance sheet – this scenario should help maintain pricing discipline in an otherwise modest year
• Consolidation through M&A which had led weak and desperate players like JP Associates, Reliance Cement, Binani Cement to be taken over by stronger hands, which also augurs well for the medium term
Beyond 2020: Cement Sector Slowly Finding its Feet
Cement demand is expected to grow at 7% CAGR, led by infrastructure development (roads, irrigation, metros, etc) across the country. Historically, the sector has grown at 1.1x of real GDP growth. With moderate additions in capacity (~4% CAGR) and a projected 7% demand CAGR, we expect the ~75% industry capacity utilization to gradually (by FY24) inch towards the desirable level of 85%+. As a result, sector ROEs which have been stagnant at <10%, are expected to inch up only gradually.
50%
55%
60%
65%
70%
75%
80%
85%
90%
95%
F05 F06 F07 F08 F09 F10 F11 F12 F13 F14 F15 F16 F17 F18 F19 F20E F21E F22E
Capacity u�liza�on (gross)
Source – DIPP, Industry sources and company announcements
Gross Capacity U�liza�on
0
5
10
15
20
25
30
35
40
45
F10 F11 F12 F13 F14 F15 F16 F17 F18 F19 F20E F21E F22E
Supply addi�on con�nues (in metric tonne)
Incremental Supply Incremental demand
Source – Industry Sources

Some trends which will positively impact the sector in the medium term are:
• Slowdown in new clinker capacities since the MMRD Act of 2015 after which acquisition of limestone assets has become much more expensive, has slowed down greenfield expansions
• Several announced expansions have either been gotten delayed or mothballed due to weak sector RoEs, currently at ~10%. Moreover, time and costs to acquire land have also increased significantly from the past, making it difficult and expensive to set up greenfield capacities.
• Sector consolidation and market share gains by the six largest cement companies in India also bodes well for the long-term sector pricing and margin outlook in our view.
All this makes us only moderately positive on the sector.
1995 2005 2015 2019Capacity Share of Top 5 32% 57% 50% ~60%
Source – Industry Sources
Cement Valuation
Given that FY20 volumes have not grown YoY and as profitability and ROEs have remained weak over a long period of time, the sector has de-rated and is available at valuations which are beginning to show pockets of value.
BUILDING MATERIALS
OUTLOOK 2020
5.07.09.0
11.013.015.017.019.0
Dec-
14
Dec-
15
Dec-
16
Dec-
17
Dec-
18
Dec-
19
EV/EBITDA (x) Max (x) Min(x) Avg (x)
Source – Motilal Oswal Research
10.6%
11.0%
9.8%
9.1%
7.9%
10.2%
7.0%
7.5%
8.0%
8.5%
9.0%
9.5%
10.0%
10.5%
11.0%
11.5%
12.0%
FY15 FY16 FY17 FY18 FY19 FY20E
RoE (%)
Source – Motilal Oswal Research

Tiles
Demand for tiles in CY19 was adversely impacted by the slowdown in new home construction, a key demand driver for tiles. We expect demand in CY20 to gradually improve in line with housing demand. Thus, demand improvement coupled with slowdown in supply additions in CY20 should improve demand supply equilibrium resulting in margin improvement for industry. The recent ban on coal gasifiers has increased the cost of production for unorganised players. This should benefit organised players as their pricing differential with the unorganised players has narrowed. We strongly believe that organised players who have strengthened their distribution over last 12-24 months with strict control on working capital will continue to see market share gains.
Pipes
The total pipe industry is pegged to be at Rs280-300 bn with top 5 players constituting about 33% of market*. The unorganised segment constitutes 30% of the overall market. We believe that underlying growth in the pipe segment will be healthy in the medium term due to sustenance of healthy growth in non agri demand and stable growth in agri pipes. The margin profile for most players should improve led by higher growth in non agri segment due to market share gains from unorganised players and provisional anti-dumping duty on China and Korea.
*Source – Management, Industry
BUILDING MATERIALS
OUTLOOK 2020

INFORMATIONTECHNOLOGY

INFORMATION TECHNOLOGY
OUTLOOK 2020
• IT spends in CY2018 benefited from US tax cuts and also from deal closures after a lull period since late-2016.
• Earnings upgrades due to increased growth and currency-led gains are largely behind us. Incrementally, there could be risks to consensus earnings estimates for the next year.
• The bottom-up outlook for companies in the sector is not very bright, with most companies seeing mid-single digit earnings growth. We expect to see heightened news flow around immigration and visa issues in the run-up to US Presdential elections.
• However, given the extremely weak context of other domestic cyclical sectors, this sector becomes a relative safe zone in portfolios.
Long-Term Trends
• Global enterprise IT spend is USD 1500 bn, of which outsourced spend is USD 990 bn. The market share of Indian IT globally has grown from ~1.5% in 2000 to ~12% in 2018, but the pace of gains has been steadily declining.
• Indian IT players face competition from multitude of players. While they have been gaining share from legacy enterprise IT players, they have been facing stiff competition from i) MNC IT services players who have built a strong global delivery networks, ii) consulting firms whose relevance has increased in this phase of digital transformation, iii) and pure-play digital services providers.
• The nature of enterprise IT spend has been changing. New areas, (like cloud, mobility, etc.) commonly referred to as “digital,” are growing strongly at 15-20%; however, at the expense of traditional spend areas.
(5.0)
-
5.0
10.0
15.0
20.0
25.0
30.0
35.0
40.0
2001 2002 2003 2004 2005 2006 2007 2008 2009 2010 2011 2012 2013 2014 2015 2016 2017 2018
World IT spending growth (%)Indian IT exports growth (%)
Source: Gartner, NASSCOM, Kotak

INFORMATION TECHNOLOGY
OUTLOOK 2020
• We have seen significant changes in immigration policies of different countries where Indian IT players operate. As a result, companies have had to increase their local presence and reduce their dependence on visas. This has led to higher employee costs and lower margins.
Near-Term Trends
• Constant currency YoY revenue growth peaked in Q4FY19. Revenues have begun to fall from Q1FY20 and are expected to slow down further in Q3-Q4 FY20.
• Large segments like BFSI and retail (~50% exposure for most companies) continue to remain weak impacting overall IT growth rates.
• Deal momentum has been reasonably strong for the last few quarters, but we would expect some slowdown in large deals due to impending US Presidental elections.
Valuation
10
12
14
16
18
20
22
24
Jan-10
Apr-1
0Jul
-10Oc
t-10
Jan-11
Apr-1
1Jul
-11Oc
t-11
Jan-12
Apr-1
2Jul
-12Oc
t-12
Jan-13
Apr-1
3Jul
-13Oc
t-13
Jan-14
Apr-1
4Jul
-14Oc
t-14
Jan-15
Apr-1
5Jul
-15Oc
t-15
Jan-16
Apr-1
6Jul
-16Oc
t-16
Jan-17
Apr-1
7Jul
-17Oc
t-17
Jan-18
Apr-1
8Jul
-18Oc
t-18
Jan-19
Apr-1
9Jul
-19Oc
t-19
Source: Internal
Sector PE Average Max Min +1SD -1SD
13.2%
12.1%
9.7%
10.6%10.6%
8.4% 8.7%
7.9%
6.7%6.3% 6.4% 6.3%
7.2%
9.4%
10.9%
11.9%
11.0%10.4%
6.0%
7.0%
8.0%
9.0%
10.0%
11.0%
12.0%
13.0%
14.0%CC revenue growth peaked in Q4FY19
Source: Internal. Chart is based on the CC revenue growth YoY of TCS, Infosys, HCL Tech and Wipro that disclose their Constant Currency YoY growth trends on a quarterly basis.

OIL & GAS

OIL & GAS
OUTLOOK 2020
By the end of 2019, sector players announced massive disinvestments, private stake sales and significant increase in domestic gas production. Sector dynamics in 2020 will be determined by these events should they occur.
Trends Playing Out in the Sector
• Refining margins to remain under pressure
Pollution concerns are increasing both internationally and domestically. Globally, the International Maritime Organization banned ships from using polluting fuels with high sulphur content, which took effect from 1 January 2020. Expectations across the world were that this would create demand for diesel (which would be compliant with emission norms) and reduce demand for fuel oil (which is not compliant). Over the last few months though, low sulphur fuel oil (LSFO) inventories had been built up by refineries, which is now being used by ships instead of high sulphur fuel oil or diesel. This reduced expectations of gross refining margins (GRMs) of refiners going up because of high diesel demand. This coupled with significant refining capacity additions globally, and muted demand growth for diesel from other sources too, leads to a view that refining margins are going to remain under pressure for the year.
• Natural gas sector to continue to show high growth
Pollution worries domestically have led the Government to push usage of natural gas instead of polluting alternative fuels, which has benefitted City Gas Distribution (CGD) players. The Government targets to transform India’s primary energy mix by taking natural gas from 6.2% now to 15% by 2030. While new geographical areas will take a few years to develop and start consuming volumes, the existing ones are past their high growth phase and we will see the growth peaking or stabilizing. Substantial increase in domestic gas production expected in the coming years starting from 2020 can be a key positive determinant for the gas sector in India, benefitting gas producers.

• Market share shuffle in the oil marketing segment
In the oil marketing segment, market share will shift from public to private. Currently ~90% market share is held by Oil PSU’s. With one of them getting privatized, around 21% market share will shift to private. A significant private player also plans to invest in new fuel outlets which plans to increase the number of outlets from 1500 to 5500, thus leading to higher market share by private players. This will increase competition on both pricing and efficiency.
Marketing margins after deregulation of pricing in diesel (2014) and petrol (2010) have remained strong and are improving. With increasing private competition, there should be some pressure on marketing margins. However, the risk of futher price regulation will decline.
• Weak domestic and global demand to keep oil range bound
Oil demand globally has seen softness throughout 2019. We saw multiple downward revisions in oil demand growth forecasts from international agencies such as IEA, EIA and OPEC, on the back of the economic slowdown and the US/China Trade war. Domestically, oil demand remained weak for the year. Diesel demand in the country has grown by 1.7% YTD as against an average of ~5% in the last 3 years.
Going forward, the US/China trade war is becoming less of a worry as tensions have reduced. However, we have oil oversupply and weak demand projections going into 2020. A range bound oil price between $55 and $65 per barrel can be favourable for a country like India that has ~85% import dependence for its oil requirements. Current global scenario indicates that oil should remain within the favorable range during the year.
OIL & GAS
OUTLOOK 2020
-
1.0
2.0
3.0
4.0
5.0
6.0
FY11
FY12
FY13
FY14
FY15
FY16
FY17
FY18
FY19
FY20
E
Marke�ng Margin (INR/litre)
Figure 1: Marketing Margin trend for Oil Marketing CompaniesSource: Motilal Oswal Research, Company Data

In the natural gas sector, an oversupply in the global market is expected for most of 2020, with multiple new projects in the commissioning stage and large players increasing output targets. This would mean lower prices for gas which would make imported LNG cheaper. The country’s LNG import terminal capacity is also set to increase during 2020. This, along with increased domestic production indicates a gas oversupply situation within the country. It will put the existing LNG terminals under pressure to function at desired utilisation levels. In a market where domestically produced gas will be available at cheaper rates than ongoing imported gas prices, LNG demand will face further pressure. Government policies around gas utilization in the country will drive demand growth in various gas consuming sectors like CGDs, fertilizer and power.
Summary
Cause Effect Beneficiaries
Weak global oil demand Expected oil prices between US$55 and US$65
All oil companies
Domestic gas production Increased gas usage in the country
Gas producers
BPCL privatisation and RIL fuel outlets expansion
Shifting of market share from public to private
Private players. But margins may see pressure due to increased competition
OIL & GAS
OUTLOOK 2020

OIL & GAS
OUTLOOK 2020
Valuation
The sector as a whole is currently trading at near historically low valuations, despite ROEs being at above average levels. With capital expenditure cycles largely behind us on the OMC space, high growth visibility in the natural gas space and upcoming domestic production in E&P space, we expect some rerating in the sector to occur.
5.7
6.7
8.8
5.3
7.4
6.0
4.0
6.0
8.0
10.0
Dec-
09
Mar
-11
Jun-
12
Sep-
13
Dec-
14
Mar
-16
Jun-
17
Sep-
18
Dec-
19
Figure 2: EV/EBITDA ValuationsSource: Motilal Oswal Research
EV / EBITDA (x)Avg (x)
Max (x) Min (x)+1SD -1SD
14%13%
16%
10%
15%
12%
8%
10%
12%
14%
16%
18%
Dec-
09
Mar
-11
Jun-
12
Sep-
13
Dec-
14
Mar
-16
Jun-
17
Sep-
18
Dec-
19
Figure 3: ROE TrendsSource: Motilal Oswal Research
ROE (%)Avg (%)
Max (%) Min (x)+1SD -1SD

CAPITAL GOODS/INFRASTRUCTURE

CAPITAL GOODS/INFRASTRUCTURE
OUTLOOK 2020
Government Capex
• Government has highlighted significant pickup in capex from Rs 51 trn over FY14-19 to Rs 100 trn over FY20-25 in the National Infrastructure Pipeline (NIP)
• FY21 government spending to grow by 43% from Rs 8trn in FY20
• The Rs 100 trn target seems optimistic and could see some slippage given the lack of fiscal headroom
• We expect government spending growth to be in-line with nominal GDP growth rate in FY21 to Rs 8.9 trn from Rs 8 trn in FY20. However, this is contingent on pickup in tax revenues and faster execution of the current orders.
As Government resources remain constrained, the push to increase private participation in the infrastructure spending continues. We expect sovereign wealth funds and pension funds to continue to buy commissioned assets which will help developers to deleverage and start participating in new viable projects.Source – National Infrastructure Pipeline Presentation.
Key priority sectors for Government spending in FY21 will continue to be Roads (Rs 6 trn in Bharatmala program till FY23), Railways (Rs 1.4 trn p.a. capex of Indian Railways, additional spending being planned on high speed rail), Urban Infra (Rs 16 trn capex planned from FY20-25 which will include metro rail projects, affordable housing and smart cities) and Irrigation (Rs 7.7 trn planned over FY20-25).
Within the infra space we prefer companies with a track record of strong execution, strong
working capital mamagement and low leverage.
Near-Term Trends - Government Capex
In FY20 investment announcements by the Government and private companies have reduced significantly which is a key driver of future growth. In 9MFY20, Central Government spending (FY19 spending of Rs 3.8 trn on Infra) grew by 13%. Due to lower than expected tax collections, the Government is planning to cut the expenditures in the remaining period thereby reducing the spending growth to 7% for FY20.

CAPITAL GOODS/INFRASTRUCTURE
OUTLOOK 2020
Project Announcements
Spending growth by key states (FY19 spending of Rs 3.7 trn on Infra) has been impacted with only 2.3% growth in 1HFY20 which will result in lower growth for the full year. Change of government in states like AP and Maharashtra had a significant impact on new orders and execution of current orders.
Private Capex
We expect private capex to remain muted in FY21 as companies continue to focus on efficiency improvements and increased automation given the weak demand environment. We don’t expect a turnaround in large capex intensive sectors like cement, steel and power generation. We believe a pickup in private capex is still 1-2 years away.
Working capital improvement is likely to be gradual over the course of the year as payments from central and state agencies commence.
We prefer companies ahead in the technology curve in terms of digitalization and process automation. Access to future technologies along with domain knowledge is the key to success in the next capex cycle.
Near-Term Trends - Private Capex
Manufacturing capacity utilization (CU) reached a new low. CU in Sep-19 was 68.9%, below 70% for the first time since the RBI started publishing this data (Jun-08).
0
10
20
30
40
Jun
-07
Dec-
07
Jun-
08
Dec-
08
Jun-
09
Dec-
09
Jun-
10
Dec-
10
Jun-
11
Dec-
11
Jun-
12
Dec-
12
Jun-
13
Dec-
13
Jun-
14
Dec-
14
Jun-
15
Dec-
15
Jun-
16
Dec-
16
Jun-
17
Dec-
17
Jun-
18
Dec-
18
Jun-
19
Source: CMIE,RBI
Centre State Private

While government took the bold step of lowering corporate tax rates in Sep-19, it could not revive private capex due to the overall weak demand environment. Extreme pessimism has led to private capex being pushed out by another 1-2 years. In 1HFY20, capex by private companies has been flat.
Valuation
The BSE Cap Goods index is trading within the 1 standard deviation band below the long-term average while the BSE Infra Index is trading 1 standard deviation below the average.
CAPITAL GOODS/INFRASTRUCTURE
OUTLOOK 2020
68.90
73.63
65
67
69
71
73
75
77
79
81
83
Mar
-09
Aug-
09Ja
n-10
Jun-
10N
ov-1
0Ap
r-11
Sep-
11Fe
b-12
Jul-1
2De
c-12
May
-13
Oct
-13
Mar
-14
Aug-
14Ja
n-15
Jun-
15N
ov-1
5Ap
r-16
Sep-
16Fe
b-17
Jul-1
7De
c-17
May
-18
Oct
-18
Mar
-19
Aug-
19
OBICUS: RBI: Capacity U�lisa�on trailing 4 Q
Source: RBI Survey
Avg, 20.7
0
5
10
15
20
25
30
35
40
Aug-
05Fe
b-06
Aug-
06Fe
b-07
Aug-
07Fe
b-08
Aug-
08M
ar-0
9Se
p-09
Mar
-10
Sep-
10M
ar-1
1Se
p-11
Mar
-12
Oct
-12
Apr-1
3O
ct-1
3Ap
r-14
Oct
-14
Apr-1
5O
ct-1
5M
ay-1
6N
ov-1
6M
ay-1
7N
ov-1
7M
ay-1
8N
ov-1
8M
ay-1
9De
c-19
Source: Bloomberg
Avg, 12.5
5
10
15
20
Jul-1
5
Oct
-15
Jan-
16
Apr-1
6
Jul-1
6
Oct
-16
Jan-
17
May
-17
Aug-
17
Nov
-17
Feb-
18
May
-18
Aug-
18
Nov
-18
Feb-
19
Jun-
19
Sep-
19
Dec-
19
Source: Bloomberg
BSE Cap Goods Index Forward PE BSE Infra Index Forward PE
BSETCG 12 month forward PE Avg+1sd -1sd
SPBSINIP 12 month forward PE Avg+1sd -1sd

PHARMACEUTICALS

PHARMACEUTIALS
OUTLOOK 2020
Export Oriented Pharma
• Price erosion in US bottoming out: Recent quarterly results and management commentary indicate that for a majority of the pharma companies price erosion in the US market has settled to sub 5% from 15%-20% over the last two years. In some instances, companies have been able to increase price due to disruption of supply from Chinese and/or American players. We expect price erosion in US to remain at low to mid-single digits.
• US buyers not bargaining for lower prices: Buyer consortiums in US have shifted from squeezing suppliers for price to ensuring consistency of supply at a reasonable price. We believe that companies, which maintain consistency and quality of supply to US could demand better pricing vs. peers.
• Growth in base business sales in US: The US base business for larger pharma companies has shown growth over the past 4 quarters vs double digit declines in the past 2-3 years.
• USFDA events are less intensive than earlier: While number of warning letters remain elevated, the severity of the issues at hand have come down. Hence the financial impact of such adverse USFDA events has declined. We anticipate that most companies will be able to resolve the USFDA issues over the next few quarters.
Domestic Pharma
• Growth in domestic market: The Indian market has stabilized over 2 years. The impact of disruptions such as fixed dose combination bans and GST implementation have already been incurred. We expect the domestic market to maintain a growth trajectory of low double digits.
1,300
1,350
1,400
1,450
1,500
1,550
3Q18 4Q18 1Q19 2Q19 3Q19 4Q19 1Q20 2Q20
US base business sales for large cap India pharma (USD mn)
Source - Company. Includes Sun Pharma, Lupin, DRL, Cadila, Aurobindo and Cipla.

• Domestic pharma companies with a reasonable exposure to exports likely to do well vs export focused pharma companies: Most export focused pharma companies (mostly large caps) gained material market share in US in early part of the last decade. Given the benign growth in the US market, companies with a large base of US sales will see muted growth. Most large caps have a large base in US with sales ranging between USD500mn to USD1,500mn. On the other hand, domestic focused companies with investments in US (mostly small and midcaps) have sales ranging from zero to USD100mn. These companies could manage to grow even in a challenging environment given the small base.
• RoE to improve as capex declines and opex is rationalized: Return on Equity for most companies improved in 1HFY20 vs FY19. Drivers of improvement have been cost rationalization, lower capex and growth in revenues (both domestic and exports). We expect that the RoE of the sector would rebound to mid-teens from current high single digits over the next few quarters.
• Complex generics unlikely to yield high RoE: Moreover, all large pharma companies have invested heavily in complex generics in the hope of sustainable and profitable cash flows. However, given a limited basket of complex generic products in US, coupled with an abandance of players in the space, the competitive landscape could moderate the expected RoE from such investments.
The plain vanilla generic space has seen a contraction in supply due to exits from large players becuase of price declines. This contraction in supply currently presents an opportunity for the smaller companies to gain market share and grow their US presence.
Key Long-Term Trends
• Pharma led in FY09-15 and then lagged in FY16-19: The story of Indian Pharma companies can be broken down into two periods (FY09 to FY15) and (FY16 to FY19). Below is the performance of BSE Healthcare Index vs broad based Nifty 50 Index.
From FY09 to FY15, the BSE Healthcare Index outperformed the Nifty 50 consistently. The story reversed from FY16 to FY19.
PHARMACEUTICALS
OUTLOOK 2020
-35%
75%
12%
-8%
9%19%
28%
-8%
20%12% 16%
-25%
90%
14% 11%22% 27%
72%
-12%
1%
-14%
10%
-60%
-40%
-20%
0%
20%
40%
60%
80%
100%
FY09 FY10 FY11 FY12 FY13 FY14 FY15 FY16 FY17 FY18 FY19
Ni�y 50 TRI S&P BSE HC TRI
Source – MFIE. It is not possible to invest directly in an index. Above mentioned figures do not in any manner indicate the returns/performance of any Scheme of DSP Mutaul Fund.

• US exports were responsible for the declining stock prices: Listed companies in the Pharma space in India have either a domestic or an export business or a combination of both. The domestic Indian businesses have witnessed secular growth from FY09 to FY19 as depicted in the flat ROE line in the chart below. However, the declining ROEs of export oriented businesses resulted in stock declines from FY16-19.
• What led to the decline in US business?: a) Market consolidation with the top-3 buyers of generic drugs controlling ~91% of the market vs. 48% of the market earlier resulting in pricing pressure and price erosion for sellers of generic drugs (including Indian pharma companies); b) ROE of Indian companies are under pressure as most of these players used domestic cash flow to subsidize US business; c) Several Indian companies saw their plants coming under Warning letter. Cumulative 62 in 5 year period from CY15-19.
PHARMACEUTICALS
OUTLOOK 2020
10%
12%
14%
16%
18%
20%
22%
24%
26%
28%
FY09 FY10 FY11 FY12 FY13 FY14 FY15 FY16 FY17 FY18 FY19
RoE- MNC RoE - Export-oriented cos
Source – Bloomberg. Export oriented companies include Sun Pharma, Aurobindo Pharma , Dr. Reddys, Cipla, Lupin and Cadilla.Domestic oriented companies include Glaxo, Abbott, Sanofi and Pfizer (Indian subsidiaries).

Valuation
Price stabalization and improvement will lead to improvement in ROEs which will also increase rerating potential. We have seen that sector rerating and derating has been in line with ROE trends for export oriented pharma companies as seen in the chart below. We monitor valuations through EV/EBITDA as pharma companies have been acquisitive in the past which has increased non cash amortization in the P&L and loaded balance sheet with goodwill and debt.
The sector is currently trading below its 10 year average of 42% premium to Sensex and at a 10 year low of just 2%. Improvement in business and ROE may lead to earnings growth and rerating of the sector going forward.
PHARMACEUTICALS
OUTLOOK 2020
0%
10%
20%
30%
40%
50%
60%
70%
80%
90%
8
10
12
14
16
18
20
22
01-1
2-20
09
01-0
4-20
10
01-0
8-20
10
01-1
2-20
10
01-0
4-20
11
01-0
8-20
11
01-1
2-20
11
01-0
4-20
12
01-0
8-20
12
01-1
2-20
12
01-0
4-20
13
01-0
8-20
13
01-1
2-20
13
01-0
4-20
14
01-0
8-20
14
01-1
2-20
14
01-0
4-20
15
01-0
8-20
15
01-1
2-20
15
01-0
4-20
16
01-0
8-20
16
01-1
2-20
16
01-0
4-20
17
01-0
8-20
17
01-1
2-20
17
01-0
4-20
18
01-0
8-20
18
01-1
2-20
18
01-0
4-20
19
01-0
8-20
19
01-1
2-20
19
Source - Bloomberg
Bse Healthcare Index (EV/EBITDA) Sensex Index (EV / EBITDA)
Healthcare premium to Sensex(RHS) Average premium (RHS)

TELECOM
TELECOM
OUTLOOK 2020
• We believe that we are most likely past the worst point for the sector; in terms of metrics like tariffs and capex.
• Tariff hikes may lead to very sharp improvement in sector earnings due to high operating and financial leverage.
• We expect sector EBITDA to increase by more than 40% CAGR over FY19-22E from INR 290 bn to INR 900 bn
Long-Term Trends
• India is the world’s second largest telecom market in terms of number of subscribers, but the lowest in terms of ARPU (Average Revenue Per User).
• In terms of revenues, the market size is only ~USD 20 bn (2019) down from a peak of USD ~28 bn.
• The industry has undergone some major shifts over the last 3 years since Jio launched its services:
» Accelerated industry shift from 2G/3G to 4G
» Wireless data subscribers have increased from 300 mn to 600 mn
» Industry revenues have shrunk by 25%
» Industy ARPUs have fallen from 188 to ~120
» Voice calls have become free and are now bundled with data plans
» Voice volume per sub has become 2x, data volume per sub has become 12-13x
» Industry has consolidated from 12 players in 2016 to 3 players
» Profits and cash flows for surviving incumbents have fallen sharply, while their balance sheets have become stretched – ROCEs have fallen from single digits to <0
Near-Term Trends
• Adjusted Gross Revenue (AGR) case judgement was a turning point for the sector. All stakeholders came together towards the common objective of ensuring a 3-player market.
• Government’s stance on how the payment terms of the AGR dues are structured is still an important hurdle to overcome.
• The measures announced till date (incl. tariff hikes) should lead to substantial boost to sector health.

TELECOM
OUTLOOK 2020
Valuation
0
5
10
15
20
25
Source: Internal
Mar
-10
Jun-
10Se
p-10
Dec-1
0M
ar-1
1Ju
n-11
Sep-
11De
c-11
Mar
-12
Jun-
12Se
p-12
Dec-1
2M
ar-1
3Ju
n-13
Sep-
13De
c-13
Mar
-14
Jun-
14Se
p-14
Dec-1
4M
ar-1
5Ju
n-15
Sep-
15De
c-15
Mar
-16
Jun-
16Se
p-16
Dec-1
6M
ar-1
7Ju
n-17
Sep-
17De
c-17
Mar
-18
Jun-
18Se
p-18
Dec-1
8M
ar-1
9Ju
n-19
Sep-
19De
c-19
Sector PE
Average
Max Min
+1SD -1SD

REAL ESTATE

REAL ESTATE
OUTLOOK 2020
• Over supply situation correcting: The Indian Real Estate sector has witnessed a down cycle from FY13 onwards as inventory levels kept mounting due to unabated project launches. Slow demand led to less absorption. Thankfully, developers have reduced launch intensity (also driven by funding constraints and RERA) over the last 3 years (see chart below) which has helped curb inventory buildup.
Slowdown in launches has helped sales gradually catchup
• Improving affordibilty can revive demand: Affordibility, over the past 4-5 years has improved as prices have broadly remained flat while income has grown at a 6-7% CAGR. A reduction in interest rates have also helped lower overall cost of ownership. This can help revive demand gradually as consumer confidence increases. While the demand-supply scenario will pan out differently across cities and micro-markets, the eventual upcycle in real estate will need support from an improvement in property prices.
• Market consolidation: New launch activity to remain tepid as developers recover from the ongoing funding crisis. Borrowing costs for the unorganised segment continues to remain high; working in favor of the bigger branded developers. Continued market share gains for the organised large developers are expected as stressed players exit the market. RERA will also accelerate the consolidation trend due to rising compliance costs.
• Commercial Real Estate: The commercial/retail real estate segment has been the bright spark for the industry over the last 4-5 years. Commercial vacancy rates in India remain at healthy levels of ~15% with some cities such as Bangalore at 6-7%. This indicates favorable market dynamics and a strong pricing environment. The retail segment (malls) is also operating at healthy vacancy levels and with limited supply of Grade A properties. We remain positive on the commercial/retail segment which is expected to continue its steady broad-based growth trajectory.
0
100
200
300
400
500
600
700
800
900
1000
FY08 FY09 FY10 FY11 FY12 FY13 FY14 FY15 FY16 FY17 FY18 FY19
Launches Sales -
5
10
15
20
25
30
35
40
45
FY08 FY09 FY10 FY11 FY12 FY13 FY14 FY15 FY16 FY17 FY18 FY19
Months of inventory
Source – PropEquity; JLL

REAL ESTATE
OUTLOOK 2020
In the residential segment, companies with strong execution track record and robust
balance sheets are likely to do well as both may help gain market share, improve bargaining
power and provide for sustained growth.
In the commercial/retail space, business models with a diversified pan-India presence are
likely to do well.
Key Long-Term Trends
The Indian residential real estate sector is ~Rs 2.5tn with estimated annual sales of 270-300msft and about 300,000-350,000 units sold across the top 14 cities in India. The sector has been on a down trend over the last 6-7 years due to weak demand and over supply. Events such as demonetization, regulatory developments such as RERA and GST further increased the challenges for the sector.
Failure on part of developers to meet delivery timelines, resulted in a crisis of faith for consumers and consequently there was a drop in sales velocity and prices. As property prices plateaued, investor demand fell sharply. Sluggish sales velocity along with limited fungibility of cashflows post RERA, caused smaller developers with weak balance sheets to suffer from service debt issues.
However, this stress for the smaller/unorganised developers meant an opportunity for the bigger/organised players to gain market share. It also presented an opportunity for the larger developers to acquire land at lower rates as the stressed players were often forced to liquidate their assets to meet debt obligations. For example, Godrej Properties was able to acquire a large land parcel (more than 300 acres) across Pune to be developed over the next 10 years.
Ongoing construction delays resulted in buyers preferring either ready inventory or launches from better brands with strong track records. The larger branded developers not only gained market share but also consolidated their presence at the expense of the stressed developers. Market share gains are reflected in the listed large real estate developers having registered 15% volume growth CAGR over the last 3 years (FY16-FY19) vs. flattish for the industry.

REAL ESTATE
OUTLOOK 2020
Valuation
The real estate sector average price to book has seen a rerating due to expected improvement in RoEs as the cycle turns. The sector is currently trading at a 13% discount to Sensex vs 5-year average discount of 19%. An acceleration of the market share trend can result in the discount narrowing further.
-20%
-10%
0%
10%
20%
30%
40%
50%
-
0.50
1.00
1.50
2.00
2.50
3.00
3.50
4.00
01-0
2-20
14
01-0
5-20
14
01-0
8-20
14
01-1
1-20
14
01-0
2-20
15
01-0
5-20
15
01-0
8-20
15
01-1
1-20
15
01-0
2-20
16
01-0
5-20
16
01-0
8-20
16
01-1
1-20
16
01-0
2-20
17
01-0
5-20
17
01-0
8-20
17
01-1
1-20
17
01-0
2-20
18
01-0
5-20
18
01-0
8-20
18
01-1
1-20
18
01-0
2-20
19
01-0
5-20
19
01-0
8-20
19
01-1
1-20
19
Real Estate Avg P/BV SENSEX P/BV
Real Estate Discount to Sensex Average discount to SENSEX
Source – Bloomberg;*Real estate avg P/BV is average of Godrej Properties, Phoenix Mills, Prestige Estates, Sobha Developers, Oberoi Realty and DLF
Product Labeling
DSP Equity Fund (Multi Cap Fund- An open ended equity scheme investing across large cap, mid cap, small cap stocks)This Open Ended Scheme is suitable for investors who are seeking*• Long-term capital growth• Investment in equity and equity-related securities to form a diversified portfolio
RISKOMETER
DSP Equity Opportunities Fund (Large & Mid Cap Fund- An open ended equity scheme investing in both large cap and mid cap stocks)This Open Ended Scheme is suitable for investors who are seeking*• Long-term capital growth• Investment in equity and equity-related securities predominantly of large and midcap companies
DSP Focus Fund (An open ended equity scheme investing in maximum 30stocks. The Scheme shall focus on multi cap stocks.)This Open Ended Equity Scheme is suitable for investors who are seeking*• Long-term capital growth with exposure limited to a maximum of 30 stocks from a multi cap
investment universe• Investment in equity and equity-related securities to form a concentrated portfolio

OUTLOOK 2020
DSP Mid Cap Fund (Mid Cap Fund- An open ended equity scheme predominantly investing in mid cap stocks)This Open Ended Equity Scheme is suitable for investors who are seeking*• Long-term capital growth• Investment in equity and equity-related securities predominantly of midcap companies
RISKOMETER
DSP Small Cap Fund (Small Cap Fund- An open ended equity schemepredominantly investing in small cap stocks)This Open Ended Equity Scheme is suitable for investors who are seeking*• Long-term capital growth• Investment in equity and equity-related securities predominantly of small cap companies
(beyond top 250 companies by market capitalization)
DSP Tax Saver Fund (An open ended equity linked saving scheme with a statutory lock in of 3 years and tax benefit)This Open Ended Equity Linked Saving Scheme is suitable for investors who are seeking*• Long-term capital growth with a three-year lock-in• Investment in equity and equity-related securities to form a diversified portfolio
DSP Top 100 Equity Fund (Large Cap Fund- An open ended equity schemepredominantly investing in large cap stocks)This Open Ended Scheme is suitable for investors who are seeking*• Long-term capital growth• Investment in equity and equity-related securities predominantly of large cap companies
DSP Dynamic Asset Allocation Fund (An open ended dynamic asset allocation fund)This scheme is suitable for investors who are seeking*• Long-term capital growth• Investment in equity and equity related securities including the use of equity derivatives
strategies and arbitrage opportunities with balance exposure in debt and money market instruments.
DSP Equity & Bond Fund (An open ended hybrid scheme investing predominantly in equity and equity related instruments)This Open Ended aggressive hybrid scheme is suitable for investors who are seeking*• Capital growth and income over a long-term investment horizon• Investment primarily in equity/equity-related securities, with balance exposure in money market
and debt Securities
DSP Quant Fund (An Open ended equity Scheme investing based on a quant model theme)This open ended equity Scheme is suitable for investors who are seeking*• Long term capital growth• Investment in active portfolio of stocks screened, selected, weighed and rebalanced on the basis
of a predefined fundamental factor model
*Investors should consult their financial advisors if in doubt about whether the product is suitable for them.
Disclaimer: There is no assurance of any returns/potential/capital protection/capital guarantee to the investors in this Scheme/(s). For Schemes specific risk factors please refer the Scheme Information Document (‘SID’). For further details, please refer the Statement of Additional Information, SID and Key Information Memorandum cum Application Forms of the respective Schemes, which are available at AMC and Registrar Office and Investor Service Centres/AMC website viz. www.dspim.com. All figures and other data given in this document are dated and the same may or may not be relevant in future.In this material DSP Investment Managers Private Limited (the AMC) has used information that is publicly available, including information developed in-house. Information gathered and used in this material is believed to be from reliable sources. The AMC however does not warrant the accuracy, reasonableness and / or completeness of any information. The data/statistics are given to explain general market trends in the securities market, it should not be construed as any research report/research recommendation. We have included statements / opinions / recommendations in this document, which contain words, or phrases such as “will”, “expect”, “should”, “believe” and similar expressions or variations of such expressions that are “forward looking statements”. Actual results may differ materially from those suggested by the forward looking statements due to risk or uncertainties associated with our expectations with respect to, but not limited to, exposure to market risks, general economic and political conditions in India and other countries globally, which have an impact on our services and / or investments, the monetary and interest policies of India, inflation, deflation, unanticipated turbulence in interest rates, foreign exchange rates, equity prices or other rates or prices etc. The note indicates the strategy/investment approach currently followed by the schemes and the same may change in future depending on market conditions and other factors. The sector(s)/stock(s)/issuer(s) mentioned above do not constitute any research report/recommendation of the same and the Fund may or may not have any future position in these sector(s)/stock(s)/issuer(s). Above mentioned returns do not in any manner indicate the returns/performance/potential of any Schemes of DSP Mutual Fund. The portfolio of the schemes are subject to changes within the provisions of the Scheme Information document of the schemes. Past performance may or may not be sustained in the future and should not be used as a basis for comparison with other investments. Investors are advised to consult their own legal, tax and financial advisors to determine possible tax, legal and other financial implication or consequence of subscribing to the units of DSP Mutual Fund.Mutual Fund investments are subject to market risks, read all scheme related documents carefully.
