outperform - initiation
TRANSCRIPT
INITIATION Healthcare ▪ Singapore
Hyphens Pharma Intl Ltd (HYP SP/HYPH.SI)
November 6, 2020 KGI Securities (Singapore) Pte. Ltd.
• We initiate coverage on Hyphens Pharma with an OUTPERFORM recommendation and a target price of S$0.48. Our TP is based on 17x FY21F EPS.
• Hyphens’ recent focus is on growing its Proprietary Brands segment, adding quality products to its portfolio such as Ocean Health and Ceradan. The portfolio is positioned in the beauty market, and is poised to take market share in Asia-Pacific, the fastest growing region amongst the beauty market.
• Hyphens also plans to continue growing their specialty pharma ecosystem, with the hire of a new C-suite executive to source for more pharma principal partnerships.
• With Hyphens’ onboarding onto popular regional e-commerce platforms, we expect the proprietary brands segment to grow faster than its 8% FY16-19 CAGR.
Proprietary brands the way forward. With the latest acquisition of CG210, Hyphens has positioned the proprietary brands segment further into the beauty and personal care product space. Asia-Pacific is the fastest growing region for the beauty market, and with new product releases in its two major brands Ceradan and Ocean Health, we expect the business to maintain double digit growth, exemplified by the 23.7% YoY sales growth in 1H20. Enhancing specialty pharma’s ecosystem. Hyphens has a fairly strong distribution network in Asia, with direct presence in 4 emerging ASEAN markets. Hyphens is thus an appealing partner for pharma brands looking to expand their reach to Asia, and Hyphens is committed to finding such brands with a new C-suite hire last year focused on forming more of these partnerships. Committing to e-commerce. While Hyphens is no stranger to e-commerce, COVID-19 has persuaded the team to bring their consumer products on-board more popular platforms such as Shopee and Lazada. Online penetration of beauty and personal care product sales are the highest in the Asia Pacific region, and we expect this to also contribute to sales for the proprietary brands segment.
Valuation & Action: We valuate using PE methodology, applying a 17x peg to FY21F earnings, and arrive at a TP of S$0.48. This represents a 20% upside to Thursday’s close price of S$0.40. Our worst case, low growth scenario using 14x P/E peg arrives at S$0.37, so we think there is a decent margin of safety in the current stock price. DCF-derived fair value between S$0.56 to S$0.65. Our discounted cash flow model derives a S$0.65 fair value in the base case and a fair value of S$0.56 in the low growth case. Both our DCF scenarios utilise an 8.25% WACC and a fairly conservative 1.5% terminal growth rate. Risks: COVID-19 operational risk, Forex risk, product licensing delays leading to potentially lost revenue streams.
Outperform - InitiationPrice as of 5 Nov 20 (SGD) 0.40 Performance (Absolute)
12M TP (S$) 0.48 1 Month (%) -8.0
Previous TP (S$) - 3 Month (%) -31.9
Upside (%) 20.0 12 Month (%) 108.5
Trading data Perf. vs STI Index (Red)
Mkt Cap (S$mn) 120 Absolute (%) 1M -8.0
Issued Shares (mn) 300 Absolute (%) 3M -31.9
Vol - 3M Daily avg (mn) 3.0 Absolute (%) 12M 108.5
Val - 3M Daily avg ($mn) 1.4 52 week lo $0.18
Free Float (%) 22.0% 52 week hi $0.63
Major Shareholders Previous Recommendations
Lim See Wah 65.3%
Tan Chwee Choon 12.7%
0
100
200
300
400
Financials & Key Operating Statistics
YE Dec (S$ '000) 2018A 2019A 2020F 2021F 2022F
Revenue 120,930 119,442 130,603 136,957 143,677PATMI 5,410 6,530 7,787 8,556 9,429EPS (cents) 2.24 2.19 2.59 2.85 3.14EPS grth (%) -11.1 20.6 19.2 9.9 10.2P/E (x) 22.2 18.4 15.4 14.0 12.7DPS (SGCents) 0.6 1.0 0.6 0.7 0.8Div Yield (%) 1.4 2.5 1.6 1.8 2.0Net Margin (%) 4.5 5.5 6.0 6.2 6.6Gearing (%) net cash net cash net cash net cash net cashPrice / Book (x) 3.1 2.7 2.3 2.0 1.7ROE (%) 18.7 15.7 16.2 15.2 14.5Source: Company Data, KGI Research
Skin is the game Kenny Tan / 65 6202 1196 / [email protected]
Hyphens Pharma Intl Ltd Singapore
November 6, 2020 KGI Securities (Singapore) Pte. Ltd. 2
Table of Contents Investment Thesis ....................................................................................................... 3
Seeking growth in Consumer Healthcare through proprietary brand ownership ... 3
Further leveraging on Hyphens’ strong ASEAN distribution network ...................... 6
Expanding digitalization efforts ............................................................................... 7
Valuation ..................................................................................................................... 8
Risks .......................................................................................................................... 11
Company Overview ................................................................................................... 12
Financials .................................................................................................................. 13
Hyphens Pharma Intl Ltd Singapore
November 6, 2020 KGI Securities (Singapore) Pte. Ltd. 3
Investment Thesis
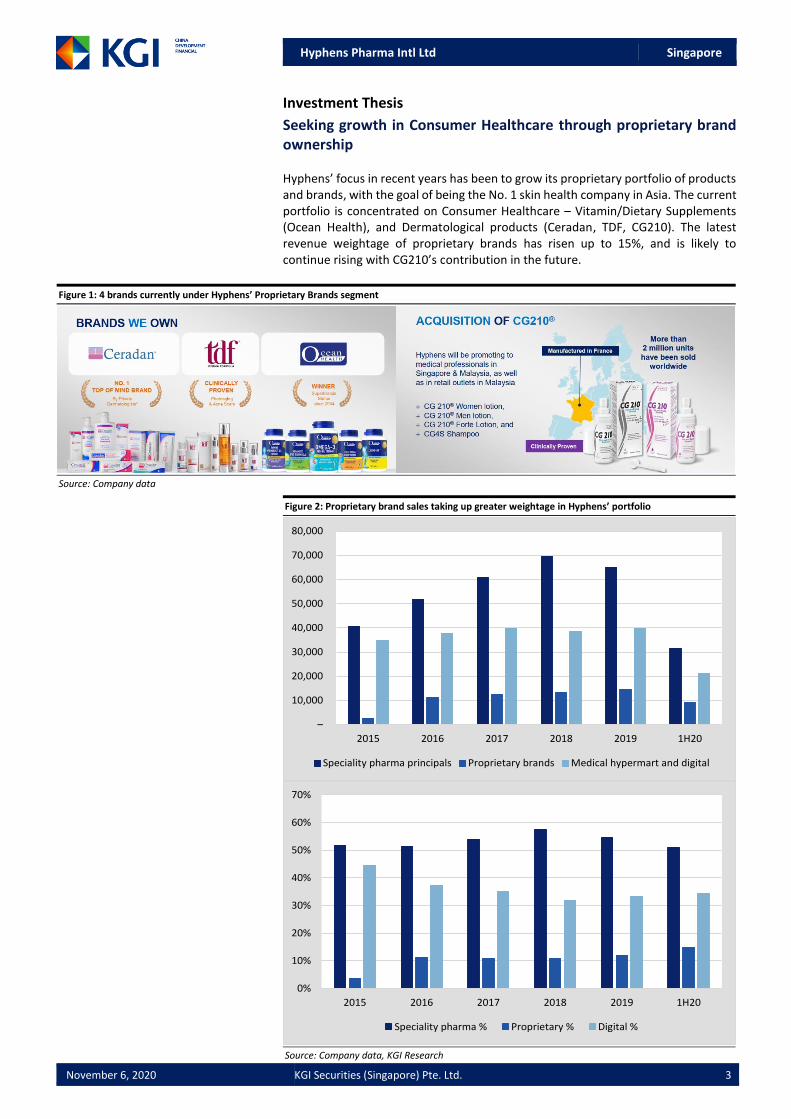
Seeking growth in Consumer Healthcare through proprietary brand ownership Hyphens’ focus in recent years has been to grow its proprietary portfolio of products and brands, with the goal of being the No. 1 skin health company in Asia. The current portfolio is concentrated on Consumer Healthcare – Vitamin/Dietary Supplements (Ocean Health), and Dermatological products (Ceradan, TDF, CG210). The latest revenue weightage of proprietary brands has risen up to 15%, and is likely to continue rising with CG210’s contribution in the future.
Figure 1: 4 brands currently under Hyphens’ Proprietary Brands segment
Source: Company data
Figure 2: Proprietary brand sales taking up greater weightage in Hyphens’ portfolio
Source: Company data, KGI Research
–
10,000
20,000
30,000
40,000
50,000
60,000
70,000
80,000
2015 2016 2017 2018 2019 1H20
Speciality pharma principals Proprietary brands Medical hypermart and digital
0%
10%
20%
30%
40%
50%
60%
70%
2015 2016 2017 2018 2019 1H20
Speciality pharma % Proprietary % Digital %
Hyphens Pharma Intl Ltd Singapore
November 6, 2020 KGI Securities (Singapore) Pte. Ltd. 4
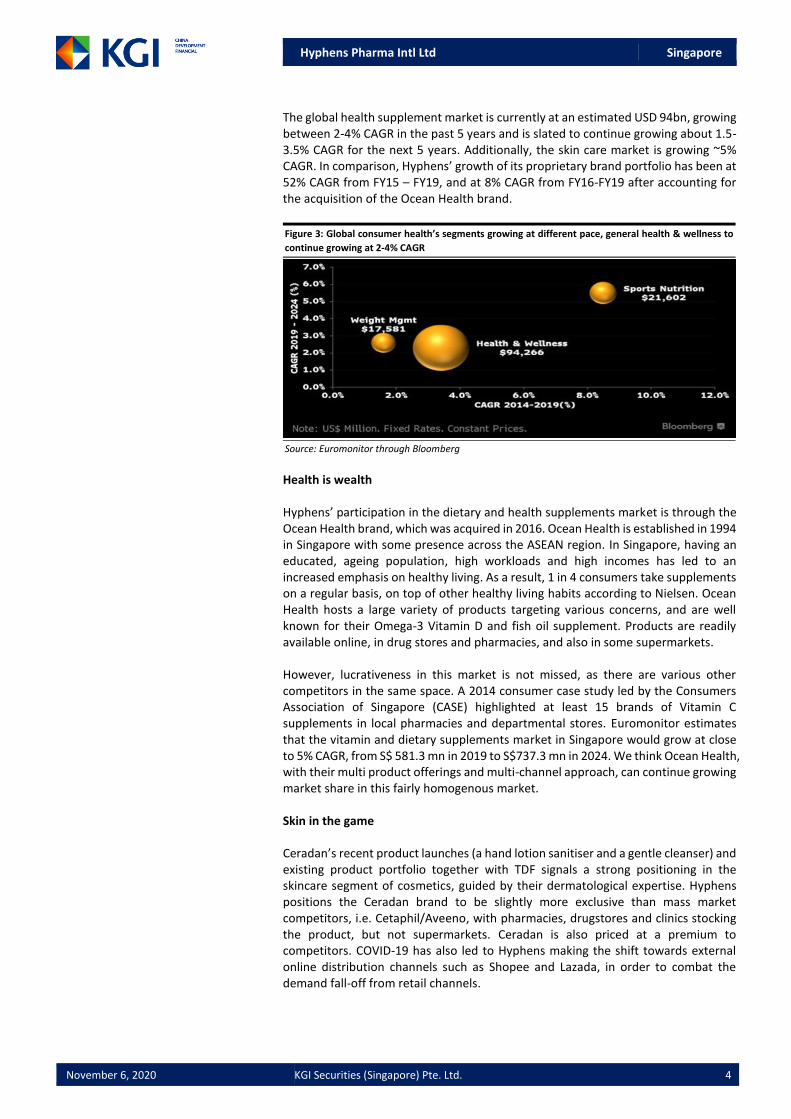
The global health supplement market is currently at an estimated USD 94bn, growing between 2-4% CAGR in the past 5 years and is slated to continue growing about 1.5-3.5% CAGR for the next 5 years. Additionally, the skin care market is growing ~5% CAGR. In comparison, Hyphens’ growth of its proprietary brand portfolio has been at 52% CAGR from FY15 – FY19, and at 8% CAGR from FY16-FY19 after accounting for the acquisition of the Ocean Health brand.
Figure 3: Global consumer health’s segments growing at different pace, general health & wellness to
continue growing at 2-4% CAGR
Source: Euromonitor through Bloomberg
Health is wealth Hyphens’ participation in the dietary and health supplements market is through the Ocean Health brand, which was acquired in 2016. Ocean Health is established in 1994 in Singapore with some presence across the ASEAN region. In Singapore, having an educated, ageing population, high workloads and high incomes has led to an increased emphasis on healthy living. As a result, 1 in 4 consumers take supplements on a regular basis, on top of other healthy living habits according to Nielsen. Ocean Health hosts a large variety of products targeting various concerns, and are well known for their Omega-3 Vitamin D and fish oil supplement. Products are readily available online, in drug stores and pharmacies, and also in some supermarkets. However, lucrativeness in this market is not missed, as there are various other competitors in the same space. A 2014 consumer case study led by the Consumers Association of Singapore (CASE) highlighted at least 15 brands of Vitamin C supplements in local pharmacies and departmental stores. Euromonitor estimates that the vitamin and dietary supplements market in Singapore would grow at close to 5% CAGR, from S$ 581.3 mn in 2019 to S$737.3 mn in 2024. We think Ocean Health, with their multi product offerings and multi-channel approach, can continue growing market share in this fairly homogenous market. Skin in the game Ceradan’s recent product launches (a hand lotion sanitiser and a gentle cleanser) and existing product portfolio together with TDF signals a strong positioning in the skincare segment of cosmetics, guided by their dermatological expertise. Hyphens positions the Ceradan brand to be slightly more exclusive than mass market competitors, i.e. Cetaphil/Aveeno, with pharmacies, drugstores and clinics stocking the product, but not supermarkets. Ceradan is also priced at a premium to competitors. COVID-19 has also led to Hyphens making the shift towards external online distribution channels such as Shopee and Lazada, in order to combat the demand fall-off from retail channels.
Hyphens Pharma Intl Ltd Singapore
November 6, 2020 KGI Securities (Singapore) Pte. Ltd. 5
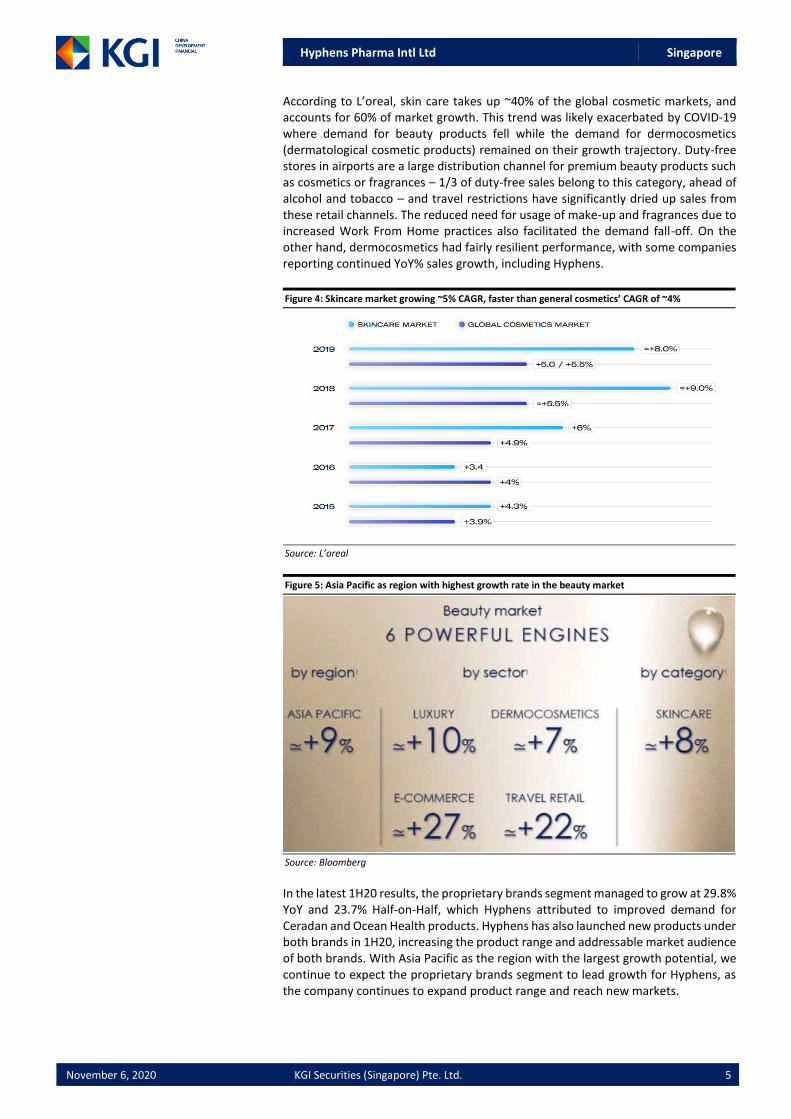
According to L’oreal, skin care takes up ~40% of the global cosmetic markets, and accounts for 60% of market growth. This trend was likely exacerbated by COVID-19 where demand for beauty products fell while the demand for dermocosmetics (dermatological cosmetic products) remained on their growth trajectory. Duty-free stores in airports are a large distribution channel for premium beauty products such as cosmetics or fragrances – 1/3 of duty-free sales belong to this category, ahead of alcohol and tobacco – and travel restrictions have significantly dried up sales from these retail channels. The reduced need for usage of make-up and fragrances due to increased Work From Home practices also facilitated the demand fall-off. On the other hand, dermocosmetics had fairly resilient performance, with some companies reporting continued YoY% sales growth, including Hyphens.
Figure 4: Skincare market growing ~5% CAGR, faster than general cosmetics’ CAGR of ~4%
Source: L’oreal
Figure 5: Asia Pacific as region with highest growth rate in the beauty market
Source: Bloomberg
In the latest 1H20 results, the proprietary brands segment managed to grow at 29.8% YoY and 23.7% Half-on-Half, which Hyphens attributed to improved demand for Ceradan and Ocean Health products. Hyphens has also launched new products under both brands in 1H20, increasing the product range and addressable market audience of both brands. With Asia Pacific as the region with the largest growth potential, we continue to expect the proprietary brands segment to lead growth for Hyphens, as the company continues to expand product range and reach new markets.
Hyphens Pharma Intl Ltd Singapore
November 6, 2020 KGI Securities (Singapore) Pte. Ltd. 6
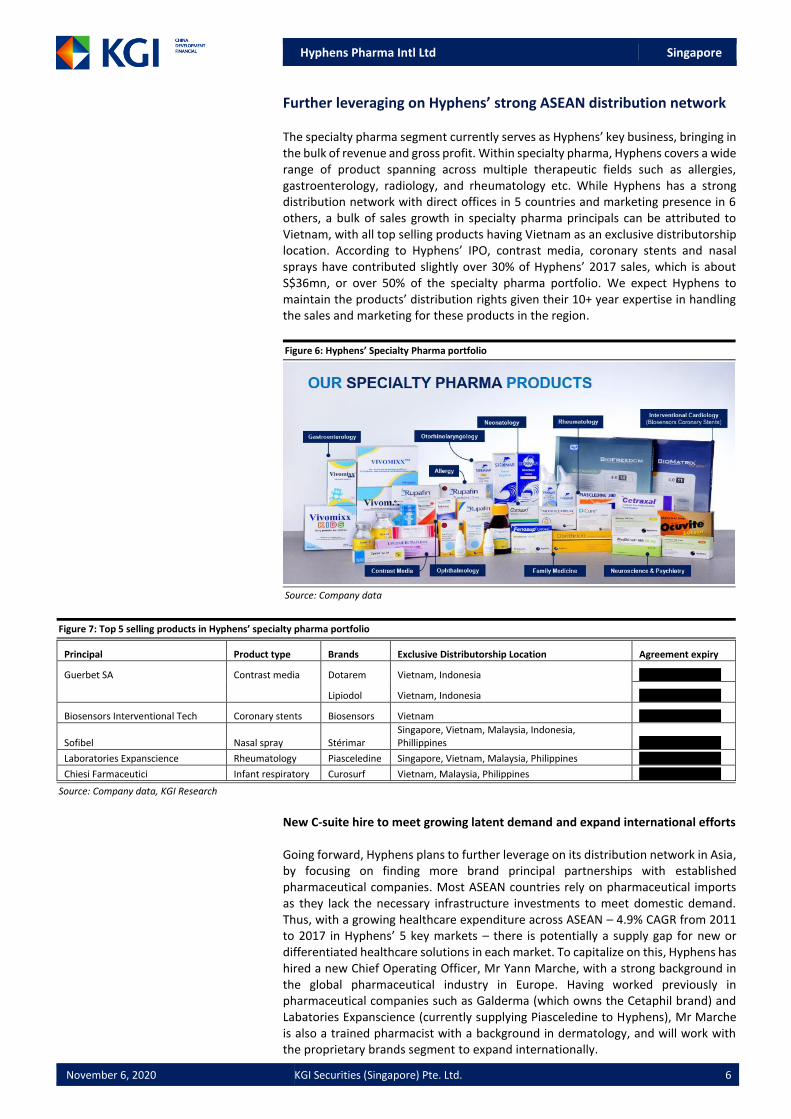
Further leveraging on Hyphens’ strong ASEAN distribution network The specialty pharma segment currently serves as Hyphens’ key business, bringing in the bulk of revenue and gross profit. Within specialty pharma, Hyphens covers a wide range of product spanning across multiple therapeutic fields such as allergies, gastroenterology, radiology, and rheumatology etc. While Hyphens has a strong distribution network with direct offices in 5 countries and marketing presence in 6 others, a bulk of sales growth in specialty pharma principals can be attributed to Vietnam, with all top selling products having Vietnam as an exclusive distributorship location. According to Hyphens’ IPO, contrast media, coronary stents and nasal sprays have contributed slightly over 30% of Hyphens’ 2017 sales, which is about S$36mn, or over 50% of the specialty pharma portfolio. We expect Hyphens to maintain the products’ distribution rights given their 10+ year expertise in handling the sales and marketing for these products in the region.
Figure 6: Hyphens’ Specialty Pharma portfolio
Source: Company data
Figure 7: Top 5 selling products in Hyphens’ specialty pharma portfolio
Principal Product type Brands Exclusive Distributorship Location Agreement expiry
Guerbet SA Contrast media Dotarem Vietnam, Indonesia 31 December 2020
Lipiodol Vietnam, Indonesia 31 December 2020
Biosensors Interventional Tech Coronary stents Biosensors Vietnam 31 December 2020
Sofibel Nasal spray Stérimar Singapore, Vietnam, Malaysia, Indonesia, Phillippines 31 December 2022
Laboratories Expanscience Rheumatology Piasceledine Singapore, Vietnam, Malaysia, Philippines 31 December 2023
Chiesi Farmaceutici Infant respiratory Curosurf Vietnam, Malaysia, Philippines 31 December 2021
Source: Company data, KGI Research
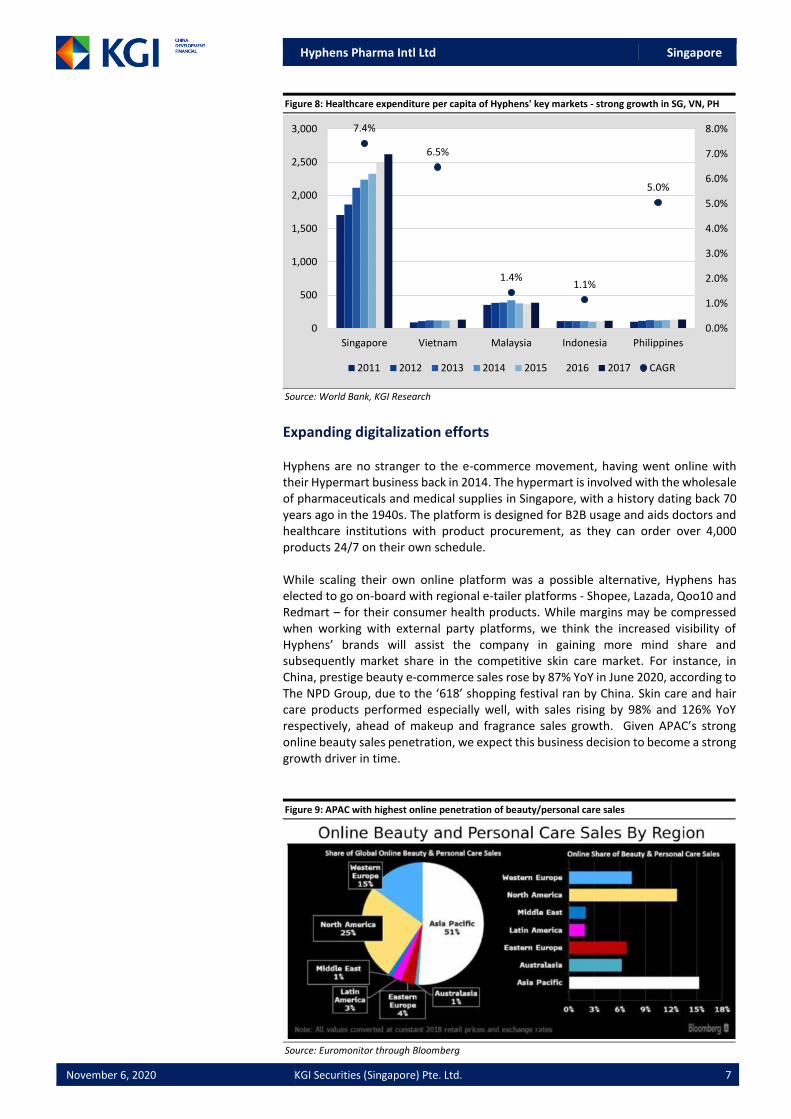
New C-suite hire to meet growing latent demand and expand international efforts Going forward, Hyphens plans to further leverage on its distribution network in Asia, by focusing on finding more brand principal partnerships with established pharmaceutical companies. Most ASEAN countries rely on pharmaceutical imports as they lack the necessary infrastructure investments to meet domestic demand. Thus, with a growing healthcare expenditure across ASEAN – 4.9% CAGR from 2011 to 2017 in Hyphens’ 5 key markets – there is potentially a supply gap for new or differentiated healthcare solutions in each market. To capitalize on this, Hyphens has hired a new Chief Operating Officer, Mr Yann Marche, with a strong background in the global pharmaceutical industry in Europe. Having worked previously in pharmaceutical companies such as Galderma (which owns the Cetaphil brand) and Labatories Expanscience (currently supplying Piasceledine to Hyphens), Mr Marche is also a trained pharmacist with a background in dermatology, and will work with the proprietary brands segment to expand internationally.
Hyphens Pharma Intl Ltd Singapore
November 6, 2020 KGI Securities (Singapore) Pte. Ltd. 7
Figure 8: Healthcare expenditure per capita of Hyphens' key markets - strong growth in SG, VN, PH
Source: World Bank, KGI Research
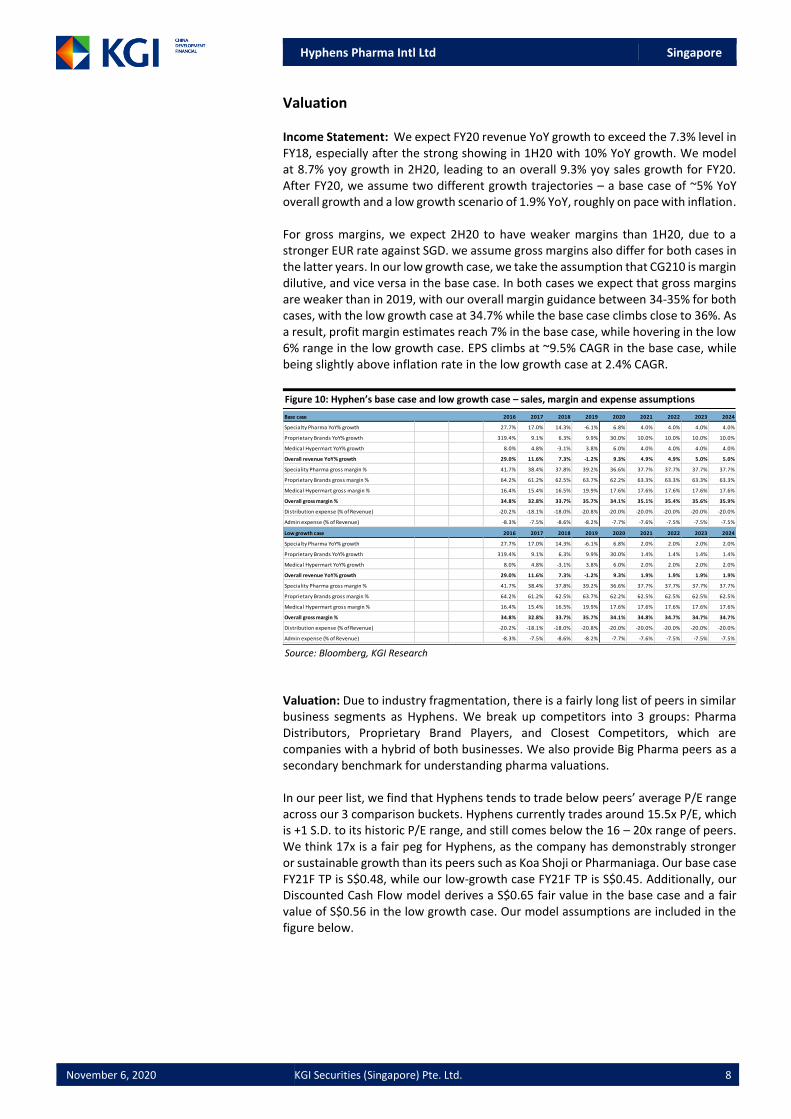
Expanding digitalization efforts Hyphens are no stranger to the e-commerce movement, having went online with their Hypermart business back in 2014. The hypermart is involved with the wholesale of pharmaceuticals and medical supplies in Singapore, with a history dating back 70 years ago in the 1940s. The platform is designed for B2B usage and aids doctors and healthcare institutions with product procurement, as they can order over 4,000 products 24/7 on their own schedule. While scaling their own online platform was a possible alternative, Hyphens has elected to go on-board with regional e-tailer platforms - Shopee, Lazada, Qoo10 and Redmart – for their consumer health products. While margins may be compressed when working with external party platforms, we think the increased visibility of Hyphens’ brands will assist the company in gaining more mind share and subsequently market share in the competitive skin care market. For instance, in China, prestige beauty e-commerce sales rose by 87% YoY in June 2020, according to The NPD Group, due to the ‘618’ shopping festival ran by China. Skin care and hair care products performed especially well, with sales rising by 98% and 126% YoY respectively, ahead of makeup and fragrance sales growth. Given APAC’s strong online beauty sales penetration, we expect this business decision to become a strong growth driver in time.
Figure 9: APAC with highest online penetration of beauty/personal care sales
Source: Euromonitor through Bloomberg
7.4%
6.5%
1.4%1.1%
5.0%
0.0%
1.0%
2.0%
3.0%
4.0%
5.0%
6.0%
7.0%
8.0%
0
500
1,000
1,500
2,000
2,500
3,000
Singapore Vietnam Malaysia Indonesia Philippines
2011 2012 2013 2014 2015 2016 2017 CAGR
Hyphens Pharma Intl Ltd Singapore
November 6, 2020 KGI Securities (Singapore) Pte. Ltd. 8
Valuation Income Statement: We expect FY20 revenue YoY growth to exceed the 7.3% level in FY18, especially after the strong showing in 1H20 with 10% YoY growth. We model at 8.7% yoy growth in 2H20, leading to an overall 9.3% yoy sales growth for FY20. After FY20, we assume two different growth trajectories – a base case of ~5% YoY overall growth and a low growth scenario of 1.9% YoY, roughly on pace with inflation. For gross margins, we expect 2H20 to have weaker margins than 1H20, due to a stronger EUR rate against SGD. we assume gross margins also differ for both cases in the latter years. In our low growth case, we take the assumption that CG210 is margin dilutive, and vice versa in the base case. In both cases we expect that gross margins are weaker than in 2019, with our overall margin guidance between 34-35% for both cases, with the low growth case at 34.7% while the base case climbs close to 36%. As a result, profit margin estimates reach 7% in the base case, while hovering in the low 6% range in the low growth case. EPS climbs at ~9.5% CAGR in the base case, while being slightly above inflation rate in the low growth case at 2.4% CAGR.
Figure 10: Hyphen’s base case and low growth case – sales, margin and expense assumptions
Source: Bloomberg, KGI Research
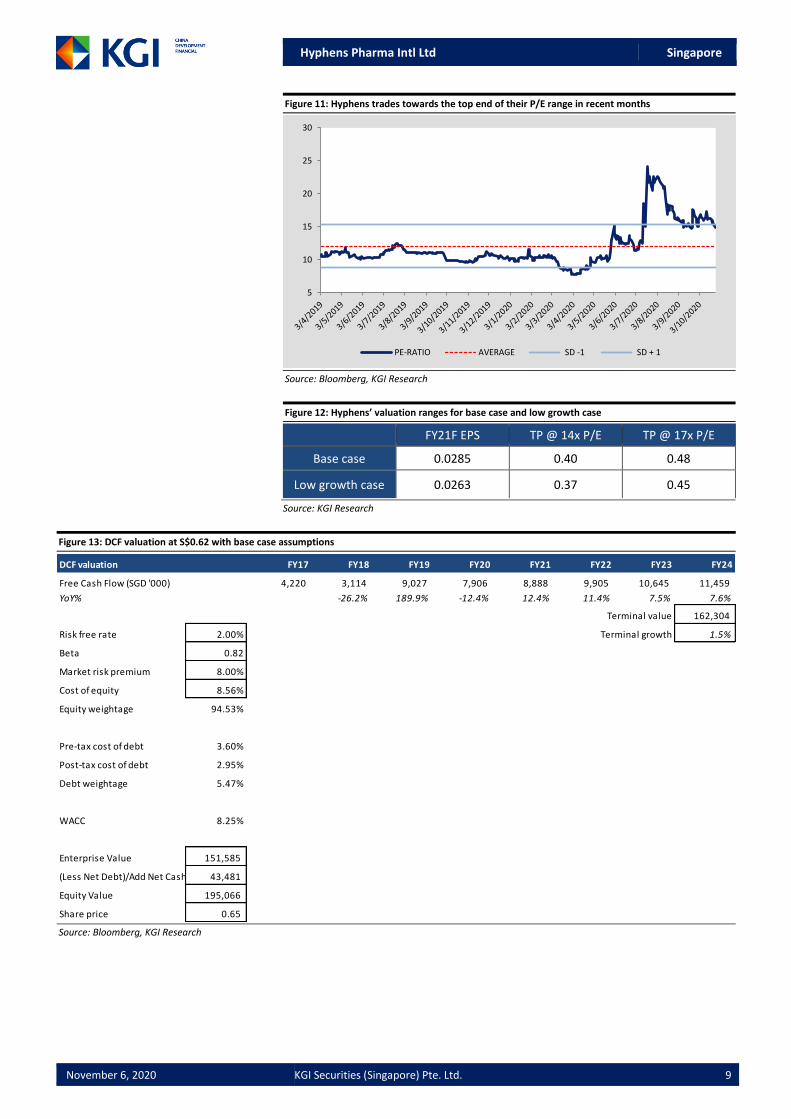
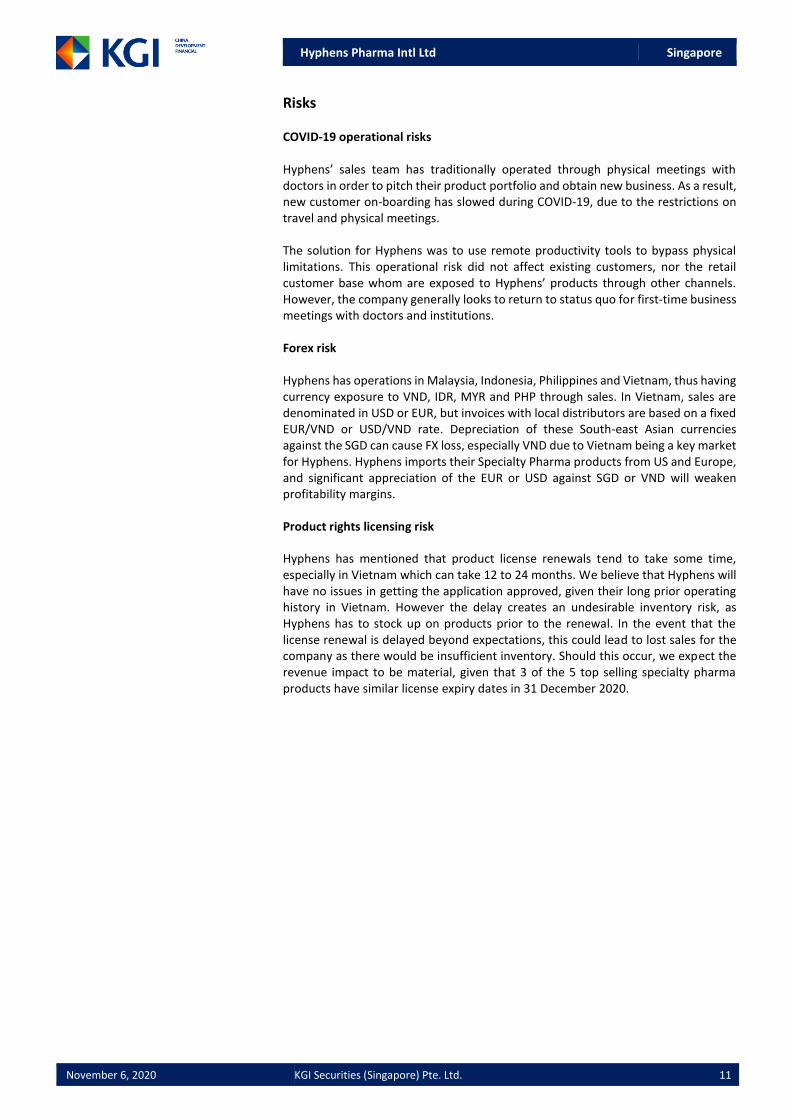
Valuation: Due to industry fragmentation, there is a fairly long list of peers in similar business segments as Hyphens. We break up competitors into 3 groups: Pharma Distributors, Proprietary Brand Players, and Closest Competitors, which are companies with a hybrid of both businesses. We also provide Big Pharma peers as a secondary benchmark for understanding pharma valuations. In our peer list, we find that Hyphens tends to trade below peers’ average P/E range across our 3 comparison buckets. Hyphens currently trades around 15.5x P/E, which is +1 S.D. to its historic P/E range, and still comes below the 16 – 20x range of peers. We think 17x is a fair peg for Hyphens, as the company has demonstrably stronger or sustainable growth than its peers such as Koa Shoji or Pharmaniaga. Our base case FY21F TP is S$0.48, while our low-growth case FY21F TP is S$0.45. Additionally, our Discounted Cash Flow model derives a S$0.65 fair value in the base case and a fair value of S$0.56 in the low growth case. Our model assumptions are included in the figure below.
Base case 2016 2017 2018 2019 2020 2021 2022 2023 2024
Specialty Pharma YoY% growth 27.7% 17.0% 14.3% -6.1% 6.8% 4.0% 4.0% 4.0% 4.0%
Proprietary Brands YoY% growth 319.4% 9.1% 6.3% 9.9% 30.0% 10.0% 10.0% 10.0% 10.0%
Medical Hypermart YoY% growth 8.0% 4.8% -3.1% 3.8% 6.0% 4.0% 4.0% 4.0% 4.0%
Overall revenue YoY% growth 29.0% 11.6% 7.3% -1.2% 9.3% 4.9% 4.9% 5.0% 5.0%
Speciality Pharma gross margin % 41.7% 38.4% 37.8% 39.2% 36.6% 37.7% 37.7% 37.7% 37.7%
Proprietary Brands gross margin % 64.2% 61.2% 62.5% 63.7% 62.2% 63.3% 63.3% 63.3% 63.3%
Medical Hypermart gross margin % 16.4% 15.4% 16.5% 19.9% 17.6% 17.6% 17.6% 17.6% 17.6%
Overall gross margin % 34.8% 32.8% 33.7% 35.7% 34.1% 35.1% 35.4% 35.6% 35.9%
Distribution expense (% of Revenue) -20.2% -18.1% -18.0% -20.8% -20.0% -20.0% -20.0% -20.0% -20.0%
Admin expense (% of Revenue) -8.3% -7.5% -8.6% -8.2% -7.7% -7.6% -7.5% -7.5% -7.5%
Low growth case 2016 2017 2018 2019 2020 2021 2022 2023 2024
Specialty Pharma YoY% growth 27.7% 17.0% 14.3% -6.1% 6.8% 2.0% 2.0% 2.0% 2.0%
Proprietary Brands YoY% growth 319.4% 9.1% 6.3% 9.9% 30.0% 1.4% 1.4% 1.4% 1.4%
Medical Hypermart YoY% growth 8.0% 4.8% -3.1% 3.8% 6.0% 2.0% 2.0% 2.0% 2.0%
Overall revenue YoY% growth 29.0% 11.6% 7.3% -1.2% 9.3% 1.9% 1.9% 1.9% 1.9%
Speciality Pharma gross margin % 41.7% 38.4% 37.8% 39.2% 36.6% 37.7% 37.7% 37.7% 37.7%
Proprietary Brands gross margin % 64.2% 61.2% 62.5% 63.7% 62.2% 62.5% 62.5% 62.5% 62.5%
Medical Hypermart gross margin % 16.4% 15.4% 16.5% 19.9% 17.6% 17.6% 17.6% 17.6% 17.6%
Overall gross margin % 34.8% 32.8% 33.7% 35.7% 34.1% 34.8% 34.7% 34.7% 34.7%
Distribution expense (% of Revenue) -20.2% -18.1% -18.0% -20.8% -20.0% -20.0% -20.0% -20.0% -20.0%
Admin expense (% of Revenue) -8.3% -7.5% -8.6% -8.2% -7.7% -7.6% -7.5% -7.5% -7.5%
Hyphens Pharma Intl Ltd Singapore
November 6, 2020 KGI Securities (Singapore) Pte. Ltd. 9
Figure 11: Hyphens trades towards the top end of their P/E range in recent months
Source: Bloomberg, KGI Research
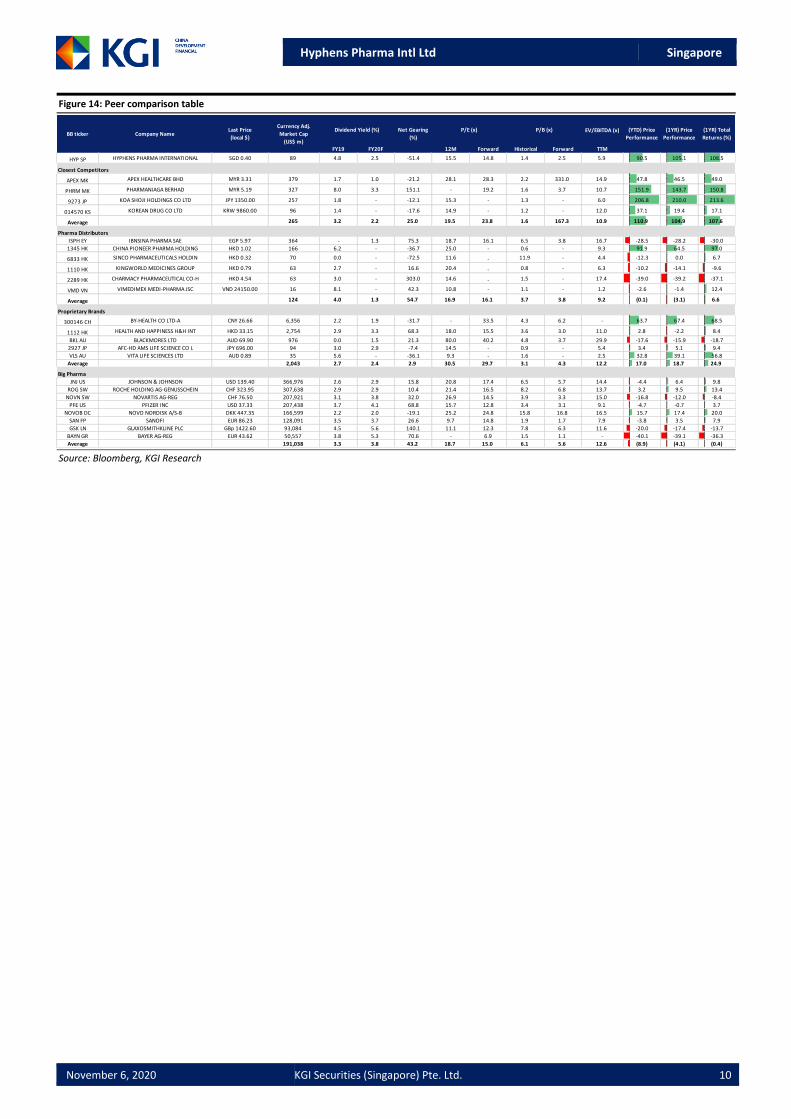
Figure 12: Hyphens’ valuation ranges for base case and low growth case
FY21F EPS TP @ 14x P/E TP @ 17x P/E
Base case 0.0285 0.40 0.48
Low growth case 0.0263 0.37 0.45
Source: KGI Research
Figure 13: DCF valuation at S$0.62 with base case assumptions
Source: Bloomberg, KGI Research
5
10
15
20
25
30
PE-RATIO AVERAGE SD -1 SD + 1
DCF valuation FY17 FY18 FY19 FY20 FY21 FY22 FY23 FY24
Free Cash Flow (SGD '000) 4,220 3,114 9,027 7,906 8,888 9,905 10,645 11,459
YoY% -26.2% 189.9% -12.4% 12.4% 11.4% 7.5% 7.6%
Terminal value 162,304
Risk free rate 2.00% Terminal growth 1.5%
Beta 0.82
Market risk premium 8.00%
Cost of equity 8.56%
Equity weightage 94.53%
Pre-tax cost of debt 3.60%
Post-tax cost of debt 2.95%
Debt weightage 5.47%
WACC 8.25%
Enterprise Value 151,585
(Less Net Debt)/Add Net Cash 43,481
Equity Value 195,066
Share price 0.65
Hyphens Pharma Intl Ltd Singapore
November 6, 2020 KGI Securities (Singapore) Pte. Ltd. 10
Figure 14: Peer comparison table
Source: Bloomberg, KGI Research
EV/EBITDA (x)
FY19 FY20F 12M Forward Historical Forward TTM
HYP SP HYPHENS PHARMA INTERNATIONAL SGD 0.40 89 4.8 2.5 -51.4 15.5 14.8 1.4 2.5 5.9 90.5 105.1 108.5
Closest Competitors
APEX MK APEX HEALTHCARE BHD MYR 3.31 379 1.7 1.0 -21.2 28.1 28.3 2.2 331.0 14.9 47.8 46.5 49.0
PHRM MK PHARMANIAGA BERHAD MYR 5.19 327 8.0 3.3 151.1 - 19.2 1.6 3.7 10.7 151.9 143.7 150.8
9273 JP KOA SHOJI HOLDINGS CO LTD JPY 1350.00 257 1.8 - -12.1 15.3 - 1.3 - 6.0 206.8 210.0 213.6
014570 KS KOREAN DRUG CO LTD KRW 9860.00 96 1.4 - -17.6 14.9 - 1.2 - 12.0 37.1 19.4 17.1
Average 265 3.2 2.2 25.0 19.5 23.8 1.6 167.3 10.9 110.9 104.9 107.6
Pharma Distributors
ISPH EY IBNSINA PHARMA SAE EGP 5.97 364 - 1.3 75.3 18.7 16.1 6.5 3.8 16.7 -28.5 -28.2 -30.0
1345 HK CHINA PIONEER PHARMA HOLDING HKD 1.02 166 6.2 - -36.7 25.0 - 0.6 - 9.3 91.9 64.5 97.0
6833 HK SINCO PHARMACEUTICALS HOLDIN HKD 0.32 70 0.0 - -72.5 11.6 - 11.9 - 4.4 -12.3 0.0 6.7
1110 HK KINGWORLD MEDICINES GROUP HKD 0.79 63 2.7 - 16.6 20.4 - 0.8 - 6.3 -10.2 -14.1 -9.6
2289 HK CHARMACY PHARMACEUTICAL CO-H HKD 4.54 63 3.0 - 303.0 14.6 - 1.5 - 17.4 -39.0 -39.2 -37.1
VMD VN VIMEDIMEX MEDI-PHARMA JSC VND 24150.00 16 8.1 - 42.3 10.8 - 1.1 - 1.2 -2.6 -1.4 12.4
Average 124 4.0 1.3 54.7 16.9 16.1 3.7 3.8 9.2 (0.1) (3.1) 6.6
Proprietary Brands
300146 CH BY-HEALTH CO LTD-A CNY 26.66 6,356 2.2 1.9 -31.7 - 33.5 4.3 6.2 - 63.7 67.4 68.5
1112 HK HEALTH AND HAPPINESS H&H INT HKD 33.15 2,754 2.9 3.3 68.3 18.0 15.5 3.6 3.0 11.0 2.8 -2.2 8.4
BKL AU BLACKMORES LTD AUD 69.90 976 0.0 1.5 21.3 80.0 40.2 4.8 3.7 29.9 -17.6 -15.9 -18.7
2927 JP AFC-HD AMS LIFE SCIENCE CO L JPY 696.00 94 3.0 2.9 -7.4 14.5 - 0.9 - 5.4 3.4 5.1 9.4
VLS AU VITA LIFE SCIENCES LTD AUD 0.89 35 5.6 - -36.1 9.3 - 1.6 - 2.5 32.8 39.1 56.8
Average 2,043 2.7 2.4 2.9 30.5 29.7 3.1 4.3 12.2 17.0 18.7 24.9
Big Pharma
JNJ US JOHNSON & JOHNSON USD 139.40 366,976 2.6 2.9 15.8 20.8 17.4 6.5 5.7 14.4 -4.4 6.4 9.8
ROG SW ROCHE HOLDING AG-GENUSSCHEIN CHF 323.95 307,638 2.9 2.9 10.4 21.4 16.5 8.2 6.8 13.7 3.2 9.5 13.4
NOVN SW NOVARTIS AG-REG CHF 76.50 207,921 3.1 3.8 32.0 26.9 14.5 3.9 3.3 15.0 -16.8 -12.0 -8.4
PFE US PFIZER INC USD 37.33 207,438 3.7 4.1 68.8 15.7 12.8 3.4 3.1 9.1 -4.7 -0.7 3.7
NOVOB DC NOVO NORDISK A/S-B DKK 447.35 166,599 2.2 2.0 -19.1 25.2 24.8 15.8 16.8 16.5 15.7 17.4 20.0
SAN FP SANOFI EUR 86.23 128,091 3.5 3.7 26.6 9.7 14.8 1.9 1.7 7.9 -3.8 3.5 7.9
GSK LN GLAXOSMITHKLINE PLC GBp 1422.60 93,084 4.5 5.6 140.1 11.1 12.3 7.8 6.3 11.6 -20.0 -17.4 -13.7
BAYN GR BAYER AG-REG EUR 43.62 50,557 3.8 5.3 70.6 - 6.9 1.5 1.1 - -40.1 -39.1 -36.3
Average 191,038 3.3 3.8 43.2 18.7 15.0 6.1 5.6 12.6 (8.9) (4.1) (0.4)
(1YR) Total
Returns (%)
Net Gearing
(%)
P/B (x) (YTD) Price
Performance
(1YR) Price
Performance
P/E (x)BB ticker Company Name
Last Price
(local $)
Currency Adj.
Market Cap
(US$ m)
Dividend Yield (%)
Hyphens Pharma Intl Ltd Singapore
November 6, 2020 KGI Securities (Singapore) Pte. Ltd. 11
Risks COVID-19 operational risks Hyphens’ sales team has traditionally operated through physical meetings with doctors in order to pitch their product portfolio and obtain new business. As a result, new customer on-boarding has slowed during COVID-19, due to the restrictions on travel and physical meetings. The solution for Hyphens was to use remote productivity tools to bypass physical limitations. This operational risk did not affect existing customers, nor the retail customer base whom are exposed to Hyphens’ products through other channels. However, the company generally looks to return to status quo for first-time business meetings with doctors and institutions. Forex risk Hyphens has operations in Malaysia, Indonesia, Philippines and Vietnam, thus having currency exposure to VND, IDR, MYR and PHP through sales. In Vietnam, sales are denominated in USD or EUR, but invoices with local distributors are based on a fixed EUR/VND or USD/VND rate. Depreciation of these South-east Asian currencies against the SGD can cause FX loss, especially VND due to Vietnam being a key market for Hyphens. Hyphens imports their Specialty Pharma products from US and Europe, and significant appreciation of the EUR or USD against SGD or VND will weaken profitability margins. Product rights licensing risk
Hyphens has mentioned that product license renewals tend to take some time, especially in Vietnam which can take 12 to 24 months. We believe that Hyphens will have no issues in getting the application approved, given their long prior operating history in Vietnam. However the delay creates an undesirable inventory risk, as Hyphens has to stock up on products prior to the renewal. In the event that the license renewal is delayed beyond expectations, this could lead to lost sales for the company as there would be insufficient inventory. Should this occur, we expect the revenue impact to be material, given that 3 of the 5 top selling specialty pharma products have similar license expiry dates in 31 December 2020.
Hyphens Pharma Intl Ltd Singapore
November 6, 2020 KGI Securities (Singapore) Pte. Ltd. 12
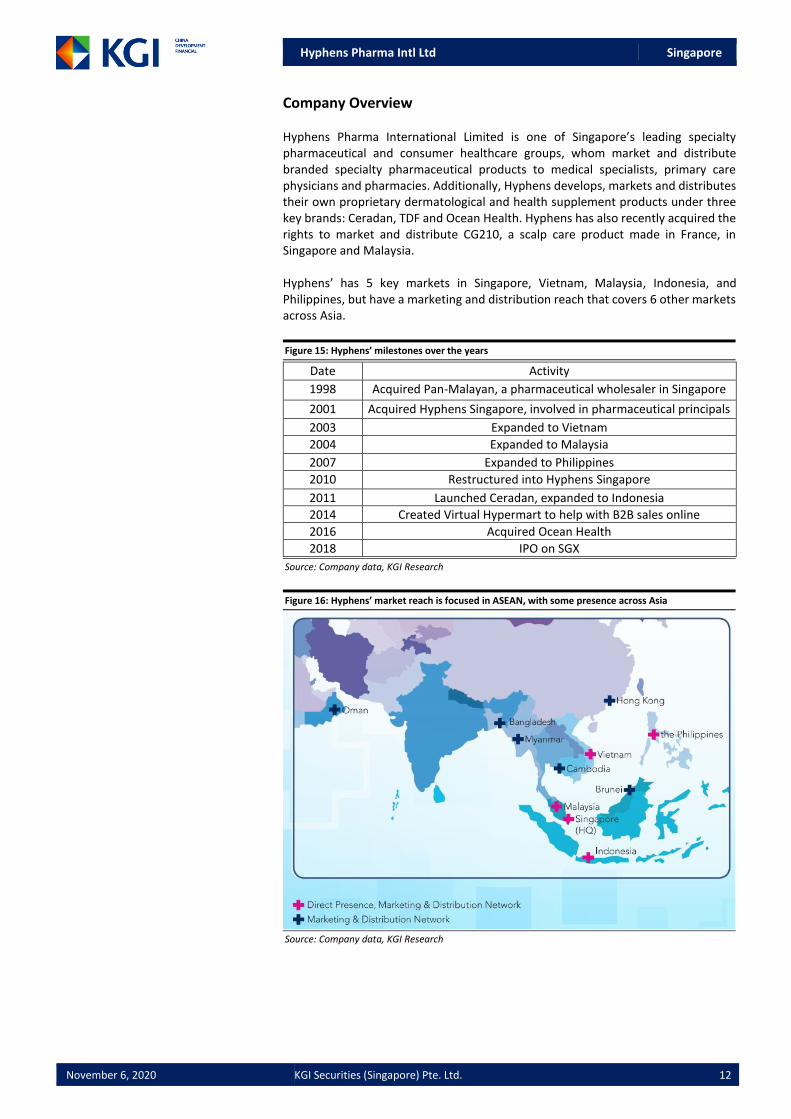
Company Overview Hyphens Pharma International Limited is one of Singapore’s leading specialty pharmaceutical and consumer healthcare groups, whom market and distribute branded specialty pharmaceutical products to medical specialists, primary care physicians and pharmacies. Additionally, Hyphens develops, markets and distributes their own proprietary dermatological and health supplement products under three key brands: Ceradan, TDF and Ocean Health. Hyphens has also recently acquired the rights to market and distribute CG210, a scalp care product made in France, in Singapore and Malaysia. Hyphens’ has 5 key markets in Singapore, Vietnam, Malaysia, Indonesia, and Philippines, but have a marketing and distribution reach that covers 6 other markets across Asia.
Figure 15: Hyphens’ milestones over the years
Date Activity
1998 Acquired Pan-Malayan, a pharmaceutical wholesaler in Singapore
2001 Acquired Hyphens Singapore, involved in pharmaceutical principals
2003 Expanded to Vietnam
2004 Expanded to Malaysia
2007 Expanded to Philippines
2010 Restructured into Hyphens Singapore
2011 Launched Ceradan, expanded to Indonesia
2014 Created Virtual Hypermart to help with B2B sales online
2016 Acquired Ocean Health
2018 IPO on SGX
Source: Company data, KGI Research
Figure 16: Hyphens’ market reach is focused in ASEAN, with some presence across Asia
Source: Company data, KGI Research
Hyphens Pharma Intl Ltd Singapore
November 6, 2020 KGI Securities (Singapore) Pte. Ltd. 13
Financials
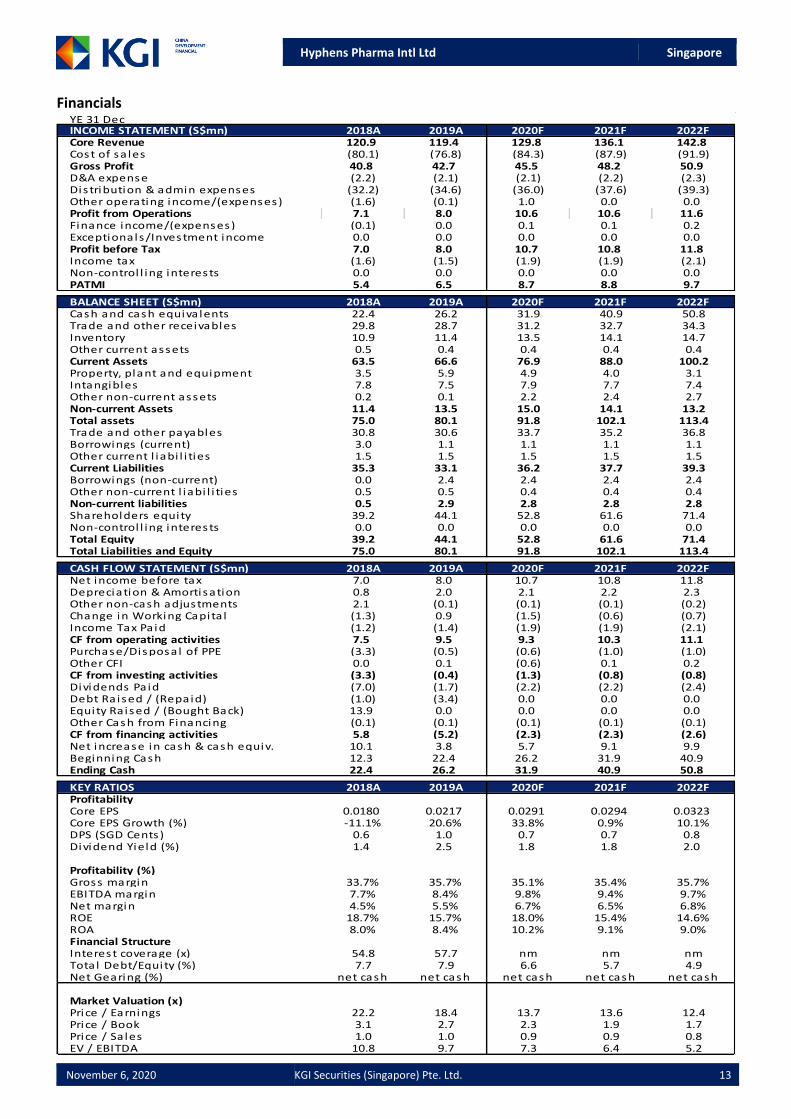
YE 31 DecINCOME STATEMENT (S$mn) 2018A 2019A 2020F 2021F 2022FCore Revenue 120.9 119.4 129.8 136.1 142.8Cost of sa les (80.1) (76.8) (84.3) (87.9) (91.9)Gross Profit 40.8 42.7 45.5 48.2 50.9D&A expense (2.2) (2.1) (2.1) (2.2) (2.3)Dis tribution & admin expenses (32.2) (34.6) (36.0) (37.6) (39.3)Other operating income/(expenses) (1.6) (0.1) 1.0 0.0 0.0Profit from Operations 7.1 8.0 10.6 10.6 11.6Finance income/(expenses) (0.1) 0.0 0.1 0.1 0.2Exceptionals/Investment income 0.0 0.0 0.0 0.0 0.0Profit before Tax 7.0 8.0 10.7 10.8 11.8Income tax (1.6) (1.5) (1.9) (1.9) (2.1)Non-control l ing interests 0.0 0.0 0.0 0.0 0.0PATMI 5.4 6.5 8.7 8.8 9.7
BALANCE SHEET (S$mn) 2018A 2019A 2020F 2021F 2022FCash and cash equiva lents 22.4 26.2 31.9 40.9 50.8Trade and other receivables 29.8 28.7 31.2 32.7 34.3Inventory 10.9 11.4 13.5 14.1 14.7Other current assets 0.5 0.4 0.4 0.4 0.4Current Assets 63.5 66.6 76.9 88.0 100.2Property, plant and equipment 3.5 5.9 4.9 4.0 3.1Intangibles 7.8 7.5 7.9 7.7 7.4Other non-current assets 0.2 0.1 2.2 2.4 2.7Non-current Assets 11.4 13.5 15.0 14.1 13.2Total assets 75.0 80.1 91.8 102.1 113.4Trade and other payables 30.8 30.6 33.7 35.2 36.8Borrowings (current) 3.0 1.1 1.1 1.1 1.1Other current l iabi l i ties 1.5 1.5 1.5 1.5 1.5Current Liabilities 35.3 33.1 36.2 37.7 39.3Borrowings (non-current) 0.0 2.4 2.4 2.4 2.4Other non-current l iabi l i ties 0.5 0.5 0.4 0.4 0.4Non-current liabilities 0.5 2.9 2.8 2.8 2.8Shareholders equity 39.2 44.1 52.8 61.6 71.4Non-control l ing interests 0.0 0.0 0.0 0.0 0.0Total Equity 39.2 44.1 52.8 61.6 71.4Total Liabilities and Equity 75.0 80.1 91.8 102.1 113.4
CASH FLOW STATEMENT (S$mn) 2018A 2019A 2020F 2021F 2022FNet income before tax 7.0 8.0 10.7 10.8 11.8Depreciation & Amortisation 0.8 2.0 2.1 2.2 2.3Other non-cash adjustments 2.1 (0.1) (0.1) (0.1) (0.2)Change in Working Capita l (1.3) 0.9 (1.5) (0.6) (0.7)Income Tax Pa id (1.2) (1.4) (1.9) (1.9) (2.1)CF from operating activities 7.5 9.5 9.3 10.3 11.1Purchase/Disposal of PPE (3.3) (0.5) (0.6) (1.0) (1.0)Other CFI 0.0 0.1 (0.6) 0.1 0.2CF from investing activities (3.3) (0.4) (1.3) (0.8) (0.8)Dividends Pa id (7.0) (1.7) (2.2) (2.2) (2.4)Debt Ra ised / (Repaid) (1.0) (3.4) 0.0 0.0 0.0Equity Ra ised / (Bought Back) 13.9 0.0 0.0 0.0 0.0Other Cash from Financing (0.1) (0.1) (0.1) (0.1) (0.1)CF from financing activities 5.8 (5.2) (2.3) (2.3) (2.6)Net increase in cash & cash equiv. 10.1 3.8 5.7 9.1 9.9Beginning Cash 12.3 22.4 26.2 31.9 40.9Ending Cash 22.4 26.2 31.9 40.9 50.8
KEY RATIOS 2018A 2019A 2020F 2021F 2022FProfitabilityCore EPS 0.0180 0.0217 0.0291 0.0294 0.0323Core EPS Growth (%) -11.1% 20.6% 33.8% 0.9% 10.1%DPS (SGD Cents) 0.6 1.0 0.7 0.7 0.8Dividend Yield (%) 1.4 2.5 1.8 1.8 2.0
Profitability (%)Gross margin 33.7% 35.7% 35.1% 35.4% 35.7%EBITDA margin 7.7% 8.4% 9.8% 9.4% 9.7%Net margin 4.5% 5.5% 6.7% 6.5% 6.8%ROE 18.7% 15.7% 18.0% 15.4% 14.6%ROA 8.0% 8.4% 10.2% 9.1% 9.0%Financial StructureInterest coverage (x) 54.8 57.7 nm nm nmTotal Debt/Equity (%) 7.7 7.9 6.6 5.7 4.9Net Gearing (%) net cash net cash net cash net cash net cash
Market Valuation (x)Price / Earnings 22.2 18.4 13.7 13.6 12.4Price / Book 3.1 2.7 2.3 1.9 1.7Price / Sa les 1.0 1.0 0.9 0.9 0.8EV / EBITDA 10.8 9.7 7.3 6.4 5.2
Hyphens Pharma Intl Ltd Singapore
November 6, 2020 KGI Securities (Singapore) Pte. Ltd. 14
Disclaimer This report is provided for information only and is not an offer or a solicitation to deal in securities or to enter into any legal relations, nor an advice or a recommendation with respect to such securities. This report is prepared for general circulation. It does not have regard to the specific investment objectives, financial situation and the particular needs of any recipient hereof. You should independently evaluate particular investments and consult an independent financial adviser before dealing in any securities mentioned in this report. This report is confidential. This report may not be published, circulated, reproduced or distributed and/or redistributed in whole or in part by any recipient of this report to any other person without the prior written consent of KGI Securities. This report is not intended for distribution and/or redistribution, publication to or use by any person in any jurisdiction outside Singapore or any other jurisdiction as KGI Securities may determine in its absolute discretion, where the distribution, publication or use of this report would be contrary to applicable law or would subject KGI Securities and its connected persons (as defined in the Financial Advisers Act, Chapter 110 of Singapore) to any registration, licensing or other requirements within such jurisdiction. The information or views in the report (“Information”) has been obtained or derived from sources believed by KGI Securities to be reliable. However, KGI Securities makes no representation as to the accuracy or completeness of such sources or the Information and KGI Securities accepts no liability whatsoever for any loss or damage arising from the use of or reliance on the Information. KGI Securities and its connected persons may have issued other reports expressing views different from the Information and all views expressed in all reports of KGI Securities and its connected persons are subject to change without notice. KGI Securities reserves the right to act upon or use the Information at any time, including before its publication herein. Except as otherwise indicated below, (1) KGI Securities, its connected persons and its officers, employees and representatives may, to the extent permitted by law, transact with, perform or provide broking, underwriting, corporate finance-related or other services for or solicit business from, the subject corporation(s) referred to in this report; (2) KGI Securities, its connected persons and its officers, employees and representatives may also, to the extent permitted by law, transact with, perform or provide broking or other services for or solicit business from, other persons in respect of dealings in the securities referred to in this report or other investments related thereto; and (3) the officers, employees and representatives of KGI Securities may also serve on the board of directors or in trustee positions with the subject corporation(s) referred to in this report. (All of the foregoing is hereafter referred to as the “Subject Business”.) However, as of the date of this report, neither KGI Securities nor its representative(s) who produced this report (each a “research analyst”), has any proprietary position or material interest in, and KGI Securities does not make any market in, the securities which are recommended in this report. Each research analyst of KGI Securities who produced this report hereby certifies that (1) the views expressed in this report accurately reflect his/her personal views about all of the subject corporation(s) and securities in this report; (2) the report was produced independently by him/her; (3) he/she does not carry out, whether for himself/herself or on behalf of KGI Securities or any other person, any of the Subject Business involving any of the subject corporation(s) or securities referred to in this report; and (4) he/she has not received and will not receive any compensation that is directly or indirectly related or linked to the recommendations or views expressed in this report or to any sales, trading, dealing or corporate finance advisory services or transaction in respect of the securities in this report. However, the compensation received by each such research analyst is based upon various factors, including KGI Securities’ total revenues, a portion of which are generated from KGI Securities’ business of dealing in securities. Copyright 2020. KGI Securities (Singapore) Pte. Ltd. All rights reserved.