outreach screening and treatment for hepatitis c in a drug
TRANSCRIPT

8/09/2016
1
Outreach Screening and Treatment for Hepatitis C in a
Drug Treatment Unit – An Exploratory Assessment of
Feasibility and Cost Effectiveness
INHSU 2016, Oslo
Nowlan Selvapatt, Thomas Ward , Lorna Harrison , Jody Lombardini,
Mark Thursz, Phil McEwan, Ashley Brown
Disclosures
The Speaker has acted as a Clinical Investigator, Advisor and/or has
received research grants from the following companies:
Abbvie, BMS, Gilead, Janssen, Merck, Roche

8/09/2016
2
Background
• Chronic HCV - 180 million patients worldwide [1]
• An estimated 214,000 patients in the UK [2]
• Estimated 40-50% remain undiagnosed [3]
• Persons who inject drugs (PWID) highest risk
group but have poor rates of treatment uptake
and possibly adherence [2]
Messina et al. Hepatology. 2015 Jan; 61(1): 77–87.
HCV outcomes:
Liver-related complications
Extra hepatic
Productivity
Objectives
This study aims to evaluate the cost-effectiveness of a pilot
programme providing an outreach screening and treatment
programme within an inner London Drug Treatment Unit (DTU)

8/09/2016
3
Methods: Screening programme
• Persons attending the North Westminster Drug and Alcohol Service
between 1st April 2012 and 1st November 2014 were offered screening
• All positive diagnoses for HCV offered counselling, work-up and
treatment by an outreach viral hepatitis team
• Treatment was performed at DTU or hospital as per patient wishes +/-
key worker support to ensure adherence
• Treatment modalities as per physician discretion (and availability) and
outcomes were recorded for all patients that initiated treatment by 1st
August 2015
• Outcomes were used to inform a base case scenario for health
economic evaluation
Methods: Screening costs
Screening Component Unit cost (£) Resource use Total cost (£)
Consultant/nurse time
Nurse time £150/half day Half day per clinic (71 clinics) £10,650
Consultant time £2,500/year 3 years £7,500
Testing
Dry blood kits £12.50 1 kit for each patient tested (216 patients tested) £2,700
First consultation £150Cost of initial hospital visit for patient scheduled for HCV treatment
(29 patients)£4,350
Repeat patient episode £25Cost of initial hospital visit for patient scheduled for HCV treatment
(375 visits)£9,375
Fibroscan £125 Cost per fibroscan (56 performed) £7,000
Liver biopsy £800 Cost per liver biopsy (5 performed) £4,000
HCV anti-body test £5.91 Cost per HCV anti-body test (216 performed) £1,276.56
PCR test £47
Cost per PCR test (71 initial tests performed based on positive
HCV antibody testing, 5 confirmatory re-tests performed for those
that initially had a negative PCR test result)
£3,337 + £235 = £3,572
Genotype testing £44.50-126.66 Cost per genotype test performed (66 tests performed) £8,360*
Liver screening £150 Cost per liver screening test performed (66 tests performed) £9,900
Total cost - - £68,683
*So as not to bias towards the screening program, the larger cost (£126.66) was utilised
HCV, hepatitis C virus; PCR, polymerase chain reaction

8/09/2016
4
Cost-effectiveness analysis in hepatitis C
• A previously published and validated lifetime HCV disease progression
and cost-effectiveness model was utilised [4-9]
• Patient characteristics (age, gender, fibrosis stage, alcohol use and
current injecting status) were directly informed by the study data
• Published disease transition rates, costs and health utility values were
utilised and outcomes discounted at a rate of 3.5% (see supplemental
slides) [10-13]
MONARCH cost-effectiveness model flow diagram

8/09/2016
5
Health state transition parameters
Transition Functional form Source
F0 to F1exp[-2.0124-
0.07589×HCVD+0.3247×Design+0.5063×Male+0.4839×GT1
[10]F1 to F2 exp-1.5387-0.06146×HCVD+0.8001×Alcohol
F2 to F3 exp[-1.6038+0.0172×HCV Age-0.05939×HCVD+0.4539×Alcohol]
F3 to F4exp[-2.2898+0.01689×HCV Age-
0.03694×HCVD+0.5963×IDU+1.1682×BT-0.4652×GT1
Transition Mean SE Distribution Source
F4 to DC 0.039 0.010 Beta
[11]
F4 to HCC 0.014 0.010 Beta
DC to HCC 0.014 0.010 Beta
DC to LT 0.030 0.012 Beta
DC to Death 0.130 0.010 Beta
HCC to LT 0.030 0.012 Beta
HCC to Death 0.430 0.030 Beta
LT (Yr 1) to Death 0.210 0.046 Beta
LT (Yr 2+) to Death 0.057 0.012 BetaAlcohol, defined as alcohol consumption of more than 20g/day; BT, the proportion of individuals that were newly diagnosed with HCV at blood
donor screening; DC, decompensated cirrhosis; Design, set to 0 if the study design is cross-sectional and set to 1 if the study design is
retrospective-prospective; GT1, set to 1 for genotype 1 or 0 for non-1; HCC, hepatocellular carcinoma; HCV Age, age at cohort initiation; HCVD,
length of time from the presumed date of infection to the date of liver biopsy; IDU, the proportion of individuals that acknowledged intravenous
drug use (IDU) as the main risk factor for HCV infection; LT, liver transplant; SE, standard error; Yr, year.
The proportion of patients consuming excess alcohol and with a history of IDU were assumed to be 100% in line with the high risk status of the
study population.
The average duration of infection was not recorded thus the mean profiles from the UK studies reported in Thein 2008 were used as proxies.
Information on patient sex was not available, thus a 50:50 male:female ratio was utilised.
Cost and utility parameters
Cost parameters Health utility parameters
Mean (£) SE (£) Source Mean SE Source
Disease State (annual)
F0/F1 177.47 35.01
[12]
0.77 0.015
[12]
F2/F3 922.08 97.82 0.66 0.031
F4 1,463.50 297.45 0.55 0.054
DC 11,728.61 1,954.09 0.45 0.031
HCC 10,451.58 2,456.09 0.45 0.031
LTx (Year 1) 47,310.55 6,843.48 0.45 0.031
LTx (Year 2+) 1,781.15 456.57 0.67 0.066
SVR from F0/F1* 333.08 62.05 0.82 0.043
SVR from F2/F3* 922.08 97.74 0.72 0.048
SVR from F4* 1,463.50 288.07 0.72 0.048
Weekly cost (£) [13]Duration (weeks)
Genotype 1 Genotype 3
Treatments
IFN/RBV 191.35 48 24
TVR+IFN/RBV TVR: 1,866.50, IFN/RBV: 191.35 TVR: 12, IFN/RBV: 48 NA
BOC+IFN/RBV BOC: 700, IFN/RBV: 191.35 BOC: 44, IFN/RBV: 48 NA
SMV+IFN/RBV 2,057.85 12 NA
SOF+IFN/RBV 3,106.60 NA 12
DCV+SOF+RBV 5,025.35 NA 24
SOF+LDV 3,248.33 Assumed 12 weeks of SOF+LDV for both genotypes
* Applied in the first year only.
BOC, boceprevir; DC, decompensated cirrhosis; DCV, daclatasvir; HCC, hepatocellular carcinoma; HCV, hepatitis C virus; IFN, pegylated interferon α; LDV,
ledipasvir; LTx, liver transplant; RBV, ribavirin; RNA, ribonucleic acid; SE, standard error; SMV, simeprevir; SOF, sofosbuvir; SVR, sustained virologic response;
TVR, telaprevir.

8/09/2016
6
Cost and utility parameters
Cost parameters Health utility parameters
Mean (£) SE (£) Source Mean SE Source
Disease State (annual)
F0/F1 177.47 35.01
[12]
0.77 0.015
[12]
F2/F3 922.08 97.82 0.66 0.031
F4 1,463.50 297.45 0.55 0.054
DC 11,728.61 1,954.09 0.45 0.031
HCC 10,451.58 2,456.09 0.45 0.031
LTx (Year 1) 47,310.55 6,843.48 0.45 0.031
LTx (Year 2+) 1,781.15 456.57 0.67 0.066
SVR from F0/F1* 333.08 62.05 0.82 0.043
SVR from F2/F3* 922.08 97.74 0.72 0.048
SVR from F4* 1,463.50 288.07 0.72 0.048
Weekly cost (£) [13]Duration (weeks)
Genotype 1 Genotype 3
Treatments
IFN/RBV 191.35 48 24
TVR+IFN/RBV TVR: 1,866.50, IFN/RBV: 191.35 TVR: 12, IFN/RBV: 48 NA
BOC+IFN/RBV BOC: 700, IFN/RBV: 191.35 BOC: 44, IFN/RBV: 48 NA
SMV+IFN/RBV 2,057.85 12 NA
SOF+IFN/RBV 3,106.60 NA 12
DCV+SOF+RBV 5,025.35 NA 24
SOF+LDV 3,248.33 Assumed 12 weeks of SOF+LDV for both genotypes
* Applied in the first year only.
BOC, boceprevir; DC, decompensated cirrhosis; DCV, daclatasvir; HCC, hepatocellular carcinoma; HCV, hepatitis C virus; IFN, pegylated interferon α; LDV,
ledipasvir; LTx, liver transplant; RBV, ribavirin; RNA, ribonucleic acid; SE, standard error; SMV, simeprevir; SOF, sofosbuvir; SVR, sustained virologic response;
TVR, telaprevir.
Results - Screening
Patients
screened:
216
HCV antibody
negative:
127
HCV antibody
positive:
89
HCV RNA
positive:
66*
HCV RNA
unknown:
18
HCV RNA
negative:
5
Genotype 1:
37
Genotype 3:
28
Not treated:
23
Treated:
14
Not treated:
13
Treated:
15
*1 patient identified as HCV RNA positive had an unknown genotype, however was not treated.

8/09/2016
7
Baseline characteristics (1)
Baseline characteristics (2)
8/09/2016
8
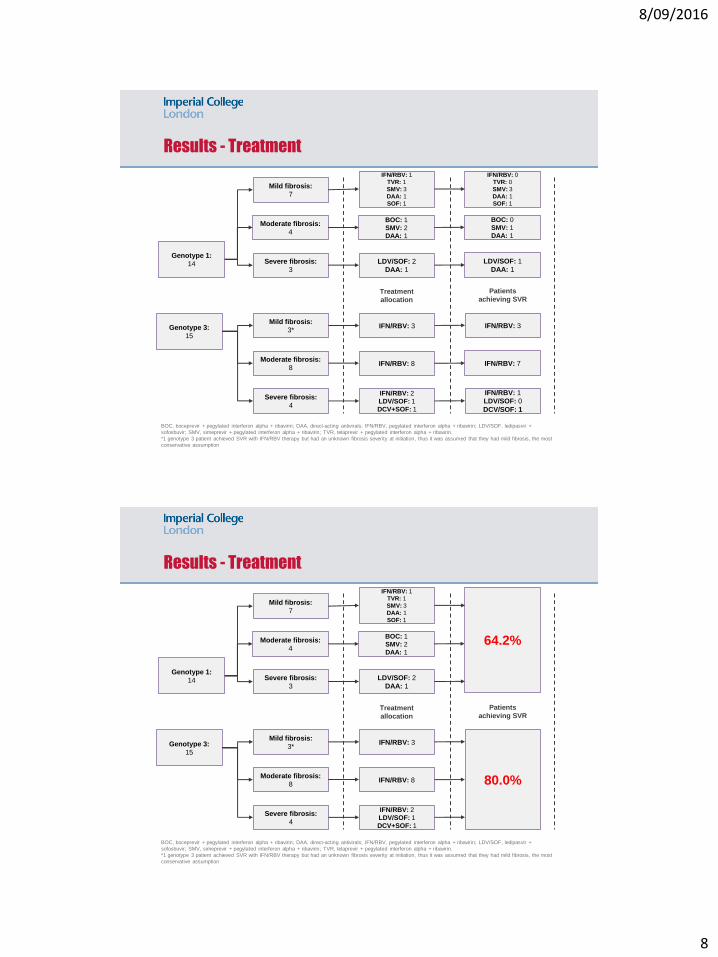
Results - Treatment
Genotype 3:
15
BOC, boceprevir + pegylated interferon alpha + ribavirin; DAA, direct-acting antivirals; IFN/RBV, pegylated interferon alpha + ribavirin; LDV/SOF, ledipasvir +
sofosbuvir; SMV, simeprevir + pegylated interferon alpha + ribavirin; TVR, telaprevir + pegylated interferon alpha + ribavirin.
*1 genotype 3 patient achieved SVR with IFN/RBV therapy but had an unknown fibrosis severity at initiation, thus it was assumed that they had mild fibrosis, the most
conservative assumption
Mild fibrosis:
3*
Moderate fibrosis:
8
Severe fibrosis:
4
Mild fibrosis:
7
Moderate fibrosis:
4
Severe fibrosis:
3
IFN/RBV: 3
IFN/RBV: 8
IFN/RBV: 2
LDV/SOF: 1
DCV+SOF: 1
IFN/RBV: 1
TVR: 1
SMV: 3
DAA: 1
SOF: 1
BOC: 1
SMV: 2
DAA: 1
LDV/SOF: 2
DAA: 1
IFN/RBV: 3
IFN/RBV: 7
IFN/RBV: 1
LDV/SOF: 0
DCV/SOF: 1
IFN/RBV: 0
TVR: 0
SMV: 3
DAA: 1
SOF: 1
BOC: 0
SMV: 1
DAA: 1
LDV/SOF: 1
DAA: 1
Treatment
allocation
Patients
achieving SVR
Genotype 1:
14
Results - Treatment
Genotype 3:
15
BOC, boceprevir + pegylated interferon alpha + ribavirin; DAA, direct-acting antivirals; IFN/RBV, pegylated interferon alpha + ribavirin; LDV/SOF, ledipasvir +
sofosbuvir; SMV, simeprevir + pegylated interferon alpha + ribavirin; TVR, telaprevir + pegylated interferon alpha + ribavirin.
*1 genotype 3 patient achieved SVR with IFN/RBV therapy but had an unknown fibrosis severity at initiation, thus it was assumed that they had mild fibrosis, the most
conservative assumption
Mild fibrosis:
3*
Moderate fibrosis:
8
Severe fibrosis:
4
Mild fibrosis:
7
Moderate fibrosis:
4
Severe fibrosis:
3
IFN/RBV: 3
IFN/RBV: 8
IFN/RBV: 2
LDV/SOF: 1
DCV+SOF: 1
IFN/RBV: 1
TVR: 1
SMV: 3
DAA: 1
SOF: 1
BOC: 1
SMV: 2
DAA: 1
LDV/SOF: 2
DAA: 1
80.0%
64.2%
Treatment
allocation
Patients
achieving SVR
Genotype 1:
14

8/09/2016
9
Cost-effectiveness analysis in hepatitis C
• Analysis was undertaken to investigate the following scenarios:
• Scenario 1: No screening and no treatment
• Scenario 2: Screening and treatment, as observed within the study
population
• Scenario 3: Screening and treatment, assuming all patients treated
with a hypothetical DAA therapy with an SVR rate of 95%
• In order to assess the incremental cost-effectiveness of screening,
scenario 2 and 3 were compared to scenario 1
Results – Cost-effectiveness
Result per patient
No screening and
treatmentScreening and treatment (base case)
Screening and treatment (all treated with
DAAs)
Total Total
Incremental (versus
no screening and
treatment)
Total
Incremental (versus
no screening and
treatment)
Screening cost (£) 0 2,368 2,368 2,368 2,368
Treatment cost (£) 0 22,716 22,716 38,980 38,980
Complication cost (£) 43,360 15,778 -27,583 7,506 -35,854
Total cost (£) 43,360 40,862 -2,498 43,360 5,494
Life years 14.02 17.48 3.46 18.45 4.42
QALYs 7.94 12.03 4.10 13.27 5.34
ICER: £/life year - - -723 - 1,242
ICER: £/QALY - - -610 - 1,029
DAAs, direct-acting antivirals; ICER, incremental cost-effectiveness ratio; QALYs, quality-adjusted life years

8/09/2016
10
Results – Cost-effectiveness
Result per patient
No screening and
treatmentScreening and treatment (base case)
Screening and treatment (all treated with
DAAs)
Total Total
Incremental (versus
no screening and
treatment)
Total
Incremental (versus
no screening and
treatment)
Screening cost (£) 0 2,368 2,368 2,368 2,368
Treatment cost (£) 0 22,716 22,716 38,980 38,980
Complication cost (£) 43,360 15,778 -27,583 7,506 -35,854
Total cost (£) 43,360 40,862 -2,498 43,360 5,494
Life years 14.02 17.48 3.46 18.45 4.42
QALYs 7.94 12.03 4.10 13.27 5.34
ICER: £/life year - - -723 - 1,242
ICER: £/QALY - - -610 - 1,029
DAAs, direct-acting antivirals; ICER, incremental cost-effectiveness ratio; QALYs, quality-adjusted life years

8/09/2016
11
Results - Sensitivity analysis
Results - Sensitivity analysis

8/09/2016
12
Results - Sensitivity analysis
Limitations of analysis
Study:
• Retrospective observational single centre study
Impact to healthcare:
• Modelling assumptions
• Treatment (Costs, SVR)
• Disease progression
• Disease management
Impact to individuals:
• Difficulty quantifying subjective metrics
• No long-term follow up (so impact of reinfection not examined)
• Societal and productivity costs not included

8/09/2016
13
Conclusions
• Outreach screening and treatment of hepatitis C is demonstrably
feasible in Drug Treatment Units with specialist care support
• High linkage to care, treatment uptake and rates of SVR
• This study demonstrates that an outreach screening and treatment
programme is likely to offer a significantly cost-effective strategy
• Under base case assumptions the screening and treatment strategy is
estimated to save £2,498 per patient with a QALY gain of 4.10 years
over a lifetime, compared to no screening
• In a hypothetical scenario where all patients were treated with DAA
only regimes, it is estimated that an incremental cost of £1,029 per
QALY would be incurred
Manuscript in Press
doi: 10.1111/liv.13240
@nselvapatt

8/09/2016
14
Acknowledgements
Lorna Harrison
Liver and Antiviral unit staff
Thomas Ward
Hayley Bennett Wilton
Samantha Webster
Professor Philip McEwan
Central and North West London NHS
Foundation TrustJody Lombardini
Professor Mark Thursz
Dr Nowlan Selvapatt
Health Economics and
Outcomes Research Ltd.
References
[1] Messina et al. Hepatology. 2015 Jan; 61(1): 77–87.
[2] Hepatitis C in the UK: 2015 report. Public Health England.
[3] Martin NK, et al. J Viral Hepat. 2015;22:399-408
[4] McEwan P, et al. Hepatology. 2013;58(1):54-64.
[5] McEwan P, et al. Value in Health Regional Issues. 2013;3:5-11.
[6] McEwan P, et al. Appl Health Econ Health Policy. 2013;11(1):53-63.
[7] McEwan P, et al. Value in Health Regional Issues. 2014;3:136-45.
[8] McEwan P, et al. PloS one. 2015;10(1):e0117334.
[9] Selvapatt N, et al. J Hepatol. 2015 Oct;63(4):797-804.
[10] Thein HH, et al. Hepatology. 2008;48(2):418-31.
[11] Martin NK, et al. Hepatology 2012;55(1):49-57.
[12] Shepherd J, et al. Interferon alfa (pegylated and non-pegylated) and ribavirin for the treatment of mild chronic hepatitis
C: a systematic review and economic evaluation. Health Technology Assessment 2007;11(11).
[13] Haymarket Media Group Ltd. Monthly Index of Medical Specialities (MIMS)2015 July 2015. Available from:
http://www.mims.co.uk.