outstanding environmental issues for human development · outstanding environmental issues for...
TRANSCRIPT
Outstanding Environmental Issues for Human Development
1
Outstanding Environmental Issues
for Human Development
Netherlands Environmental Assessment Agency at RIVM
2005

Outstanding Environmental Issues for Human Development
2
For more information:
Ton Manders MNP/RIVM Netherlands Environmental Assessment Agency P.O. Box 1, 3720 BA BILTHOVEN The Netherlands T: +31 30-274 4518 F: +31 30-274 4446 [email protected] www.rivm.nl/milieu
Outstanding Environmental Issues for Human Development
3
Contents Preface.............................................................................................................................................................5 Main findings ..................................................................................................................................................7 1 Environment and Human Development ..................................................................................................9
1.1 Sustainable development...................................................................................................................9 1.2 MDG 7 ‘Ensuring Environmental Sustainability’ ...........................................................................11 1.3 MDG Linkages................................................................................................................................13
2 Food and human development...............................................................................................................17 2.1 Why is food important?...................................................................................................................17 2.2 Trends and outlook..........................................................................................................................18 2.3 Environmental threats .....................................................................................................................23 2.4 What can we do? .............................................................................................................................24
3 Water and Human Development ...........................................................................................................27 3.1 Why is water important? .................................................................................................................27 3.2 Trends and outlook..........................................................................................................................27 3.3 Environmental threats .....................................................................................................................31 3.4 What can we do? .............................................................................................................................33
4 Energy and Human Development..........................................................................................................37 4.1 Why is energy important for development? ....................................................................................37 4.2 Trends and outlook..........................................................................................................................38 4.3 Environmental threats .....................................................................................................................40 4.4 What can we do? .............................................................................................................................43
5 Biodiversity and Human Development..................................................................................................49 5.1 Why is biodiversity important? .......................................................................................................49 5.2 Trends and outlook..........................................................................................................................49 5.3 Environmental threats .....................................................................................................................52 5.4 What can we do? .............................................................................................................................54

Outstanding Environmental Issues for Human Development
4

Outstanding Environmental Issues for Human Development
5
Preface
Recently the Dutch Ministry of Housing, Spatial Planning and the Environment requested the Netherlands Environmental Assessment Agency at the RIVM to review and evaluate the role of environmental issues in reaching the Millennium Development Goals (MDGs). We have responded to the Ministry’s request by carrying out a quick scan of the services that our planet provides which are crucial to human development. We explored the issues of food, water, energy and biodiversity, in relation to human well-being and quality of life. Human health is used as a proxy for quality of life. This report shows that under business-as-usual scenarios, key issues for development such access to clean drinking water, food and modern energy will not be solved in time to realize the MDGs. At the same time a further deterioration of environmental conditions can be expected. Environmental degradation will increasingly have a negative impact on the realization of development goals. Major problems that need to be dealt with are the conflict between land for agricultural production, its fresh water needs and nature; the need for safe drinking water and sanitation and increasing water stress; fulfilling increasing demand for energy and the problem of climate change and air pollution; and halting further deterioration of ecosystems that are important for local livelihoods. These problems pose equal challenges to ministers dealing with development issues as well as environment ministers. Actions under the different MDGs cannot be dealt with independently. A major overarching question that needs further thinking is how to reconcile essentially short term development concerns with longer term concerns of environmental sustainability. The report draws on knowledge and experience of experts within MNP/RIVM and international scientific assessments such as the Millennium Project, Millennium Ecosystem Assessment and the Intergovernmental Panel on Climate Change. We hope that this document will prove to be a source of inspiration for UNEP, its Governing Council members and to the EU Environmental Council. The report can be downloaded from the RIVM website www.rivm.nl
Professor Klaas van Egmond Director of the Netherlands Environmental Assessment Agency

Outstanding Environmental Issues for Human Development
6

Outstanding Environmental Issues for Human Development
7
Main findings
1. Nature and environment provide essential goods and services for human development. Human well-being and quality of life depend crucially on the quantity and quality of food, water, energy and biodiversity available to man. Reaching the Millennium Development Goals (MDGs) will be highly dependent on environmental conditions. However, this crucial role of environment is only partly reflected in the MDG-framework. Often there will be direct conflicts between human development and environment. Further elaborating MDG 7, including quantified objectives would help ensuring environmental sustainability.
2. Malnutrition, inadequate water supply and environmental pollution pose
serious problems to human health. From an environmental perspective shortage of arable land and water stress are important drivers for food vulnerability. Unsafe drinking water and indoor air pollution are the most serious environmental culprits, in view of current loss of human health.
3. Biodiversity, crucial for delivering ecosystem services, is deteriorating at an
unprecedented rate. Africa and Asia face the highest loss rates currently. The most important pressure factor is agricultural expansion. In the future, climate change could be a very important pressure on biodiversity as well. Further increasing protected areas, reducing land conversion by intensification of agriculture and putting a halt to piecemeal encroachment along roads may be helpful actions.
4. Meeting the Millennium Development Goal on hunger and preventing further
biodiversity loss seems incompatible. Agriculture puts an upward pressure on the demand for arable land. This demand may even further increase if the international market for biofuels further develops. Moving to more intense practices may offset, at least in part, the need for expansion of agricultural land.
5. However, higher yields are often associated with higher emissions to air, water
and soil. Increasing inputs of nutrients in agriculture results in eutrophication of inland water bodies and coastal waters poses risks to health and fresh water and marine ecosystems (algae blooms, “dead zones”). Good agricultural practices can limit these impacts.
6. Over fishing of the world’s marine stocks has an important impact on
ecosystems and biodiversity. A large coastal population depends on fisheries for food and employment. Reducing destructive fishing practices asks for reducing fishing effort, transforming market and governance. Solutions have to be location specific to the different marine ecosystems.
7. Water stress will increase substantially in large parts of the world with growing
population and expanding economies. Climate change enhances this development even more in several already vulnerable regions (e.g. Africa and parts of Asia). Competition for water between users (including the natural environment) requires strong water management preferably at river basin level.

Outstanding Environmental Issues for Human Development
8
8. Improving supply of safe water is on track in many developing regions, but some African and Asian countries lag behind. Promoting water supply and sanitation seems to be the most effective direct environmental measure to be taken to enhance human health.
9. Energy is crucial for poverty alleviation and economic development. Currently
1.6 billion people lack access to electricity and 2.4 billion rely on traditional biomass for heating and cooking. Conventional development in energy is not realizing the necessary improvements in access to energy and is expected to lead to a serious increase of urban and regional air pollution in developing countries, as well as to a further increase of greenhouse gas concentrations in the atmosphere.
10. Investment needs in the energy sector in developing countries over the coming
30 years are very substantial. An additional 10% of the cumulative investments in this period would be required to realize the energy-investments needed for reaching the MDG on poverty. By combining climate and air quality policies and measures, major cost reductions could be achieved to limit environmental impacts.
11. Human induced climate change poses an increasing risk to the achievement of
the MDG and sustainable development in the longer term. Developed countries will need to provide financial and technical support to developing countries to deal with this threat. Main streaming climate change concerns in developing planning and climate proving of development programs and development aid can reduce these risks.
12. Limiting the risks of climate change for sustainable development requires
global greenhouse gas emissions to be significantly reduced during this century. This requires developed countries to strengthen their reduction efforts, but also contributions from developing countries, in particular the more advanced developing economies in Asia and Latin America. Including climate considerations into current development planning in these regions is important in view of the longevity of energy infrastructure.
13. Comprehensive cost-benefit analysis, going beyond direct monetary indicators
and taking into account both development and environment concerns, can help to prioritize investment policies for development and environment. This report shows the importance of local, low-tech solutions.
14. To guarantee the important role of environment for development, it is crucial
that environmental concerns are integrated much better in the development agenda. This has to be carried out on local and national levels and be enhanced by international policy making. Without an integrated approach to social and economic development and environment, MDGs cannot be reached in a sustainable manner.
Outstanding Environmental Issues for Human Development
9
1 Environment and Human Development
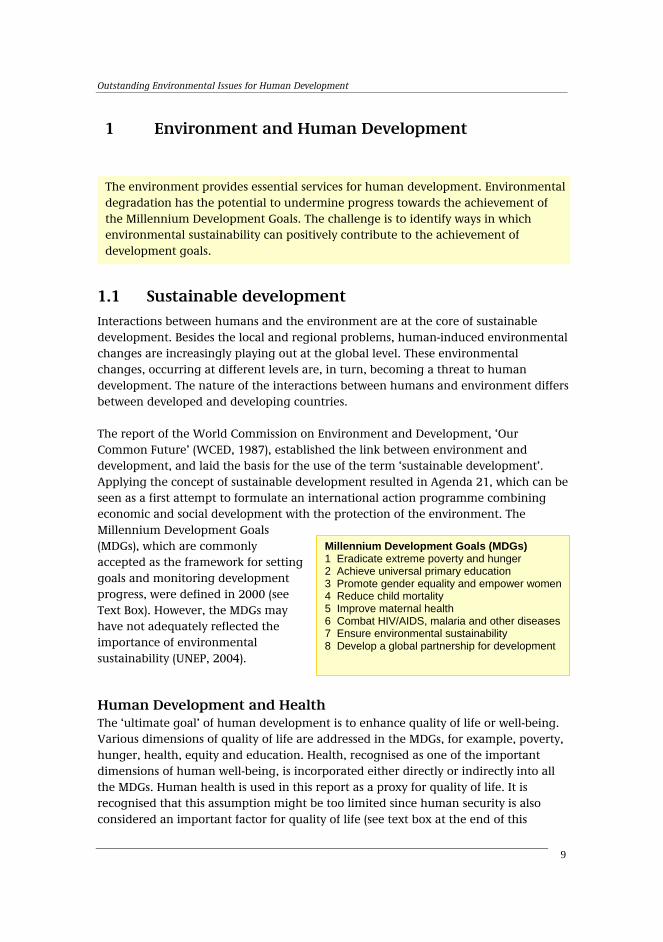
1.1 Sustainable development Interactions between humans and the environment are at the core of sustainable development. Besides the local and regional problems, human-induced environmental changes are increasingly playing out at the global level. These environmental changes, occurring at different levels are, in turn, becoming a threat to human development. The nature of the interactions between humans and environment differs between developed and developing countries. The report of the World Commission on Environment and Development, ‘Our Common Future’ (WCED, 1987), established the link between environment and development, and laid the basis for the use of the term ‘sustainable development’. Applying the concept of sustainable development resulted in Agenda 21, which can be seen as a first attempt to formulate an international action programme combining economic and social development with the protection of the environment. The Millennium Development Goals (MDGs), which are commonly accepted as the framework for setting goals and monitoring development progress, were defined in 2000 (see Text Box). However, the MDGs may have not adequately reflected the importance of environmental sustainability (UNEP, 2004).
Human Development and Health The ‘ultimate goal’ of human development is to enhance quality of life or well-being. Various dimensions of quality of life are addressed in the MDGs, for example, poverty, hunger, health, equity and education. Health, recognised as one of the important dimensions of human well-being, is incorporated either directly or indirectly into all the MDGs. Human health is used in this report as a proxy for quality of life. It is recognised that this assumption might be too limited since human security is also considered an important factor for quality of life (see text box at the end of this
The environment provides essential services for human development. Environmentaldegradation has the potential to undermine progress towards the achievement of the Millennium Development Goals. The challenge is to identify ways in which environmental sustainability can positively contribute to the achievement of development goals.
Millennium Development Goals (MDGs) 1 Eradicate extreme poverty and hunger 2 Achieve universal primary education 3 Promote gender equality and empower women 4 Reduce child mortality 5 Improve maternal health 6 Combat HIV/AIDS, malaria and other diseases 7 Ensure environmental sustainability 8 Develop a global partnership for development

Outstanding Environmental Issues for Human Development
10
chapter). The WHO defines health as ‘not merely the absence of disease or infirmity, but rather a state of complete physical, mental and social well-being’ (WHO, 2002). This broad definition encompasses the conditions for an individual, community or society to realise an acceptable state of health. The last 50 years substantial improvements in health have been realised. Improved conditions in such factors as education, health services and the independence of women have helped countries on their way to low mortality levels. However, 22% of all the 57 million annual global deaths are children under five, and infectious and parasitic diseases are still the major killers of children in the developing world. The disability-adjusted life years (DALY) was introduced by the World Bank and the WHO to take both premature mortality and the burden of disease into account. DALY losses in absolute numbers are highest in Africa and Asia, with a large share for children under 5 years. The most important health risk factors to which the loss of DALYs are attributable are shown in Figure 1.1. Hunger is responsible for the loss of more than 40% of the attributable DALYs in Africa, where the impact of HIV/AIDS is also clearly reflected, while the environmental risks vary from a few per cent to about 20%.
Figure 1.1 Most important health risk factors attributable for the loss of DALYs (Disability-adjusted Life Years) constitute a measure for health impact, which takes both the number of deaths and the reduction in quality of life due to illnesses into account.
Human Development and Biodiversity Health in the broader sense of the word is taken as a proxy for the quality of life. Biodiversity, on the other hand is regarded as the counterpart indicator for measuring the quality of ecosystems. The fact that biodiversity is included in MDG7, ‘Ensure environmental sustainability’, confirms its importance for the valuation of ecosystems. Ensuring the quality of ecosystems today will safeguard the provision of their goods

Outstanding Environmental Issues for Human Development
11
and services for future generations. Besides, biodiversity can contribute substantially to the reduction in poverty and hunger (MA, 2003). Figure 1.2 shows that biodiversity, expressed as a proxy for the mean species abundance, has been reduced – on average - to about 70 % of its level some 150 years ago. This is a process that has been driven by increased and intensified land use through urbanisation, agriculture, forestry and environmental degradation.
Figure 1.2 Biodiversity for different world regions expressed as the Natural Capital Index (NCI): the difference in the mean species abundance since industrialization. The NCI is calculated using pressures (Alkemade et al., 2005).
1.2 MDG 7 ‘Ensuring Environmental Sustainability’ MDG7 as one of the eight MDGs focuses directly on environmental issues, the targets and selected indicators are presented in the Text Boxes below. Trends for MDG7 are shown by means of selected indicators (see Figure 1.3). Obviously we are not on track in achieving environmental sustainability. This report shows furthermore (using recent FAO and IEA business as usual scenarios) that if the current trends are continued, environmental conditions will further deteriorate and exert an increasing impact on development efforts.
MDG7 Ensure environmental sustainabilityTarget 9. Integrate the principles of sustainable development into country policies and programmes and reverse the loss of environmental resources. Target 10. Halve, by 2015, the proportion of the population without sustainable access to safe drinking water and sanitation. Target 11. Have achieved, by 2020, a significant improvement in the lives of at least 100 million slum dwellers

Outstanding Environmental Issues for Human Development
12
Figure 1.3 Indicators for assessing MDG 7

Outstanding Environmental Issues for Human Development
13
A few remarks need to be made on the targets and indicators that have been set. Only the water target − ‘to halve the proportion of people without sustainable access to safe drinking water by 2015’ − is set quantitatively. The other targets are more difficult to monitor and assess, as they are not clearly defined. In addition it can be noted that the defined indicator set doesn’t adequately reflect all important environmental issues for development. This makes it more difficult to integrate environment into the broader development framework.
1.3 MDG Linkages The MDGs are of course inter-related, but often the linkages are not taken into account and additional analysis would be needed in this field (World Bank, 2002). By addressing hunger and poverty (MDG1), child mortality and the impact of infectious diseases will also be reduced. The introduction of modern energy sources can help to reduce deforestation as well as health impacts of indoor air pollution. The identification of these so-called win-win options is important for policy makers, but so are the opposite situations in which trade-offs between various MDGs should be revealed. An example of a possible trade-off is ‘Can hunger be halved by 2015 (Goal 1), while maintaining ecosystems (Goal 7)?’ This question is fairly relevant in the context of sustainable development. In searching for the win-win situations in which both human health and the environment will benefit, we can start by looking at the risk factors which contribute most to the loss of health. The environmental risk factors, presented in Figure 1.4, give an indication for priorities from a health perspective.
Indicators MDG 725. Proportion of land area covered by forest 26. Ratio of area protected to maintain biological diversity to surface area 27. Energy use (kg oil equivalent) per $1 GDP 28. Carbon dioxide emissions per capita and consumption of ozone-depleting CFCs 29. Proportion of population using solid fuels 30. Proportion of population with sustainable access to an improved water source in urban and rural areas 31. Proportion of population with access to improved sanitation in urban and rural areas 32. Proportion of households with access to secure tenure

Outstanding Environmental Issues for Human Development
14
Figure 1.4 Environmental risk factors from a health perspective. Water ranks high as contributor, but the contribution of air pollution might also give some leads for prioritising policies. Hunger and nutritional aspects are not classified as purely environmental issues but have various direct and indirect relationships with the environment. Interesting and challenging is to explore how we can halve hunger by allowing no further deforestation and by protecting areas to maintain biodiversity at current levels. Energy is one of the most prominent links between environment and development. Human development is crucially dependent on the availability, acceptability and affordability of energy. At the same time there are many environmental problems directly linked to energy use. Energy is currently not adequately covered in the MDGs.
Outstanding Environmental Issues for Human Development
15
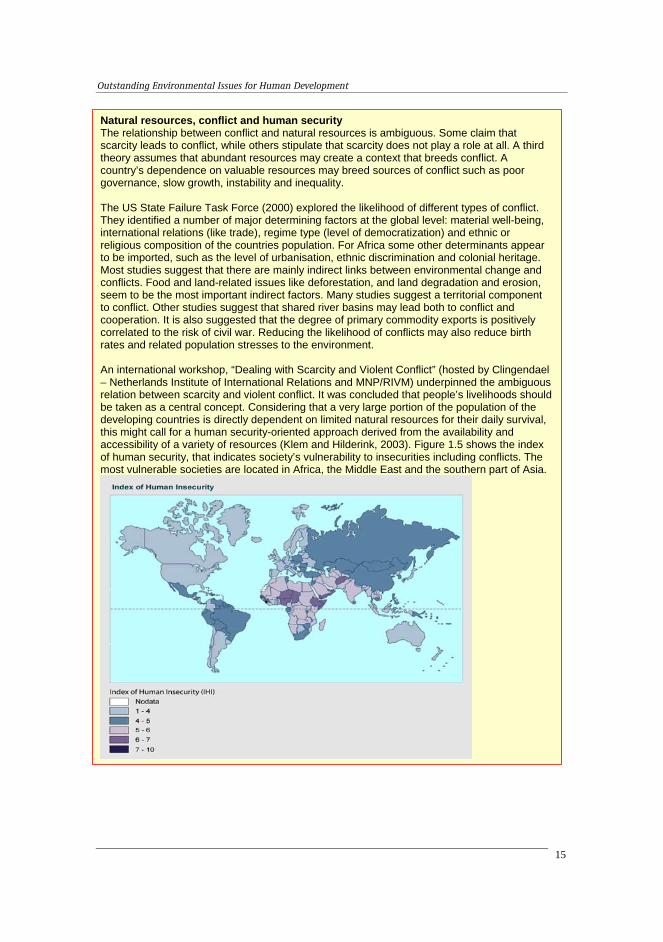
Natural resources, conflict and human security The relationship between conflict and natural resources is ambiguous. Some claim that scarcity leads to conflict, while others stipulate that scarcity does not play a role at all. A third theory assumes that abundant resources may create a context that breeds conflict. A country’s dependence on valuable resources may breed sources of conflict such as poor governance, slow growth, instability and inequality. The US State Failure Task Force (2000) explored the likelihood of different types of conflict. They identified a number of major determining factors at the global level: material well-being, international relations (like trade), regime type (level of democratization) and ethnic or religious composition of the countries population. For Africa some other determinants appear to be imported, such as the level of urbanisation, ethnic discrimination and colonial heritage. Most studies suggest that there are mainly indirect links between environmental change and conflicts. Food and land-related issues like deforestation, and land degradation and erosion, seem to be the most important indirect factors. Many studies suggest a territorial component to conflict. Other studies suggest that shared river basins may lead both to conflict and cooperation. It is also suggested that the degree of primary commodity exports is positively correlated to the risk of civil war. Reducing the likelihood of conflicts may also reduce birth rates and related population stresses to the environment. An international workshop, “Dealing with Scarcity and Violent Conflict” (hosted by Clingendael – Netherlands Institute of International Relations and MNP/RIVM) underpinned the ambiguous relation between scarcity and violent conflict. It was concluded that people’s livelihoods should be taken as a central concept. Considering that a very large portion of the population of the developing countries is directly dependent on limited natural resources for their daily survival, this might call for a human security-oriented approach derived from the availability and accessibility of a variety of resources (Klem and Hilderink, 2003). Figure 1.5 shows the index of human security, that indicates society’s vulnerability to insecurities including conflicts. The most vulnerable societies are located in Africa, the Middle East and the southern part of Asia.

Outstanding Environmental Issues for Human Development
16

Outstanding Environmental Issues for Human Development
17
2 Food and human development
2.1 Why is food important? One of the most important ecosystem services to humankind is food coming from the land (crops, meat and dairy products) and oceans (fish). As indicated in Chapter 1, childhood and maternal malnutrition contributes 30% of the attributable health risks worldwide, with numbers reaching over 40% in such regions as Africa. Eradication of hunger was therefore a logical choice as the first Millennium Development Goal. Better nutrition also plays an important role in meeting most of the other MDG targets. Malnutrition erodes human capital, and reduces resilience to shocks and productivity (impaired physical and mental capacity) ; it curbs school performance, since mental capacity is known to be reduced by malnutrition; better-nourished girls are more likely to stay in school and will, in this way, have more control over future choices; malnutrition is directly or indirectly associated with more than 50% of all child mortality and the main contributor to the burden of disease in the developing world; maternal health is compromised by an anti-female bias in allocations of food, health and care; finally, malnutrition hastens the onset of AIDS among HIV-positive individuals, weakens resistance to infections and decreases malaria survival rates. From an economic perspective, sustainable management of environmental resources for agriculture (primarily fertile land and water) and marine fisheries is also linked to the eight MDGs. Agriculture and marine fisheries are directly linked to the MDG 7 to ensure environmental sustainability) and as a highly traded commodity to MDG 8 to develop a global partnership. They are also indirectly linked to the other MDGs; terrestrial and marine food contributes to eradicating extreme poverty and hunger; small-scale agriculture and fisheries are an important source of employment for men
• Achieving the target on hunger plays an important role in meeting most of the other MDG targets.
• Although economic development decreases the percentage of people suffering from chronic undernourishment, overall food security can be affected by adverse environmental effects associated with increasing food production
• To avoid large arable land expansion in developing countries, considerable investments must be made to increase agricultural production. However, the impact on the nutrient balance in the developing countries is uncertain and introduces a new environmental risk to crop production.
• Sustainable fisheries are only achieved by applying a regional-specific set of solutions that include a reduction in the fishing effort and a transformation of fishing markets and governance.

Outstanding Environmental Issues for Human Development
18
and women, which ultimately contributes to increasing family incomes so that education, and child and maternal health needs can be met. Since nutrition is a basic need for human well-being, it is important to analyze whether the human demand for food can be sustained for the coming generations, even with higher caloric intake per capita and an increasing world population. The coinciding pressure on the environment challenges the human population to reach a state in which people can benefit from the ecosystem service without impacting these ecosystems irreversibly.
2.2 Trends and outlook The FAO estimates the current number of undernourished people, i.e. people whose food intake is insufficient to meet the daily dietary energy requirements, at about 800 million (FAO, 2000). The countries that face the largest degree of food insecurity suffer from chronic instability and conflict, poor governance, erratic weather, endemic poverty, agricultural failure, population pressure and fragile ecosystems. This group includes eighteen countries in sub-Saharan Africa, and Afghanistan, Bangladesh, Haiti, Mongolia and the Democratic People's Republic of Korea. In the FAO assessment of possible future developments in world food, nutrition and agriculture (Bruinsma, 2003), the total number of undernourished people is projected to be approximately 610 million in 2015 and 440 million in 2030, both of which exceed the MDG target of 408 million in 2015. Nevertheless, the proportion of the population undernourished could come close to being met (11% in 2015 and 10% as the MDG target). Both percentage-wise and in absolute numbers large progress is expected to be made in Latin America and South and East Asia, while the absolute numbers are expected to increase in Africa and the Middle East (Bruinsma, 2003). Another reason for concern is the increasing dependency of developing countries on food from other regions, because of the increasing demand for food that is not being met by the increase in food production. The expectation is that developing countries will have to import 265 million tonnes of grain in 2030 compared to 103 million tonnes in 1997-1999 (Bruinsma, 2003). This increasing dependency not only comes from the lack of productivity increase, but also from the expected rise in high-caloric diets (i.e. meat). For example, the meat consumption in China has increased by 2.6 kg per capita per year over the last 10 years. In combination with increasing dependency of one cash crop, such as Burundi, which is highly dependent (75%) on the export of coffee, these trends bring the realisation of the hunger eradication target in the least developing countries in danger.
Terrestrial food production The expected increase in food demand must be supplied from the land and the oceans, which will increase the pressure on the ecosystem services. Global growth in crop production will be achieved through the extension of arable land and an increase

Outstanding Environmental Issues for Human Development
19
in cropping intensity and yield (Bruinsma, 2003). Between 1995 and 2030 the global land area under arable agriculture is expected to expand from 1495 Mha to 1610 Mha at the cost of natural ecosystems (Bouwman et al., 2004). The expansion in developing regions will be even bigger, as arable land areas will shrink slightly in the industrialised and transition countries during this period. At the same time, less expansion of pastureland is expected to occur. In the 1970-1995 period, pastureland only increased by 4%, whereas in the same period world production of ruminant meat and milk increased by about 40%. This is because most of the increase in ruminant meat and milk production has been achieved by increasing the production in mixed and landless production systems, and much less so in pastoral systems (Bouwman et al., 2004). Impacts on Environment due to Trade Liberalization: Liberalization of trade will have environmental consequences, which might be positive or negative for a region. Positive environmental effects of trade liberalization can be removal of market distortions that prevent the spread of environmentally-friendly technologies, involvement of foreign investors who bring with them environmentally-friendly management practices and the dispersion
of foreign standards that force exporters to clean up their production processes. However, environmental standards can also be pushed lower by allowing competition with firms with less strict production standards. Moreover, trade liberalization can lead to a shift of agricultural production to high-productive regions like Latin America, with additional pressures on these regions through expansion of arable land and intensified agricultural practices. The figure shows the effect of trade liberalization on the size of arable land. Clearly, regions like Latin America and Other OECD (mainly Australia, Canada and USA) will benefit economically from trade liberalization at the cost of nature. In Europe, trade liberalization might lead to more abandonment of arable land, returning options for nature conservation and biomass plantations for energy use (Eickhout et al., 2004).
Effect of trade liberalization on size of arable land in different world regions as a consequence of shifts in trade regimes (Eickhout et al., 2004) What seems crucial for the agricultural sector is that environmental and trade agreements and policies must be sufficiently integrated or coordinated, to assure that they work together to improve the environment and attain the benefits of free trade. By looking at the sources of crop production (Table 2.2) it becomes clear that expansion of arable land only plays a minor role in the expected growth. Most of the

Outstanding Environmental Issues for Human Development
20
growth of crop production is projected to come from yield increase, mainly through technology improvements and increases in nutrient inputs. So far, low-N input systems have allowed to sustain a low per capita food production volume at low levels of crop yields, although through expansion of land under agriculture and at the cost of soil fertility. In fact, crop yields have shown no substantial increase in many countries, particularly in Africa (FAO, 2001). A high risk of land degradation prevails as a result of soil erosion, soil nutrient depletion and overgrazing, especially in the arid and semi-arid tropics and subtropics (Delgado et al., 1999; Seré and Steinfeld, 1996). In the light of these risks of land degradation, it is uncertain whether the increase in crop productivity will be achieved. Table 2.2 Sources of growth in crop production from 2000 to 2030 (in %) on the basis of data from Bouwman et al. (2004)
Arable land expansion
Increases in cropping intensity
Realised yield increases
Growth in crop production
Latin America 5% 13% 65% 83% Africa 10% 12% 68% 91% Asia 10% 8% 29% 47%
Looking in detail into the expected increase in arable land, some world regions will become more vulnerable since they are already using most of their potential land (see Figure 2.1, especially North Africa and South Asia, including India). When a region nears 100%, it needs all the productive lands to fulfil the food and feed production requirement. Consequently, such a region would be highly vulnerable to additional influences such as trade liberalization (see Text Box), unexpected shocks or extreme events.
Figure 2.1 Land in use as percentage of potential, as indicated by FAO (Bruinsma, 2003).

Outstanding Environmental Issues for Human Development
21
Marine food production Marine capture fisheries show a continue decline in all regions of the world. Figure 2.2 shows the loss in marine biomass in Southeast Asia between 1960 and 2000.
Figure 2.2 Changes in marine biomass in Southeast Asia, 1960 to 2000 (Christensen et al., 2003). In some areas of the world’s oceans the fishery landings are declining faster than in others, while some fisheries, e.g. demersal fisheries, are severely decreased. Under a business as usual scenario the trend is expected to continue; how steep the decline will be depends on a number of factors, including the cost of fuel, which is a significant expense for many fishing fleets (Pauly et al., 2003).
Figure 2.3 World’s fishery landings with extrapolations. The best-case scenario, which sustains current landings, is based on implementing environmentally proactive economic and social policies (e.g. eliminating subsidies or the use of destructive fishing gear). The worst-case scenario is based on an extrapolation of the current trend of declining landings, which started in the late 1980s, and high fuel prices (Pauly et al., 2003).

Outstanding Environmental Issues for Human Development
22
Fish is a highly valued and much traded commodity. Currently, 40% of fish production is traded; much of it on an international level, and this figure is high relative to other commodities such as wheat 20% and rice 5%. Over the last two decades the proportion of fish from developing countries that is being traded internationally has increased steadily. The trend of trading fish from the south to the north (see Figure 2.4) is expected to continue under a business as usual scenario but at a lower rate compared to the late 1980s and 1990s (Delgado et al. 2003).
Figure 2.4 Five major importing countries (coloured red) and the Exclusive Economic Zone (coloured blue), where the majority of exports of crustaceans (e.g. shrimp and lobster) and cephalopods (e.g. squid) originated in 1976 to 2000. For a similar map for other types of seafood see Alder and Watson (in prep). Small-scale fisheries are critical in coastal communities, since they are often the only source of income (poverty alleviation) and subsistence (hunger) for many people. A preliminary estimate of small-scale marine fisheries catches total approximately 31 million tonnes (Chuenpagdee and Pauly, in press). The catches and number of fishers varies significantly between regions (Table 2.3). The change in the supply of fish (kg/caput/year), which contributes to the alleviation of poverty and hunger, was fairly variable between 1992 and 2002; overall the supply of fish has increased, much of that increase fuelled by aquaculture. The consumption of fish is expected to continue to increase, but more slowly than in the past. Higher levels of increased consumption are expected in China and India, where high economic growth is forecast (Delgado et al., 2003). Increased consumption will increase the demand for high- and low-value fish, much of which will be met by aquaculture in

Outstanding Environmental Issues for Human Development
23
developing countries (Delgado et al., 2003). Aquaculture made up 31% of the global supply of food fish in 1997, and this is predicted to rise to 41% by 2020. This will add pressure to low-value small pelagic fish if most of this growth is in species that require fishmeal and fish oil for growth. The growth in aquaculture will not necessarily alleviate hunger if much of the farmed fish are high-value-export oriented. However, aquaculture does have the potential to contribute to improving the incomes of coastal communities. Table 2.3 Regional breakdown of key statistics on small-scale fisheries in Medium/Low-Human Development Index countries (Chuenpagdee and Pauly, in press)
2.3 Environmental threats As indicated in Section 2.2, there is an obvious tension between the hunger eradication target and the goal of nature conservation through land expansion and increased nutrient input. Eickhout et al. (2005) show this by analyzing the consequences of increase in food demand for the biodiversity goal of the Convention on Biological Diversity (“achieve by 2010 a significant reduction of the current rate of biodiversity loss at the global, regional and national level as a contribution to poverty alleviation and to the benefit of all life on earth”; CBD, 2002). The authors conclude that this biodiversity target will not be met, given the expected land expansion in Africa, Latin America and Asia needed for food production. The agricultural land expansion will have a massive impact on the extent of tropical forests, one of the indicators of the environmental MDG (see Chapter 5). The figures on land-use changes presented there do not, however, reflect the land transformations that occur as a consequence of losing the land’s productivity, and the abandonment of eroded and degraded land. On the basis of a data compilation, Bouwman and Leemans (1995) estimated an annual global loss of 4 Mha of degraded arable land, which was compensated by forest clearing. Moreover, climate change can also impact the productivity of land. Fischer et al. (2002) concluded that the crop yield of cereals in a region like South Africa would decrease by 40% at a global-mean temperature increase of 3 °C compared to pre-industrial levels.
Region (n)Fishers /
km2Total fishers
('000)Boats /
km2Total boats
('000)
Catch / fisher
(t/year)
Total catches (1000 t/year)
America / Caribbean (25) 0.85 1,220 0.36 242 0.43 547Africa (36) 0.93 980 0.21 187 2.21 2,040Asia / Pacific (18) 1.35 6,060 0.57 1,490 0.72 4,360Europe / Near East (18) 0.86 1,810 0.23 438 2.60 4,710
Total (mean) (0.97) 10,070 (0.31) 2,357 (1.88) 11,657

Outstanding Environmental Issues for Human Development
24
Figure 2.5 (right panel) presents an overall measure of environmental pressure, including the effect of climate change on productive arable land and the amount of available arable land for agricultural extension, the impacts of agriculture on soil erosion (mainly water erosion) and the impacts of irrigation on total available renewable water resources. The results are based on a framework developed by Lucas and Hilderink (2004), in which they distinguish between exposures (inadequate diet and trade issues), and socio-economic (poverty) and environmental threats (impacts on land and water). Economic growth increases the food security as higher incomes enable people to extend and diversify their diet by buying food on the market. However, the increase of global food production puts extra pressure on the required natural resources, thereby increasing the pressure on the food security. The economic growth according to the World Bank (2005) is also depicted in Figure 2.5 (left panel). The WB estimates that eradication of poverty will be met on a global scale, but several countries, mainly in Sub-Sahara Africa, will lag behind as their economic growth is insufficient. Figure 2.5 shows that the largest increase of environmental pressure can be expected in North Africa and the Middle East, and in South Asia (mainly India). As the pressure is highly aggregated to a regional scale, hot-spots are concealed. Regions showing large pressure increases may well include hot-spots where the pressure is even much greater. Figure 2.5 indicates that although economic development reduces the percentage of people suffering from chronic under nourishment, overall food security may be jeopardised by adverse environmental effects arising from increasing food production. The most vulnerable regions are Africa and the Middle East, and to a lesser extent, South Asia, where serious environmental impacts are projected, along with medium to low economic growth.
Figure 2.5 Growth in income up to 2015 (left panel) and increase in environmental pressure (right panel) in 2030 compared to 2000 (based on World Bank, 2005 and Bruinsma, 2003).
2.4 What can we do?
Towards sustainable terrestrial food production? For reasons of biodiversity and vulnerability, it would be advisable not to expand arable land further. For Europe and North America this would be achievable under baseline assumptions, though additional land may be required for producing biofuels to combat greenhouse gas emissions (see Chapter 4). Ultimately, this may involve

Outstanding Environmental Issues for Human Development
25
technology options, e.g. GMOs, which are heavily debated in the current context. For other regions, however, agricultural land expansion would seem highly probable. If land expansion were not allowed, the increases in yield in developing countries must be even higher than already assumed (see Table 2.1). As an example, let us assume that the required yield increase to keep the total arable land in Latin America constant can only come from maize. Figure 2.7 shows the additional yield increase in maize that is required. Compared to the assumed yield increase (from Bruinsma, 2003), the additional increase is very large. Still, the maize yield in Latin America is modest compared to the yields achieved in OECD Europe. Better yields might be achievable if agricultural practices in Latin America are completely adjusted, i.e. a shift of agricultural practices towards more productive areas. However, this shift will have major consequences for the local farmers. Another option to bridge the gap in yields is investment in local capacity building and technology transfer. Note that the impacts of additional nutrients needed to bring about the yield increase are not considered here.
Figure 2.6 Yield increase of maize in Latin America according the FAO projections (black line; Bruinsma, 2003) and the required yield increase, calculated to produce enough maize without land expansion between 2000 and 2030 (red line). The green line shows the yield of maize in OECD Europe.
Towards sustainable marine fisheries? Reaching the target of maintaining sustainable fish stocks and rebuilding depleted ones will require a number of initiatives at international, national and local levels. Many countries made a commitment to restore over-fished marine stocks to Maximum Sustainable Yields (MSY) by 2015 at the World Summit on Sustainable Development in 2002. While many debate the merits of MSY, there is agreement that principles, policies, and mechanisms for prioritising and allocating marine resources are needed to improve the current state of fisheries and to manage the impacts of fishing on marine ecosystems and on other sectors.

Outstanding Environmental Issues for Human Development
26
The single species approaches to managing fisheries have proven to be ineffective in maintaining fisheries. Ecosystem based fisheries management is considered a better approach, although, how to achieve this remains a challenge to management and research. In some cases this will include restoring the ecosystem where destructive fishing practices have been used. Ecosystem-based management of marine ecosystems requires more than regulating fisheries; other sectors such as aquaculture, shipping, and gas and oil will have to be included in an integrated manner. Placing fisheries management in an ecosystem-based management context leads to three categories of solutions with associated tools and approaches (Table 2.3) as identified by Pauly and Maclean (2003). • Reducing fishing effort – quotas, vessel buyback and destruction, marine reserves;
alternative income-generating activities and the precautionary approach • Transforming market – reduce subsidies, energy or carbon taxes, consumer
education, support for non-consumptive uses and intergenerational accounting • Transforming governance – strengthening institutions and laws, building capacity
to implement laws and management plans, adopting the Code of Conduct for Responsible Fishing (CCRF), reducing illegal, unregulated and unreported (IUU) fishing, reducing the scale of the fishing fleets and improved Exclusive Economic Zones (EEZ) access agreements.
These three categories apply globally. Using a combination of tools and approaches specific to the different marine ecosystems will enhance the effectiveness of management measures that will help to realize the MDGs (Table 2.4). Table 2.4 Priority solutions to meet the MDGs by 2015 (inspired by Pauly and McLean 2003) Solutions Areas Reducing effort Markets Governance North Atlantic • Catch quotas
• Vessel buyback • Reduce subsidies • Energy taxes • Consumer education
• Reducing the scale of fishing fleets
• Implementing CCRF South Atlantic • Catch quotas
• Marine reserves • Alternative income
generating
• Reduce subsidies • Apply • intergenerational
accounting
• Strengthening laws and institutions
• Capacity building • Improving EEZ
access agreements Tropical-Indo Pacific
• Alternative income generating
• Marine reserves
• Support for non-consumptive uses
• Reduce subsidies
• Reducing IUU • Strengthening laws
and institutions • Capacity building
Antarctic • Marine reserves • Precautionary approach
• Remove subsidies • Consumer education
• Strengthening laws • Reducing IUU
North Pacific • Quotas • Vessel buyback
• Reduce subsidies • Intergenerational
accounting • Energy tax
• Implementing CCRF • Reducing the scale of
fishing fleets • Reducing IUU in the
northwest Pacific
Outstanding Environmental Issues for Human Development
27
3 Water and Human Development
3.1 Why is water important? Water supply and sanitation services, and water as a resource, are critical to sustainable development. The most pressing issue still is most certainly found in MDG7 (target 10): “Halve the proportion of people without sustainable access to safe drinking water and sanitation by 2015”. Either no or unsafe water supply and sanitation contributes substantially to the environmentally related burden of disease. Unsafe water (supply, sanitation and hygiene) ranks 6th in the overall list of health determinants worldwide and third in Africa and Asia behind underweight and unsafe sex. However, water is also essential for eradicating extreme poverty and hunger, which will require enough water to produce crops. Promoting gender equality will only be possible when women do not have to spend so much of their time carrying water from large distances. Combating diseases will require safe water supply and sanitation. The period from 2000 to 2005 has been devoted to preparing for actions in the water arena. Progress in achieving the MDGs has been made, but not necessarily only because of actions in the framework of the MDGs. The 2005-2015 decade will be proclaimed as the International Decade for the Action − Water for Life. It will start on World Water Day, March 22, 2005.
3.2 Trends and outlook Water use has almost tripled in the last 50 years and can be expected to increase further in the coming years, as seen in the trends in global water withdrawals indicated in Figure 3.1 (Shiklomanov, 1999). The rapidly developing regions in Asia have already caused a significant increased use in water for agriculture, rising at about the same rate as the population growth. This increase is expected to dominate future water withdrawals even more strongly than at the moment. Agriculture
• Water use and consumption increase rapidly, especially in developing regions. A growing population and economy cause water stress to increase substantially in large parts of the world.
• Competition for water between users (including the natural environment) requires strict water management, preferably at river basin level.
• Drinking-water supply targets are within reach in most of the countries, but not in large parts of Africa and some Asian countries.
• Sanitation targets seem to be unreachable in Africa, most parts of Asia and some South American countries.
• Water pollution (eutrophication) increases with increasing agricultural production and sewerage systems. This endangers coastal regions, especially in southern and eastern Asia and the south Mediterranean.

Outstanding Environmental Issues for Human Development
28
accounts by far for the largest use of water. Total water use worldwide is about 4000 km3 per year. The share of agriculture in withdrawals is about 70%.
Figure 3.1 Global water withdrawal per continent (from Shiklomanov, 1999).
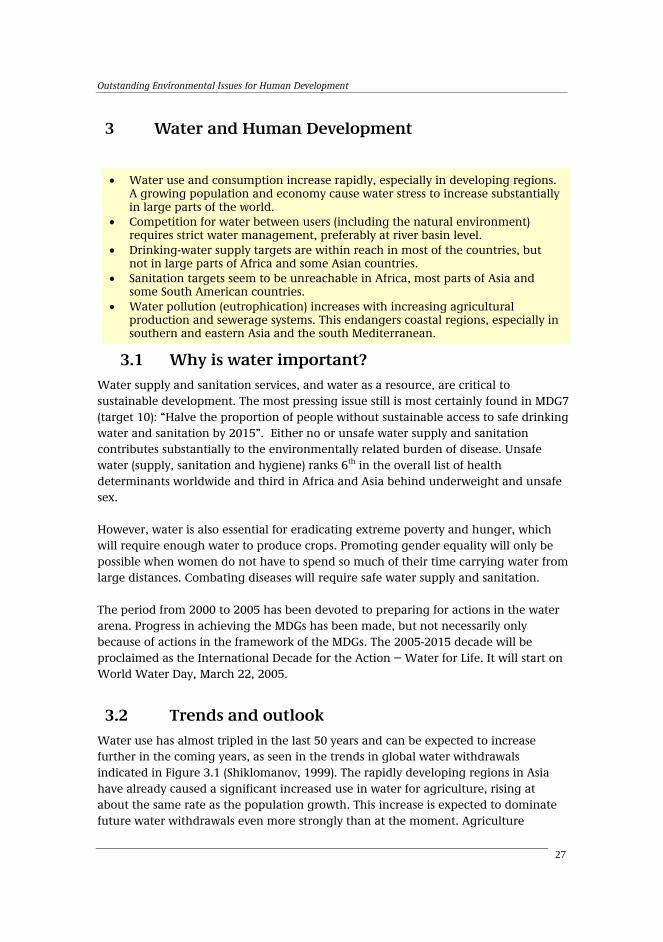
Drinking water supply and sanitation Over the past decades, the water supply and sanitation sector has been both an example of remarkable progress and a source of continued frustration. Progress is seen in the sense that over the past 20 years an additional 2.4 billion people have gained access to water and 600 million more people access to sanitation services. There is, however, continued frustration because some 1.1 billion people still do not have access to safe water and 2.4 billion lack access to improved sanitation services. The existing frustration is worsened by the fact that much of the gain in service coverage has been offset by population growth and rapid urbanisation. In 2000, 47% of the world’s population were urban dwellers, as opposed to 43.5% in 1990. The majority of these people live in Asia and Africa (Figure 3.2), but also in countries where services are distributed unevenly, with service provisions in rural areas generally lagging far behind those in urban areas (WHO/UNICEF, 2000/2002).
Outstanding Environmental Issues for Human Development
29
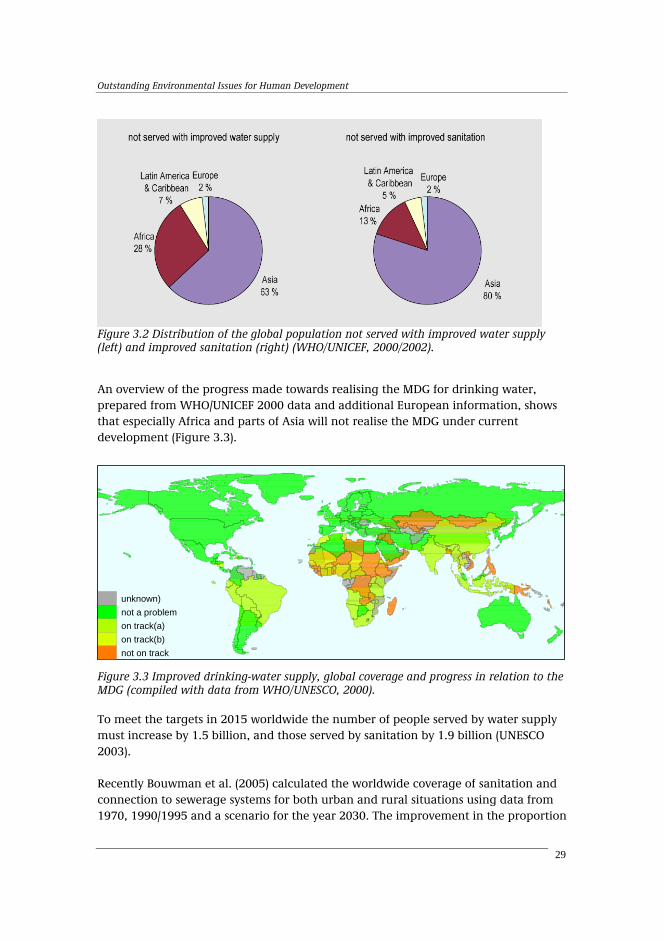
Figure 3.2 Distribution of the global population not served with improved water supply (left) and improved sanitation (right) (WHO/UNICEF, 2000/2002). An overview of the progress made towards realising the MDG for drinking water, prepared from WHO/UNICEF 2000 data and additional European information, shows that especially Africa and parts of Asia will not realise the MDG under current development (Figure 3.3).
unknown)not a problemon track(a)on track(b)not on track
Figure 3.3 Improved drinking-water supply, global coverage and progress in relation to the MDG (compiled with data from WHO/UNESCO, 2000). To meet the targets in 2015 worldwide the number of people served by water supply must increase by 1.5 billion, and those served by sanitation by 1.9 billion (UNESCO 2003). Recently Bouwman et al. (2005) calculated the worldwide coverage of sanitation and connection to sewerage systems for both urban and rural situations using data from 1970, 1990/1995 and a scenario for the year 2030. The improvement in the proportion
Outstanding Environmental Issues for Human Development
30
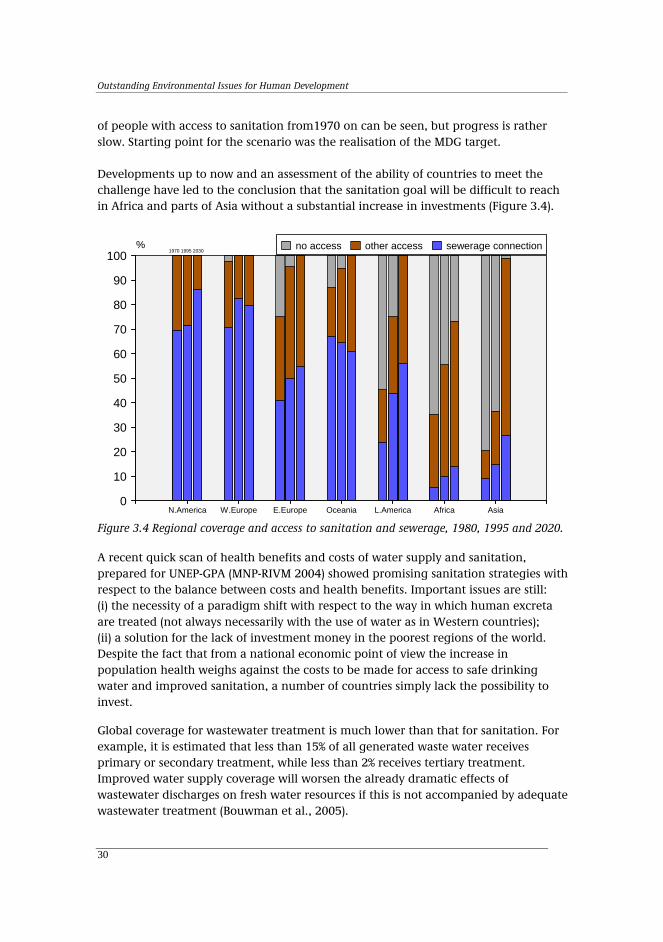
of people with access to sanitation from1970 on can be seen, but progress is rather slow. Starting point for the scenario was the realisation of the MDG target. Developments up to now and an assessment of the ability of countries to meet the challenge have led to the conclusion that the sanitation goal will be difficult to reach in Africa and parts of Asia without a substantial increase in investments (Figure 3.4).
N.America W.Europe E.Europe Oceania L.America Africa Asia0
10
20
30
40
50
60
70
80
90
100no access other access sewerage connection%
1970 1995 2030
Figure 3.4 Regional coverage and access to sanitation and sewerage, 1980, 1995 and 2020. A recent quick scan of health benefits and costs of water supply and sanitation, prepared for UNEP-GPA (MNP-RIVM 2004) showed promising sanitation strategies with respect to the balance between costs and health benefits. Important issues are still: (i) the necessity of a paradigm shift with respect to the way in which human excreta are treated (not always necessarily with the use of water as in Western countries); (ii) a solution for the lack of investment money in the poorest regions of the world. Despite the fact that from a national economic point of view the increase in population health weighs against the costs to be made for access to safe drinking water and improved sanitation, a number of countries simply lack the possibility to invest. Global coverage for wastewater treatment is much lower than that for sanitation. For example, it is estimated that less than 15% of all generated waste water receives primary or secondary treatment, while less than 2% receives tertiary treatment. Improved water supply coverage will worsen the already dramatic effects of wastewater discharges on fresh water resources if this is not accompanied by adequate wastewater treatment (Bouwman et al., 2005).
Outstanding Environmental Issues for Human Development
31
3.3 Environmental threats
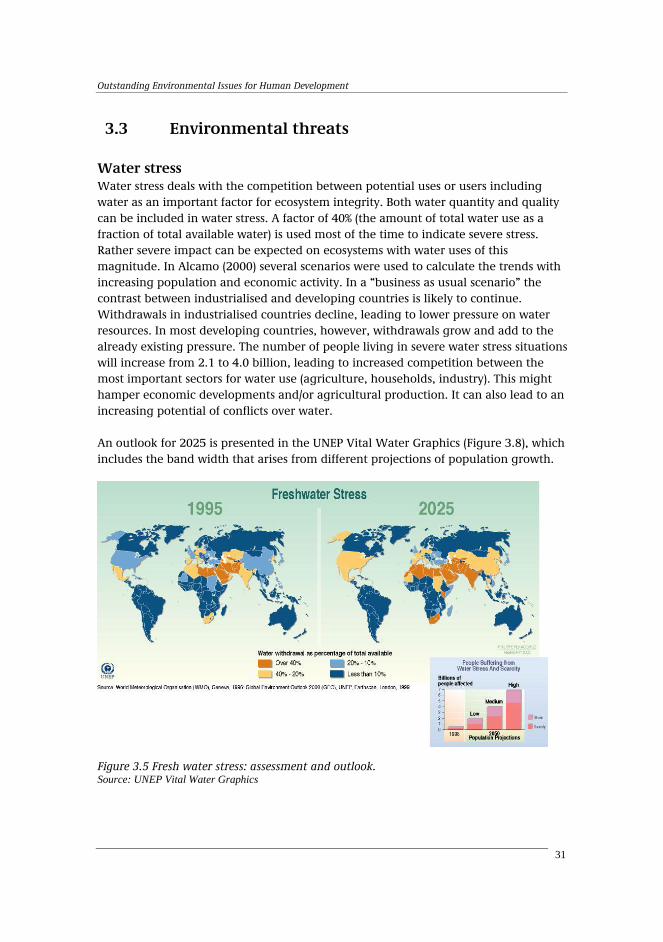
Water stress Water stress deals with the competition between potential uses or users including water as an important factor for ecosystem integrity. Both water quantity and quality can be included in water stress. A factor of 40% (the amount of total water use as a fraction of total available water) is used most of the time to indicate severe stress. Rather severe impact can be expected on ecosystems with water uses of this magnitude. In Alcamo (2000) several scenarios were used to calculate the trends with increasing population and economic activity. In a “business as usual scenario” the contrast between industrialised and developing countries is likely to continue. Withdrawals in industrialised countries decline, leading to lower pressure on water resources. In most developing countries, however, withdrawals grow and add to the already existing pressure. The number of people living in severe water stress situations will increase from 2.1 to 4.0 billion, leading to increased competition between the most important sectors for water use (agriculture, households, industry). This might hamper economic developments and/or agricultural production. It can also lead to an increasing potential of conflicts over water. An outlook for 2025 is presented in the UNEP Vital Water Graphics (Figure 3.8), which includes the band width that arises from different projections of population growth.
Figure 3.5 Fresh water stress: assessment and outlook. Source: UNEP Vital Water Graphics

Outstanding Environmental Issues for Human Development
32
From 2040 onwards, the global demand is projected to exceed the availability (Shiklomanov, 1999) Impacts of climate change have not been considered in these projections. Verhagen et al. (2004) addresses the issue of climate change, including water stress, extreme events and adaptation. Especially areas with subsistence agriculture show an increase in drought sensitivity. Population development (including the agricultural developments) dominates the effects of climate change in most of the regions of the world. (Vörösmarty et al., 2000).
Environmental impacts on aquatic ecosystems Increasing use of water in agriculture, households and industry, and a growing sanitation system (especially when carried out as sewerage systems) can have increasing impacts on rivers, lakes and coastal areas. Intensification of agriculture, necessary for food supply, is done worldwide by adding increasing amounts of nutrients and pesticides to the system. This inevitably leads to increasing amounts of these substances, soil particles and attached substances such as heavy metals leaking to surface and groundwater. Aquatic ecosystems sometimes first show an increase in productivity (biomass) and diversity, especially in ecosystems that originally are poor in nutrients. Fish stocks can improve with additional input of nutrients. Continuing input of nutrients invariably lead to a further increase in the growth of a limited number of species, mostly algae, leading to eutrophication. This happens both in fresh water and in coastal/marine ecosystems. Losses of biodiversity, episodic oxygen depletion, toxic algae etc. are some of the phenomena. Traditional drinking-water and sanitation systems have as starting point the assumption that human excreta (and part of the industrial waste streams) can best be treated when collected through a sewerage system and flushed with water. Industrial waste water is sometimes added into this system. Developments in the Western world show the success of this approach but also the limitations. There is increasing awareness that there might be more cost-effective approaches to the combination of drinking-water supply and sanitation in certain situations, also from an environmental point of view (MNP-RIVM, 2004). Bouwman et al. (2005) describe an assessment made of the nitrogen flux to the world’s oceans as an example of environmental stress from land to ocean. Figure 3.6 shows the relative increase, as expected in a scenario for 2030 expressed on a relative scale, using the situation of 1995 as a basis.

Outstanding Environmental Issues for Human Development
33
Figure 3.6 Change in river N load for individual basins in the 1995-2030 period (Bouwman et al., 2005). The major increase will be in Asia and Africa, leading to increasing eutrophication in large coastal areas. The global river nitrogen flux will increase by about 13% the coming three decades, with extremes of more than 25% in developing countries. This is in line with the present trends. The increase from point sources (after treatment) has been between 2% in industrialised countries to 33% in developing countries. Future N flux from point sources will decrease in developed countries, but continue to increase in developing countries. The total flux of nitrogen attributed to agriculture will increase worldwide by about 30%, in developing countries by about 40% and will remain more or less constant in other areas (Bouwman et al., 2005). Loss of nitrogen and other substances from agricultural land can be diminished with good agricultural practice (prevention of loss of soil, prudent application of fertilisers etc.). Nutrient fluxes from point sources can be prevented with the use of different collection systems for excreta and improved wastewater treatment techniques.
3.4 What can we do?
Dealing with water stress Agriculture is coming under more and more pressure to justify its use of the world's freshwater resources and to improve its productive and environmental performance. The allocations of raw water to agriculture (and the allocations within the agriculture sector) all need to be negotiated in a transparent way (FAO, 2004). Because water resources and effects are often non-marketed, it is extremely important to ensure that the “true” economic value of such resources are accounted for where
Outstanding Environmental Issues for Human Development
34
possible when making decisions on capital investment, and linked-water and environmental policy. As such, there is a fundamental connection between the issue of economic valuation of water resources and the pricing of water resources. Environmental, ecological and social concerns need to be reflected in any pricing system. Efficient allocation and sustainable use of water require the setting of the “correct” price for water, in other words, a price that corresponds to its marginal economic value. Many countries and water management agencies are turning increasingly to water pricing mechanisms to regulate irrigation water consumption as well (FAO, 2004). However, even correct pricing is not a guarantee for sustainable exploitation of water resources. Continued growth of the population and economic (including agricultural) activities can put too much demand on the capacity of a water system (groundwater, surface water or complete watershed). In this case, rather severe water stress can occur.
Drinking water and sanitation The cost of conventional water supply, sanitation and wastewater management services is prohibitive for low-income regions. Especially the cost of full wastewater management is phenomenal and will be beyond the reach of most developing nations. The World Bank estimates a 3% expenditure of a country’s GDP on environment as being reasonable, with half of this devoted to water problems. Poor countries would need about a thousand years to meet the MDG goals at this level of spending. For countries in transition, this is about a hundred years. Various sources have estimated the costs to achieve worldwide coverage of water supply and sanitation in 2025 at between 75 and 132 billion US$ per year. Here, we estimate a required per capita investment of 34 US$ per year. This investment covers only water supply and basic sanitation, and does not include any wastewater treatment. Including the cost of conventional wastewater treatment will result in a substantial rise of the costs to 104-124 US$ per capita per year. Such high investments are inaccessible, especially within the developing regions, so better alternatives will have to be found. An alternative for the cost-effective management of the urban water cycle is the 3-Step Strategic Approach (3-SSA). This approach, consisting of three steps as below, applies cleaner production principles to the urban water cycle. Steps are: 1) prevention and minimisation of use, 2) treatment for re-use and 3) planned discharge including stimulation of the self-purification capacity of the receiving water body. The systematic application of this approach is expected to yield substantial cost reductions and health benefits. The latter are estimated to be 1.5 billion cases of diarrhoea and 3.3 million deaths of children under the age of 5 due to faecal oral infections are reported annually. The total number of fatal cases due to faecal oral infections is estimated at about 5 million per year. Another 1.3 billion infections per year are caused by Ascariasis (roundworm). Improvement of water treatment, sanitation,
Outstanding Environmental Issues for Human Development
35
wastewater treatment and hygiene is likely to have the most effect on the reduction of faecal-oral diseases, and in doing so, reduce the health burden. The main benefit is the reduction of diarrhoeal diseases. Secondary benefits include improved nutritional status to reduced losses of nutrients via diarrhoea, improved productivity and income generation. Outcomes of the WHO-Choice model have been used to relate cost of water supply and sanitation interventions to health benefits. The results show a fairly reasonable cost per DALY, varying from 200 to 2000 US$/DALY, depending on the population density, the degree of urbanisation and the technology applied. Systematic application of alternative strategies, such as the 3-SSA, could substantially reduce costs. These alternatives could lead to substantial cost reductions or higher health gains per dollar, both of them improving efficiency (US$/DALY). More insights into the health economics of low-tech, sustainable options in water supply and sanitation are needed.
A matter of scales and interdependencies Even meeting de various MDGs is no guarantee for sustainable development. Feeding the peoples of the world, providing them with safe drinking water and adequate sanitation in combination with respect for nature might prove to be incompatible with an ever-growing population and increasing effects of agriculture and industry on our natural resources, at least with the present way of dealing with these issues. At the river basin level Integrated Water Resource Management (IWRM) might be the best way to proceed in reaching sustainable development. But not all river basins have enough carrying capacity for continuous development. Hydropower installations require dams and reservoirs thus causing an increase in evaporation and a decrease in discharge. The installations also cause substantial changes in the flow characteristics. Growing crops always increases evaporation. Extra nutrients will be necessary. Intensified agriculture is not possible at the moment without pest control. Integrated Water Resources management takes care of all these aspects within a river basin in a coherent way. It might, however, be useful to sometimes look at developments from an even wider point of view. As an example, analyses of the rising water demand from growing crops have shown that sometimes large amounts of water are connected with the export of agricultural product and, so, are not available for other purposes (because the water has evaporated). This amount of water is sometimes referred to as the “virtual water content” of products, meaning that the water is not “inside” the product but was necessary to produce the product. The virtual amount of water related to trade, calculated for all countries, shows that regions with a scarcity of water sometimes still grow products for export that require large amounts of water (Chapagain et al, 2004). An overview of net virtual water export is presented in Figure 3.10, which shows substantial impact from decisions on crop growth − decisions taken most of the time outside the IWRM domain.

Outstanding Environmental Issues for Human Development
36
Figure 3.7 Net virtual water export (green shades) and imports (red shades) IWRM assumes that decisions are taken at the river basin level. The example of virtual water already indicates that at least some of the decisions are taken at national level or even within the WTO. The timescale for such decisions is in terms of years. On the other hand, the decision to withdraw water at a specific place mostly is a local one. IWRM uses timescales of decennia. Global developments can only be influenced on even longer timescales. Farmers often decide themselves whether or not and when to withdraw water from surface or groundwater, or these decisions may be taken at the community level. Planning for larger infrastructures for water supply is done with time horizons of at least 20-30 years. Decisions at different scale levels, both in time and place, are not necessarily coherent. Availability of data and planning instruments is also not always guaranteed at the different levels. Providing decision makers with the necessary inputs from adjacent decision areas might help to improve the quality of decisions.
Outstanding Environmental Issues for Human Development
37
4 Energy and Human Development
4.1 Why is energy important for development? Development and access to sufficient energy are tightly linked. Lack of access to (modern) energy services can hinder people from meeting their basic needs. It limits enterprise development and results in lower productivity, and hence less scope for economic growth necessary to achieve social goals. Moreover, also the functioning of crucial public services, such as health care, education and public transportation, are severely hampered by the lack of sufficient and reliable energy. At the same time it is also clear that energy use is an important driver of a number of environmental and health problems. Although there are no MDGs for energy itself, it is clear that without access to modern energy and fundamental changes in the way energy is used, realisation of the MDGs is not possible. The relation between economic development and energy is clearly illustrated by the strong correlation that exists between the growth of Gross Domestic Product (GDP) and the increase in energy demand witnessed since the 1970s. Figure 4.1 shows that energy use has increased less quickly than world GDP. On average, an increase of 1% in GDP has been accompanied by an increase of slightly more than 0.5% of primary energy consumption. The two oil crises in the 1970/80s have induced a wave of energy efficiency technologies and policies which was, with a change towards a service- and
• Although energy is not part of the MDGs, it is clear that energy is an essential pre-condition for realizing virtually all MDGs.
• In 2000 1.6 billion people lack access to electricity, 2.4 billion rely on traditional biomass for heating and cooking; without additional policy efforts these numbers will hardly decline over the coming 25 years.
• The most important health and environmental problems related to energy use are indoor air pollution, land degradation, urban and regional air pollution and climate change.
• If the demand for modern energy is not fulfilled in an environmentally sound manner, this will increasingly result in negative impact on development.
• Human induced climate change poses an increasing risk to the achievement of the MDGs and sustainable development in the longer term. Developed countries will need to provide financial and technical support to developing countries to deal with this threat. Main streaming climate change concerns in developing planning and climate proving of development programmes and development aid can reduce these risks.
• Limiting the risks of climate change for sustainable development requires global greenhouse gas emissions to be significantly reduced during this century. This requires developed countries to strengthen their reduction efforts, but also early contributions from developing countries.
• Synergies exist between the energy for development agenda and environment, health and energy security related goals. These could be captured with sustainable development strategies, which require a broad and integrated perspective on energy and development planning which is often lacking currently.
Outstanding Environmental Issues for Human Development
38
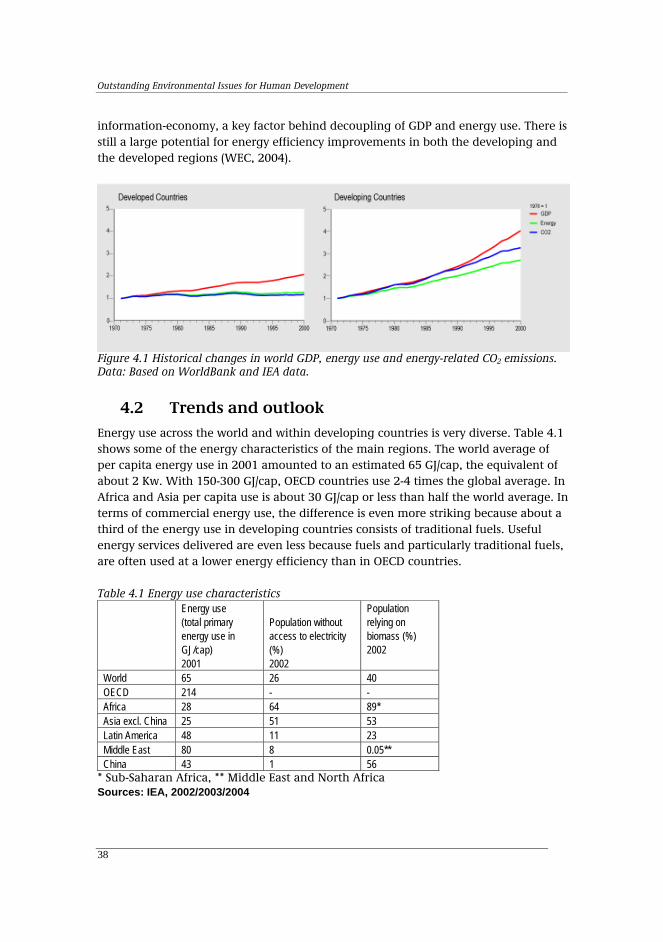
information-economy, a key factor behind decoupling of GDP and energy use. There is still a large potential for energy efficiency improvements in both the developing and the developed regions (WEC, 2004).
Figure 4.1 Historical changes in world GDP, energy use and energy-related CO2 emissions. Data: Based on WorldBank and IEA data.
4.2 Trends and outlook Energy use across the world and within developing countries is very diverse. Table 4.1 shows some of the energy characteristics of the main regions. The world average of per capita energy use in 2001 amounted to an estimated 65 GJ/cap, the equivalent of about 2 Kw. With 150-300 GJ/cap, OECD countries use 2-4 times the global average. In Africa and Asia per capita use is about 30 GJ/cap or less than half the world average. In terms of commercial energy use, the difference is even more striking because about a third of the energy use in developing countries consists of traditional fuels. Useful energy services delivered are even less because fuels and particularly traditional fuels, are often used at a lower energy efficiency than in OECD countries. Table 4.1 Energy use characteristics
Energy use (total primary energy use in GJ/cap) 2001
Population without access to electricity (%) 2002
Population relying on biomass (%) 2002
World 65 26 40 OECD 214 - - Africa 28 64 89* Asia excl. China 25 51 53 Latin America 48 11 23 Middle East 80 8 0.05** China 43 1 56
* Sub-Saharan Africa, ** Middle East and North Africa Sources: IEA, 2002/2003/2004
Outstanding Environmental Issues for Human Development
39
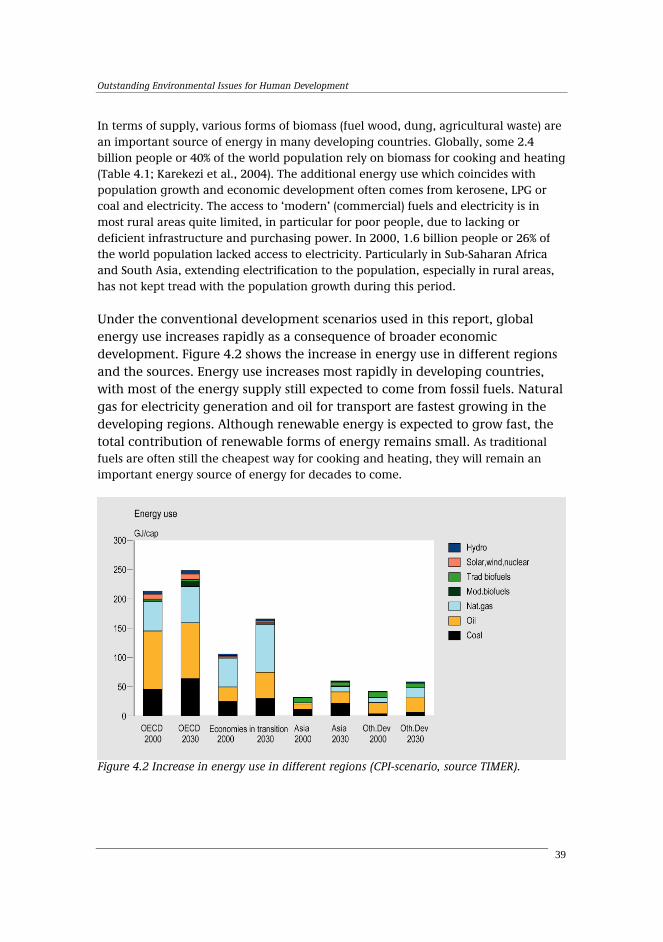
In terms of supply, various forms of biomass (fuel wood, dung, agricultural waste) are an important source of energy in many developing countries. Globally, some 2.4 billion people or 40% of the world population rely on biomass for cooking and heating (Table 4.1; Karekezi et al., 2004). The additional energy use which coincides with population growth and economic development often comes from kerosene, LPG or coal and electricity. The access to ‘modern’ (commercial) fuels and electricity is in most rural areas quite limited, in particular for poor people, due to lacking or deficient infrastructure and purchasing power. In 2000, 1.6 billion people or 26% of the world population lacked access to electricity. Particularly in Sub-Saharan Africa and South Asia, extending electrification to the population, especially in rural areas, has not kept tread with the population growth during this period. Under the conventional development scenarios used in this report, global energy use increases rapidly as a consequence of broader economic development. Figure 4.2 shows the increase in energy use in different regions and the sources. Energy use increases most rapidly in developing countries, with most of the energy supply still expected to come from fossil fuels. Natural gas for electricity generation and oil for transport are fastest growing in the developing regions. Although renewable energy is expected to grow fast, the total contribution of renewable forms of energy remains small. As traditional fuels are often still the cheapest way for cooking and heating, they will remain an important energy source of energy for decades to come.
Figure 4.2 Increase in energy use in different regions (CPI-scenario, source TIMER).

Outstanding Environmental Issues for Human Development
40
Energy security The rapid increase in energy use poses considerable challenges for energy security. In very general terms, supply constraints as a result of resource depletion per se are not likely to be felt globally in the coming decades. At the same time, the short- term regional risks will increase: prices of fossil fuels are likely to become more volatile and high demand for fossil fuels from Asia will change energy markets. For both oil and natural gas, production is projected to come increasingly from a limited number of supply countries. The World Bank has estimated that a 10 US$/barrel rise in the price of crude oil would worsen the current account balance of oil-importing countries by over 1% of GDP; for Africa, the negative impact was even estimated at 2% of GDP (quoted in Kok et al., 2004).
4.3 Environmental threats As a consequence of energy production and consumption, a series of environmental problems arise, this, in turn, will have a negative impact on human development and the realisation of the MDGs.
Indoor air pollution The use of traditional biomass sources causes substantial environmental and health problems. Health problems are primarily caused by indoor air pollution. Firewood and dung is traditionally burned in open fires or poorly functioning stoves, often in inadequately ventilated spaces. The most common effects are acute respiratory infections by children and chronic lung disease by adults. The main health impacts of indoor air pollution are shown in Table 4.2. Some 1.6 million deaths per year are estimated to occur from exposure to indoor air pollution in poorly ventilated spaces (WHO, 2000); 25% occur in India and another 25% in Sub-Sahara Africa. Not only is mortality important, but also illness due to indoor air pollution has made a substantial contribution to the loss of DALYs (see also Chapter 1). The total global burden of disease resulting from indoor air pollution as a percentage of total attributable DALYs is around 4.8%. Globally, indoor air pollution demands a 29% higher toll of DALYs for women than men. Table 4.2 Attributable DALYs(in %) and deaths (1000s) due to indoor smoke from solid fuels, 2000 (WHO, 2002) World Africa Americas Eastern
Mediterranean Europe South
East Asia Western Pacific
DALYs 4.8% 5.3% 1.2% 5.2% 0.5% 6.8% 5.8% Deaths 1619 392 26 118 21 559 503
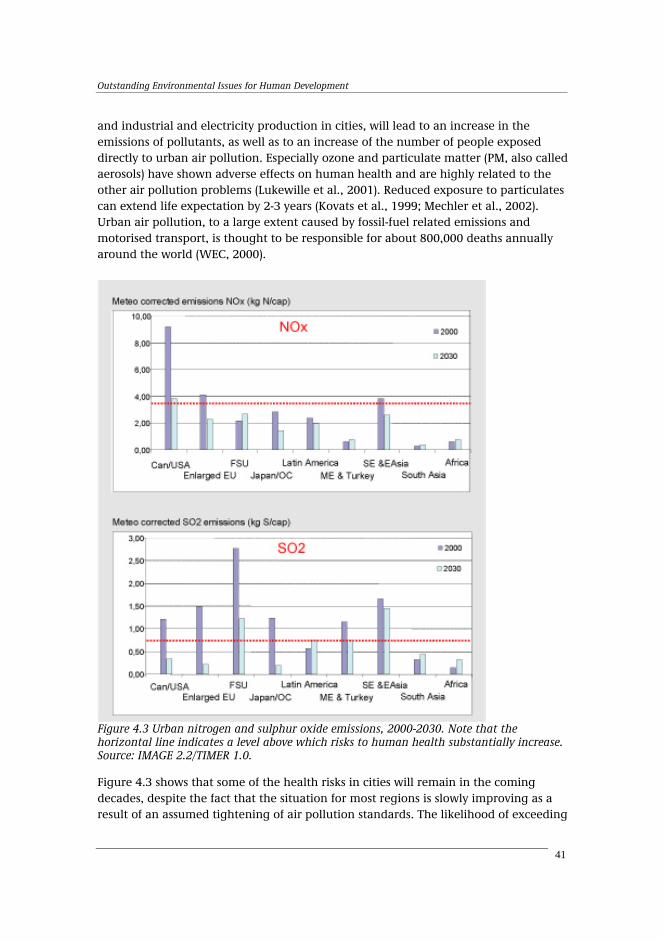
Urban and regional air pollution By the year 2015 more than half (52%) of the people living on this planet are expected to live in urban areas. Large metropolitan agglomerations (123 cities above 3 million inhabitants) will inhabit 860 million or 25% of the city population. Increased transport,
Outstanding Environmental Issues for Human Development
41
and industrial and electricity production in cities, will lead to an increase in the emissions of pollutants, as well as to an increase of the number of people exposed directly to urban air pollution. Especially ozone and particulate matter (PM, also called aerosols) have shown adverse effects on human health and are highly related to the other air pollution problems (Lukewille et al., 2001). Reduced exposure to particulates can extend life expectation by 2-3 years (Kovats et al., 1999; Mechler et al., 2002). Urban air pollution, to a large extent caused by fossil-fuel related emissions and motorised transport, is thought to be responsible for about 800,000 deaths annually around the world (WEC, 2000).
Figure 4.3 Urban nitrogen and sulphur oxide emissions, 2000-2030. Note that the horizontal line indicates a level above which risks to human health substantially increase. Source: IMAGE 2.2/TIMER 1.0. Figure 4.3 shows that some of the health risks in cities will remain in the coming decades, despite the fact that the situation for most regions is slowly improving as a result of an assumed tightening of air pollution standards. The likelihood of exceeding
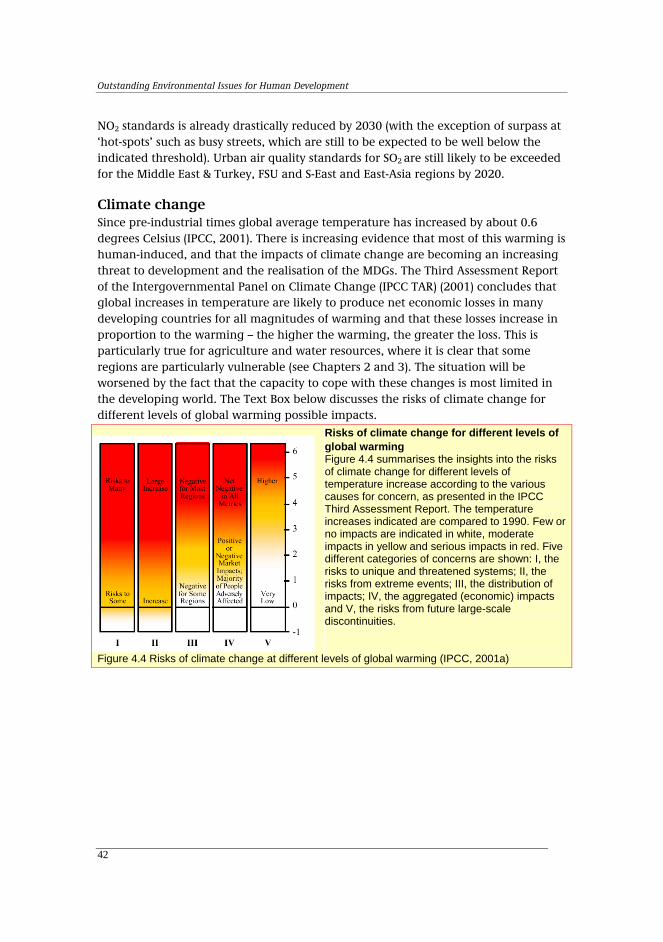
Outstanding Environmental Issues for Human Development
42
NO2 standards is already drastically reduced by 2030 (with the exception of surpass at ‘hot-spots’ such as busy streets, which are still to be expected to be well below the indicated threshold). Urban air quality standards for SO2 are still likely to be exceeded for the Middle East & Turkey, FSU and S-East and East-Asia regions by 2020.
Climate change Since pre-industrial times global average temperature has increased by about 0.6 degrees Celsius (IPCC, 2001). There is increasing evidence that most of this warming is human-induced, and that the impacts of climate change are becoming an increasing threat to development and the realisation of the MDGs. The Third Assessment Report of the Intergovernmental Panel on Climate Change (IPCC TAR) (2001) concludes that global increases in temperature are likely to produce net economic losses in many developing countries for all magnitudes of warming and that these losses increase in proportion to the warming – the higher the warming, the greater the loss. This is particularly true for agriculture and water resources, where it is clear that some regions are particularly vulnerable (see Chapters 2 and 3). The situation will be worsened by the fact that the capacity to cope with these changes is most limited in the developing world. The Text Box below discusses the risks of climate change for different levels of global warming possible impacts.
Risks of climate change for different levels of global warming Figure 4.4 summarises the insights into the risks of climate change for different levels of temperature increase according to the various causes for concern, as presented in the IPCC Third Assessment Report. The temperature increases indicated are compared to 1990. Few or no impacts are indicated in white, moderate impacts in yellow and serious impacts in red. Five different categories of concerns are shown: I, the risks to unique and threatened systems; II, the risks from extreme events; III, the distribution of impacts; IV, the aggregated (economic) impacts and V, the risks from future large-scale discontinuities.
Figure 4.4 Risks of climate change at different levels of global warming (IPCC, 2001a)

Outstanding Environmental Issues for Human Development
43
4.4 What can we do?
Towards a sustainable energy sector? Energy is an essential pre-condition for realising virtually all MDGs. Currently, many people lack access to modern energy sources. Therefore, over the coming years an intensified policy effort will be needed to provide universal access to modern energy and to afford investment in realising the MDGs. Combining both the demand for additional energy services and keeping environmental pressures within limits (particularly for climate change) will be a major sustainability challenge for the energy sector in the coming decades. A full menu of options will be needed to meet this challenge. All these options have their own benefits and risks that include concerns about energy for development, energy security and the environment, which need to be taken into account while developing long-term energy transitions.
Energy for development The results of IEAs Millennium Development Goals Scenario (2004) provide insight into actions and investments required to accelerate the process of energy development in poor countries. Meeting the MDG on poverty by 2015 implies a need to very rapidly expand the access to modern energy services, including the supply of electricity to another 600 million people. Modern cooking and heating fuels need to be provided to 700 million more people to reduce the total number of people relying on traditional biomass by about 550 million by 2015, i.e., from 2.40 billion in 2002 to fewer than 1.85 billion in 2015 (IEA, 2004). The investment needs in developing countries over the coming 30 years - as a percentage of GDP - are substantial: 2.0% for developing countries (including 4.8% for Africa) compared with 0.4% for OECD countries. Approximately 10% extra investment (200 billion US$) in the electricity sector are needed to realise the electricity goal in the Millennium Development Scenario (IEA, 2003, 2004).
Energy security As countries further develop, they witness a steep increase in energy demand. Increasingly, issues of energy security will dominate the energy agenda of countries. There are several energy security options with co-benefits for improving access to energy and environment. Improvement of the efficiency of both energy supply and end-use will help in addressing energy security and the economic situation of countries and their respective energy sectors. At the same time this efficiency improvement will also help in improving the environmental situation of countries. The overall potential of cost-effective energy efficiency gains in developing countries is estimated at 30-45%. Diversification by stimulating the use of local and renewable energy resources might be another attractive strategy to ensure energy security in developing countries.

Outstanding Environmental Issues for Human Development
44
Air pollution Indoor air pollution problems can be reduced by the introduction of more efficient cookers/stoves, the introduction of cleaner fuels (gas, “smokeless” coal), as well as education and awareness-raising about health impacts and better ventilation. The costs of 150-200 US$ per DALY saved, found in a case-study for India, for example, compares well with a range of other preventive and curative health interventions. Meeting the increasing demand for energy with use of fossil fuels and traditional combustion technologies results in urban and regional air pollution. However, several options exist to reduce the negative environmental and health effects of large-scale fossil fuel consumption, such as the substitution by renewable energy or cleaner fossil fuels (such as natural gas) and deployment of cleaner fossil fuel technologies. In the longer term carbon capture and storage technologies might become an interesting option, especially for coal-rich countries. Many trade-offs are at stake when using nuclear energy. Although on the one hand, its use is beneficial for energy security and limiting greenhouse gas emissions, on the other, there are also problems such as safety risks of operations, the storage of waste and proliferation. At this stage, one may question the possibility of nuclear energy as a sustainable long-term solution. The rapid growth of transport warrants further attention for this sector, as there is only a limited number of options available in the short- and mid-term to limit the use of fossil fuels for transport and minimise environmental impacts. Urban and regional air pollution policies can benefit by dealing with these in combination with climate policies, as there are many synergies among the problems signalled here (see Text Box below). Introducing climate change policies will stimulate further improvements in air quality.

Outstanding Environmental Issues for Human Development
45
Climate change The objective of the United Nations Framework Convention on Climate Change is specified in Article 2: greenhouse gas concentration levels need to be stabilised at levels that would prevent dangerous anthropogenic interference with the climate system. Such levels should be achieved within a timeframe sufficient to allow ecosystems to adapt naturally to climate change, to ensure that food production is not threatened and to enable economic development to proceed in a sustainable manner (UNFCCC, 1992). At the political level few states have indicated what the implications of Art. 2 could be. Only the European Union’s Environment Council agreed in 1996 that global temperatures should not be allowed to exceed 2 degrees Celsius above pre-industrial levels. In the short-term, priority for developing countries is how to adapt to climate change impacts both at national and regional levels, as well as at international level within the UNFCCC. Taking stock of the current situation, the following broad conclusions with respect to climate adaptation could be drawn (Bouwer et al., 2004):
Co-benefits of air pollution and climate change policies There is an increasing awareness of the importance of the linkages between air pollution and greenhouse gases. Many air pollutants and greenhouse gases have common sources, their emissions interact in the atmosphere, and either separately or jointly, they cause a variety of environmental effects on local, regional and global scales. Thus, emission control strategies that simultaneously address air pollutants and greenhouse gases may lead to a more efficient use of resources on all scales. Current studies indicate that in regions currently considering climate policies, potential co-benefits could be substantial, with financial savings in the order of 20%-50% of total climate control costs for the Kyoto Protocol period (e.g. van Vuuren et al., 2003b). Several studies indicated that the sulphur-related acidification risks in 2025 and 2050 for ecosystems might be the worst in the Asian regions. Figure 4.5 shows that, under baseline assumptions, the number of ecosystems receiving S-deposition above their critical loads increases substantially over time. As a co-benefit of climate policies (here calculated for a stabilisation scenario of 550 ppmv CO2-eq (2030-S550e), the areas with exceedances are reduced in most countries.
Acidification risks.
2030 - Baseline19952030 - S550e
Figure 4.5 Percentage of ecosystem areas showing exceedances of critical loads (van Vuuren et al., 2003a).The percentile value indicates the percentage of each grid cell surface, where an exceedance of the critical level for acid deposition is exceeded

Outstanding Environmental Issues for Human Development
46
• Climate change impacts may seriously threaten the realisation of the MDGs if no effective adaptation policies are developed.
• Countries have to prepare for an increase in climate change related weather impacts. Preparing for increased climate variability in the short term may help a country to adapt to long-term climate change.
• Adaptation measures need to be integrated in national and sector development plans, and development co-operation activities. This is currently not happening, although many opportunities are available.
• Adaptation in developing countries will involve large additional costs that cannot easily be covered by local communities and developing country governments only. In addition, an increase in weather-related extreme events will raise the demand for funding of disaster preparedness, disaster relief and reconstruction.
While adaptation to climate change is mainly a national and local issue that needs to be mainstreamed in current development planning, the large additional costs involved require the international community to consider new ways of ensuring that the impacts of climate change do not impede the realisation of the MDGs. The following actions could be considered:
• There is a need to support the mainstreaming of climate change in national and sector development plans; mainstreaming will require considerable capacity-building and improved use of such mechanisms as risk management, Integrated River Basin Management, Coastal Zone Management and Sustainable Livelihood Approaches to ensure that development takes places in a “climate-safe” manner.
• Development aid donors and multilateral development agencies, and financing institutions, should climate-proof all their projects and programmes.
• An international solution needs to be sought for supporting the funding of adaptation efforts by developing countries, in particular, the least-developed countries. This should secure replenishment of funds under the Kyoto Protocol and UNFCCC, enable the creation of insurance mechanisms to deal with the increasing risks of extreme weather events, allow additional costs related to the mainstreaming of adaptation in development plans to be financed and, finally, further “climate proofing” of development activities. One possibility could be to agree on an increase in ODA funding by adding a climate fee.
From a long-term perspective, mitigation is the best way of adaptation. Without sufficient mitigation climate change is likely to render adaptation more and more ineffective. This raises the question of what level of emission control is needed. If the EU long-term target of a maximum of 2 degrees Celsius temperature is considered as the threshold for avoiding dangerous climate change (see Text Box on risks of climate change), this would require a stabilisation of the concentrations of greenhouse gases in the atmosphere at a level of 450 - 400 ppmv CO2-equivalent in the long term
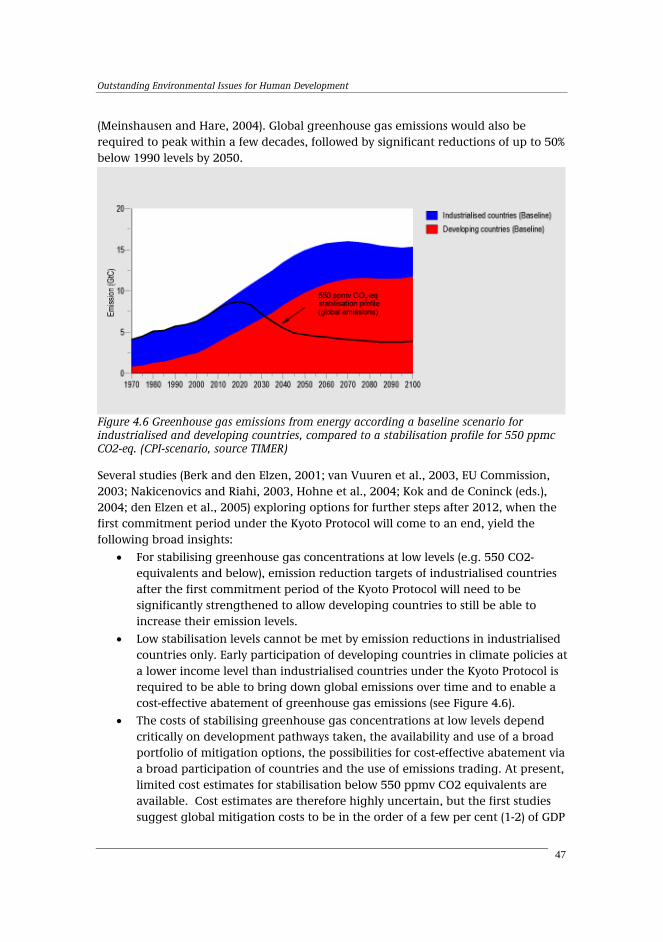
Outstanding Environmental Issues for Human Development
47
(Meinshausen and Hare, 2004). Global greenhouse gas emissions would also be required to peak within a few decades, followed by significant reductions of up to 50% below 1990 levels by 2050.
Figure 4.6 Greenhouse gas emissions from energy according a baseline scenario for industrialised and developing countries, compared to a stabilisation profile for 550 ppmc CO2-eq. (CPI-scenario, source TIMER) Several studies (Berk and den Elzen, 2001; van Vuuren et al., 2003, EU Commission, 2003; Nakicenovics and Riahi, 2003, Hohne et al., 2004; Kok and de Coninck (eds.), 2004; den Elzen et al., 2005) exploring options for further steps after 2012, when the first commitment period under the Kyoto Protocol will come to an end, yield the following broad insights:
• For stabilising greenhouse gas concentrations at low levels (e.g. 550 CO2-equivalents and below), emission reduction targets of industrialised countries after the first commitment period of the Kyoto Protocol will need to be significantly strengthened to allow developing countries to still be able to increase their emission levels.
• Low stabilisation levels cannot be met by emission reductions in industrialised countries only. Early participation of developing countries in climate policies at a lower income level than industrialised countries under the Kyoto Protocol is required to be able to bring down global emissions over time and to enable a cost-effective abatement of greenhouse gas emissions (see Figure 4.6).
• The costs of stabilising greenhouse gas concentrations at low levels depend critically on development pathways taken, the availability and use of a broad portfolio of mitigation options, the possibilities for cost-effective abatement via a broad participation of countries and the use of emissions trading. At present, limited cost estimates for stabilisation below 550 ppmv CO2 equivalents are available. Cost estimates are therefore highly uncertain, but the first studies suggest global mitigation costs to be in the order of a few per cent (1-2) of GDP
Outstanding Environmental Issues for Human Development
48
by 2050. The distribution of costs is highly dependent on the allocation of emission allowances. Developing countries may gain from emissions trading if supplied with sufficient emission allowances, while carbon-intensive and energy-exporting countries tend to have higher costs than others.
• Climate policies may have significant co-benefits, both in terms of reduced emissions of regional air pollutants such as SO2/NOx and of avoided costs for controlling these gases. For developing countries, co-benefits could be important in supporting sustainable development strategies (see Text Box).
It is important to recognise that in many developing countries environmentally sound programmes are often implemented for other reasons than climate change, but reduce vulnerability or greenhouse gas emissions as a side-effect. These actions are motivated by common drivers such as poverty alleviation, economic growth, energy security and health (Chandler, 2002; Davidson et al., 2003). What is needed over the coming years is an open dialogue between developed and developing countries on the basis of the principles embedded in the UNFCCC, to explore:
• What levels of climate change should be considered dangerous and detrimental to the achievement of long-term goals of sustainable development.
• Strategies for industrialised countries to continue taking the lead in abating climate change, and achieving low greenhouse-gas intensive economies in the long term.
• Criteria and viable approaches for defining contributions from developing countries to follow suit but that are compatible with meeting the MDG and sustainable development strategies.

Outstanding Environmental Issues for Human Development
49
5 Biodiversity and Human Development
5.1 Why is biodiversity important? Biodiversity represents the abundance and richness of genes, species and habitats. It is basically forests that accounts for the (terrestrial) biodiversity. Forest resources offer a number of important goods and services for human use. Poor people tend to be the most dependent upon the direct utilisation of biodiversity for their livelihoods. Important goods and services are timber, fibre and food; maintaining agricultural productivity; regulation of climate (see box), water and diseases; reduced vulnerability and cultural services (MA 2003). Biodiversity has its intrinsic value as well. Over the last century, some people benefited from actions causing changes in biodiversity, but others have experienced deterioration in well-being with some even being pushed into poverty by these changes (UNEP, 2004). This is why the preservation of biodiversity is essential for the sustainable, long-term production of human basic needs. The importance of biodiversity for humanity has been acknowledged internationally in recent environmental agreements such as the United Nations Framework Convention on Climate Change (UNFCCC), the Convention on Biological Diversity (CBD) and the United Nations Convention to Combat Desertification (UNCCD). The importance of preserving biodiversity is reflected in the MDG framework in indicator 26 (Proportion of land area covered by forest) and indicator 27 (Ratio of area protected to maintain biological diversity to surface area).
5.2 Trends and outlook Worldwide, biodiversity is deteriorating at an unprecedented rate. Biodiversity, expressed as the Natural Capital Index (NCI), which is defined as the difference in the mean abundance of species since industrialization has declined by almost 30 % since industrialisation. Eventually, if no measures are taken, many species will come under threat and then become extinct (see also the forthcoming Millennium Ecosystem
• Biodiversity is deteriorating at an unprecedented rate as a result of continuing habitat loss, fragmentation, pollution and climate change. The rate of loss continues, eventually causing the extinction of many species
• The area of protected land is increasing but increase is insufficient to prevent biodiversity loss. This land is a poor indicator for measuring biodiversity.
• Preserving biodiversity and meeting poverty goals is difficult to achieve. • Further increasing protected areas, reducing land conversion by intensification
of agriculture, putting a halt to piecemeal encroachment along roads and implementing the Kyoto protocol may be helpful actions.

Outstanding Environmental Issues for Human Development
50
Assessment; MA, 2005). At the moment, between 10 and 50% of well-studied higher taxonomic groups are under threat (Bailie et al., 2004).
Figure 5.1 Global biodiversity change expressed as the Natural Capital Index (NCI): the difference in the mean abundance of species since industrialization. The NCI is calculated using pressures (Alkemade et al., 2005). Projections are based on the FAO scenario (Bruinsma, 2003). The major causes of change are (1) agriculture (land-use change and intensification, including nitrogen emissions), (2) forestry (exploitation for timber production), (3) infrastructure (directly due to fragmentation and disturbance, and indirectly due to associated small-scale land conversion and piecemeal encroachment) and (4) climate change. Biodiversity loss is expected to continue to approximately 64% in 2030 (Fig. 5.1). This implies that measures currently in place are not enough to reduce the rate of loss of biodiversity. Especially in the African and Asian regions, where the NCI still will decrease, from 80% to 70% in Africa and 70% to 50% in Asia in the coming 30 years. Causes leading to change in biodiversity in the future are roughly the same as at present, in which climate change is a factor of increasing importance. Similar conclusions were drawn in the Millennium Ecosystem Assessment MA (UNEP, 2004). The MA also concludes that the distribution of species on earth is becoming more homogenous; in other words, differences between sets of species from different locations are diminishing. Changes in biodiversity are not equally distributed throughout the world. Figure 5.2 shows the lowest biodiversity in Europe, North America, and Asia, but also that the largest changes are expected in sub-Saharan Africa. Similar patterns of biodiversity loss occur in the oceans, where a decrease of biomass and a changing of trophic structure indicate a decrease of mean abundance of species (see Chapter 2, Figure 2.2).

Outstanding Environmental Issues for Human Development
51
Figure 5.2 Biodiversity expressed as the Natural capital Index (NCI): the difference in the mean abundance of species since industrialization, in 1970 and 2030. The NCI is calculated using pressures (Alkemade et al., 2005). Projections are based on the FAO scenario (Bruinsma, 2003).
Outstanding Environmental Issues for Human Development
52
What is happening to forests? Most of the forest loss has occurred during the industrial age, particularly during the last two centuries, and in some cases much more recently. In Indonesia, for example, forest covered 159 million ha (82% of land area) as recently as 1950. By 1985, forest cover had declined to 119 million ha, a loss of 27% in just 35 years. By 2000, Indonesia had lost another 28 million ha, resulting in total forest loss of 68 million ha from 1950 to 2000 (- 43%) (FWI/GFW 2002). Most of the forests are removed for obvious reasons like farming, grazing, settlements or wood production. However, lack of attention to the protection of remaining forests has led to vast areas of degraded forests. A World Resources Institute (WRI) study (Bryant et al., 1997) concluded that only 40% of the planet’s remaining forests can be classified as “frontier forests” (i.e. large intact remaining natural forest ecosystems that maintain all of their biodiversity) and 39% of these are threatened by logging, agricultural clearing and other human activities. Seventy-six countries assessed by the WRI study have lost all of their frontier forests; 70% of what remains is found in three countries (Brazil, Canada and Russia) and only 3% in the temperate zone. Figure 5.3 shows the decrease of forests over time. In the last decade (1990-2000), 14.2 Mha of natural tropical forests were lost per year, whereas 1.7 Mha of non-tropical forests were gained per year (FAO, 2001). Although Africa only accounts for 17% of the world’s forests, more than half of the deforestation occurred in Africa. In projections, most of the deforestation is expected in Africa and Latin America.
5.3 Environmental threats Poor people and households in rural areas are highly dependent on natural resources in their immediate surroundings. They extract timber, fish, crops and water, and make use of soil fertility and watershed protection as well as non-material benefits. Biodiversity decreases as result. If more is extracted than can be regenerated the natural resources and also biodiversity may be degraded. Poor people, having no alternative, will continue to extract goods from natural resources resulting in their degradation. The question is then, how to escape from this poverty trap. The debate on the relationships between environment/biodiversity (as represented by MDG 7) and poverty and hunger (as represented by MDG 1) is characterised by the use of general statements of which the validity often remains unclear. Some examples are: • “Export-oriented growth may affect biodiversity but improves employment and
reduces poverty”; “Biodiversity loss can and will be restored at a certain level of economic development”.
• “Trade and export of primary products will not affect local food security and incidence of hunger, because export products will not compete with food crops”.
• “Agricultural intensification programmes, including land titling, reduced discount rates and access to credits leads to more efficient resource use and reduces biodiversity loss”.

Outstanding Environmental Issues for Human Development
53
Whether these statements hold in practice remains to be studied and validated. The Millennium Ecosystem Assessment will address some of these themes. To start the analysis, better insight can be gained by viewing the possible relationship between biodiversity and GDP per capita considered as a proxy for poverty and hunger incidence, illustrated in figure 5.3. Several pathways can be distinguished: Pathway (a) shows how initial economic growth will affect biodiversity as ecosystems are exploited and manipulated; Pathway (b) reflects restoration of biodiversity resulting from restoration of biodiversity if economic growth continues (to date seldom occurring); Pathway (c) illustrates the maintenance of biodiversity at a stable, relatively low, value with economic growth. Pathway (d) illustrates collapse of biodiversity (e.g. depletion of fish stocks or wildlife) without decline of GDP per capita poverty and hunger, preventing poverty and hunger through other sources of income, and Pathway (e), where biodiversity collapses and leads to lower incomes and hunger incidence in the case of remaining dependence on the degraded natural resources (the poverty trap).
Figure 5.3 The possible relationships between biodiversity and GDP per capita, indicating the 5 different pathways.

Outstanding Environmental Issues for Human Development
54
5.4 What can we do?
Biodiversity and poverty reduction In order to understand the relationship between income, hunger and biodiversity loss in a particular situation, one should know the starting socio-economic and biodiversity contextual situation; the position in the analytic framework presented in figure 5.3, as well as, insight into the constellation of underlying drivers that push towards unsustainable change. Several typical combinations of drivers can be grouped into mechanisms: livelihood or poverty driven, (international) capital driven, policy driven (e.g. structural adjustment programs or bad governance), war and conflict driven and socio-environmental disaster driven (trigger events). These mechanisms can be interdependent and may also reinforce each other, but on their own act like clusters with common features and therefore have in common certain policy consequences, both at micro- and at macro-level. The analytic framework of figure 5.3 indicate that mutually achieving the Millennium Development Goals for reducing poverty and hunger (1) and for environmental sustainability (7) requires preventing pathway d and pathway e, as well as enhancing ecological sustainability and biodiversity of production systems in pathway a. Precise policy options must be defined per land use type and the position in this framework and, dependent on the land use system and state of environment and biodiversity. In case of unsustainable change caused by a capital driven mechanism, pathway d can be prevented by avoiding overexploitation of any kind in brittle ecosystems, as well as restoration of the lost biodiversity by sustainable forest and fishery management. Unsustainable change under pathway a can be avoided with diversification of production and application of more efficient but ecological sound technology, pollution standards and dismantling of perverse subsidies, resulting in an intensification of land use if possible. The protection of the remaining natural resources becomes feasible using the economic growth as catalyst. Precise policy options must be defined per land use type and the position in the analytic framework figure 5.3 and, dependent on the land use system and state of environment and biodiversity. In case of unsustainable change caused by a livelihood – poverty driven mechanism, pathway e can be prevented by stopping overexploitation, controlling the further loss of biodiversity and by starting restoration of biodiversity. A policy option would be co-management arrangements (leasehold schemes) on fisheries and wildlife management. Given the fact that poor people are extremely vulnerable to loss of short term income and food production, they are forced to look at alternative income opportunities as off farm work and exit from agriculture as well. In pathway a, attention should be given to land titles for indigenous people, land and water
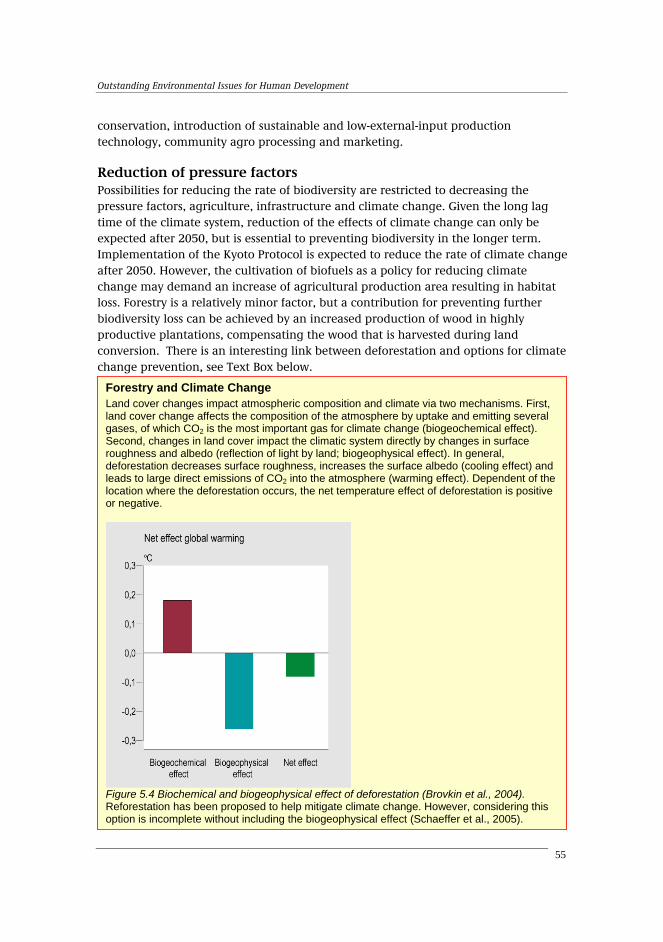
Outstanding Environmental Issues for Human Development
55
conservation, introduction of sustainable and low-external-input production technology, community agro processing and marketing.
Reduction of pressure factors Possibilities for reducing the rate of biodiversity are restricted to decreasing the pressure factors, agriculture, infrastructure and climate change. Given the long lag time of the climate system, reduction of the effects of climate change can only be expected after 2050, but is essential to preventing biodiversity in the longer term. Implementation of the Kyoto Protocol is expected to reduce the rate of climate change after 2050. However, the cultivation of biofuels as a policy for reducing climate change may demand an increase of agricultural production area resulting in habitat loss. Forestry is a relatively minor factor, but a contribution for preventing further biodiversity loss can be achieved by an increased production of wood in highly productive plantations, compensating the wood that is harvested during land conversion. There is an interesting link between deforestation and options for climate change prevention, see Text Box below. Forestry and Climate Change
Land cover changes impact atmospheric composition and climate via two mechanisms. First, land cover change affects the composition of the atmosphere by uptake and emitting several gases, of which CO2 is the most important gas for climate change (biogeochemical effect). Second, changes in land cover impact the climatic system directly by changes in surface roughness and albedo (reflection of light by land; biogeophysical effect). In general, deforestation decreases surface roughness, increases the surface albedo (cooling effect) and leads to large direct emissions of CO2 into the atmosphere (warming effect). Dependent of the location where the deforestation occurs, the net temperature effect of deforestation is positive or negative.
Figure 5.4 Biochemical and biogeophysical effect of deforestation (Brovkin et al., 2004). Reforestation has been proposed to help mitigate climate change. However, considering this option is incomplete without including the biogeophysical effect (Schaeffer et al., 2005).

Outstanding Environmental Issues for Human Development
56
The reduction of effects of agriculture is possible if the expansion of crop area is stopped and crop yield per ha is increased by intensification of the agricultural system. This is likely to be possible if technology transfer from developed countries to developing countries is enhanced (See Chapter 2). Figure 5.5 shows the decrease in global NCI if crop area is restricted to the current extent. This will reduce the loss of biodiversity considerably; however, loss of biodiversity still continues. If, in addition, the effects associated with infrastructural development do not increase after 2010, then a significant reduction of biodiversity loss is achievable. This means that the piecemeal encroachment along roads and railroads will be halted, and additional measures to reduce disturbance by traffic will have to be taken.
Figure 5.5 Global biodiversity change, expressed as the Natural Capital Index(NCI): the difference in the mean abundance of species since industrialization, for different options to prevent biodiversity loss. The NCI is calculated using pressures (Alkemade et al. 2005)
Protected areas Establishment and management of protected areas is the cornerstone in policies for preserving biodiversity. The ratio of protected area needed to maintain biological diversity (indicator 27) is used as an indicator for success in achieving Millennium Development Goal 7: Ensuring Environmental Sustainability. There are now over 100,000 protected areas worldwide, covering over 12% of the earth's land surface (an area greater than the combined land area of China, South Asia and Southeast Asia) (Chape et al., 2003). The target for protected areas − protecting10% of the area− established at the Third World Parks Congress in 1982 has been reached for 9 out of 14 biomes (see Figure 5.6). The biomes that still fall well short of the target are Lake

Outstanding Environmental Issues for Human Development
57
Systems (1.5%) and Temperate Grasslands (4.6%). Especially tundra and tropical forest are relatively well-represented. Only 0.5% of the ocean surface area is protected. Formal designation of protected areas, however, does not guarantee their effective management, and varies widely in different regions and countries. In many developing countries, protected areas often exist on paper but lack active management, but are, in fact, subject to illegal logging, wildlife poaching, agricultural encroachment and settlement. Illegal logging and the associated illegal trade directly threatens ecosystems and biodiversity in forests throughout Asia and the world. Deforestation may lead to less sequestration of CO2 and hence worsen global warming. New protected areas will need to be designated for those ecosystems that are not yet sufficiently covered, notably grassland steppes, temperate and warm mixed forest and scrubland, and lake marine ecosystems. Further strengthening of the management is needed for existing protected areas. Choices need to be made on how best to divide limited financial and technical resources between designating new protected areas, strengthening management of existing protected areas and establishing novel forms of community-based conservation (with local and indigenous communities) outside of formal state-run protected areas (MA, 2005 - forthcoming). However, protected areas alone are not enough. Species area curves suggest that conserving only 10% of the world’s surface would still result in long-term extinction of about one-third to half of all (MA, 2005 - forthcoming). Furthermore, most of the protected areas are heavily affected by the combined influence of external pressures such as pollution, fragmentation and climate change.
Figure 5.6 Percentage of protected area for each biome (Chape et al., 2003).

Outstanding Environmental Issues for Human Development
58
Outstanding Environmental Issues for Human Development
59
References Chapter 1 Alkemade, J.R.M. at al., 2005. Global biodiversity modelling, Bilthoven.
Klem, B . and H. Hilderink, 2003. Dealing with scarcity and violent conflict. Seminar Proceedings, Clingendael and MNP/RIVM, Bilthoven.
Millennium Ecosystem Assessment, 2003. Ecosystems and human well-being, Washington DC.
UNEP, 2004. Background paper for the ministerial-level consultations: implementation of internationally agreed development goals of the Millennium Declaration. Discussion paper presented by the Executive Director, UNEP/GC.23/10, Nairobi.
US State Failure Task Force, 2000. Phase III findings, Washington DC.
World Bank, 2002. The environment and the millennium development goals, Washington DC.
World Commission on Environment and Development, 1987. Our Common Future, Oxford.
WHO, 2002. The world health report 2002, Geneva.
References Chapter 2 Bouwman, A.L. and Leemans, R., 1995. The role of forest soils in the global carbon cycle. In: W.W. McFee and J.M. Kelly (Eds.), Carbon forms and functions in forests soils. Soil Science Society of America, Madison, pp. 503-525.
Bouwman, A.F., K.W. van der Hoek, B. Eickhout and I. Soenario, 2004. Exploring changes in world ruminant production systems. Agricultural Systems, doi:10.1016 j.agsy 2004.05.006.
Bruinsma, J.E., 2003. World Agriculture: Towards 2015/2030. An FAO Perspective. Earthscan, London, 432 pp.
CBD, 2002. Decision VI/26 Strategic Plan for the Convention on Biological Diversity.
Christensen, V., S. Guénette, J.J. Heymans, C.J. Walters, R. Watson, D. Zeller, and D. Pauly, 2003: Hundred-year decline of North Atlantic predatory fishes. Fish and Fisheries, 4(1), 1-24.
Delgado, C., Rosegrant, M., Steinfeld, H., Ehui, S. and Courbois, V., 1999. Livestock to 2020. The next food revolution. Food, Agriculture and the Environment Discussion paper 28, International Food Policy Research Institute, Food and Agriculture Organization of the United Nations, International Livestock Research Institute, Washington, D.C., 72 pp.
Eickhout, B., A.F. Bouwman and H. van Zeijts, 2005. The role of nitrogen in world food production and environmental sustainability Accepted by Agriculture, Ecosystems and Environment.
Eickhout, B., H. van Meijl, A. Tabeau, and H. van Zeijts, 2004. Between Liberalization and Protection: Four Long-term Scenarios for Trade, Poverty and the Environment. Presented at the Seventh Annual Conference on Global Economic Analysis, June, Washington, USA
Delgado, C.L., N. Wada, M.W. Rosegrant, S. Meijer, and M. Ahmed, 2003: Fish to 2020: Supply and Demand in Changing Global Markets. International Food Policy Research Institute (IFPRI), Washington, D.C. (USA) and WorldFish Center, Penang (Malaysia), 226 pp.
FAO, 2000. The State of Food Insecurity in the World: when people live with hunger and fear starvation, Food and Agriculture Organization of the United Nations, Rome, Italy.
FAO, 2001. FAOSTAT database collections (www.apps.fao.org), Food and Agriculture Organization of the United Nations, Rome.
Fischer, G., M. Shah and H. van Velthuizen. 2002. Climate Change and Agricultural Vulnerability. International Institute of Applied Systems Analysis, Vienna, Austria.
Outstanding Environmental Issues for Human Development
60
Lucas, P.L. and Hilderink, H.B.M., 2004. The Vulnerability Concept and its Application to Food Security. Report 550015004/2004, Netherlands Environmental Assessment Agency, National Institute for Public Health and the Environment, Bilthoven, 40 pp.
Millennium Ecosystem Assessment 2005. Food (Chapter 8). In Conditions and Trends Assessment. Island Press, Washington D.C.
Pauly, D. and J. Maclean 2003 In a perfect ocean: The state of fisheries and ecosystems in the North Atlantic Ocean. Island Press, Washington D.C. 175 pp.
Pauly, D., J. Alder, E. Bennett, V. Christensen, P. Tyedmers, and R. Watson, 2003: The future for fisheries. Science, 302(5649), 1359-1361.
Seré, C. and Steinfeld, H., 1996. World Livestock Production Systems. Current Status, Issues and Trends. Animal Production and Health Paper 127, Food and Agriculture Organization of the United Nations, Rome, 82 pp.
References Chapter 3 Alcamo et al, 2000. World Water in 2025,Centre for Environmental Systems Research, University of Kassel, Kassel, Germany.
Bouwman et al, 2005. Exploring changes in river nutrient export to the world’s oceans, Global biogeochemical cycles, vol. 19.
Chapagain et al 2004 Water footprints of nations, Value of Water Research Report Series No.6, A.K. Chapagain, A.Y. Hoekstra, UNESCO-IHE Delft, November 2004.
FAO, 2004. Economic evaluation of water resources in agriculture, FAO-water reports 27, Rome, 2004.
MNP-RIVM 2004, Quick Scan Health Benefits and Costs of Water Supply and Sanitation, Netherlands Environmental Assessment Agency-RIVM, UNESCO-IHE, EUR-iBMG/iMTA, Bilthoven, the Netherlands, August 2004.
MNP-RIVM 2005, Beyond Climate. Options for broadening climate policy, Report 500019001/2004 and NRP-CC report 500036/01, Editors: MTJ Kok (RIVM), HC de Coninck (ECN).
Shiklomanov IA, 1999, World water resources: Modern assessment and outlook for the 21st century, Prepared for IHP-UNESCO, St. Petersburg, 1999.
UNEP, Vital water graphics, Web site: http://www.unep.org/vitalwater/resources.htm.
UNESCO 2003, Water for People Water for Life, The United Nations World Water Development Report, World Water Assessment Programme.
Vörösmarty et al, 2000, Global Water Resources: Vulnerability from Climate. Change and Population Growth, Charles J. Vörösmarty, Pamela Green, Joseph Salisbury, Richard B. Lammers, 14 July 2000 Vol. 289 SCIENCE, http://www.sciencemag.org.
References Chapter 4 Berk, M.M. and den Elzen, M.G.J., 2001. Options for differentiation of future commitments in climate policy: how to realise timely participation to meet stringent climate goals? Climate Policy, 1(4): 465-480.
Bouwer L.M., K. Dorland, J.C.J.H. Aerts and J. Gupta., 2004. Adaptation and funding in climate change policies. In M.T.J. Kok and H.C. de Coninck (eds), Beyond Climate. Options for broadening climate policy. RIVM report 500019001/NRP-CC report 500036/01, Bilthoven.
Chandler, W., R. Schaeffer, Z. Dadi, P.R. Shukla, F. Tudela, O. Davidson, S. Alpan-Atamer, 2002. Climate change mitigation in developing countries: Brazil, China, India, Mexico, South Africa and Turkey. Pew Center on Global Climate Change, Arlington.

Outstanding Environmental Issues for Human Development
61
EU commission, 2003 Criqui, P., Kitous, A., Berk, M.M., den Elzen, M.G.J., Eickhout, B., Lucas, P., van Vuuren, D.P., Kouvaritakis, N. and Vanregemorter, D., 2003. Greenhouse gas reduction pathways in the UNFCCC Process up to 2025 - Technical Report. B4-3040/2001/325703/MAR/E.1 for the DG Environment, CNRS-IEPE, Grenoble, France, http://europa.eu.int/comm/environment/climat/pdf/pm_techreport2025.pdf.
Davidson, O., K. Halsnaes, S Huq, M. Kok, B. Metz, Y. Sokona, J. Verhagen, 2003. The development and climate nexus; the case of Sub-Saharan Africa. Climate Policy, 3S1, S97-S113.
Den Elzen, M.G.J. Lucas, P. and Van Vuuren, D.P., 2005. Abatement costs of post-Kyoto climate regimes. Energy Policy, Volume 33, Issue 16, pp. 2138-2151.
Meinshausen, N.and Hare, B., 2004. How much warming are we committed to and how much can be avoided? PIK report 93, Potsdam institute for climate impact research, Potsdam.
Höhne, N., Galleguillos, C., Blok, K., Harnisch, J. and Phylipsen, D., 2004. Evolution of commitments under the UNFCCC: Involving newly industrialized economies and developing countries, Research Report 201 41 255, UBA-FB 000412, Federal Environmental Agency (Umweltbundesamt), Berlin.
International Energy Agency, World Energy Outlook 2002, IEA, Paris, 2002.
International Energy Agency, World Energy Investment Outlook, IEA, Paris, 2003.
International Energy Agency, World Energy Outlook 2004, IEA, Paris, 2004.
IPCC, 2001. Climate Change 2001, Impacts, Adaptation, and Vulnerability, WMO/UNEP, Cambridge.
IPCC, 2001. Climate Change 2001, Mitigation, WMO/UNEP, Cambridge.
Karekezi, S., K. Lata, and S.T. Coelho, 2004. Traditional Biomass Energy; Improving its Use and Moving to Modern Use, Bonn.
Kok, M.T.J., C.P. van Beers, S.N.M. van Rooijen, M. Wilton, 2004. Conference paper Energy for Development, Bilthoven, 2004.
Kok, M.T.J. and H.C. de Coninck (eds), 2004. Beyond Climate. Options for broadening climate policy. RIVM report 500019001/NRP-CC report 500036/01, Bilthoven.
Kovats, R. S., B. Menne, A. J. McMichael, R. Bertollini, C. Soskolne, 1999. Early human effects of climate change and stratospheric ozone depletion in Europe. WHO background document to Third Ministerial Conference on Environment and Health, 16–19 June, London.
Lükewille, A., I. Bertok, M. Amann, J. Cofala, F. Gyarfas, C. Heyes, N., 2001. Control of fine particulate emissions in Europe. Interim Report IR-01-023.
Mechler, R., M. Amann, W. Schöpp, 2002. A methodology to estimate changes in statistical life expectancy due to control of particulate matter air pollution. IIASA Interim Report IR-02-035.
Nakicenovic, N. and Riahi, K., 2003. Model Runs With MESSAGE in the Context of the Further Development of the Kyoto-Protocol - Externe Expertise für das WBGU-Sondergutachten "Welt im Wandel: Über Kioto hinausdenken. Klimaschutzstrategien für das 21. Jahrhundert", WBGU, Berlin 2003. http://www.wbgu.de/wbgu_sn2003.html
TIMER Model: http://arch.rivm.nl/ieweb/ieweb/index.html
UNFCCC, 1992: http://unfccc.int/2860.php
Van Vuuren, D.P., Den Elzen, M.G.J., Berk, M.M., Lucas, P., Eickhout, B., Eerens, H. and Oostenrijk, R., 2003. Regional costs and benefits of alternative post-Kyoto climate regimes. Comparison of variants of the Multi-stage and Per Capita Convergence regimes. RIVM Report no. 728001025.
Outstanding Environmental Issues for Human Development
62
Van Vuuren, D., Fengxi, Z., De Vries, B., Kejun, J., Graveland, C. and Yun, L., 2003. Energy and emission scenarios for China in the 21st century - exploration of baseline development and mitigation options. Energy Policy, 31: 369-387.
Van Vuuren, D.P., Cofala, J., Eerens, H.E., Oostenrijk, R., Heyes, C., Klimont, Z., Den Elzen, M.G.J. and Amann, M., 2004. Exploring the ancillary benefits of the Kyoto Protocol for air pollution in Europe. Energy Policy, accepted for publication.
World Energy Council, 2000. World Energy Assessment, New York.
World Energy Council, 2004. World Energy Assessment: Overview 2004 Update, New York.
World Health Organisation, Addressing the Links between Indoor Air Pollution, Household Energy and Human Health, Washington, 2000.
World Health Organisation, 2002. World health report 2002, Geneva.
References Chapter 5 Alkemade, J.R.M. et al. 2005 (in prep.). Global Biodiversity Modelling, RIVM, Bilthoven
Baillie, J.E.M., Hilton-Taylor, C. and Stuart, S.N. (eds) 2004. 2004 IUCN Red List of Threatened Species. A Global Species Assessment. IUCN, Gland, Switzerland and Cambridge, UK. [PDF available via http://www.iucn.org/themes/ssc/red_list_2004/main_EN.html
Chape, S., S. Blyth, L. Fish, P. Fox and M. Spalding (compilers) 2003.2003 United Nations List of Protected Areas. IUCN, Gland, Switzerland and Cambridge, UK and UNEP-WCMC, Cambridge, UK. ix + 44pp.
MA 2003 Ecosystems and human well-being: a framework for assessment. Island press, Washington, Covelo, London.
UNEP. 2004 Millennium Ecosystem Assessment: Review of the draft reports, in particular the draft synthesis report prepared for the Convention on Biological Diversity. UNEP/CBD/SBSTTA/10/6
Brovkin, V., S. Sitch, W. von Bloh, M. Claussen, E. Bauer, and W. Cramer, 2004. Role of land cover changes for atmospheric CO2 increase and climate change during the last 150 years, Global Change Biology, in press.
Bruinsma, J.E., 2003. World Agriculture: Towards 2015/2030. An FAO Perspective. Earthscan, London, 432 pp.
Bryant, D., D. Nielson D., and L. Tangley, 1997: The Last Frontier Forests. World Resources Institute, Washington DC, 43 pp.
FAO, 2001. Global Forest Resources Assessment 2000. Main Report. FAO Forestry Paper No 140. Rome.
FWI/GFW, 2002. The State of the Forest: Indonesia. Bogor, Indonesia: Forest Watch Indonesia, and Washington DC: Global Forest Watch.
MA, 2005. Biodiversity Synthesis Report. Millennium Ecosystem Assessment Report. To be released in 2005. Washington D.C.: Island Press.
Schaeffer, M., B. Eickhout, M. Hoogwijk, B. Strengers, D.P. van Vuuren, R. Leemans and T. Opsteegh, 2005. The albedo climate impacts of biomass and carbon plantations compared to the CO2 impact. In: EMF - Snowmass Integrated Assessment Book, Cambridge University Press.
Dixon, J., Gulliver, A. and Gibbon, D. 2001 Farming systems and poverty, Rome and Washington DC: FAO and WorldBank.