outward foreign direct investment and the … foreign direct investment and the financial crisis in...
TRANSCRIPT
Outward Foreign Direct Investment and the Financial Crisis in Developing East Asia
HAl HIll AnD JutHAtHIp JOngwAnICH
This paper examines two interrelated aspects of Asian economic dynamism and the management of external shocks, in the context of outward foreign direct investment (FDI) from developing East Asia. Outward FDI from these economies has been growing rapidly, driven by deeper economic integration, more open FDI regimes, growing technological and financial sophistication, and rising savings levels. The paper underlines these common region-wide determinants while pointing to a range of country-specific circumstances. Economic crises, such as the Asian financial crisis of 1997–1998 and the current global financial crisis, have large and unpredictable effects on the behavior of FDI and other forms of capital flow, with the general expectation that FDI will be less volatile than portfolio investment. This has been confirmed in both crisis episodes. Investment outcomes during the current crisis have accelerated the growing importance of developing East Asia in the global economy.
I. INTRODUCTION
This paper examines two issues that are central to the rise of the dynamic East Asian economies and the management of globalization during a period of large external shocks. First, the paper examines the rise of developing East Asian economies (i.e., East and Southeast Asia excluding Japan) as significant sources of outward foreign direct investment (FDI). Second, the paper investigates the impact of the global financial crisis on the patterns of FDI to and from this region.
Hal Hill is H. w. Arndt professor of Southeast Asian Economics at Australian national university. Juthathip Jongwanich is an Economist at the Asian Development Bank (ADB). An earlier version of this paper was presented at the workshop on Outward Foreign Direct Investment from Developing Asia held on 27 July 2009 at ADB Headquarters. The authors thank the workshop organizer, Douglas Brooks, discussant Andrea goldstein, and workshop participants for helpful comments on the first draft. The authors also thank nedelyn C. Magtibay-Ramos for most capable research assistance. The opinions expressed are those of the authors alone.
Asian Development Review, vol. 26, no. 2, pp. 1–25 © 2009 Asian Development Bank

2 ASIAn DEvElOpMEnt REvIEw
On the relationship between FDI and crises, the literature on inward FDI postulates the well-known “fire-sale” phenomenon: paradoxically, FDI inflows may increase even while there has been short-term capital flight. The explanation is that the two flows are driven by different determinants—the latter is in response to a perceived increase in short-term risk profiles, while the former, which pursues a longer-term motive, is attracted by the asset-cheapening effects of a crisis (through lower prices in domestic currency terms and a depreciating exchange rate) as well as a frequent by-product of a crisis, a more liberal FDI regime. This response was documented at the time of the Asian financial crisis in 1997–1998, except in countries that experienced both deep economic and political crisis, such as Indonesia.
The analytics and empirical realities are less clear in the case of outward FDI and a generalized global crisis in 2008–2009. As with trade flows, FDI flows are likely to contract for similar reasons, namely, there are fewer attractive commercial opportunities, there is an increase in risk, finance is more difficult to secure, and global production networks may shrink. nevertheless, even crises of much deeper magnitude do present opportunities for lightly indebted companies attracted by greatly cheapened asset prices. This was evident at the early stages of the current crisis, when companies from high-saving Asian nations such as the people’s Republic of China (pRC) and Singapore acquired major international assets in the financial and other sectors.
Most of the literature on FDI has focused on inward flows. These are better monitored and measured; there is a clearer analytical framework guiding discussion of the pros and cons of these flows. They have aroused greater public discussion, especially concerning the “north–South” dimensions, and there is a clear analytical connection between trade and investment liberalization and the rise of global production networks. Outward FDI is, of course, the flip side of inward FDI. It has been less studied, partly because the database is less comprehensive (especially in an era of open capital accounts), less subject to regulatory scrutiny, and less contentious politically. But it is no less important as a field of study, for at least four reasons.
First, there are large inter-country differences in outward FDI on the basis of stock and flow. Just as differences in inward FDI are studied for what they reveal about a country’s openness and international commercial engagement, so too is outward FDI worthy of examination. Second, as a corollary, outward FDI data are revealing of a country’s changing economic structure, its development dynamics, and its international commercial engagement. Third, in an era where there are both extensive international comparisons of the business environment and increasingly liberal capital accounts, outward FDI may in certain circumstances be used to gauge the comparative attractiveness of a country’s investment climate. Fourth, although as noted, outward FDI is generally less contentious than inward flows, the former does sometimes attract attention. In the source countries, there

OutwARD FDI AnD tHE FInAnCIAl CRISIS In DEvElOpIng EASt ASIA �
is occasional concern, rightly or wrongly, about the alleged “export of jobs” associated with these flows. In addition, a recent international debate has focused on strategic issues in the case of state-directed outward FDI, particularly related to the activities of sovereign wealth funds (SwFs), which mainly originate from countries that are either large net oil exporters (principally in the Middle East) or very high savers (e.g., the pRC and Singapore).
Developing East Asia encompasses a rich variety of policy experiences. The traditional assumption was that open trade and FDI regimes go hand in hand, but this is not necessarily the case. On the one hand, Singapore; Hong Kong, China; Malaysia (to a lesser extent); Thailand; and taipei,China illustrate this proposition. But there are obvious exceptions. Historically, Japan and the Republic of Korea (henceforth Korea) aggressively promoted outward FDI but were more cautious toward inflows. They were also slower to liberalize their trade regimes. Indonesia and the philippines have become progressively more open to both trade and investment over time, but they were earlier much more inward-looking economies. The economies of Indochina began to open up to international trade and investment only from the late 1980s.
Measurement issues are a key challenge to any analysis of outward FDI. Balance of payments estimates measure only part of the flows, since they typically do not include locally reinvested earnings by an affiliate, or its borrowings. Economic census data provide the only comprehensive estimates, and these commonly do not provide disaggregation by source country. Therefore, the empirical analysis draws on the most widely used FDI database, prepared by the united nations Conference on trade and Development (unCtAD) for its World Investment Report database, in addition to country source data and studies.
The paper is organized as follows. Section II provides an overview of outward FDI from this region, focusing on its determinants and patterns. Section III examines the behavior of these flows during crisis episodes. The most complete examination is with reference to the 1997–1998 Asian financial crisis. The paper also assesses developments during the current global financial crisis, drawing on both the 1997–1998 experience and data through to early and mid-2009. Section Iv summarizes the paper’s main arguments.
II. OUTWARD FDI FROM DEVELOPING EAST ASIA: DETERMINANTS AND PATTERNS
The standard theory explaining international investment draws on the proposition that firms investing abroad possess a range of specific advantages, and that they prefer to harness these advantages in the form of FDI rather than the alternatives of exporting from their home base or some sort of non-equity arrangements such as licensing, franchise, or royalty agreement (Caves 1996). These advantages need
� ASIAn DEvElOpMEnt REvIEw
to be of sufficient magnitude to overcome the intrinsic cost disadvantages of operating in a less familiar commercial environment abroad. The bases of these advantages include production technology, managerial techniques, financial know-how, and knowledge of international markets.
with modifications, this broad framework can be employed to illuminate a variety of FDI flows and behaviors. One approach emphasizes transactions costs (Froot 199�) to explain why, with other things equal, firms invest in countries where the information barriers are low. Relevant factors here include strong historical ties (e.g., countries continuing to invest heavily in their former colonies), geographical proximity, membership of an economic association (particularly if reinforced by preferential trading arrangements), and cultural or linguistic familiarity (e.g., the large ethnic investments from the pRC straddling borders in the East Asian region). These transaction cost advantages are thought to be particularly significant for small and emerging investors owing to scale economies associated with the acquisition of knowledge concerning international investment opportunities.
There are diverse motives for, and hence drivers of, FDI. An analytically useful distinction is sometimes drawn between three types of FDI, commonly termed rent-seeking, efficiency-seeking, and resource-seeking motives.1, 2 In the first case, sometimes referred to as the tariff factory model, foreign investors are primarily attracted to the domestic market of the host country. Therefore, tariff protection and investment incentives are important determinants, along with a broader set of factors such as market size and growth. A variant of this class of investments is FDI in services, which by definition are mostly non-tradable.
By contrast, efficiency-seeking investments refer to those that locate in a particular economy owing to its efficiency as a production center as compared to alternative locations. Here, what matters are factors such as labor market costs and quality, infrastructure costs and quality, the broader macroeconomic environment (including, importantly, the exchange rate regime), and trade policy. The availability of fiscal incentives may matter at the margin, but they are not the principal determinant of location. These investments are by necessity more likely to be highly export-oriented. Multinational enterprises (MnEs) “slice up” the production processes across international boundaries according to the economics of manufacturing and service provision at each stage of the production process. This form of FDI has been growing rapidly, driven by the rapid spread of global production networks, especially in the electronics, automotive, and machinery
1Rent-seeking FDI could also refer to market-seeking FDI. 2Dunning (199�) provides two broad reasons why any firm would engage in FDI. The first
is to exploit its existing assets or competitive capabilities (asset-exploiting FDI) and the second is to augment them (asset-augmenting FDI). The former is associated with an investing firm making use of its existing ownership advantages while the latter is associated with a firm acquiring important ownership advantages that it currently lacks. Resource-seeking FDI, market-seeing FDI, and efficiency-seeking FDI can be classified as asset-exploiting FDI.
OutwARD FDI AnD tHE FInAnCIAl CRISIS In DEvElOpIng EASt ASIA 5
goods industries (Athukorala 2006, Kimura 2006). An open trade and FDI regime and an efficient logistics system are clearly sine qua nons of such investments.
Resource-seeking FDI is by definition motivated by the presence of a particular resource in the host market economy, which the investor judges can be most effectively accessed via FDI. Historically, the natural resource sectors were the main form of FDI in developing countries, especially the resource-rich economies. More recent variants include FDI in research and development (R&D)-intensive firms, as a means of accessing firm-specific technology and patents.
Of particular relevance to this paper, a subset of these flows has been experiencing growing prominence over the past quarter century of what may be termed third-world MnEs. Their emergence has blurred the historical distinction between capital- and technology-exporting rich economies and capital- and technology-importing poor economies. The phenomenon has highlighted the rise of dynamic developing economies and firms within them, and the various layers in international technology markets and information flows. The rise of third-world MnEs has also sharpened the analysis of the competitive advantages of foreign investors. In the memorable observation of wells (198�), “Third world multinationals compete on one thing—price.” Studies of third-world MnEs have revealed that these investors compete on the basis of a range of specific attributes. These include superior knowledge of a developing country’s commercial and regulatory environments, familiarity with more labor-intensive and less scale-intensive technologies, a greater appetite for risk (or at least a capacity to operate in environments that are less secure in a formal legal sense), and deeper country knowledge. These characteristics, and the differences with developed country investors, can in turn be explained by a range of factors, including transaction costs and proprietary knowledge. Thus, for example, the greater willingness of third-world MnEs to establish joint venture operations reflects their weaker bargaining power, which in turn results from a less powerful technological or brand name advantage. Their greater propensity to operate in the immediate neighborhood is also explained by a similar set of factors.
the paper now looks at the trends and patterns of outward FDI in developing East Asia. table 1 shows the stock of outward FDI from the region’s main economies. By 2007, Hong Kong, China had by far the largest stock, some 65 percent of the total stock of $1,591.6 billion. As noted below, a substantial though unknown proportion of this outward FDI in reality originates from the pRC and returns there. next comes taipei,China ($158.� billion) and Singapore ($1�9.5 billion), followed by the pRC ($95.8 billion), Korea ($66.2 billion), Malaysia ($58.2 billion), and then the lower-income Southeast Asian economies.� Thus, the four newly industrializing economies, together with the pRC and
�It is notable that, by way of comparison, India is a small outward investor. See the paper by prema-chandra Athukorala in this issue of the Asian Development Review.

6 ASIAn DEvElOpMEnt REvIEw
Malaysia, accounted for 98 percent of the East Asian total. East Asia also dwarfs all other developing regions. Even excluding the somewhat special case of Hong Kong, China, the East Asian total exceeds that of latin America.
normalizing these outflows relative to the source country gross fixed capital formation (gFCF),� Hong Kong, China’s outflows are extraordinarily high, while Singapore is about three times the developed economies’ average since 2000. taipei,China and Malaysia are also approaching the latter figure, while all the other economies are small, well below the developed economies average. Expressed as stock figures, the East Asian economies generally rank lower, reflecting the fact that their outward investments are of more recent vintage.
table 1. Outward FDI Stock by Economy/Region, 1980–2007
1980 1990 1995 2000 2005 2006 2007World 5�8.7 1,785.� 2,9�1.2 6,1�8.2 10,597.7 12,756.1 15,602.�Developed economies �77.2 1,6�0.� 2,607.5 5,265.1 9,1�6.2 10,8�8.0 1�,0�2.2 European union 21�.0 810.5 1,�22.7 �,050.6 5,�77.7 6,5�7.5 8,086.1 united States 215.� ��0.5 699.0 1,�16.2 2,2�1.7 2,�5�.7 2,791.� Japan 19.6 201.� 2�8.5 278.� �86.6 ��9.6 5�2.6Developing economies 71.5 1��.9 �29.� 861.8 1,299.� 1,702.� 2,288.1Africa 7.� 19.8 �1.5 ��.2 52.5 66.8 72.8Latin America and the Caribbean
�7.5 58.1 88.2 20�.7 �56.5 ��0.0 �9�.2
Developing Asia 16.6 66.9 209.5 612.7 890.0 1,205.1 1,721.7 East Asia 1�.� �9.0 1�9.� 509.6 67�.1 927.7 1,��8.9 China, people’s Republic of
0.0 �.5 17.8 27.8 57.2 7�.� 95.8
Hong Kong, China 0.1 11.9 78.8 �88.� �71.� 677.1 1,026.6 Korea, Republic of 0.1 2.� 10.2 26.8 �8.7 �9.2 66.2 taipei,China 1�.0 �0.� �2.6 66.7 106.5 127.0 158.� Southeast Asia 1.2 9.5 50.1 8�.5 162.� 198.� 2�2.7 Indonesia 0.0 0.1 5.9 6.9 1�.9 16.6 21.� Malaysia 0.� 0.8 5.1 15.9 22.0 �6.1 58.2 philippines 0.1 0.� 1.� 2.0 2.0 2.1 5.6 Singapore 0.8 7.8 �5.0 56.8 118.� 1�7.2 1�9.5 Thailand 0.0 0.� 2.� 2.2 5.1 5.� 7.0 South Asia 0.1 0.� 0.8 �.1 12.0 18.� �2.� India 0.1 0.1 0.5 1.9 10.0 15.9 29.�
FDI = foreign direct investment; tnC = transnational corporation.Source: unCtAD, FDI/tnC database, downloaded June 2009.
�Data in this and the following two paragraphs are not shown owing to space constraints, but data are available upon request from the authors.

OutwARD FDI AnD tHE FInAnCIAl CRISIS In DEvElOpIng EASt ASIA 7
Inward flows to the region, again relative to gFCF, show that several economies, especially Singapore and taipei,China, are highly open to FDI. The ratio for Malaysia is also well above the developed economies as a whole, as are those for viet nam since the 1990s and Thailand for some periods. The data indicate that the pRC’s large inflows reflect principally its size and its very high investment levels. Since 2000, FDI inflows in the pRC, relative to gFCF, have been below the global average. Korea, like Japan, has been a very small recipient, except in the immediate aftermath of the Asian crisis in 1997–1998.
It is also possible to compare merger and acquisition (M&A) purchases (i.e., by domestic entities abroad) and outward FDI flows.5 For the world as a whole, and for the developed economy group, this ratio fluctuates around a rising, long-term average of about 0.9. For developing economies, the figure is also rising, but is lower on average and more volatile. nor does the ratio appear to have followed a well-defined behavioral relationship during the crisis episodes. One explanation for the lower developing economy figure is that firms from these economies generally do not have the financial institutions to underpin such activity, such as deep stock markets and well-developed corporate bond markets. The ratio for East Asia as a whole is also well below the developed economy average, and it displays no clear trend. The one country for which the ratio is consistently well above the regional average is Singapore. This likely reflects both that country’s well-developed financial markets and its activist government-linked corporations, which undertake a lot of M&A activity abroad.
Figure 1 shows trends in outward and inward FDI flows for these economies. Three main features are observable. First, as noted, there is the general increase in FDI flows, in both directions. Second, while most countries continue to be net FDI recipients, outward FDI flows have generally been growing faster than inward FDI. This reflects several factors: the freeing up of capital accounts, the region’s increased financial and technological sophistication, its high savings rates, and the fact that, consistent with the FDI theories discussed above, several economies are now among the global high-income group, and therefore more likely to be outward investors. Third, there is no general pattern in these flows, in the sense of, for example, a steadily rising outward FDI/inward FDI ratio associated with rising per capita gross domestic product (gDp). It is therefore instructive to briefly examine the country stories.
5note that there is no clear accounting relationship between the two variables, since outward FDI refers to funds that cross international borders, whereas M&As may be funded from a variety of domestic and international sources.

8 ASIAn DEvElOpMEnt REvIEw
Figure 1. Outward and Inward FDI Flows in East Asia, 1980–2007 (Million $)
100,000
80,000
60,000
40,000
20,000
0
80,000
60,000
40,000
20,000
0
China, People’s Rep. of Hong Kong, China
1992
1994
1996
1990
1988
1986
1984
1982
1980
2006
2004
2002
2000
1998
1992
1994
1996
1990
1988
1986
1984
1982
1980
2006
2004
2002
2000
1998
16,000
12,000
8,000
4,000
0
12,00010,000
8,0006,0004,0002,000
0
12,00010,000
8,0006,0004,0002,000
0
Korea, Rep. of Taipei,China
1992
1994
1996
1990
1988
1986
1984
1982
1980
2006
2004
2002
2000
1998
1992
1994
1996
1990
1988
1986
1984
1982
1980
2006
2004
2002
2000
1998
25,000
20,000
15,000
10,000
5,000
0
India10,000
8,0006,0004,0002,000
0-2,000-4,000-6,000
Indonesia
Malaysia
1992
1994
1996
1990
1988
1986
1984
1982
1980
2006
2004
2002
2000
1998
1992
1994
1996
1990
1988
1986
1984
1982
1980
2006
2004
2002
2000
1998
1992
1994
1996
1990
1988
1986
1984
1982
1980
2006
2004
2002
2000
1998
Inward FDI Outward FDI
1992
1994
1996
1990
1988
1986
1984
1982
1980
2006
2004
2002
2000
1998
Philippines4,0003,5003,0002,5002,0001,5001,000
5000
-500
Continued

OutwARD FDI AnD tHE FInAnCIAl CRISIS In DEvElOpIng EASt ASIA 9
Figure 1—Continued
30,00025,00020,00015,00010,000
5,0000
Singapore
1992
1994
1996
1990
1988
1986
1984
1982
1980
2006
2004
2002
2000
1998
8,0007,0006,0005,0004,0003,0002,0001,000
0
Viet Nam
1992
1994
1996
1990
1988
1986
1984
1982
1980
2006
2004
2002
2000
1998
12,000
10,000
8,000
6,000
2,000
0
�ailand
1992
1994
1996
1990
1988
1986
1984
1982
1980
2006
2008
2004
2002
2000
1998
Inward FDI Outward FDI
FDI = foreign direct investment; tnC = transnational corporation.Sources: unCtAD, FDI/tnC database, downloaded June 2009; data for Thailand in 2008 is from the Bank
of Thailand, available www.bot.or.th, downloaded June 2009.
pRC: Inward FDI flows began to grow extremely quickly from the early 1990s. They then dipped in the late 1990s, as a result of the Asian economic crisis, but surged again after 2000 when, for a period, the pRC was the world’s largest recipient of FDI. Outward FDI was initially very small by comparison, but it began to increase very rapidly from around 2002, and annual outflows are now almost one quarter of inflows.
State-owned enterprises (SOEs) are the major foreign investors, accounting for 8� percent of the outward stock by end-2005. However, this figure is thought to be an overestimate because private sector outward FDI is less likely to secure official permission to go abroad, and in any case the SOE share has continued to decline in recent years. Most of the pRC’s FDI goes to Asia, about 67 percent of the stock by end-2007, with Hong Kong, China alone absorbing 58 percent of the total. The 21 percent share reported as going to latin America is mainly explained by the 20 percent going to the two tax havens, Cayman Islands and British virgin Islands (BvI). “genuine” FDI therefore has to exclude these flows as well as much of the investment in Hong Kong, China to take advantage of

10 ASIAn DEvElOpMEnt REvIEw
incentives open only to foreign investors.6 Even allowing for these overstatements, the pRC’s investment is still predominantly in developing economies, consistent with the early stage experience of developing country investors.
As noted, the pRC’s foreign exchange reserves now exceed $2 trillion. A small proportion of this is invested abroad in the form of SwFs, particularly in natural resources. There is some wariness toward the overseas investment activities of the pRC’s SOEs. Sometimes this wariness conceals straightforward commercial protectionism. For example, the attempt by the China national Offshore Oil Corporation to purchase unocal in 2005 was blocked, as was Huawei’s attempt to buy the united States (uS) technology firm �Com in 2008. Indeed, petroChina’s acquisition of Singapore petroleum in May 2009 was seen as an opportunity to deploy the latter as a less threatening beachhead for third-country acquisitions. to allay such fears, firms from the pRC have adopted a strategy of minority joint venture partnerships in some of their acquisitions.
taipei,China: Since the mid-1980s, outward flows have exceeded inflows, often by a significant margin. There was a very large increase in outflows from the mid-1980s, the first major wave of outward investments, as much of the country’s labor-intensive manufacturing base was moved offshore. Both flows contracted during the Asian economic crisis, but they recovered quickly, although inward FDI fell sharply in 200�–2005, in part owing to political uncertainty.
The early offshore investments from taipei,China were heavily influenced by the government, mainly through SOEs and often with diplomatic considerations in mind. However, from the 1980s, commercial considerations have been dominant and most of the FDI has been private sector-driven. For much of the past two decades, the government has been wary of too close an engagement with the pRC, although in the past year this concern has been significantly relaxed. During the 1990s, the government instituted a “go South” campaign, exhorting firms to invest in Southeast Asia, with preference given over the pRC (Chen 1998). However, from the early 1990s, flows to the pRC have exceeded those to Southeast Asia by an increasingly large margin. Over time, firms from taipei,China are likely to become ever more deeply integrated with the mainland. At least 5 percent of its population is estimated to live there. A major impetus came in March 2008 with the new government in the economy, and more cordial relations.7
6That is, a substantial proportion (thought to be as much as 20 percent at its peak) of the pRC’s outward FDI over the past 20 years has taken the form of “recycling,” that is, the pRC’s firms moving funds offshore, principally to Hong Kong, China, for reinvestment back into the pRC under the guise of FDI, to take advantage of special tax and trade incentives available only to foreign investors (naughton 2007). As reform has proceeded, the dual policy regime providing favorable treatment to foreign investors has been gradually dismantled, and these flows have declined. In early 2008, these incentives were abolished altogether, and therefore the round-tripping FDI will disappear, resulting also in a declining share for Hong Kong, China.
7As an indication of the rapidly growing direct commercial ties, regular direct flights resumed after an absence of more than half a century. The number rose dramatically, from �6 per week initially to 270 per week by April 2009.
OutwARD FDI AnD tHE FInAnCIAl CRISIS In DEvElOpIng EASt ASIA 11
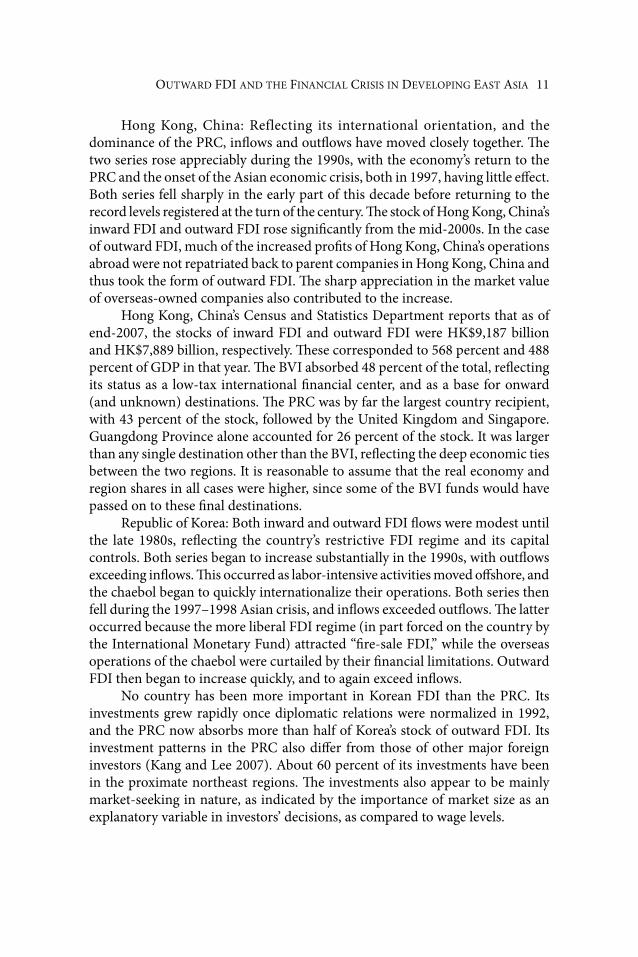
Hong Kong, China: Reflecting its international orientation, and the dominance of the pRC, inflows and outflows have moved closely together. The two series rose appreciably during the 1990s, with the economy’s return to the pRC and the onset of the Asian economic crisis, both in 1997, having little effect. Both series fell sharply in the early part of this decade before returning to the record levels registered at the turn of the century. The stock of Hong Kong, China’s inward FDI and outward FDI rose significantly from the mid-2000s. In the case of outward FDI, much of the increased profits of Hong Kong, China’s operations abroad were not repatriated back to parent companies in Hong Kong, China and thus took the form of outward FDI. The sharp appreciation in the market value of overseas-owned companies also contributed to the increase.
Hong Kong, China’s Census and Statistics Department reports that as of end-2007, the stocks of inward FDI and outward FDI were HK$9,187 billion and HK$7,889 billion, respectively. These corresponded to 568 percent and �88 percent of gDp in that year. The BvI absorbed �8 percent of the total, reflecting its status as a low-tax international financial center, and as a base for onward (and unknown) destinations. The pRC was by far the largest country recipient, with �� percent of the stock, followed by the united Kingdom and Singapore. guangdong province alone accounted for 26 percent of the stock. It was larger than any single destination other than the BvI, reflecting the deep economic ties between the two regions. It is reasonable to assume that the real economy and region shares in all cases were higher, since some of the BvI funds would have passed on to these final destinations.
Republic of Korea: Both inward and outward FDI flows were modest until the late 1980s, reflecting the country’s restrictive FDI regime and its capital controls. Both series began to increase substantially in the 1990s, with outflows exceeding inflows. This occurred as labor-intensive activities moved offshore, and the chaebol began to quickly internationalize their operations. Both series then fell during the 1997–1998 Asian crisis, and inflows exceeded outflows. The latter occurred because the more liberal FDI regime (in part forced on the country by the International Monetary Fund) attracted “fire-sale FDI,” while the overseas operations of the chaebol were curtailed by their financial limitations. Outward FDI then began to increase quickly, and to again exceed inflows.
no country has been more important in Korean FDI than the pRC. Its investments grew rapidly once diplomatic relations were normalized in 1992, and the pRC now absorbs more than half of Korea’s stock of outward FDI. Its investment patterns in the pRC also differ from those of other major foreign investors (Kang and lee 2007). About 60 percent of its investments have been in the proximate northeast regions. The investments also appear to be mainly market-seeking in nature, as indicated by the importance of market size as an explanatory variable in investors’ decisions, as compared to wage levels.

12 ASIAn DEvElOpMEnt REvIEw
Indonesia: This country has registered the most volatile FDI flows. Inward flows were increasing strongly prior to the Asian crisis in 1997–1998; they then fell sharply, and remained negative until 200�. Outward FDI has generally been much smaller, except for the years immediately before the crisis and more recently. Much of the outward FDI is thought to be investment by the country’s ethnic community from the pRC, who dominate much of the country’s modern business sector, and whose political vulnerability leads them to diversify their asset holdings abroad, with Singapore as a favored destination.
Malaysia: This country’s flows reflect a more typical developing country pattern, with inward FDI exceeding outflows by a large margin until recently. Both series were rising strongly during the 1990s, fell sharply during the 1997–1998 Asian crisis, and fell again during the electronics downturn in 2001–2002. They have since grown strongly to record levels in 2007 when, for the first time, outward flows exceeded inflows.
with the usual caveats concerning data quality, Tham (2005) observed that historically Singapore in particular and Association of Southeast Asian nations members in general have been the principal destination of Malaysian outward FDI. Australia; pRC; Hong Kong, China; and uS have also received significant flows. There have also been some investments in Africa, often with a political flavor. There is no clear pattern of sectoral specialization. As the largest Malaysian company abroad, the activities of the state-owned petronas influence the aggregate patterns, resulting in substantial investments in exploration and extraction in the oil and gas industry. Other government-linked companies have invested abroad, including telekom Malaysia. More recently, in response to high international prices and loss of comparative advantage, Malaysia has been a major investor in the Indonesian palm oil industry.
philippines: Outward investment has always been negligible, in contrast to its very large human capital flows. Historically, inward FDI was quite small, but it accelerated in the 1990s as effective economic policy reforms were implemented. The decline in 1998 was modest as the country managed to avoid a serious contraction. The dips since 2000 have been mostly associated with political uncertainty.
Singapore: like Hong Kong, China, Singapore has always been unambiguously open to FDI, and inflows and outflows have generally moved closely together. Both increased from the late 1980s, fell sharply in 1997–1998, with Singapore’s strong exposure to other crisis-affected investments magnifying the downturn, then recovered, apart from another dip during the electronics contraction earlier this decade. Since 2005, inward FDI flows have been at record levels, while outward FDI has been strong. In spite of its extraordinarily high savings rate, inward flows have almost always exceeded outflows.
Several factors have shaped outward FDI flows and patterns from Singapore. These include its very high savings rates, its persistent current account and
OutwARD FDI AnD tHE FInAnCIAl CRISIS In DEvElOpIng EASt ASIA 1�
fiscal surpluses, the concerted outward drive by the government of Singapore Investment Corporation and temasek,8 and the fact that large numbers of MnEs have adopted Singapore as their regional headquarters and platform for investment in the neighborhood.
Thailand: Inward FDI grew strongly during the 1990s, and remained at high levels during the 1997–1998 crisis, owing to continued openness and attractive buying opportunities. After declining in the early 2000s, inflows have become strong again, apparently undeterred by political uncertainty, at least until 2008. Outward FDI grew modestly prior to the crisis, and has increased again in recent years, but it remains much smaller than inward flows.
As noted, an interesting feature of the Asian financial crisis in Thailand was the contrasting behavior of inward and outward FDI flows. Inward FDI flows rose sharply, from $2.� billion in 1996 to $7.� billion in 1998. This was mainly “fire-sale FDI,” that is, M&As attracted by the greatly cheapened asset prices as a result of the crisis. However, outward FDI fell sharply. The main reason for the contraction was that several of the pre-crisis outward forays had lacked strong ownership advantages, and rather had grown on the basis of ready access to finance and inflated asset values at home. The high debt levels of the investor companies, compounded by the depreciation of the Thai baht, forced a major restructuring and focus on their core activities, mainly at home.
Returning to the general East Asian story, it is important to emphasize the rapidly changing dynamics of these drivers of outward FDI, as a result of fast economic growth, changing comparative advantage, and major investments in human capital and R&D. This applies particularly to the pRC and India, two countries distinguished not only by their size and growth, but also by their high levels of R&D intensity (as measured by R&D expenditure as a percentage of gDp). The earlier emphasis on heavy industry in both countries, while costly, did bequeath pockets of advanced industrial competence. And now their leading companies have the financial capacity to undertake reverse-engineering FDI as a means of quickly moving up the technology ladder. The rapidly increasing R&D expenditure is particularly noticeable in the computing, electronics, and telecommunications equipment industries (Economist 2009). The uS accounts for one third of global R&D, but in the pRC, R&D expenditure grew by 2� percent over the period 2001–2006, and its corporate R&D expenditure is now similar to the European level. Firms from Korea have also continued to rapidly develop their R&D capacity. Korea’s information and communication technology firms spend about 6.5 percent of sales on R&D, compared to the European and Japanese figures of 5 percent and 8 percent, respectively. Its leading company, Samsung, has overtaken IBM in its expenditures, and now ranks second in the industry for patents issued by the uS patent and trademark Office.
8temasek is the government’s investment arm with its holding companies, known as government-linked companies.
1� ASIAn DEvElOpMEnt REvIEw
A Boston Consulting group report (summarized in Economist 2008) offered the following synthesis of the competitive advantages of these increasingly sophisticated third-world MnEs. The first is taking brands from the local to the global market, building on efficient, low-cost domestic operations. Examples include pRC appliance manufacturer Hisense and Bajaj Auto, the Indian producer of two- and three-wheeled vehicles. Related to this, the second competitive advantage of third-world MnEs is innovating on the basis of local engineering excellence, with Embraer, the Brazilian regional aircraft manufacturer, as an example. The third is developing global leadership in a narrow product category, also on the basis of excellence at home, combined sometimes with strategic international acquisitions of technology. Examples include BYD Auto, the pRC’s battery maker, and Johnson Electric, Hong Kong, China’s producer of tiny electric motors for cars and other equipment. A fourth competitive advantage involves building on technological competence in a natural resource base at home, which is then taken abroad, as in Brazil’s grain and meat producers and its iron ore mining company, vale. A final category of competitive advantage refers to the development of a new or better business model, e.g., Mexico’s Cemex, a major supplier of ready mix cement that operates in many countries (Economist 2008).
As a consequence of this rising technological competence, developed country MnEs are adjusting their strategies in each country, viewing them not just as efficient production locations for routine goods and services but now increasingly as efficient mid-level R&D centers.9 In 2001, there were about 100 MnE R&D centers in each country. By the end of 2008, this had grown to around 1,100 in the pRC (representing 920 MnEs) and 780 in India (representing 670 MnEs). There has been a concomitant rise in domestically owned operations and spillovers between foreign and local players. A major attraction in both countries is the large existing low-cost intellectual infrastructure, interacting with a sizeable diaspora, especially in the case of India. Reflecting the early stage of this process, these R&D activities are concentrated both by sector (information and communications technology is by far the largest, followed by the health sector) and geography (Beijing and Shanghai in the pRC and Bangalore and the national Capital Region in India). This process is likely to accelerate as the human capital bases in both countries expand rapidly. Moreover, MnEs from both countries, such as pRC’s Huawei and India’s tata, have acquired or established R&D centers in the uS and Europe as a means of tapping into advanced knowledge and technology clusters.
9See Bruche (2009), on which this paragraph draws.
OutwARD FDI AnD tHE FInAnCIAl CRISIS In DEvElOpIng EASt ASIA 15
III. OUTWARD FDI AND FINANCIAL CRISES
The global financial crisis has resulted in declining global FDI flows. According to unCtAD (2009), the most authoritative report to date, after global FDI flows reached a historic record of $1.9 trillion in 2007, they are estimated to have declined by 15 percent in 2008, and a further decline is almost certain in 2009. The decline has been caused by two main factors. First, global economic growth has declined sharply, particularly in the Organisation for Economic Co-operation and Development (OECD) block. Consequently, there are fewer investment opportunities and firms have adopted more cautious investment strategies. Second, it has become more difficult to access finance, owing to widespread difficulties in the global financial sector, including the opportunity to raise funds through initial public offerings (IpOs) and corporate bond issues, and the sharp fall in global equity prices. The crisis has particularly affected M&A activity, resulting in extensive divestments and restructuring, especially for heavily indebted companies operating in contracting sectors (e.g., financial services, real estate, building materials, and consumer durables).
In East Asia, there are similarities and differences between the current recession and the 1997–1998 Asian crisis. First, the global economy (gDp, trade, and investment) is now contracting whereas in 1997–1998 it was buoyant. Second, whereas several developing East Asian economies experienced sharp economic contractions due to the Asian crisis, East Asia—led by the pRC—is weathering the current crisis better than most other regions of the world. This is so notwithstanding negative growth in the open economies of Korea; Malaysia; Singapore; taipei,China; and Thailand. Third, unlike the financial collapse in several economies in 1997–1998, and in spite of the west’s “financial protectionism,” East Asia’s financial sectors have generally remained intact in the current crisis, supported by strong domestic savings and limited exposure to the imploding financial sectors in the uS and Europe. Fourth, trade and investment regimes have generally remained open in the current crisis in spite of the rising tide of economic nationalism and economic insecurity.
preliminary estimates for 2008 indicate that, whereas outward FDI from developed economies declined by 11.9 percent, outward FDI from developing economies rose by 2.0 percent. East Asia continued to be the major source of the latter, accounting for two thirds of the total. The contrast is starker still in the case of cross-border M&A purchases. These declined by �1.9 percent in developed economies, but only shrank by 9.1 percent in developing economies. Significantly, M&A activity actually rose in developing East Asia by 16.1 percent.
Thus, the impact on FDI flows across regions (and sectors) has been uneven. As unCtAD (2009) observed, FDI flows to developing regions continued to increase, albeit at a slower rate. This trend is unlikely to continue into 2009. The picture is less clear in the case of outward FDI. while it will contract in

16 ASIAn DEvElOpMEnt REvIEw
aggregate, the greatly cheapened asset prices also provide buying opportunities for companies (and countries) with strong balance sheets. More generally, cash-flush SwFs, most of which are located in developing countries, have increased their FDI activities. For example, with its foreign exchange reserves now exceeding $2 trillion and its financial sector largely intact, the pRC has emerged as a major player. SwFs’ M&A activities increased by 50 percent in 2008 to $15 billion. As the global financial crisis developed in 2007, several of these funds targeted the financial services industry, where equity prices had fallen sharply.10 In most cases, however, these acquisitions incurred heavy losses, at least in the short term. The decline in commodity prices from late 2008, in response to the global economic crisis and the rapid increase in mining production in recent years triggered by high prices, has also created buying opportunities, particularly among heavily indebted companies.
How have these capital flows behaved over the past two decades? The analytics and empirical realities are clear in the case of inward FDI and international financial crises. FDI is driven mainly by long-term sentiments about the recipient countries and it also entails investment in physical plants and equipment.11 Hence, in the wake of an international financial crisis, FDI inflows are likely to be more resilient than other forms of capital inflow, that is, portfolio investment (both equity and debt securities), bank lending, and other related forms of foreign capital. As lipsey (2001) demonstrated, MnEs can respond effectively to a domestic demand collapse and domestic credit contraction induced by a financial crisis. Since MnEs have firm-specific advantages in the form of knowledge-based assets such as proprietary information relating to production, technology, and managerial know-how, and superior access to foreign markets as compared to domestically owned firms, they can switch markets more quickly. They also generally have better access to international capital markets, including support from headquarters.
During the 1997–1998 Asian financial crisis, the positive impacts on profitability of MnEs’ operation in the crisis-affected countries generally outweighed the negative impacts. Athukorala (200�) pointed out that currency collapse had a positive impact on FDI in three ways. First, the domestic production costs of foreign firms were reduced as a result of the large exchange rate depreciation, hence, with other things equal, making the crisis-affected countries a more attractive site for export-oriented investment. Second, falling
10M&A activity in this sector by SwFs originating from East Asia includes the China Investment Corporation purchase of a stake in Morgan Stanley, the Korea Investment Corporation purchase of Merrill lynch, and Singapore’s purchases of uBS and Merrill lynch (by the government of Singapore Investment Corporation and temasek, respectively).
11note that there are two main components of FDI, namely greenfield investment and M&A. The former involves investment in physical plants and equipment while the latter works mostly through equity markets. In East Asia, greenfield investment is still a crucial component of FDI, although M&A has increased continuously, especially after the 1997 Asian financial crisis.

OutwARD FDI AnD tHE FInAnCIAl CRISIS In DEvElOpIng EASt ASIA 17
of asset prices offered attractive buying opportunities. Third, these falling asset prices were generally accompanied by a more liberal FDI regime, encouraging “fire-sale” M&As.12 In fact, total approved average annual M&A in the five East Asian crisis countries recorded a 120-percent increase between 1990–1996 and 1997–2001, from $�.5 billion to $1.1 trillion.
There have been few studies on the behavior of outward FDI during the 1997–1998 Asian financial crisis, compared to the substantial literature on inward FDI. There is some evidence of a slowdown of outward FDI. Owing to the nature of this crisis, originating in several Asian developing countries, the domestic demand collapse and financial implosion reduced the supply of investment funds available for outward FDI.
In contrast to the 1997–1998 crisis, the current financial crisis originated in the developed countries and has caused a pronounced slowdown in the global economy. There are two key channels through which this recession has been transmitted to developing Asia, namely trade and finance (James et al. 2008). So far, the impacts on developing Asia have been felt primarily through the trade channel rather than through the financial institutions. By the fourth quarter of 2008, developing Asia’s exports had contracted sharply. The drop of export growth averaged nearly �0 percent in East and Southeast Asia and approached double digits in South Asia.
Owing to these differences, the impacts of the current crisis on FDI are likely to differ from those of the previous crisis. For inward FDI, the credit crunch triggered by the financial crisis may have reduced the sources of foreign investment funds, mainly from developed countries, so that the volume of inward FDI to developing Asia is likely to decline. However, the fact that several major Asian economies have been relatively resilient during the crisis may enhance their attractiveness to FDI. So far, the sharpest negative impact on inward FDI has been in the developed countries. Moreover, developing Asia’s relatively resilient financial markets, combined with declining asset values in developed countries, may create buying opportunities for developing country investors. However, developing country investors largely lack the requisite management skills, business acumen, and knowledge of developed country legal systems and regulatory environments to take advantage of these opportunities.
The annual data presented above provide a picture of longer term trends and patterns. However, they conceal considerable volatility during crisis periods. to obtain a clearer picture of the behavior of FDI during such periods, data for
12The current global financial crisis has also introduced an additional motivation for countries to liberalize any remaining restrictions on outward FDI, namely the concern that the depreciating uS dollar will place upward pressure on their own exchange rates, and hence on competitiveness. governments now see increased outward FDI as a means of mitigating currency appreciation pressures. This consideration was articulated, for example, by the governor of the Central Bank of Thailand in early August 2009.

18 ASIAn DEvElOpMEnt REvIEw
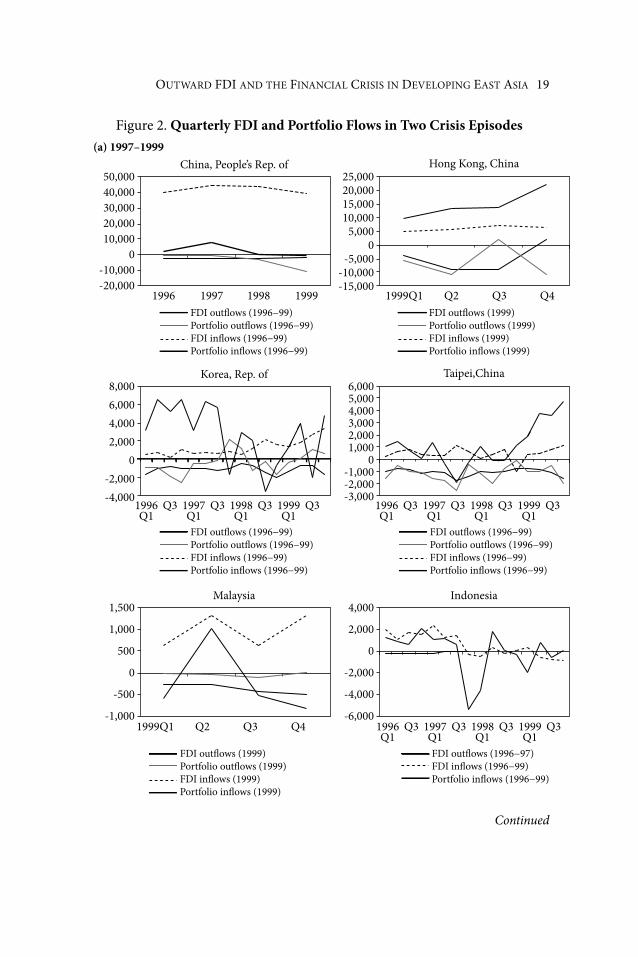
shorter periods are required. For some financial data series, at the peak of a crisis, weekly or even daily data are illuminating. However, FDI projects are “lumpy” and therefore such high-frequency data would be misleading. The authors therefore used quarterly data, which are available in the unCtAD World Investment Report database, the International Monetary Fund’s International Financial Statistics database, and central banks. These are presented in Figure 2 for each of the main developing East Asian economies for two subperiods, 1997–1998 and 2008–2009, the latter until the second quarter where data permit. Both FDI and portfolio data are shown for comparison.
In the case of the 1997–1998 Asian crisis, the data amplify the picture depicted above, but with a clearer indication of the volatility and turning points in the series. That is, the decline in portfolio investment, generally from large positive to large negative numbers, is evident through the course of 1997, with the third quarter generally exhibiting the sharpest change, especially in the four crisis-affected economies. Thereafter, portfolio investment returned to the region quickly, especially in economies like taipei,China that were not severely affected. The diverging patterns of FDI noted above are also evident from late 1997 and continue into 1998.
In 2008–2009, the picture is somewhat different. In most economies, portfolio investment began to decline in the second and third quarters of 2008, and gathered pace throughout the year. However, most cases did not show extreme volatility like that exhibited in 1997–1998, and portfolio investors generally began to return in 2009. Both inward and outward FDI dipped for periods in 2008, but the changes were not pronounced. FDI inflows showed a continuing downward movement for most economies through the second quarter of 2009, except for taipei,China; Korea; and Singapore, where the inflows rose slightly over the first quarter figures. These trends presumably reflect the continuing effects of the global crisis on the major g� (European union, Japan, and uS) source economies, and their still fragile banking sectors. The outcome differs from that of the 1997–1998 crisis, when FDI inflows were strong in most economies. By contrast, FDI outflows from these economies generally began to pick up in the second quarter of 2009, with the exception of Korea. The region’s resilience and early return of optimism explain this recovery, underpinned by the continuing strength of the pRC’s economy and the absence of severe financial stress.
OutwARD FDI AnD tHE FInAnCIAl CRISIS In DEvElOpIng EASt ASIA 19
Figure 2. Quarterly FDI and Portfolio Flows in Two Crisis Episodes
50,00040,00030,00020,00010,000
0-10,000-20,000
25,00020,00015,00010,000
5,0000
-5,000-10,000-15,000
China, People’s Rep. of
Korea, Rep. of
Hong Kong, China
8,0006,0004,0002,000
0-2,000-4,000
6,0005,0004,0003,0002,0001,000
0-1,000-2,000-3,000
4,000
2,000
0
-2,000
-4,000
-6,000
Taipei,China
1,500
1,000
500
0
-500
-1,000
Malaysia Indonesia
1996FDI out�ows (1996−99)Portfolio out�ows (1996−99)FDI in�ows (1996−99)Portfolio in�ows (1996−99)
1997 1998 1999
1996Q1
1997Q1
Q3 Q3 1998Q1
Q3 1999Q1
Q3 1996Q1
1997Q1
Q3 Q3 1998Q1
Q3 1999Q1
Q3
1999Q1 Q2 Q3 Q4
FDI out�ows (1996−99)Portfolio out�ows (1996−99)FDI in�ows (1996−99)Portfolio in�ows (1996−99)
1996Q1
1997Q1
Q3 Q3 1998Q1
Q3 1999Q1
Q3
FDI out�ows (1996−97)FDI in�ows (1996−99)Portfolio in�ows (1996−99)
FDI out�ows (1996−99)Portfolio out�ows (1996−99)FDI in�ows (1996−99)Portfolio in�ows (1996−99)
FDI out�ows (1999)Portfolio out�ows (1999)FDI in�ows (1999)Portfolio in�ows (1999)
1999Q1 Q2 Q3 Q4
FDI out�ows (1999)Portfolio out�ows (1999)FDI in�ows (1999)Portfolio in�ows (1999)
(a) 1997–1999
Continued

20 ASIAn DEvElOpMEnt REvIEw
Figure 2—Continued
10,0008,0006,0004,0002,000
0-2,000-4,000-6,000-8,000
3,0002,5002,0001,5001,000
5000
-500-1,000
Singapore �ailand
200,000150,000100,000
50,0000
-50,000-100,000
50,00040,00030,00020,00010,000
0-10,000-20,000-30,000-40,000-50,000
15,00010,000
5,0000
-5,000-10,000-15,000-20,000
20,00015,00010,000
5,0000
-5,000-10,000-15,000-20,000
FDI out�ows (1996−99)Portfolio out�ows (1996−99)FDI in�ows (1996−99)Portfolio in�ows (1996−99)
FDI out�ows (1996−99)Portfolio out�ows (1996−99)FDI in�ows (1996−99)Portfolio in�ows (1996−99)
2007H1
2008H1
H2 H2
1996Q1
1997Q1
Q3 Q3 1998Q1
Q3 1999Q1
Q3 1996Q1
1997Q1
Q3 Q3 1998Q1
Q3 1999Q1
Q3
FDI out�ows (2007−08)Portfolio out�ows (2007−08)FDI in�ows (2007−08)Portfolio in�ows (2007−08)
FDI out�ows (2007−09)Portfolio out�ows (2007−09)FDI in�ows (2007−09)Portfolio in�ows (2007−09)
FDI out�ows (2007−09)Portfolio out�ows (2007−09)FDI in�ows (2007−09)Portfolio in�ows (2007−09)
FDI out�ows (2007−09)Portfolio out�ows (2007−09)FDI in�ows (2007−09)Portfolio in�ows (2007−09)
China, People’s Rep. of(b) 2007–2009
Korea, Rep. of
Hong Kong, China
Taipei,China
2007Q1
Q3 Q3 Q4Q2 Q4 2008Q1
Q2 2009Q1
Q2
2007Q1
Q3 Q3 Q4Q2 Q4 2008Q1
Q2 2009Q1
Q2 2007Q1
Q3 Q3 Q4Q2 Q4 2008Q1
Q2 2009Q1
Q2
Continued

OutwARD FDI AnD tHE FInAnCIAl CRISIS In DEvElOpIng EASt ASIA 21
Figure 2—Continued
8,0006,0004,0002,000
0-2,000-4,000-6,000-8,000
8,0006,0004,0002,000
0-2,000-4,000-6,000
Malaysia Indonesia
15,00010,000
5,0000
-5,000-10,000-15,000
4,000
2,000
0
-2,000
-4,000
-6,000
FDI out�ows (2007−08)Portfolio out�ows (2007)FDI in�ows (2007−08)Portfolio in�ows (2007)
FDI out�ows (2007−09)Portfolio out�ows (2007−09)FDI in�ows (2007−09)Portfolio in�ows (2007−09)
FDI out�ows (2007−09)Portfolio out�ows (2007−09)FDI in�ows (2007−09)Portfolio in�ows (2007−09)
FDI out�ows (2007−08)Portfolio out�ows (2007−08)FDI in�ows (2007−09)Portfolio in�ows (2007−09)
Singapore �ailand
2007Q1
Q3 Q3 Q4Q2 Q4 2008Q1
Q2 2009Q1
Q22007Q1
Q3 Q3 Q4Q2 Q4 2008Q1
Q2 2009Q1
Q2
2007Q1
Q3 Q3 Q4Q2 Q4 2008Q1
Q2 2009Q1
Q2 2007Q1
Q3 Q3 Q4Q2 Q4 2008Q1
Q2 2009Q1
Q2
FDI = foreign direct investment.Sources: unCtAD, world Investment Report database, available http://www.unctad.org/templates/page.
asp?intItemID=192�&lang=1; International Monetary Fund, International Financial Statistics database, available http://www.imfstatistics.org/imf/imfbrowser.aspx?branch=ROOt;
central banks.
Thus the general presumption in the literature is that FDI flows are less volatile than other forms of private capital flows, during both normal times and crisis episodes. This is argued to be one of the benefits of FDI, that is, its greater durability as a consequence of the longer time horizon employed by this class of investors. It is also maintained that FDI therefore poses fewer macroeconomic management challenges, especially for exchange rate policy and the financial sector. the evidence for the East Asian economies is examined below by calculating “volatility indices” (i.e., coefficients of variation) for three periods—up to, during, and after the 1997–1998 Asian crisis—for FDI and portfolio capital, and for inflows and outflows. The results are presented in table 2.

22 ASIAn DEvElOpMEnt REvIEw
table 2. Volatility of FDI (Inward and Outward) and Other Forms of Capital Flows, 1990–2008
Inflows FDI Portfolio Pre-crisis
Crisis Post-crisis
Pre-crisis
Crisis Post-crisis
China, people’s Rep. of
0.70 0.07 0.50 0.99 1.18 0.9�
Hong Kong, China … 0.7� 0.5� … 0.97 1.98Korea, Rep. of 0.55 0.58 0.61 0.77 0.68 0.52Indonesia 0.68 5.�� 1.95 1.07 �.95 1.08Malaysia 0.2� 0.�0 0.57 1.00 1.�2 2.16philippines 0.56 0.�1 0.67 1.�� 1.27 1.0�Singapore 0.�9 0.�2 0.�6 1.�6 2.21 0.92Thailand 0.18 0.�� 0.�9 0.91 1.�9 1.��Outflows FDI Portfolio
Pre-crisis
Crisis Post-crisis
Pre-crisis
Crisis Post-crisis
China, people’s Rep. of
0.60 0.�5 1.0� 0.66 0.95 1.7�
Hong Kong, China … 0.75 0.60 … �.89 0.�2Korea, Rep. of 0.61 0.07 0.7� 1.26 2.�9 1.18Indonesia 0.98 1.67 0.92 … … 1.52Malaysia … 1.62 1.�8 … 1.�0 1.01philippines 0.�1 0.16 2.01 1.�� 1.27 1.0�Singapore 0.79 0.�6 0.6� 1.�6 2.21 0.92Thailand 0.82 0.96 1.1� 1.88 1.50 1.86
… indicates data was unavailable or not applicable.FDI = foreign direct investment.notes: volatility is measured by coefficient of variation, which is standard deviation divided by mean. pre-crisis refers to pre-1997 and post-crisis refers to 2000–2007, except for Hong Kong, China and
Indonesia, for which the data are extended to 2008.Sources: International Monetary Fund, International Financial Statistics database, downloaded June 2009,
available http://www.imfstatistics.org/imf/imfbrowser.aspx?branch=ROOt; authors’ estimates.
For inflows, the evidence is clear. FDI flows are more stable, significantly so in the majority of cases. Interestingly, the relative orders of magnitude do not change substantially over time, that is, pre- and post-crisis. Moreover, the host country policy regimes, in particular whether or not there are capital controls, do not appear to be a major factor. This is certainly the case for Thailand, Singapore, philippines, Malaysia (notwithstanding its short-term capital controls introduced in September 1998), and pRC. However, one clear difference is the behavior of the two series during the 1997–1998 Asian crisis. The volatility of portfolio flows increased for most of the countries, whereas there was no clear trend for FDI in most countries. This is consistent with the typical behavior of the two forms of

OutwARD FDI AnD tHE FInAnCIAl CRISIS In DEvElOpIng EASt ASIA 2�
investment: portfolio investment is much more likely to adopt herd-like behavior and display a boom and bust pattern, whereas FDI is usually more stable. In fact, contrary to the trends in portfolio investment, it may actually increase during a crisis.
In spite of the global increase in capital flows, there are no clear trends over time for the region as a whole. For example, in Singapore, the general trend has been declining volatility in both series, while Malaysia and Thailand have shown a rising trend. This is an important observation given the sometimes hysterical writings in the popular press concerning the alleged dangers of an open capital account.
The principal exception to these observations is Indonesia. pre-crisis, its volatility indices were about at the regional average. However, both rose dramatically during the crisis. Interestingly, the volatility of its portfolio flows has returned to that of the pre-crisis period, whereas FDI has remained volatile, at almost three times that of the pre-crisis period. Indonesia has diverged for two reasons.1� First, and most important, its crisis was the deepest in the region; it was the only one to experience a broad-ranging economic and institutional collapse. The crisis triggered the end of the �2-year Suharto regime in May 1998, and resulted in an extended period of political instability. Consequently, foreign investors of all types avoided the country; FDI flows were negative from 1998 until 200�. A second explanation is that, due to Indonesia’s abundant resources, a higher proportion of its FDI goes to the mining sector, which is inherently more volatile owing to fluctuating commodity prices.
The picture with respect to outflows is broadly similar. The volatility is increasing for some countries (pRC, Korea, Singapore, and Thailand) but not all of them, and the increases are modest in most cases. Because the outflows were generally small before the crisis, the data need to be interpreted carefully. There was no clear trend in outward FDI volatility during the crisis, whereas portfolio outflows increased in most countries. The one case where portfolio volatility was lower was Malaysia, and this presumably reflects the effects of its controversial but largely successful restrictions on short-term capital mobility.
IV. CONCLUSION
The paper’s main conclusions are as follows: First, as part of the general process of global and regional integration, outward FDI from developing East Asia has been growing rapidly. Although in most cases it is smaller than inward FDI, in recent years it has been growing more rapidly in several economies. The East Asian experience demonstrates the growing importance of third-world multinationals
1�See Aswicahyono, Bird, and Hill (2009) and Ramstetter and Sjoholm (2006) for further discussion.
2� ASIAn DEvElOpMEnt REvIEw
and dispels the belief that only firms from high-income economies will invest abroad.
Second, a range of motives and drivers explains these patterns. These include exceptionally high savings rates in some economies, growing technological sophistication, and integration within broader regional buying and production networks. low barriers to cross-border transactions, facilitated by unilateral trade and investment liberalization, geographic proximity, and ethnic familiarity have strengthened the effects of these drivers. It is important to emphasize that while policy initiatives have played a role, the major determinants have been economic. This conclusion applies also to the outward FDI of state-owned or government-linked corporations from countries such as the pRC and Singapore. All the evidence suggests that the decisions of these firms are motivated primarily by a commercial calculus.
Third, it is not yet clear how and to what extent the global financial crisis will affect outward FDI from the region. Outward FDI is likely to decline, consistent with global patterns and driven by declining global output and financial fragility. However, crises deflate asset prices, sometimes significantly, and therefore create buying opportunities for resource-flush investors. The pRC in particular is well placed in this respect, with continuing strong economic growth, a financial sector that remains intact (though with some doubts concerning its prudential and supervisory capacity), and huge international reserves.
REFERENCES
Aswicahyono, H., K. Bird, and H. Hill. 2009. “Making Economic policy in weak, Democratic, post-crisis States: An Indonesian Case Study.” World Development �7(2):�5�–70.
Athukorala, p. 200�. FDI in Crisis and Recovery: lessons from the 1997–98 Asian Crisis. working papers in trade and Development 200�/0�, Research School of pacific and Asian Studies, Australian national university, Canberra.
. 2006. “product Fragmentation and trade patterns in East Asia.” Asian Economic Papers �(�):1–28.
Bruche, g. 2009. “The Emergence of China and India as new Competitors in MnC Innovation networks.” Competition and Change 1�(�):267–88.
Caves, R. E. 1996. Multinational Enterprise and Economic Analysis, Second Edition. Cambridge: Cambridge university press.
Chen t. J. 1998. Taiwanese Firms in Southeast Asia: Networking Across Borders. Cheltenham: Edward Elgar.
Dunning, J. H. 199�. Multinational Enterprises and Global Economy. Boston: Addison wesley.
Economist. 2008. “The Challengers: A new Breed of Multinational Company Has Emerged.” 12 January: 61–6�.

OutwARD FDI AnD tHE FInAnCIAl CRISIS In DEvElOpIng EASt ASIA 25
. 2009. “Research and Development: Asia is Steadily Eroding America’s leadership in Research Spending.” � January: �7.
Froot, K. 199�. Foreign Direct Investment. Chicago: university of Chicago press.James, w., D. park, S. Jha, J. Jongwanich, A. terada-Hagiwara, and l. Sumulong.
2008. The uS Financial Crisis, global Financial turmoil, and Developing Asia: Is the Era of High growth at an End? ADB Economics working paper no. 1�9, Economics and Research Department, Asian Development Bank, Manila.
Kang, S. J., and H. S. lee. 2007. “The Determinants of location Choice of South Korean FDI in China.” Japan and the World Economy 19:��1–60.
Kimura, F. 2006. “International production and Distribution networks in East Asia: 18 Facts, Mechanics, and policy Implications.” Asian Economic Policy Review 1:��6–7.
lipsey, R. E. 2001. Foreign Investment in Three Financial Crises. nBER working papers no. 808�, national Bureau of Economic Research, Cambridge, MA.
naughton, B. 2007. The Chinese Economy: Transitions and Growth. MIt press: Cambridge, MA.
Ramstetter, E. D., and F. Sjoholm. 2006. Multinational Corporations in Indonesia and Thailand: Wages, Productivity and Exports. london: palgrave Macmillan.
Tham S. Y. 2005. Outward Foreign Direct Investment from Malaysia: An Exploratory Study. unpublished paper, Institute of Malaysian and International Studies, national university of Malaysia, Selangor.
unCtAD. various Years. World Investment Report. united nations, geneva and new York.
. 2009. Assessing the Impact of the Current Financial and Economic Crisis on Global FDI Flows. united nations Conference on trade and Development, geneva.
wells, l. t. 198�. Third World Multinationals. Cambridge, MA: MIt press.