ovembe 015 - sampo.com · third quarter 2015 in brief 5 third quarter 2015 in brief sampo group’s...
TRANSCRIPT
Q3 INTERIM REPORT JANUARY – SEPTEMBER 2015
5 NOVEMBER 2015
INTERIM REPORT JANUARY – SEPTEMBER 2015
2
Contents 3 Summary5 Third quarter 2015 in brief6 Change in reporting practices as of 1 January 20167 Business areas7 P&C insurance10 Associated company Nordea Bank AB12 Life insurance14 Holding
15 Other developments 15 Personnel15 Remuneration15 Shares and share capital16 Internal dividends16 Ratings16 Group solvency17 Debt financing
19 Outlook19 Outlook for the rest of 2015 19 Major risks and uncertainties to the Group in the near term
21 Tables21 Group financial review22 Calculation of key figures24 Group quarterly comprehensive income statement25 Statement of profit and other comprehensive income, IFRS26 Consolidated balance sheet, IFRS27 Statement of changes in equity, IFRS 28 Statement of cash flows, IFRS
29 Notes29 Accounting policies30 Comprehensive income statement by segment for nine months ended 30 September 201531 Comprehensive income statement by segment for nine months ended 30 September 201432 Consolidated balance sheet by segment at 30 September 201533 Consolidated balance sheet by segment at 31 December 2014
34 Other notes34 1 Insurance premiums35 2 Net income from investments38 3 Claims incurred39 4 Staff costs40 5 Intangible assets41 6 Financial assets43 7 Derivative financial instruments44 8 Determination and hierarchy of fair values47 9 Movements in level 3 financial instruments measured at fair value49 10 Sensitivity analysis of level 3 financial instruments measured at fair value49 11 Investments related to unit-linked insurance50 12 Liabilities for insurance and investment contracts52 13 Liabilities from unit-linked insurance and investment contracts52 14 Financial liabilities53 15 Contingent liabilities and commitments55 16 Result analysis of P&C insurance business56 17 Sampo plc’s income statement and balance sheet (FAS)
3
INTERIM REPORT JANUARY – SEPTEMBER 2015
Summary
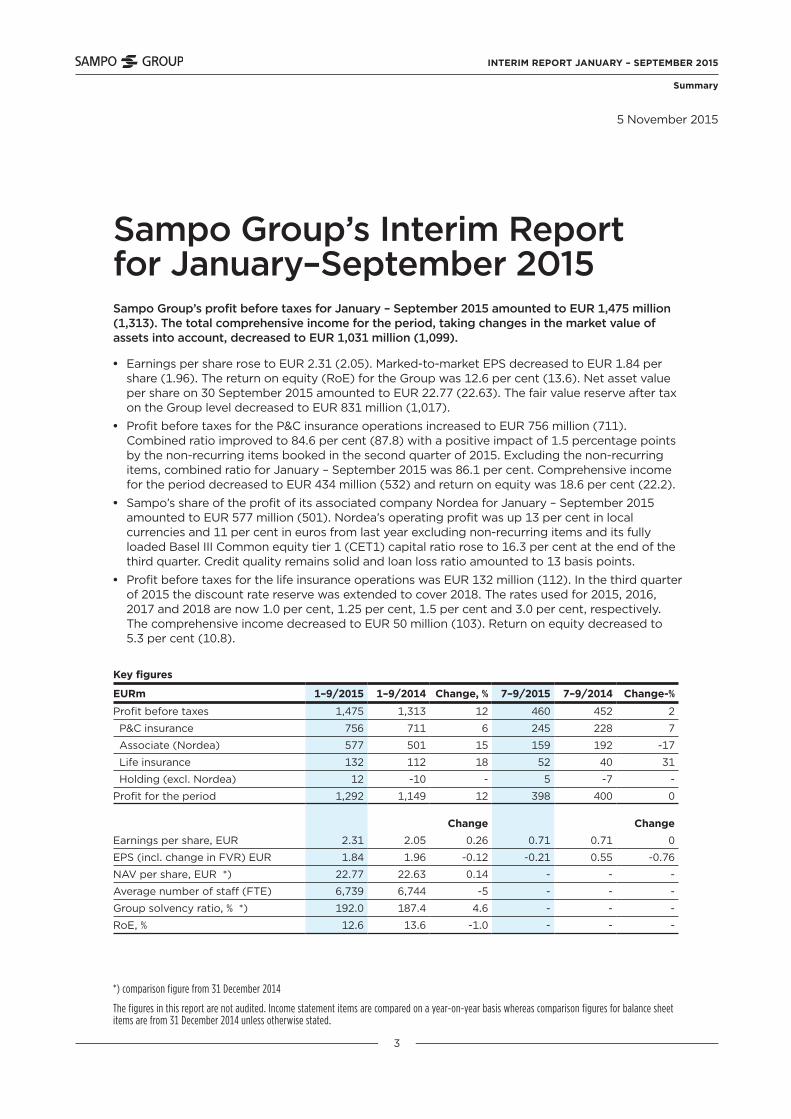
Sampo Group’s Interim Report for January–September 2015Sampo Group’s profit before taxes for January – September 2015 amounted to EUR 1,475 million (1,313). The total comprehensive income for the period, taking changes in the market value of assets into account, decreased to EUR 1,031 million (1,099).
• Earnings per share rose to EUR 2.31 (2.05). Marked-to-market EPS decreased to EUR 1.84 per share (1.96). The return on equity (RoE) for the Group was 12.6 per cent (13.6). Net asset value per share on 30 September 2015 amounted to EUR 22.77 (22.63). The fair value reserve after tax on the Group level decreased to EUR 831 million (1,017).
• Profit before taxes for the P&C insurance operations increased to EUR 756 million (711). Combined ratio improved to 84.6 per cent (87.8) with a positive impact of 1.5 percentage points by the non-recurring items booked in the second quarter of 2015. Excluding the non-recurring items, combined ratio for January – September 2015 was 86.1 per cent. Comprehensive income for the period decreased to EUR 434 million (532) and return on equity was 18.6 per cent (22.2).
• Sampo’s share of the profit of its associated company Nordea for January – September 2015 amounted to EUR 577 million (501). Nordea’s operating profit was up 13 per cent in local currencies and 11 per cent in euros from last year excluding non-recurring items and its fully loaded Basel III Common equity tier 1 (CET1) capital ratio rose to 16.3 per cent at the end of the third quarter. Credit quality remains solid and loan loss ratio amounted to 13 basis points.
• Profit before taxes for the life insurance operations was EUR 132 million (112). In the third quarter of 2015 the discount rate reserve was extended to cover 2018. The rates used for 2015, 2016, 2017 and 2018 are now 1.0 per cent, 1.25 per cent, 1.5 per cent and 3.0 per cent, respectively. The comprehensive income decreased to EUR 50 million (103). Return on equity decreased to 5.3 per cent (10.8).
Key figures
EURm 1–9/2015 1–9/2014 Change, % 7–9/2015 7–9/2014 Change-%
Profit before taxes 1,475 1,313 12 460 452 2
P&C insurance 756 711 6 245 228 7
Associate (Nordea) 577 501 15 159 192 -17
Life insurance 132 112 18 52 40 31
Holding (excl. Nordea) 12 -10 - 5 -7 -
Profit for the period 1,292 1,149 12 398 400 0
Change ChangeEarnings per share, EUR 2.31 2.05 0.26 0.71 0.71 0
EPS (incl. change in FVR) EUR 1.84 1.96 -0.12 -0.21 0.55 -0.76
NAV per share, EUR *) 22.77 22.63 0.14 - - -
Average number of staff (FTE) 6,739 6,744 -5 - - -
Group solvency ratio, % *) 192.0 187.4 4.6 - - -
RoE, % 12.6 13.6 -1.0 - - -
*) comparison figure from 31 December 2014
The figures in this report are not audited. Income statement items are compared on a year-on-year basis whereas comparison figures for balance sheet items are from 31 December 2014 unless otherwise stated.
5 November 2015

INTERIM REPORT JANUARY – SEPTEMBER 2015
4
Exchange rates used in reporting
1-9/2015 1-6/2015 1-3/2015 1-12/2014 1-9/2014
EUR 1 = SEK
Income statement (average) 9.3709 9.3416 9.3805 9.1011 9.0420
Balance sheet (at end of period) 9.4083 9.2150 9.2901 9.3930 9.1465
DKK 1 = SEK
Income statement (average) 1.2567 1.2530 1.2593 1.2205 1.2118
Balance sheet (at end of period) 1.2612 1.2352 1.2437 1.2616 1.2289
NOK 1 = SEK
Income statement (average) 1.0646 1.0809 1.0746 1.0893 1.0924
Balance sheet (at end of period) 0.9878 1.0482 1.0674 1.0388 1.1266
INTERIM REPORT JANUARY – SEPTEMBER 2015
Third quarter 2015 in brief
5
Third quarter 2015 in brief
Sampo Group’s profit before taxes for the third quarter 2015 amounted to EUR 460 million (452). Earnings per share was stable at EUR 0.71 (0.71). Marked-to-market earnings per share decreased to EUR -0.21 (0.55).
Net asset value per share decreased EUR 2.24 during the third quarter of 2015 and was EUR 22.77. The decrease is due to the negative development of the valuation difference of Nordea holding corresponding to EUR 2.11 in Sampo’s net asset value per share and the weak capital market development in general.
P&C operations achieved a third quarter combined ratio of 83.8 per cent (86.9). Profit before taxes increased to EUR 245 million (228). Share of the profits of the associated company Topdanmark amounted to EUR 13 million (18).
Sampo’s share of Nordea’s third quarter 2015 net profit amounted to EUR 159 million (192).
Profit before taxes for the life insurance operations was EUR 52 million (40). Premiums written decreased 14 per cent to EUR 162 million from EUR 188 million at the corresponding period a year ago.
INTERIM REPORT JANUARY – SEPTEMBER 2015
Change in reporting practices
6
Change in reporting practices as of 1 January 2016 The Finnish Parliament has passed changes to the Securities Markets Act implementing the amendments to the Transparency Directive. The changes will enter into force on 26 November 2015. After the amendments have entered into force listed companies no longer have an obligation to publish quarterly reports for the first and the third quarter. The companies only have to publish a yearly and a half-yearly report.
The Nasdaq Helsinki stock exchange is also introducing corresponding changes to their rules. Sampo Group has decided on a new reporting policy that better takes the special features of its operations, industry practices and investor expectations into account. For more details see Sampo Group’s Disclosure Policy updated by the Board of Directors on 5 November 2015 and available at www.sampo.com/governance/disclosure-policy.
As of 2016 Sampo Group’s first and third quarter reports will be published in an abridged format. Investor information will not be weakened by the change and the consistency in reporting will not suffer.

INTERIM REPORT JANUARY – SEPTEMBER 2015
Business areas
7
Business areas P&C insurance
If P&C is the leading property and casualty insurance company in the Nordic region, with insurance operations that also encompass the Baltic countries. The P&C insurance group’s parent company, If P&C Insurance Holding Ltd, is located in Sweden, and the If subsidiaries and branches provide insurance solutions and services in Finland, Sweden, Norway, Denmark and the Baltic countries. If’s operations are divided into four business areas: Private, Commercial, Industrial and Baltic. The Danish insurance company Topdanmark is If P&C’s associated company.
Profit before taxes for the P&C insurance operations increased to EUR 756 million (711) in January – September 2015. Combined ratio improved to 84.6 per cent (87.8) while risk ratio deteriorated to 67.1 per cent (65.4), impacted by the two non-recurring items; lowering of the annuities discount rate in Finland and the Norwegian pension reform, booked in the second quarter of 2015. Excluding the non-recurring items, combined ratio for January – September 2015 was 86.1 per cent.
Technical reserves relating to prior year claims were strengthened by EUR 83 million in January – September 2015 (EUR 18 million released in the comparison period) explained by the discount rate changes of EUR 112 million. Return on equity (RoE) decreased to 18.6 per cent (22.2) and the fair value reserve on 30 September 2015 to EUR 390 million (507).
Results
EURm 1–9/2015 1–9/2014 Change, % 7–9/2015 7–9/2014 Change, %
Premiums, net 3,493 3,564 -2 865 883 -2
Net income from investments 234 278 -16 61 69 -11
Other operating income 21 21 1 6 7 -10
Claims incurred -2,191 -2,189 0 -672 -728 -8
Change in insurance liabilities -227 -215 6 222 241 -8
Staff costs -243 -408 -40 -137 -133 3
Other operating expenses -356 -370 -4 -110 -125 -13
Finance costs -12 -15 -18 -3 -5 -40
Share of associates’ profit/loss 36 45 -18 12 18 -33
Profit before taxes 756 711 6 245 228 7
Key figures Change Change
Combined ratio, % 84.6 87.8 -3.2 83.8 86.9 -3.1
Risk ratio, % 67.1 65.4 1.7 61.9 64.7 -2.8
Cost ratio, % 17.6 22.5 -4.9 22.0 22.2 -0.2
Expense ratio, % 11.8 16.6 -4.8 16.1 16.3 -0.2
Return on equity, % 18.6 22.2 -3.6 - - -
Average number of staff (FTE) 6,162 6,170 -8 - - -

INTERIM REPORT JANUARY – SEPTEMBER 2015
Business areas
8
Combined ratio, % Risk ratio, %
1–9/2015 1–9/2014 Change 1–9/2015 1–9/2014 Change
Private 88.9 87.5 1.4 66.5 65.3 1.2
Commercial 90.4 88.3 2.1 67.5 65.5 2.0
Industrial 94.5 90.3 4.2 73.3 69.6 3.7
Baltic 85.1 81.2 3.9 55.6 51.4 4.2
Sweden 85.0 95.9 -10.9 63.3 73.4 -10.1
Norway 87.6 84.5 3.1 65.0 62.4 2.6
Finland 99.6 84.1 15.5 77.9 62.8 15.1
Denmark 90.6 84.6 6.0 64.0 59.9 4.1
Combined ratio, % Risk ratio, %
7–9/2015 7–9/2014 Change 7–9/2015 7–9/2014 Change
Private 86.7 86.8 -0.1 64.9 65.2 -0.3
Commercial 82.4 86.8 -4.4 59.7 64.2 -4.5
Industrial 72.0 88.1 -16.1 51.4 68.1 -16.7
Baltic 86.0 77.0 9.0 58.0 47.9 10.1
Sweden 80.8 95.8 -15.0 59.7 73.1 -13.4
Norway 82.2 81.6 0.6 60.4 60.0 0.4
Finland 89.8 82.9 6.9 67.8 62.6 5.2
Denmark 86.6 87.8 -1.2 61.0 65.0 -4.0
Technical result amounted to EUR 522 million (441). Insurance margin (technical result in relation to net premiums earned) improved to 16.0 per cent (13.1).
Topdanmark’s profit contribution for January – September 2015 was EUR 37 million (44). On 30 September 2015 If P&C held 31,476,920 Topdanmark shares, corresponding to over 30 per cent of all votes. All Topdanmark shares held by Sampo Group are concentrated in If P&C Insurance Holding Ltd (publ).
The lowering of the annuities discount rate in Finland during the second quarter affected all business areas’ results in Finland negatively and weakened the Finnish country specific result substantially in January – September 2015. In Sweden, risk ratio improved by 10.1 percentage points supported by a positive large claims outcome compared to the previous year. Swedish discount rate used to discount the annuity reserves decreased 1 basis point to 0.40 per cent by the end of September and had a EUR 1 million negative effect on the Swedish result in the third quarter of 2015. Total large claims ended up EUR 6 million better than expected.

INTERIM REPORT JANUARY – SEPTEMBER 2015
Business areas
9
Gross written premiums decreased to EUR 3,659 million (3,724). Adjusted for currency, premium growth was slightly positive. Growth was positive in business areas Private and Baltic, and negative in business areas Commercial and Industrial.
Cost ratio improved to 17.6 per cent (22.5) and expense ratio to 11.8 per cent (16.6), both impacted by the positive effect of the non-recurring reform of the pension system in If Norway booked in the second quarter of 2015. Excluding the non-recurring item the cost ratio was 22.3 per cent and expense ratio 16.5 per cent.
On 30 September 2015, the total investment assets of If P&C amounted to EUR 11.5 billion (11.5), of which fixed income investments constituted 74 per cent (75), money market 14 per cent (13) and equity 12 per cent (12). Net income from investments amounted to EUR 234 million (278). Investment return marked-to-market for January-September 2015 was 0.9 per cent (3.6). Duration for interest bearing assets was 1.0 year (1.0) and average maturity 2.6 years (2.4). Fixed income running yield was 1.8 per cent (2.5).
If P&C’s solvency ratio as at 30 September 2015 (solvency capital in relation to net written premiums) amounted to 87 per cent (82). Solvency capital amounted to EUR 3,792 million (3,544). Reserve ratios remained strong and were 168 per cent (161) of net written premiums and 250 per cent (237) of claims paid. Issues relating to Solvency II regime, which will enter into force on 1 January 2016, are dealt with under the section Group solvency.
If P&C’s Finnish subsidiary, If P&C Insurance Company Ltd (Finland), began a cooperation procedure on 12 October 2015 involving approximately 212 staff members at Commercial and Private business areas as well as internal audit. The cooperation procedure began because of the need for centralizing operations due to the growing demand for internet and telephone services for customers as well as to the increased use of automation.
INTERIM REPORT JANUARY – SEPTEMBER 2015
Business areas
10
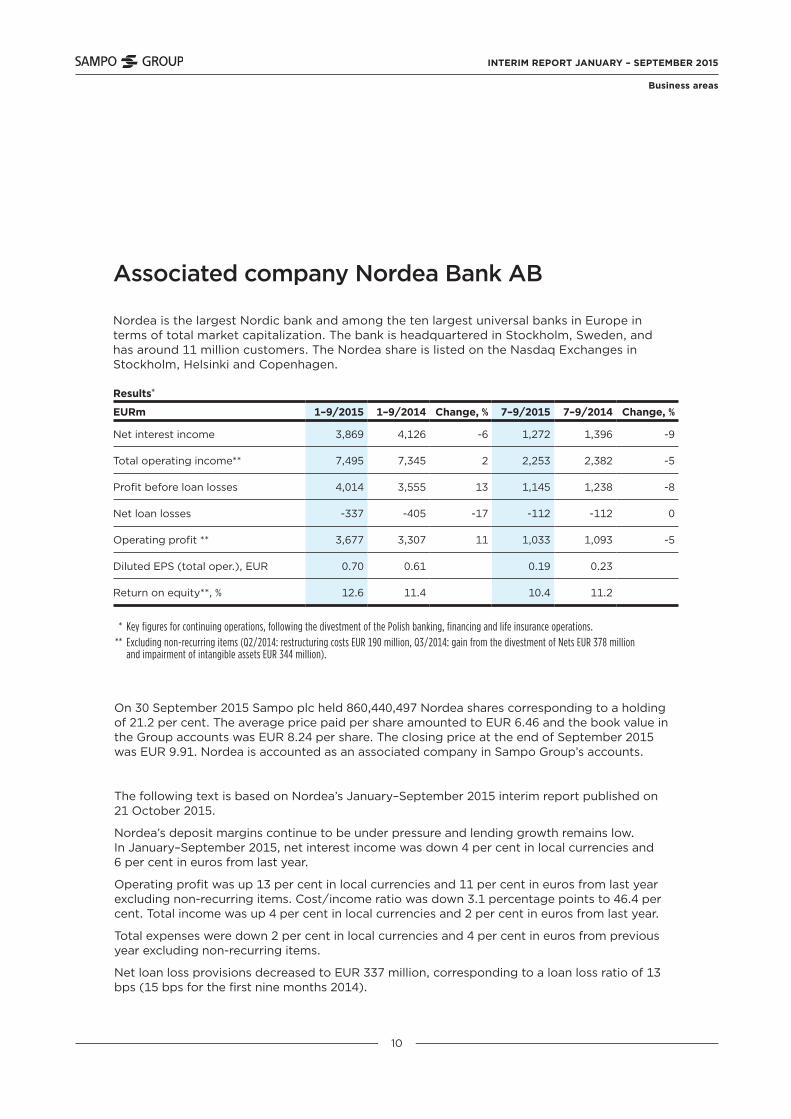
Nordea is the largest Nordic bank and among the ten largest universal banks in Europe in terms of total market capitalization. The bank is headquartered in Stockholm, Sweden, and has around 11 million customers. The Nordea share is listed on the Nasdaq Exchanges in Stockholm, Helsinki and Copenhagen.
On 30 September 2015 Sampo plc held 860,440,497 Nordea shares corresponding to a holding of 21.2 per cent. The average price paid per share amounted to EUR 6.46 and the book value in the Group accounts was EUR 8.24 per share. The closing price at the end of September 2015 was EUR 9.91. Nordea is accounted as an associated company in Sampo Group’s accounts.
The following text is based on Nordea’s January–September 2015 interim report published on 21 October 2015.
Nordea’s deposit margins continue to be under pressure and lending growth remains low. In January–September 2015, net interest income was down 4 per cent in local currencies and 6 per cent in euros from last year.
Operating profit was up 13 per cent in local currencies and 11 per cent in euros from last year excluding non-recurring items. Cost/income ratio was down 3.1 percentage points to 46.4 per cent. Total income was up 4 per cent in local currencies and 2 per cent in euros from last year.
Total expenses were down 2 per cent in local currencies and 4 per cent in euros from previous year excluding non-recurring items.
Net loan loss provisions decreased to EUR 337 million, corresponding to a loan loss ratio of 13 bps (15 bps for the first nine months 2014).
Results*
EURm 1–9/2015 1–9/2014 Change, % 7–9/2015 7–9/2014 Change, %
Net interest income 3,869 4,126 -6 1,272 1,396 -9
Total operating income** 7,495 7,345 2 2,253 2,382 -5
Profit before loan losses 4,014 3,555 13 1,145 1,238 -8
Net loan losses -337 -405 -17 -112 -112 0
Operating profit ** 3,677 3,307 11 1,033 1,093 -5
Diluted EPS (total oper.), EUR 0.70 0.61 0.19 0.23
Return on equity**, % 12.6 11.4 10.4 11.2
etoiminta-alueet Associated company Nordea Bank AB
* Key figures for continuing operations, following the divestment of the Polish banking, financing and life insurance operations. ** Excluding non-recurring items (Q2/2014: restructuring costs EUR 190 million, Q3/2014: gain from the divestment of Nets EUR 378 million and impairment of intangible assets EUR 344 million).

INTERIM REPORT JANUARY – SEPTEMBER 2015
Business areas
11
Net profit increased 15 per cent both in local currencies and in euros and totalled EUR 2,814 million. Currency fluctuations had a reducing effect of 2 percentage points on income and expenses and approx. -3 percentage points on loan and deposit volumes compared to first nine months of 2014.
Nordea continues to see a good inflow in savings and investment operations, despite declining asset prices. Assets under management are up EUR 19 billion or 7 per cent compared to twelve months ago, fully driven by strong inflow.
The Group’s Basel III Common equity tier 1 (CET1) capital ratio increased to 16.3 per cent at the end of the third quarter 2015 from 16.0 per cent at the end of the second quarter 2015. The CET1 capital ratio was negatively affected by currency effects in the CET1 capital, offset by strong profit generation and lower risk exposure amount. The tier 1 capital ratio increased to 18.2 per cent and the total capital ratio increased from 20.7 per cent to 21.3 per cent.
Further information on Nordea Bank AB and its January–September 2015 result is available at www.nordea.com.
INTERIM REPORT JANUARY – SEPTEMBER 2015
Business areas
12
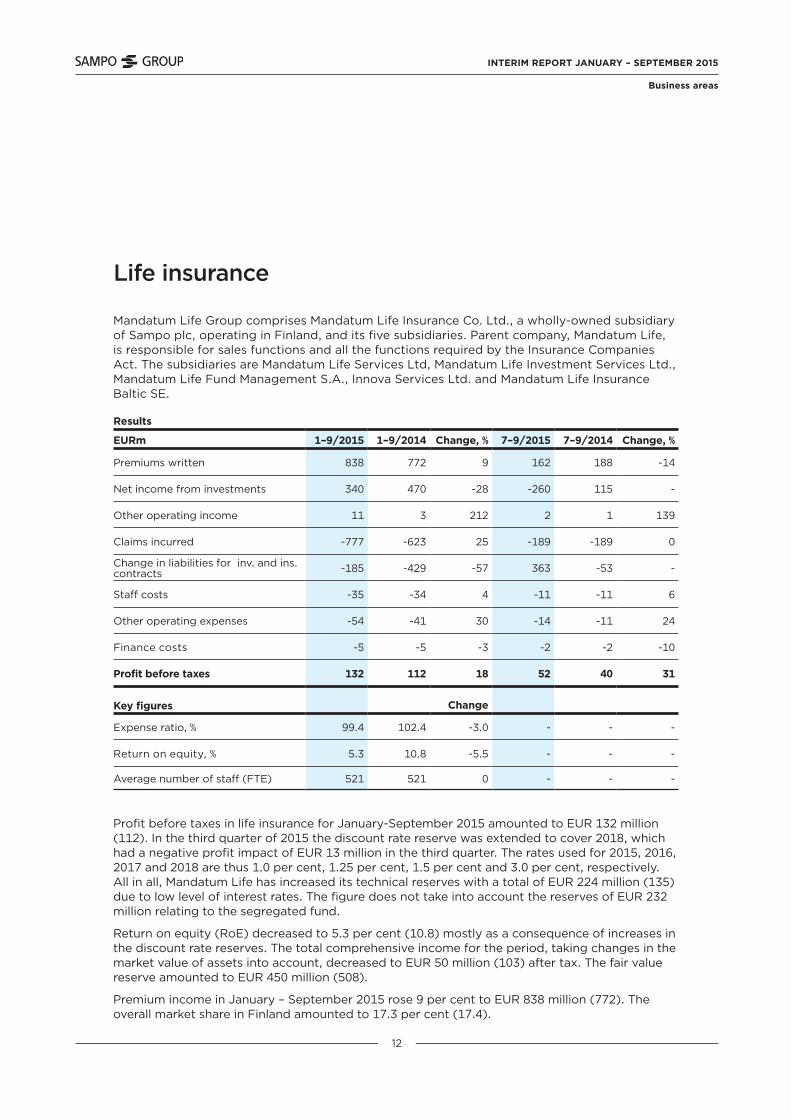
Profit before taxes in life insurance for January-September 2015 amounted to EUR 132 million (112). In the third quarter of 2015 the discount rate reserve was extended to cover 2018, which had a negative profit impact of EUR 13 million in the third quarter. The rates used for 2015, 2016, 2017 and 2018 are thus 1.0 per cent, 1.25 per cent, 1.5 per cent and 3.0 per cent, respectively. All in all, Mandatum Life has increased its technical reserves with a total of EUR 224 million (135) due to low level of interest rates. The figure does not take into account the reserves of EUR 232 million relating to the segregated fund.
Return on equity (RoE) decreased to 5.3 per cent (10.8) mostly as a consequence of increases in the discount rate reserves. The total comprehensive income for the period, taking changes in the market value of assets into account, decreased to EUR 50 million (103) after tax. The fair value reserve amounted to EUR 450 million (508).
Premium income in January – September 2015 rose 9 per cent to EUR 838 million (772). The overall market share in Finland amounted to 17.3 per cent (17.4).
Mandatum Life Group comprises Mandatum Life Insurance Co. Ltd., a wholly-owned subsidiary of Sampo plc, operating in Finland, and its five subsidiaries. Parent company, Mandatum Life, is responsible for sales functions and all the functions required by the Insurance Companies Act. The subsidiaries are Mandatum Life Services Ltd, Mandatum Life Investment Services Ltd., Mandatum Life Fund Management S.A., Innova Services Ltd. and Mandatum Life Insurance Baltic SE.
Results
EURm 1–9/2015 1–9/2014 Change, % 7–9/2015 7–9/2014 Change, %
Premiums written 838 772 9 162 188 -14
Net income from investments 340 470 -28 -260 115 -
Other operating income 11 3 212 2 1 139
Claims incurred -777 -623 25 -189 -189 0
Change in liabilities for inv. and ins. contracts -185 -429 -57 363 -53 -
Staff costs -35 -34 4 -11 -11 6
Other operating expenses -54 -41 30 -14 -11 24
Finance costs -5 -5 -3 -2 -2 -10
Profit before taxes 132 112 18 52 40 31
Key figures Change
Expense ratio, % 99.4 102.4 -3.0 - - -
Return on equity, % 5.3 10.8 -5.5 - - -
Average number of staff (FTE) 521 521 0 - - -
Liiketoiminta-alueet Life insurance
INTERIM REPORT JANUARY – SEPTEMBER 2015
Business areas
13
The expense result for January - September of 2015 rose to an all-time high and was EUR 20 million (15). Risk result amounted to EUR 15 million (13).
The unit-linked reserves amounted to EUR 5.6 billion (5.3) at the end of September 2015, down EUR 0.3 billion from the record level at the end of March 2015 because of the difficult capital market conditions. Net investment income from unit-linked investments was EUR 23 million (258).
The with profit reserves decreased to EUR 5.0 billion (5.1), of which the original Mandatum Life with profit reserves constituted EUR 3.8 billion (3.8) and the segregated fund EUR 1.2 billion (1.2). The amount of higher guarantee with profit reserves (3.5 and 4.5 per cent) continued to decrease according to plan, i.e. EUR 154 million in the first three quarters of 2015 but the increase in the reserves for decreased discount rate kept the overall reserves almost unchanged.
The assets covering Mandatum Life’s original with profit liabilities on 30 September 2015 amounted to EUR 5.3 billion (5.3) at market values. 45 per cent (32) of the assets are in fixed income instruments, 10 per cent (23) in money market, 29 per cent (30) in equities and 16 per cent (15) in alternative investments. The investment return marked-to-market for January – September 2015 was 3.7 per cent (3.9). The duration of fixed income assets at the end of September 2015 was 2.0 years (1.6) and average maturity 2.7 years (1.9). Fixed income running yield was 3.2 per cent (3.5).
The assets covering the segregated fund amounted to EUR 1.2 billion (1.3), of which 69 per cent (48) was in fixed income, 11 per cent (33) in money market, 10 per cent (8) in equities and 10 per cent (11) in alternative investments. Segregated fund’s investment return marked-to-market for January – September 2015 was 2.3 per cent. At the end of September 2015 the duration of fixed income assets was 2.1 years and average maturity 3.6 years. Fixed income running yield was 1.3 per cent.
Mandatum Life Group’s Solvency I position remains strong and the solvency ratio on 30 September 2015 amounted to 23.6 per cent (22.9). Issues relating to Solvency II regime, which will enter into force on 1 January 2016, are dealt with under the section Group solvency.
INTERIM REPORT JANUARY – SEPTEMBER 2015
Business areas
14
Sampo plc controls its subsidiaries engaged in P&C and life insurance. In addition on 30 September 2015 Sampo plc held 21.2 per cent of the share capital of Nordea, the largest bank in the Nordic countries. Nordea is an associated company to Sampo plc.
The segment’s profit before taxes amounted in January – September 2015 to EUR 589 million (491), of which EUR 577 million (501) comes from Sampo’s share of Nordea’s January - September 2015 profit. The segment, excluding share of Nordea’s profit, reported a pre-tax profit of EUR 12 million (-10). Swedish krona exchange rate changes affected the profit positively in the third quarter by EUR 11 million and for January – September 2015 the effect of all currency changes together was EUR 24 million.
Sampo plc’s holding in Nordea Bank was booked in the consolidated balance sheet at EUR 7.1 billion (7.0). The market value of the holding was EUR 8.5 billion as at 30 September 2015. In addition the assets on Sampo plc’s balance sheet as at 30 September 2015 included holdings in subsidiaries for EUR 2.4 billion (2.4).
Results
EURm 1–9/2015 1–9/2014 Change, % 7–9/2015 7–9/2014 Change, %
Net investment income 60 22 170 8 9 -9
Other operating income 12 11 13 4 4 -3
Staff costs -14 -14 2 -4 -4 2
Other operating expenses -9 -8 1 -2 -2 -24
Finance costs -38 -21 80 -1 -14 -93
Share of associates’ profit 577 501 15 159 192 -17
Profit before taxes 589 491 20 164 185 -11
Key figures Change
Average number of staff (FTE) 56 54 2 - - -
Liiketoiminta-alueet Holding
INTERIM REPORT JANUARY – SEPTEMBER 2015
Other developments
15
Other developments
Personnel The number of full-time equivalent staff in Sampo Group on 30 September 2015 was 6,802 employees compared to 6,723 employees at the end of 2014. The number of staff increased slightly in both P&C insurance and life insurance.
During the third quarter of 2015, approximately 91 per cent of the staff worked in P&C insurance, 8 per cent in life insurance and 1 per cent in the Group’s parent company Sampo plc. Geographically, 33 per cent worked in Finland, 27 per cent in Sweden, 20 per cent in Norway and 20 per cent in the Baltic and other countries. The average number of employees during January-September 2015 was 6,739. A year earlier the corresponding figure was 6,744.
Remuneration Sampo Group’s variable compensation is based either on the contribution to the company’s profitability (e.g. short-term incentive programs) or linked to committing employees to the Group for a longer period of time (long-term incentive programs). Remuneration in Sampo Group is based on the Remuneration Principles that apply to all companies within Sampo Group. Sampo plc’s Board of Directors approved the updated Sampo Group Remuneration Principles on 17 September 2014.
In January – September 2015 payments of EUR 34 million were made on the basis of the long-term incentive schemes (26). The result impact of the long-term incentive schemes in force in January - September 2015 was EUR 25 million (34). At the end of September 2015 Sampo Group had provisioned EUR 35 million (39) for future payments of long-term incentive schemes. EUR 31 million (36), including social costs, was paid as short-term incentives during the same period.
The different forms of remuneration used in Sampo Group are described in more detail at www.sampo.com/remuneration. The terms of the long-term incentive schemes are available at www.sampo.com/incentiveterms. Sampo Group’s Remuneration Report published in March 2015 in accordance with section 7 (Remuneration) of the Corporate Governance Code is available at www.sampo.com/remuneration.
Shares and share capital The Annual General Meeting of 16 April 2015 authorized the Board to repurchase a maximum of 50,000,000 Sampo A shares. In the first three quarters of 2015 Sampo plc has not repurchased its own shares. At the end of September 2015, neither Sampo plc nor its subsidiaries held any Sampo shares.
Sampo plc received on 4 August 2015 a disclosure under Chapter 9, Section 5 of the Securities Markets Act, according to which the total number of Sampo A shares and related voting rights owned by BlackRock, Inc. (USA tax ID 32-0174421) had on 31 July 2015 decreased below five (5) per cent of Sampo plc’s entire stock and voting rights. According to a disclosure on 19 May 2014 BlackRock, Inc. had held 5.08 per cent of total number of shares and 5.03 per cent of voting rights in Sampo plc.
INTERIM REPORT JANUARY – SEPTEMBER 2015
Other developments
16
On 3 September Sampo plc received a further notification stating that the total number of shares owned by BlackRock had exceeded five (5) per cent but that the voting rights attached to the shares did not exceed five (5) per cent. According to a notification received on 7 September 2015 the total number of voting rights related to Sampo shares held by BlackRock had increased above five (5) per cent.
A notification received on 8 October 2015 stated that the number of shares held by BlackRock continued to exceed five (5) per cent of the total number of shares in Sampo but that the total number of voting rights attached to these shares had decreased below five (5) per cent. According to a notification received on 9 October 2015 also the total number of Sampo shares held by BlackRock had decreased below five (5) per cent.
Internal dividendsIf P&C will pay a dividend of SEK 5.5 billion (approx. EUR 590 million) to Sampo plc on 8 December 2015.
Sampo plc received a dividend of EUR 100 million from Mandatum Life on 25 March 2015 and a dividend of EUR 533 million was received from the associated company Nordea Bank AB on 30 March 2015.
Ratings All the ratings for Sampo Group companies remained unchanged in the first three quarters of 2015.
Rated company Moody’s Standard & Poor’s
Rating Outlook Rating Outlook
Sampo plc Baa2 Stable Not rated -
If P&C Insurance Ltd (Sweden) A2 Stable A Stable
If P&C Insurance Company Ltd (Finland) A2 Stable A Stable
Group solvency Sampo Group is regarded as a financial and insurance conglomerate according to the Act on the Supervision of Financial and Insurance Conglomerates (2004/699). The Act is based on Directive 2002/87/EC of the European Parliament and of the Council on the supplementary supervision of credit institutions, insurance undertakings and investment. The Act will be amended as of 1 January 2016 to correspond to the solvency rules – Solvency II and Basel III.
Insurance operations in Sampo Group are in different phases with regard to solvency II process.
Mandatum Life will use a standard model for Solvency II calculations. The company received an approval from Finnish FSA on 11 August 2015 to use transitional measures on technical provisions. At the end of September 2015 after transitional measures, the estimated own funds (OF) of EUR 1,860 million exceed Solvency Capital Requirement (SCR) of EUR 1,189 and

INTERIM REPORT JANUARY – SEPTEMBER 2015
Other developments
17
coverage ratio is strong at 156 per cent. Without transitional measures on technical reserves the coverage ratio would have been 100 per cent.
If P&C Group has over a number of years used its internal economic capital model to estimate the amount of capital needed to cover its risks. Since 2011 development of internal model has been conducted as part of the so called pre-application process with authorities to correspond to the extent possible to Solvency II requirements. As a result If P&C Group aims to use a partial internal model for Solvency II to calculate its external SCR. An application for the approval of the model was submitted to the authorities in June 2015.
The approval process will not be finalized before 1 January 2016. If P&C Group will use a standard model for Solvency II as of 1 January 2016 and then switch to the partial internal model once it has been approved by the authorities. The standard model has roughly a EUR 460 million higher capital requirement than the partial internal model. However, If P&C Group has an A rating from S&P which will continue to require significantly more capital and therefore the use of standard model has no practical implications on the Group’s capital position. On 30 September 2015 If P&C Group’s Solvency II capital requirement under standard model would have been EUR 2,136 million and own funds of EUR 3,650 million. Calculated with the partial internal model figures would have been EUR 1,676 million and EUR 3,830 million, respectively.
Sampo Group solvency
EURm 30 September 2015 31 December 2014
Group capital 10,876 10,924
Sectoral items 1,727 1,685
Intangibles and other deductibles -3,077 -3,426
Group's own funds, total 9,527 9,183
Minimum requirements for own funds, total 4,962 4,901
Group solvency 4,565 4,282
Group solvency ratio (Own funds % of minimum requirements) 192.0 187.4
The table above illustrates the solvency calculation under the present rules. The Group’s solvency ratio (own funds in relation to minimum requirements for own funds) was 192.0 per cent (187.4) as at 30 September 2015. The estimated solvency ratio would have been 143 per cent, if the Solvency II rules had already been in force on 30 September 2015.
Debt financing Sampo plc’s debt financing on 30 September 2015 amounted to EUR 2,284 million (2,192) and interest bearing assets to EUR 630 million (1,233). Interest bearing assets include bank accounts, EUR 503 million of hybrid capital and subordinated debt instruments issued by the subsidiaries and associates and EUR 21 million of other fixed income instruments. During January - September 2015 the net debt increased to EUR 1,654 million (960). The net debt calculation only takes into account interest bearing assets and liabilities. Gross debt to Sampo plc’s equity was 35 per cent (31) and financial leverage 26 per cent (24).

INTERIM REPORT JANUARY – SEPTEMBER 2015
Other developments
18
As at 30 September 2015 financial liabilities in Sampo plc’s balance sheet consisted of issued senior bonds and notes of EUR 1,984 million (1,888) and EUR 300 million (305) of outstanding CPs issued. The average interest, net of interest rate swaps, on Sampo plc’s debt as of 30 September 2015 was 1.52 per cent (1.74).
To balance the risks on the Group level Sampo plc’s debt is mainly tied to short-term interest rates and issued in euro or Swedish krona. Interest rate swaps are used to obtain the desired characteristics for the debt portfolio. These derivatives are valued at fair value in the profit and loss account although economically they are related the underlying bonds. As a result Sampo plc maintains the flexibility to adjust derivative position if needed but this comes at the cost of increased volatility in the Holding segment’s net finance costs.
The underlying objective of Sampo plc is to maintain a well-diversified debt structure, relatively low leverage and strong liquidity in order for the company to be able to arrange financing for strategic projects if needed. Strong liquidity and the ability to acquire financing are essential factors in maintaining Sampo Group’s strategic flexibility.
More information on Sampo Group’s outstanding debt issues is available at www.sampo.com/debtfinancing.

INTERIM REPORT JANUARY – SEPTEMBER 2015
Outlook
19
Outlook
Outlook for the rest of 2015 Sampo Group’s business areas are expected to report good operating results for 2015.
However, the marked-to-market results are, particularly in life insurance, highly dependent on capital market developments. The very low interest rate level also creates a challenging environment for reinvestment in fixed income assets.
The P&C insurance operations are expected to reach their long-term combined ratio target of below 95 per cent in 2015 and achieve a full-year combined ratio of 86 - 88 per cent excluding the positive total effect of the Norwegian pension reform and the change in discount rate for Finnish annuities.
Nordea’s contribution to the Group’s profit is expected to be significant.
Major risks and uncertainties to the Group in the near term In its day-to-day business activities Sampo Group is exposed to various risks and uncertainties mainly through its separately managed major business units. Parent Company Sampo plc’s contribution to risks is minor. Major risks affecting the Group’s profitability and its variation are market, credit, insurance and operational risks which are quantified independently by the major business units.
Uncertainties in the form of major unforeseen events may have an immediate impact on the Group’s profitability. Identification of unforeseen events is easier than estimation of their probabilities, timing and potential outcomes. Currently there are a number of widely identified macro-economic, political and other sources of uncertainty which can in various ways affect financial services industry negatively.
Other sources of uncertainty are unforeseen structural changes in the business environment and already identified trends and potential wide-impact events. These external drivers may also have a long-term impact on how business shall be conducted.
SAMPO PLC Board of Directors
INTERIM REPORT JANUARY – SEPTEMBER 2015
Information
20
Distribution: Nasdaq Helsinki The principal media Financial Supervisory Authority www.sampo.com
For more information, please contact:Peter Johansson, Group CFO, tel. +358 10 516 0010
Jarmo Salonen, Head of Investor Relations and Group Communications, tel. +358 10 516 0030
Essi Nikitin, IR Manager, tel. +358 10 516 0066
Maria Silander, Communications Manager tel. +358 10 516 0031
Conference call An English-language conference call for investors and analysts will be arranged at 4 pm Finnish time (2 pm UK time). Please call +44 (0)20 3194 0552, +1 855 716 1597, +46 (0)8 566 42 702 or +358 (0)9 8171 0495.
The conference call can also be followed live at www.sampo.com/result. A recorded version will later be available at the same address.
In addition the Supplementary Financial Information Package is available at www.sampo.com/result.
Sampo will publish the Full-Year Report for 2015 on 10 February 2016.
INTERIM REPORT JANUARY – SEPTEMBER 2015
21
Group financial review
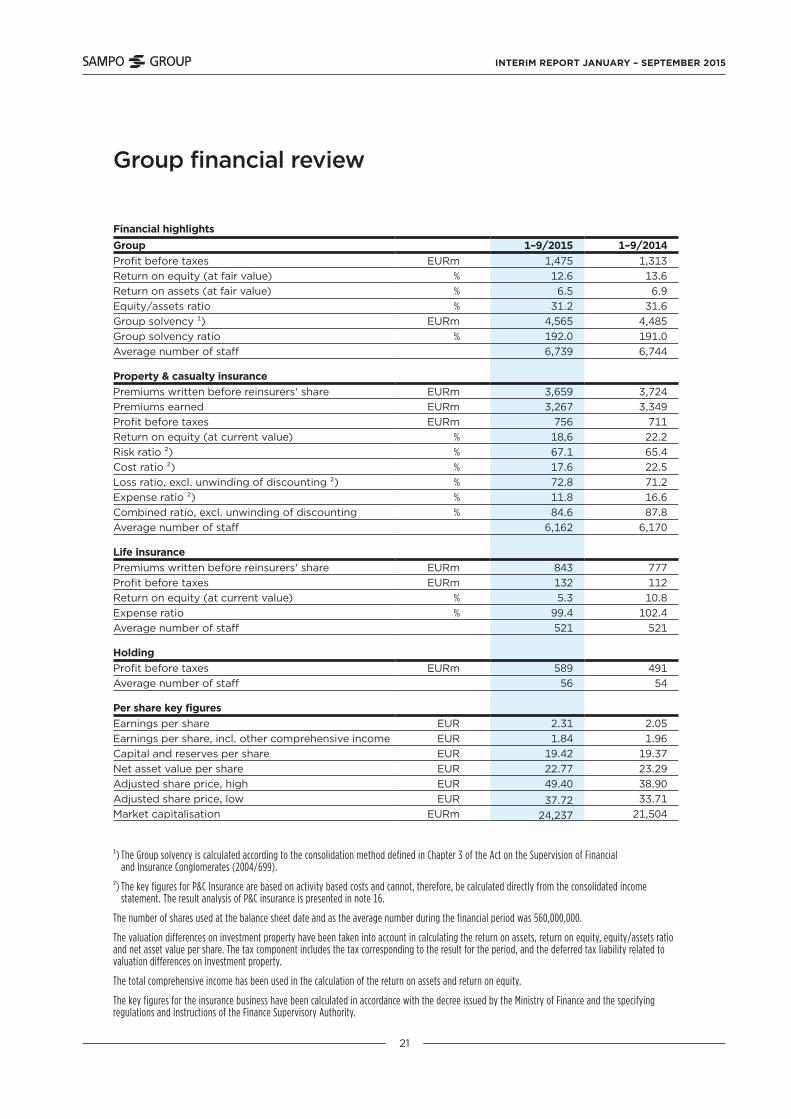
Financial highlightsGroup 1–9/2015 1–9/2014Profit before taxes EURm 1,475 1,313Return on equity (at fair value) % 12.6 13.6Return on assets (at fair value) % 6.5 6.9Equity/assets ratio % 31.2 31.6Group solvency ¹) EURm 4,565 4,485Group solvency ratio % 192.0 191.0Average number of staff 6,739 6,744
Property & casualty insurancePremiums written before reinsurers' share EURm 3,659 3,724Premiums earned EURm 3,267 3,349Profit before taxes EURm 756 711Return on equity (at current value) % 18,6 22.2Risk ratio ²) % 67.1 65.4Cost ratio ²) % 17.6 22.5Loss ratio, excl. unwinding of discounting ²) % 72.8 71.2Expense ratio ²) % 11.8 16.6Combined ratio, excl. unwinding of discounting % 84.6 87.8Average number of staff 6,162 6,170
Life insurancePremiums written before reinsurers' share EURm 843 777Profit before taxes EURm 132 112Return on equity (at current value) % 5.3 10.8Expense ratio % 99.4 102.4Average number of staff 521 521
HoldingProfit before taxes EURm 589 491Average number of staff 56 54
Per share key figuresEarnings per share EUR 2.31 2.05Earnings per share, incl. other comprehensive income EUR 1.84 1.96Capital and reserves per share EUR 19.42 19.37Net asset value per share EUR 22.77 23.29Adjusted share price, high EUR 49.40 38.90Adjusted share price, low EUR 37.72 33.71Market capitalisation EURm 24,237 21,504
¹) The Group solvency is calculated according to the consolidation method defined in Chapter 3 of the Act on the Supervision of Financial and Insurance Conglomerates (2004/699).
²) The key figures for P&C Insurance are based on activity based costs and cannot, therefore, be calculated directly from the consolidated income statement. The result analysis of P&C insurance is presented in note 16.
The number of shares used at the balance sheet date and as the average number during the financial period was 560,000,000.
The valuation differences on investment property have been taken into account in calculating the return on assets, return on equity, equity/assets ratio and net asset value per share. The tax component includes the tax corresponding to the result for the period, and the deferred tax liability related to valuation differences on investment property.
The total comprehensive income has been used in the calculation of the return on assets and return on equity.
The key figures for the insurance business have been calculated in accordance with the decree issued by the Ministry of Finance and the specifying regulations and instructions of the Finance Supervisory Authority.
Tables 30.9.2015

INTERIM REPORT JANUARY – SEPTEMBER 2015
22
Calculation of key figures
Return on equity (fair values), % + total comprehensive income
valuation differences on investments less deferred tax x 100 %
+ total equity valuation differences on investments less deferred tax
(average of values 1 Jan. and the end of reporting period)
Return on assets (at fair values), % + operating profit
other comprehensive income before taxes+ interest and other financial expense + calculated interest on technical provisions
change in valuation differences on investments x 100 %
+ balance sheet, total – technical provisions relating to unit-linked insurance
valuation differences on investments (average of values on 1 Jan. and the end of the reporting period)
Equity/assets ratio (at fair values), % + total equity
valuation differences on investments after deduction of deferred tax x 100 %+ balance sheet total
valuation differences on investments
Risk ratio for P&C insurance, % + claims incurred – claims settlement expenses
x 100 %
insurance premiums earned
Cost ratio for P&C insurance, % + operating expenses + claims settlement expenses
x 100 % insurance premiums earned
Loss ratio for P&C insurance, % claims incurred
x 100 % insurance premiums earned
Expense ratio for P&C insurance, % operating expenses
x 100 % insurance premiums earned
Combined ratio for P&C insurance, % Loss ratio + expense ratio
Expense ratio for life insurance, % + operating expenses before change in deferred acquisition costs + claims settlement expenses x 100 % expense charges

INTERIM REPORT JANUARY – SEPTEMBER 2015
23
Per share key figures
Earnings per share profit for the financial period attributable to the parent company’s equity holders adjusted average number of shares
Equity per share equity attributable to the parent company’s equity holders adjusted number of shares at the balance sheet date
Net asset value per share+ equity attributable to the parent company’s equity holders valuation differences on listed associates in the Group valuation differences after the deduction of deferred taxes
adjusted number of shares at balance sheet date
Market capitalisation number of shares at the balance sheet date x closing share price at the balance sheet date
INTERIM REPORT JANUARY – SEPTEMBER 2015
24
Group quarterly comprehensive income statement
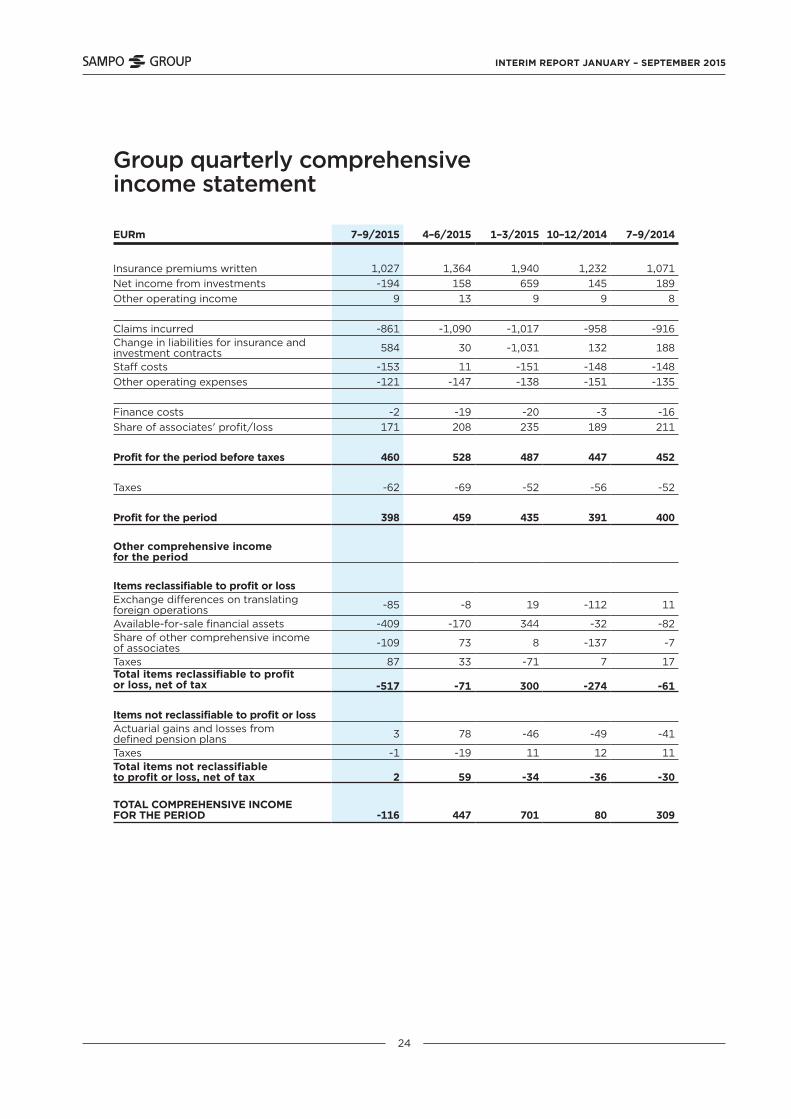
EURm 7–9/2015 4–6/2015 1–3/2015 10–12/2014 7–9/2014
Insurance premiums written 1,027 1,364 1,940 1,232 1,071Net income from investments -194 158 659 145 189Other operating income 9 13 9 9 8
Claims incurred -861 -1,090 -1,017 -958 -916Change in liabilities for insurance and investment contracts 584 30 -1,031 132 188
Staff costs -153 11 -151 -148 -148Other operating expenses -121 -147 -138 -151 -135
Finance costs -2 -19 -20 -3 -16Share of associates' profit/loss 171 208 235 189 211
Profit for the period before taxes 460 528 487 447 452
Taxes -62 -69 -52 -56 -52
Profit for the period 398 459 435 391 400
Other comprehensive income for the period
Items reclassifiable to profit or lossExchange differences on translating foreign operations -85 -8 19 -112 11
Available-for-sale financial assets -409 -170 344 -32 -82Share of other comprehensive income of associates -109 73 8 -137 -7
Taxes 87 33 -71 7 17Total items reclassifiable to profit or loss, net of tax -517 -71 300 -274 -61
Items not reclassifiable to profit or lossActuarial gains and losses from defined pension plans 3 78 -46 -49 -41
Taxes -1 -19 11 12 11Total items not reclassifiable to profit or loss, net of tax 2 59 -34 -36 -30
TOTAL COMPREHENSIVE INCOME FOR THE PERIOD -116 447 701 80 309

INTERIM REPORT JANUARY – SEPTEMBER 2015
25
Statement of profit and other comprehensive income, IFRS
EURm Note 1–9/2015 1–9/2014
Insurance premiums written 1 4,331 4,313
Net income from investments 2 624 753
Other operating income 31 23
Claims incurred 3 -2,968 -2,812
Change in liabilities for insurance and investment contracts -418 -621
Staff costs 4 -292 -455
Other operating expenses -406 -408
Finance costs -41 -26
Share of associates' profit/loss 614 546
Profit before taxes 1,475 1,313
Taxes -183 -164
Profit for the period 1,292 1,149
Other comprehensive income for the period
Items reclassifiable to profit or lossExchange differences -73 -61
Available-for-sale financial assets -235 103
Share of other comprehensive income of associates -29 -31
Taxes 48 -22
Total items reclassifiable to profit or loss, net of tax -288 -11
Items not reclassifiable to profit or lossActuarial gains and losses from defined pension plans 35 -53
Taxes -8 13
Total items not reclassifiable to profit or loss, net of tax 26 -39
TOTAL COMPREHENSIVE INCOME FOR THE PERIOD 1,031 1,099
Basic earnings per share (eur) 2.31 2.05

INTERIM REPORT JANUARY – SEPTEMBER 2015
26
Consolidated balance sheet, IFRS
EURm Note 9/2015 12/2014
Assets
Property, plant and equipment 26 24
Investment property 211 195
Intangible assets 5 712 715
Investments in associates 7,477 7,447
Financial assets6, 7, 8, 9, 10
17,002 16,930
Investments related to unit-linked insurance contracts 11 5,554 5,259
Tax assets 35 86
Reinsurers' share of insurance liabilities 278 240
Other assets 1,797 1,781
Cash and cash equivalents 1,819 2,074
Total assets 34,911 34,750
Liabilities
Liabilities for insurance and investment contracts 12 14,624 14,248Liabilities for unit-linked insurance and investment contracts
13 5,553 5,289
Financial liabilities 14 2,347 2,423
Tax liabilities 467 504
Provisions 52 63
Employee benefits 70 265
Other liabilities 922 1,035
Total liabilities 24,035 23,827
Equity
Share capital 98 98
Reserves 1,531 1,531
Retained earnings 8,911 8,655
Other components of equity 336 639
Total equity 10,876 10,924
Total equity and liabilities 34,911 34,750

INTERIM REPORT JANUARY – SEPTEMBER 2015
27
Statement of changes in equity, IFRS
EURmShare
capital
Share premium
accountLegal
reserve
Invested un-
restricted equity
Retained earnings
1)
Translation of
foreign operations
2)
Available- for-sale
financial assets
3)Cash flow
hedges Total
Equity at 1 Jan. 2014 98 0 4 1,527 8,175 -106 976 -30 10,643
Changes in equityRecognition of undrawn dividends 8 8
Dividends -924 -924Share of associate’s other changes in equity 18 18
Profit for the period 1,149 1,149Other comprehensive income for the period -99 -44 93 - -50
Equity at 30 September 2014 98 0 4 1,527 8,327 -150 1,069 -30 10,845
Equity at 1 Jan. 2015 98 0 4 1,527 8,655 -370 1,039 -30 10,924
Changes in equityRecognition of undrawn dividends 8 8
Dividends -1,092 -1,092Share of associate’s other changes in equity 6 6
Profit for the period 1,292 1,292
Other comprehensive income for the period 41 -95 -208 - -262
Equity at 30 September 2015 98 0 4 1,527 8,911 -465 832 -30 10,876
1) IAS 19 Pension benefits had a net effect of EURm 41 (-99) on retained earnings.2) The total comprehensive income includes also the share of the associate Nordea’s other comprehensive income, in accordance with the Group’s share holding. The retained earnings thus include EURm 15 (-60) of Nordea’s actuarial gains/losses from defined pension plans. The exchange differences include the share of Nordea’s exchange differences EURm -22 (17). Respectively, available-for-sale financial assets include EURm -21 (11) of Nordea’s valuation differences.3) The amount recognised in equity from available-for-sale financial assets for the period totalled EURm 103 (176). The amount transferred to p/l amounted to EURm -286 (-95). EURm 4 was transferred to the Segregated Suomi portfolio.
The amount included in the translation, available-for-sale, cash flow hedge reserves and defined benefit plans represent other comprehensive income for each component, net of tax.
INTERIM REPORT JANUARY – SEPTEMBER 2015
28
Statement of cash flows, IFRS
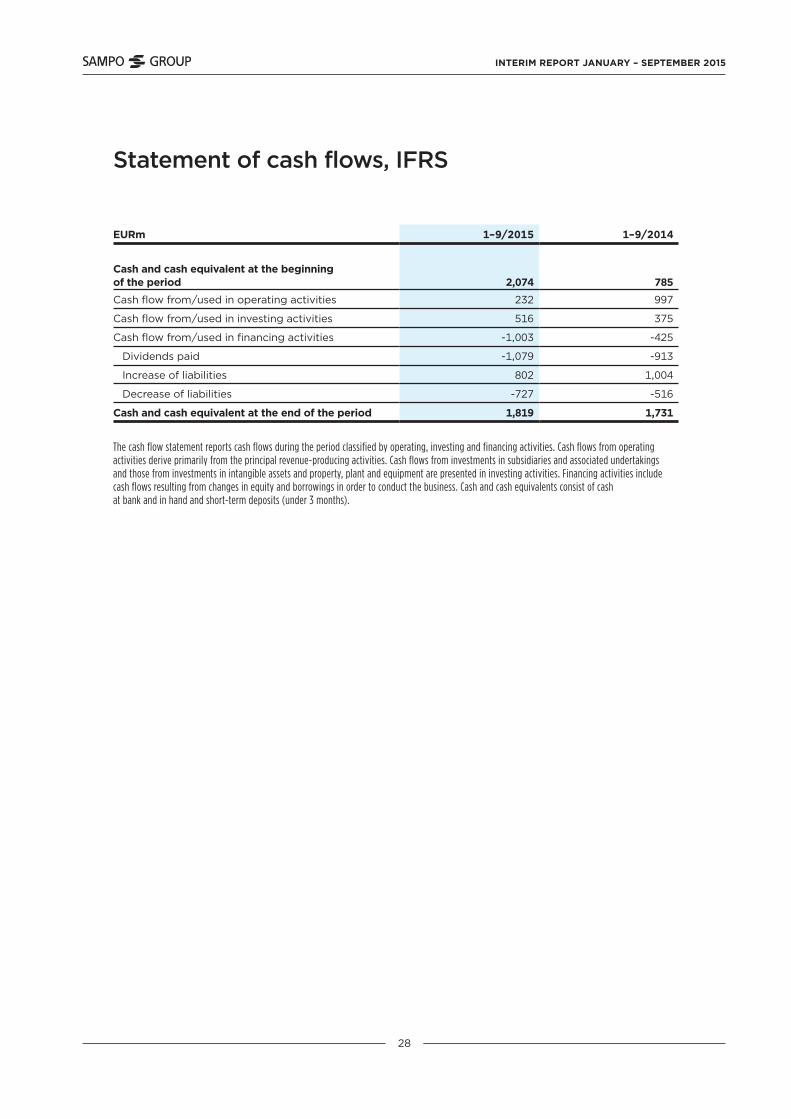
EURm 1–9/2015 1–9/2014
Cash and cash equivalent at the beginning of the period 2,074 785Cash flow from/used in operating activities 232 997
Cash flow from/used in investing activities 516 375
Cash flow from/used in financing activities -1,003 -425
Dividends paid -1,079 -913
Increase of liabilities 802 1,004
Decrease of liabilities -727 -516
Cash and cash equivalent at the end of the period 1,819 1,731
The cash flow statement reports cash flows during the period classified by operating, investing and financing activities. Cash flows from operating activities derive primarily from the principal revenue-producing activities. Cash flows from investments in subsidiaries and associated undertakings and those from investments in intangible assets and property, plant and equipment are presented in investing activities. Financing activities include cash flows resulting from changes in equity and borrowings in order to conduct the business. Cash and cash equivalents consist of cash at bank and in hand and short-term deposits (under 3 months).
INTERIM REPORT JANUARY – SEPTEMBER 2015
29
Notes
Accounting policies Sampo Group’s consolidated financial statements are prepared in accordance with the International Financial Reporting Standards (IFRS) adopted by the EU. The interim financial statements are presented in accordance with IAS 34 Interim Financial Reporting. In preparing the interim financial statements, the same accounting policies and methods of computation are applied as in the financial statements for 2014.
Sampo adopted new or revised standards and interpretations at the beginning of the year 2015. These standards and interpretations are explained in Sampos accounting policies for the financial year 2014. The financial statements are available at www.sampo.com/annualreport.
Accounting policies

INTERIM REPORT JANUARY – SEPTEMBER 2015
30
Comprehensive income statement by segment for nine months ended 30 September 2015
EURm P&C insurance Life insurance Holding Elimination Group
Insurance premius written 3,493 838 - - 4,331Net income from investments 234 340 60 -10 624Other operating income 21 11 12 -13 31
Claims incurred -2,191 -777 - - -2,968Change in liabilities for insurance and investment contracts -227 -185 - -6 -418
Staff costs -243 -35 -14 - -292Other operating expenses -356 -54 -9 13 -406
Finance costs -12 -5 -38 14 -41Share of associates' profit/loss 36 0 577 - 614
Profit before taxes 756 132 589 -2 1,475
Taxes -157 -24 -2 0 -183
Profit for the period 599 108 588 -2 1,292
Other comprehensive income for the period
Items reclassifiable to profit or lossExchange differences -73 - - - -73Available-for-sale financial assets -150 -72 -21 8 -235Share of other comprehensive income of associates
- - -29 - -29
Taxes 32 14 4 -2 48Total items reclassifiable to profit or loss, net of tax -191 -58 -45 6 -288
Items not reclassifiable to profit or lossActuarial gains and losses from defined pension plans 35 - - - 35
Taxes -8 - - - -8Total items not reclassifiable to profit or loss, net of tax 26 - - - 26
TOTAL COMPREHENSIVE INCOME FOR THE PERIOD 434 50 543 4 1,031
INTERIM REPORT JANUARY – SEPTEMBER 2015
31
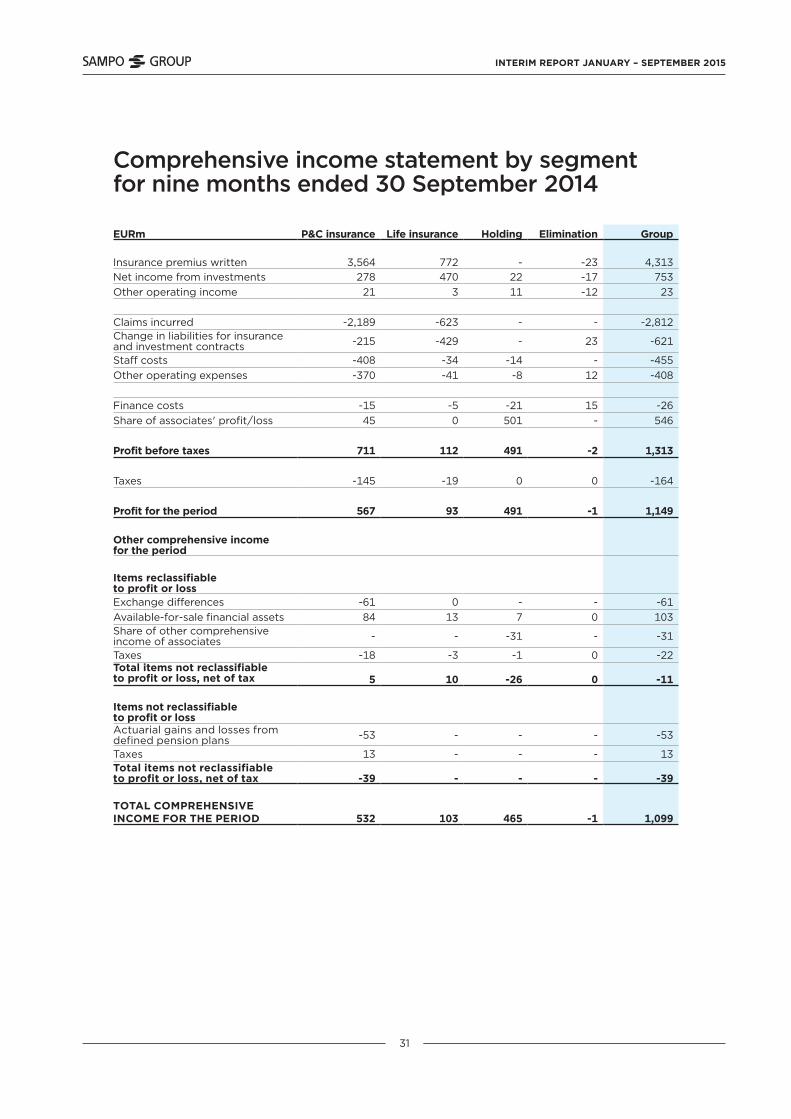
Comprehensive income statement by segment for nine months ended 30 September 2014 EURm P&C insurance Life insurance Holding Elimination Group
Insurance premius written 3,564 772 - -23 4,313Net income from investments 278 470 22 -17 753Other operating income 21 3 11 -12 23
Claims incurred -2,189 -623 - - -2,812Change in liabilities for insurance and investment contracts -215 -429 - 23 -621
Staff costs -408 -34 -14 - -455Other operating expenses -370 -41 -8 12 -408
Finance costs -15 -5 -21 15 -26Share of associates' profit/loss 45 0 501 - 546
Profit before taxes 711 112 491 -2 1,313
Taxes -145 -19 0 0 -164
Profit for the period 567 93 491 -1 1,149
Other comprehensive income for the period
Items reclassifiable to profit or lossExchange differences -61 0 - - -61Available-for-sale financial assets 84 13 7 0 103Share of other comprehensive income of associates - - -31 - -31
Taxes -18 -3 -1 0 -22Total items not reclassifiable to profit or loss, net of tax 5 10 -26 0 -11
Items not reclassifiable to profit or lossActuarial gains and losses from defined pension plans -53 - - - -53
Taxes 13 - - - 13Total items not reclassifiable to profit or loss, net of tax -39 - - - -39
TOTAL COMPREHENSIVE INCOME FOR THE PERIOD 532 103 465 -1 1,099
INTERIM REPORT JANUARY – SEPTEMBER 2015
32
Consolidated balance sheet by segment at 30 September 2015
EURmP&C
insuranceLife
insurance Holding Elimination Group
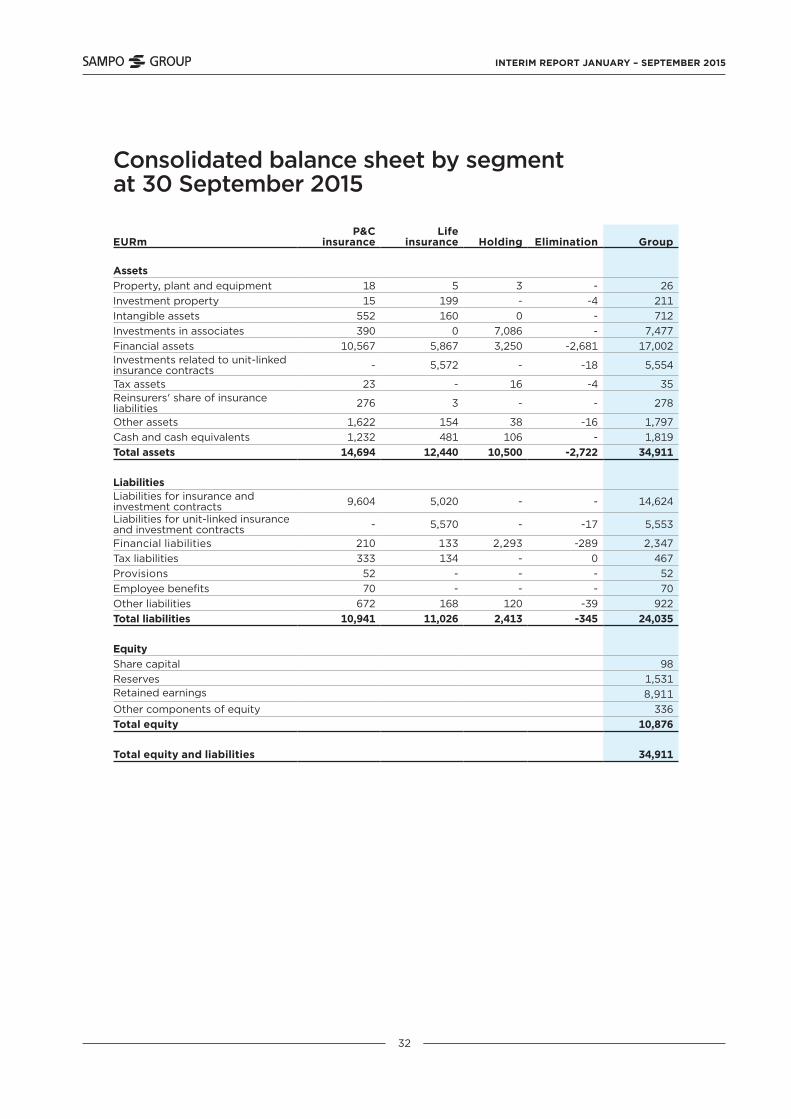
AssetsProperty, plant and equipment 18 5 3 - 26Investment property 15 199 - -4 211Intangible assets 552 160 0 - 712Investments in associates 390 0 7,086 - 7,477Financial assets 10,567 5,867 3,250 -2,681 17,002Investments related to unit-linked insurance contracts - 5,572 - -18 5,554
Tax assets 23 - 16 -4 35Reinsurers' share of insurance liabilities 276 3 - - 278
Other assets 1,622 154 38 -16 1,797Cash and cash equivalents 1,232 481 106 - 1,819Total assets 14,694 12,440 10,500 -2,722 34,911
LiabilitiesLiabilities for insurance and investment contracts 9,604 5,020 - - 14,624
Liabilities for unit-linked insurance and investment contracts - 5,570 - -17 5,553
Financial liabilities 210 133 2,293 -289 2,347Tax liabilities 333 134 - 0 467Provisions 52 - - - 52Employee benefits 70 - - - 70Other liabilities 672 168 120 -39 922Total liabilities 10,941 11,026 2,413 -345 24,035
EquityShare capital 98Reserves 1,531Retained earnings 8,911Other components of equity 336Total equity 10,876
Total equity and liabilities 34,911
INTERIM REPORT JANUARY – SEPTEMBER 2015
33
Consolidated balance sheet by segment at 31 December 2014
EURmP&C
insuranceLife
insurance Holding Elimination Group
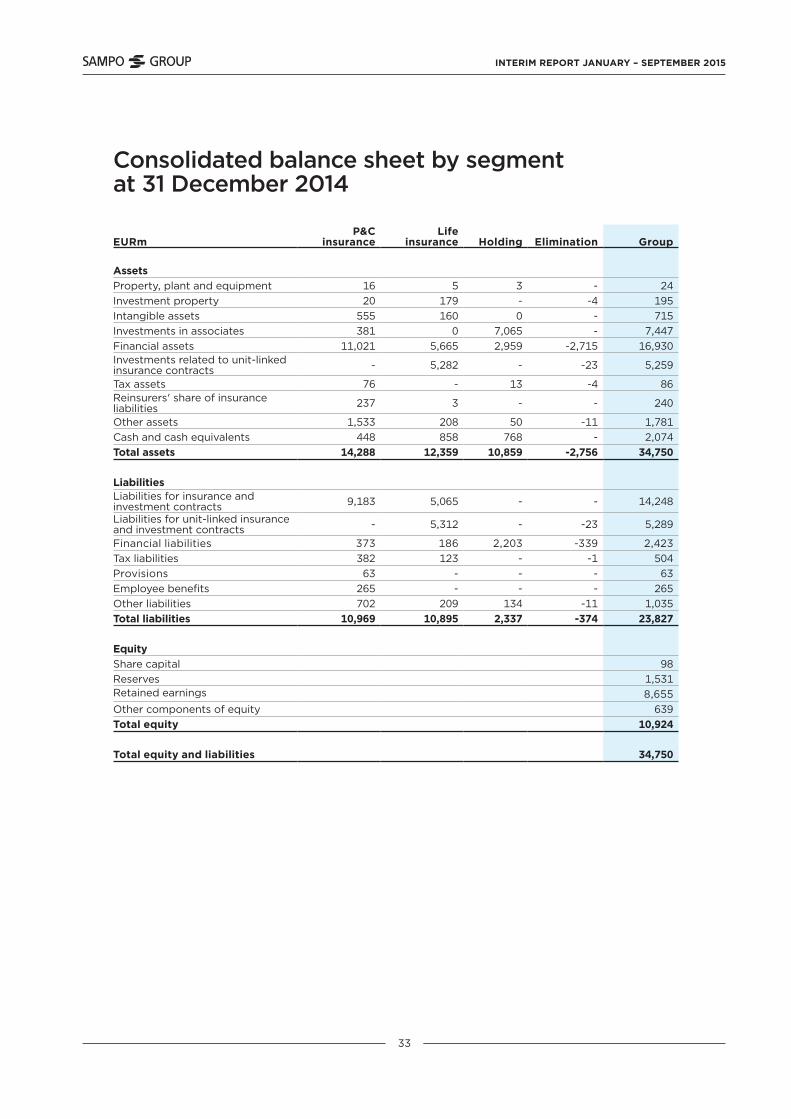
AssetsProperty, plant and equipment 16 5 3 - 24Investment property 20 179 - -4 195Intangible assets 555 160 0 - 715Investments in associates 381 0 7,065 - 7,447Financial assets 11,021 5,665 2,959 -2,715 16,930Investments related to unit-linked insurance contracts - 5,282 - -23 5,259
Tax assets 76 - 13 -4 86Reinsurers' share of insurance liabilities 237 3 - - 240
Other assets 1,533 208 50 -11 1,781Cash and cash equivalents 448 858 768 - 2,074Total assets 14,288 12,359 10,859 -2,756 34,750
LiabilitiesLiabilities for insurance and investment contracts 9,183 5,065 - - 14,248
Liabilities for unit-linked insurance and investment contracts - 5,312 - -23 5,289
Financial liabilities 373 186 2,203 -339 2,423Tax liabilities 382 123 - -1 504Provisions 63 - - - 63Employee benefits 265 - - - 265Other liabilities 702 209 134 -11 1,035Total liabilities 10,969 10,895 2,337 -374 23,827
EquityShare capital 98Reserves 1,531Retained earnings 8,655Other components of equity 639Total equity 10,924
Total equity and liabilities 34,750
INTERIM REPORT JANUARY – SEPTEMBER 2015
34
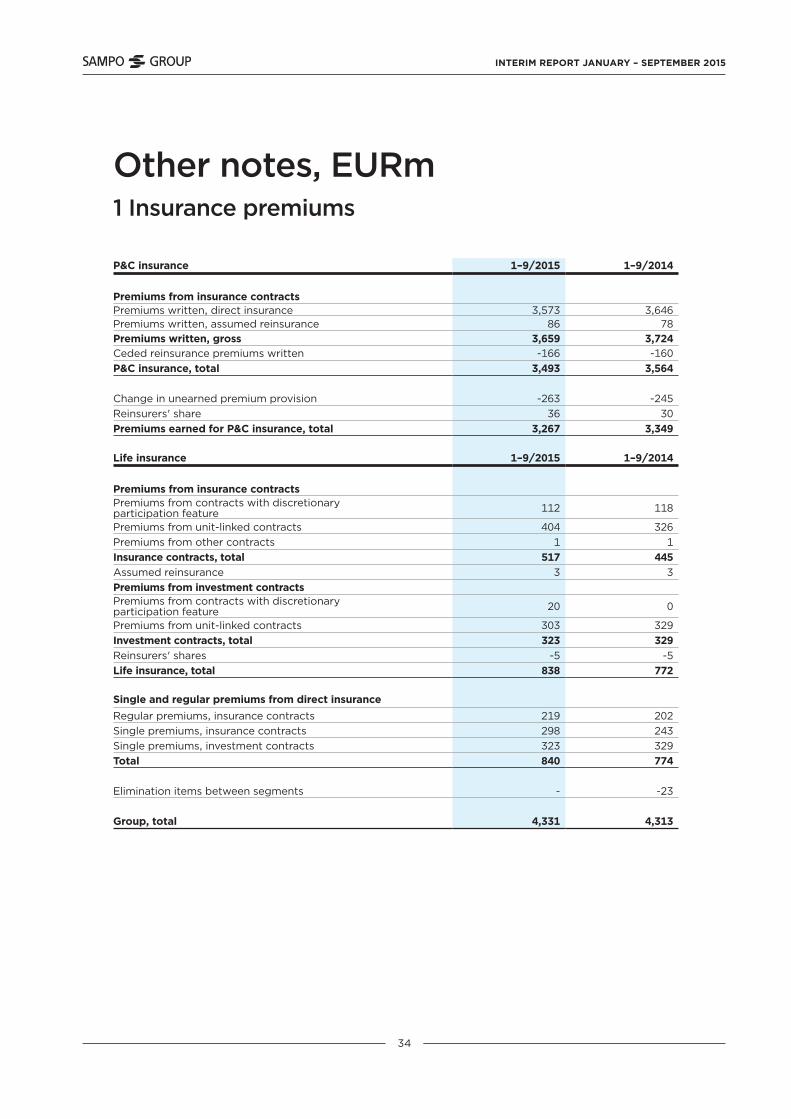
Other notes, EURm1 Insurance premiums
P&C insurance 1–9/2015 1–9/2014
Premiums from insurance contractsPremiums written, direct insurance 3,573 3,646Premiums written, assumed reinsurance 86 78Premiums written, gross 3,659 3,724Ceded reinsurance premiums written -166 -160P&C insurance, total 3,493 3,564
Change in unearned premium provision -263 -245Reinsurers' share 36 30Premiums earned for P&C insurance, total 3,267 3,349
Life insurance 1–9/2015 1–9/2014
Premiums from insurance contractsPremiums from contracts with discretionary participation feature 112 118
Premiums from unit-linked contracts 404 326Premiums from other contracts 1 1Insurance contracts, total 517 445Assumed reinsurance 3 3Premiums from investment contractsPremiums from contracts with discretionary participation feature 20 0
Premiums from unit-linked contracts 303 329Investment contracts, total 323 329Reinsurers' shares -5 -5Life insurance, total 838 772
Single and regular premiums from direct insuranceRegular premiums, insurance contracts 219 202Single premiums, insurance contracts 298 243Single premiums, investment contracts 323 329Total 840 774
Elimination items between segments - -23
Group, total 4,331 4,313

INTERIM REPORT JANUARY – SEPTEMBER 2015
35
2 Net income from investments >
P&C Insurance 1–9/2015 1–9/2014
Financial assetsDerivative financial instruments -7 -20
Loans and receivables 13 16
Financial asset available-for-sale Debt securities 149 197 Equity securities 122 132Total 271 329
Total financial assets 278 326
Fee and commission expense -12 -10
Expense on other than financial liabilities -4 -3
Effect of discounting annuities -28 -34
P&C insurance, total 234 278

INTERIM REPORT JANUARY – SEPTEMBER 2015
36
> 2 Net income from investments >
Life insurance 1–9/2015 1–9/2014
Financial assetsDerivative financial instruments -63 -55
Financial assets designated as at fair value through p/l Debt securities 1 2 Equity securities 0 0Total 1 2
Investments related to unit-linked contracts Debt securities 6 88 Equity securities 31 203 Loans and receivables 1 4 Other financial assets -15 -38Total 23 257
Loans and receivables 26 7
Financial asset available-for-sale Debt securities 91 117 Equity securities 248 126Total 339 243
Total income from financial assets 326 454
Other assets 5 6
Fee and commission income, net 9 10
Life insurance, total 340 470
INTERIM REPORT JANUARY – SEPTEMBER 2015
37
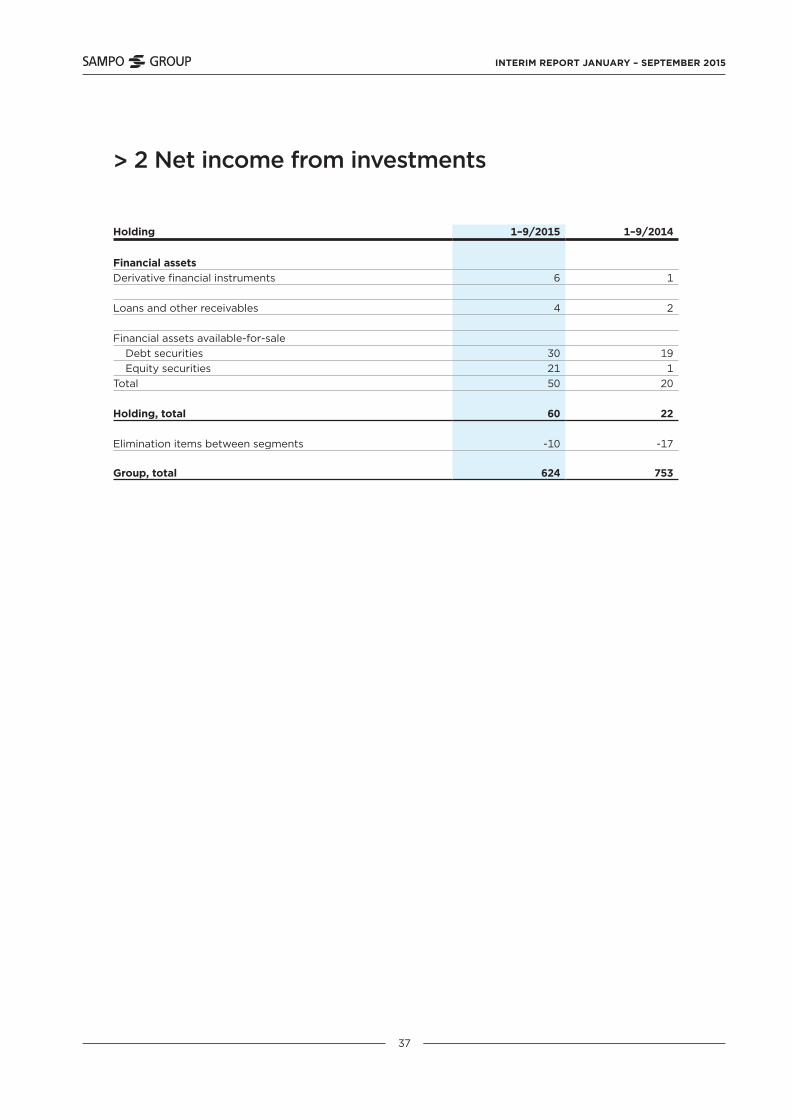
> 2 Net income from investments
Holding 1–9/2015 1–9/2014
Financial assetsDerivative financial instruments 6 1
Loans and other receivables 4 2
Financial assets available-for-sale Debt securities 30 19 Equity securities 21 1Total 50 20
Holding, total 60 22
Elimination items between segments -10 -17
Group, total 624 753
INTERIM REPORT JANUARY – SEPTEMBER 2015
38
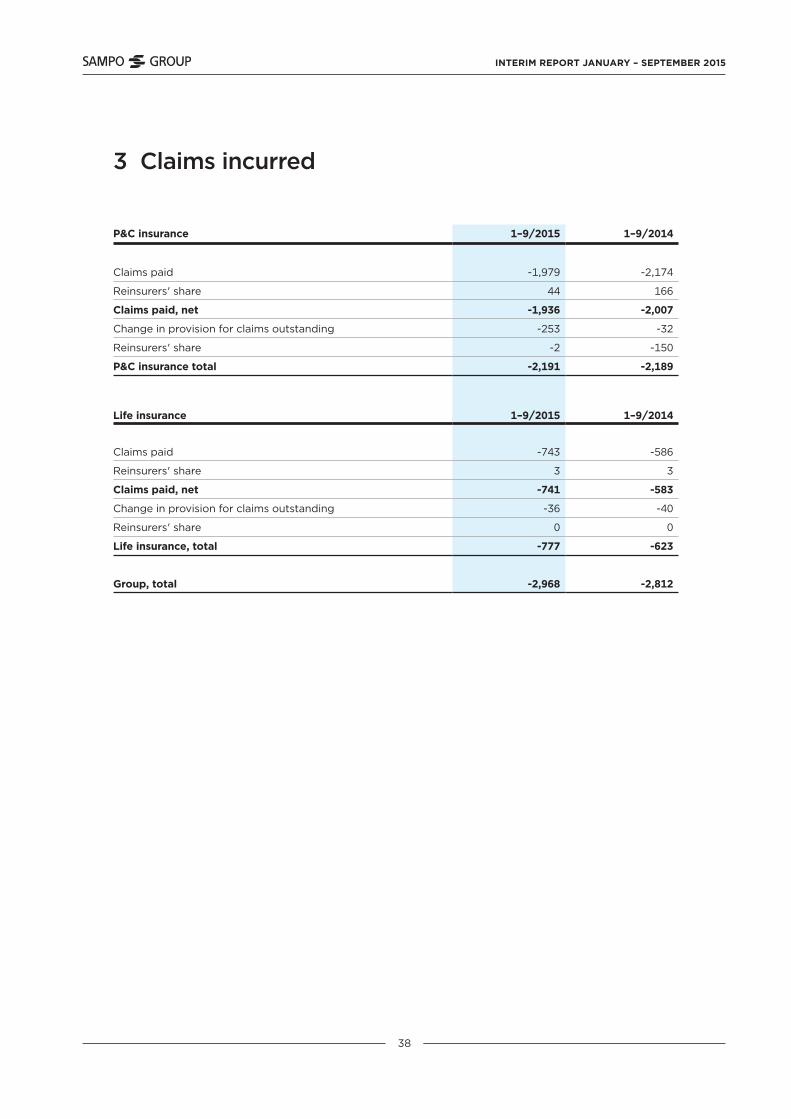
3 Claims incurred
P&C insurance 1–9/2015 1–9/2014
Claims paid -1,979 -2,174
Reinsurers' share 44 166
Claims paid, net -1,936 -2,007
Change in provision for claims outstanding -253 -32
Reinsurers' share -2 -150
P&C insurance total -2,191 -2,189
Life insurance 1–9/2015 1–9/2014
Claims paid -743 -586
Reinsurers' share 3 3
Claims paid, net -741 -583
Change in provision for claims outstanding -36 -40
Reinsurers' share 0 0
Life insurance, total -777 -623
Group, total -2,968 -2,812
INTERIM REPORT JANUARY – SEPTEMBER 2015
39
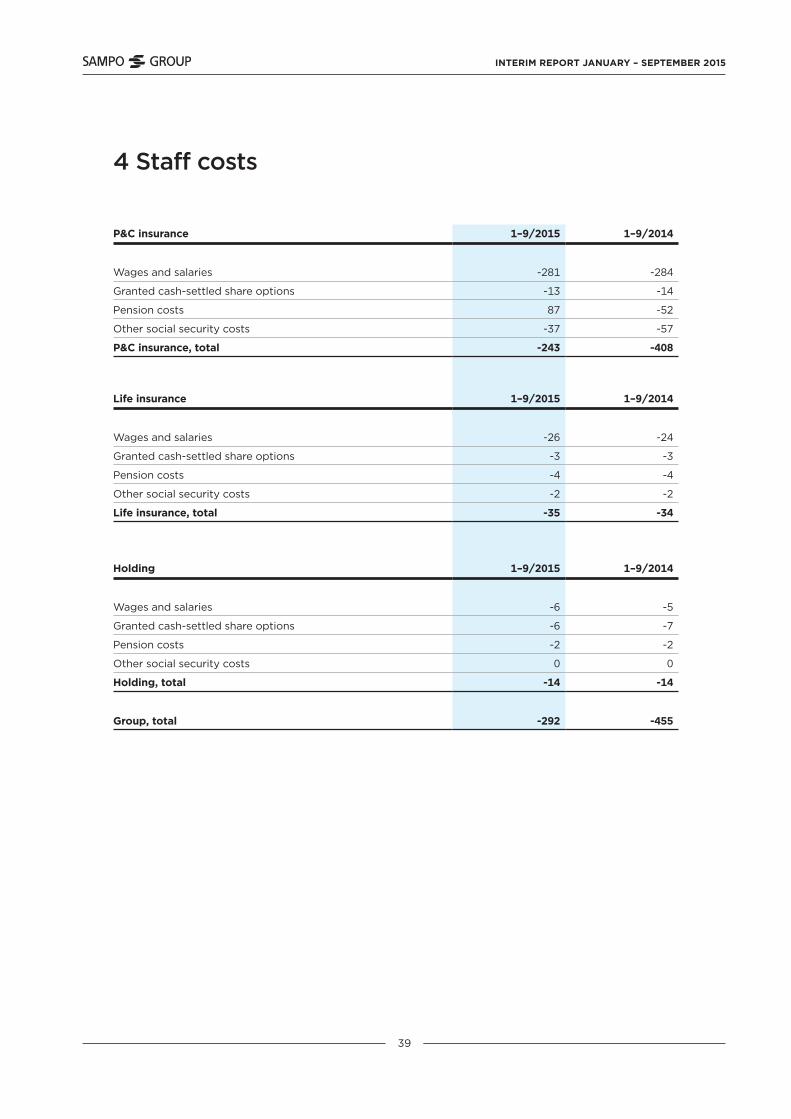
4 Staff costs
P&C insurance 1–9/2015 1–9/2014
Wages and salaries -281 -284
Granted cash-settled share options -13 -14
Pension costs 87 -52
Other social security costs -37 -57
P&C insurance, total -243 -408
Life insurance 1–9/2015 1–9/2014
Wages and salaries -26 -24
Granted cash-settled share options -3 -3
Pension costs -4 -4
Other social security costs -2 -2
Life insurance, total -35 -34
Holding 1–9/2015 1–9/2014
Wages and salaries -6 -5
Granted cash-settled share options -6 -7
Pension costs -2 -2
Other social security costs 0 0
Holding, total -14 -14
Group, total -292 -455
INTERIM REPORT JANUARY – SEPTEMBER 2015
40
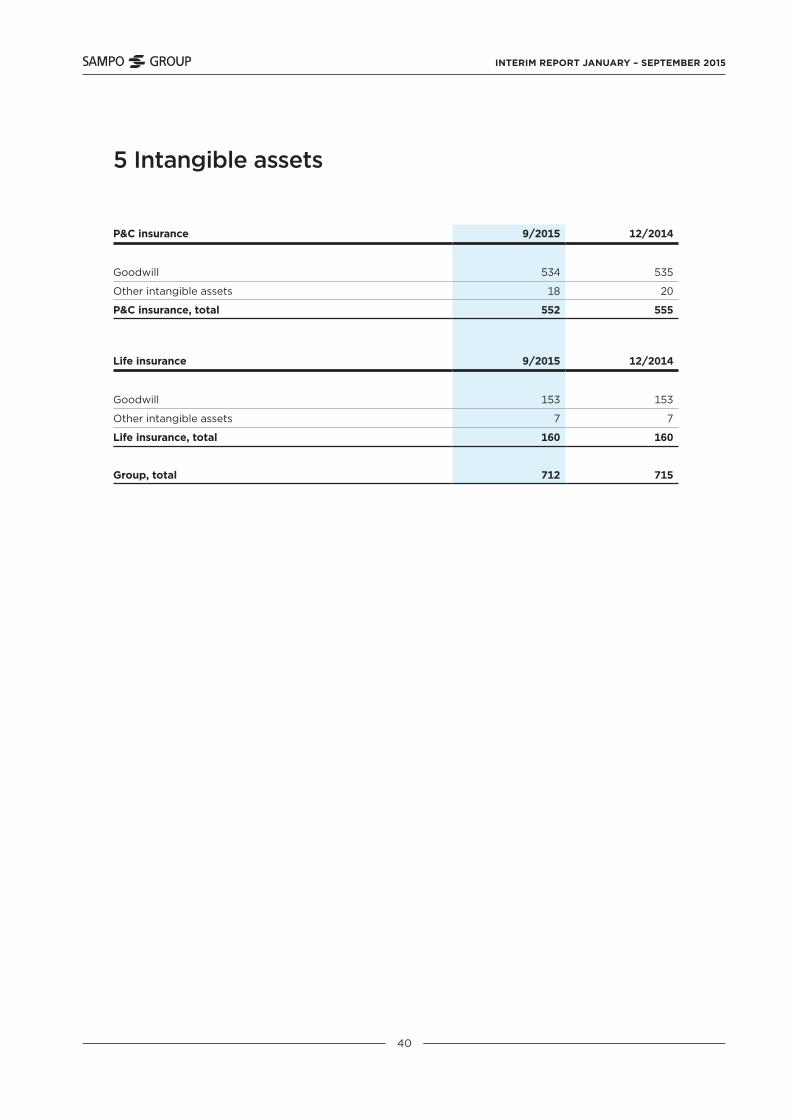
5 Intangible assets
P&C insurance 9/2015 12/2014
Goodwill 534 535
Other intangible assets 18 20
P&C insurance, total 552 555
Life insurance 9/2015 12/2014
Goodwill 153 153
Other intangible assets 7 7
Life insurance, total 160 160
Group, total 712 715

INTERIM REPORT JANUARY – SEPTEMBER 2015
41
6 Financial assets >
P&C insurance 9/2015 12/2014
Derivative financial instruments (Note 7) 42 42
Loans and receivables
Loans 245 237
Deposits with ceding undertakings 1 1
Total 245 238
Financial assets available-for-sale
Debt securities 8,855 9,188
Equity securities 1,424 1,553
Total 10,280 10,741
P&C insurance, total 10,567 11,021
Life insurance 9/2015 12/2014
Derivative financial instruments (Note 7) 19 3
Financial assets designated as at fair value through p/l
Debt securities 47 47
Equity securities 2 2
Total 48 48
Loans and receivables
Loans 25 27
Financial assets available-for-sale
Debt securities 3,319 2,895
Equity securities *) 2,455 2,691
Total 5,774 5,587
Life insurance, total 5,867 5,665
*) of which investments in fixed income funds 113 92
INTERIM REPORT JANUARY – SEPTEMBER 2015
42
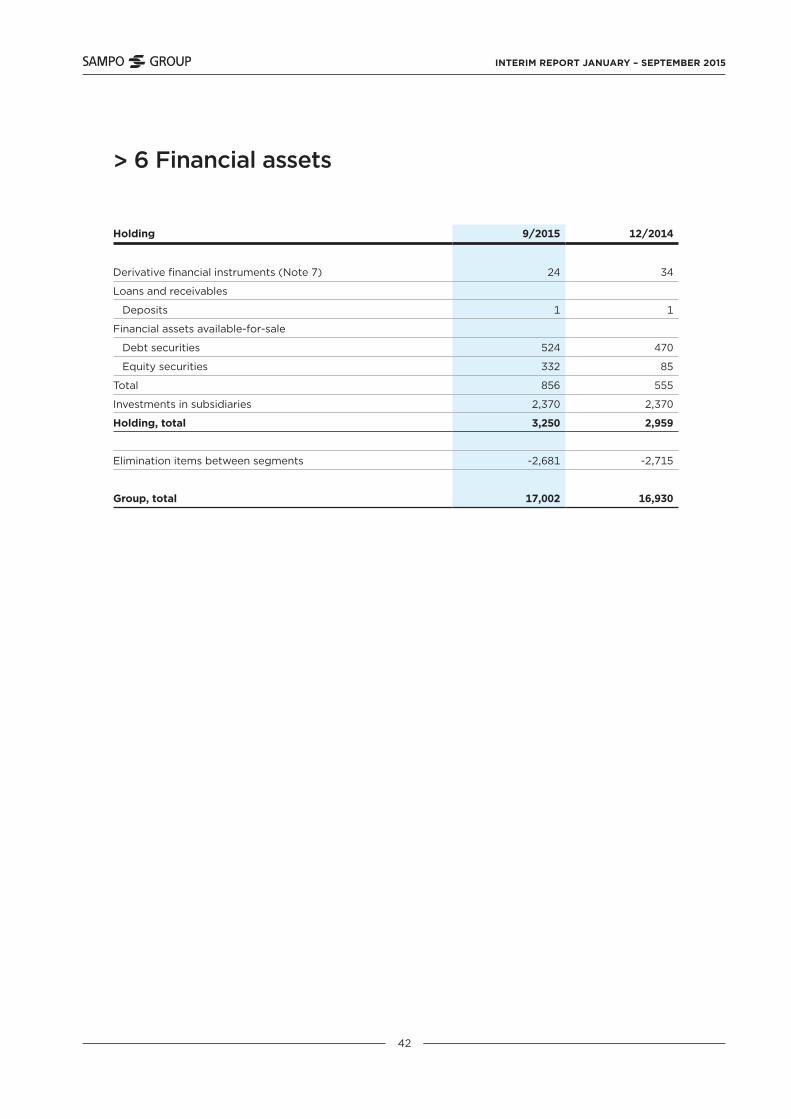
> 6 Financial assets
Holding 9/2015 12/2014
Derivative financial instruments (Note 7) 24 34
Loans and receivables
Deposits 1 1
Financial assets available-for-sale
Debt securities 524 470
Equity securities 332 85
Total 856 555
Investments in subsidiaries 2,370 2,370
Holding, total 3,250 2,959
Elimination items between segments -2,681 -2,715
Group, total 17,002 16,930
INTERIM REPORT JANUARY – SEPTEMBER 2015
43
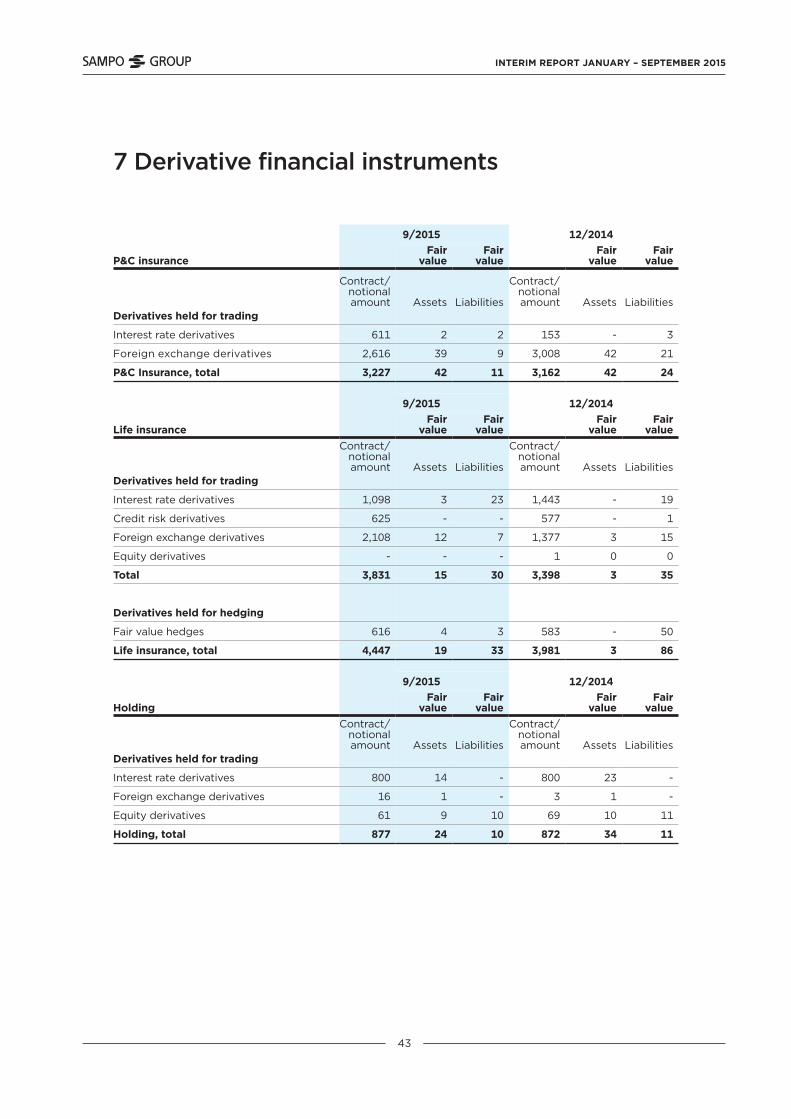
7 Derivative financial instruments
9/2015 12/2014
P&C insuranceFair
valueFair
valueFair
valueFair
value
Contract/ notional amount Assets Liabilities
Contract/ notional amount Assets Liabilities
Derivatives held for trading
Interest rate derivatives 611 2 2 153 - 3
Foreign exchange derivatives 2,616 39 9 3,008 42 21
P&C Insurance, total 3,227 42 11 3,162 42 24
9/2015 12/2014
Life insuranceFair
valueFair
valueFair
valueFair
valueContract/
notional amount Assets Liabilities
Contract/ notional amount Assets Liabilities
Derivatives held for trading
Interest rate derivatives 1,098 3 23 1,443 - 19
Credit risk derivatives 625 - - 577 - 1
Foreign exchange derivatives 2,108 12 7 1,377 3 15
Equity derivatives - - - 1 0 0
Total 3,831 15 30 3,398 3 35
Derivatives held for hedging
Fair value hedges 616 4 3 583 - 50
Life insurance, total 4,447 19 33 3,981 3 86
9/2015 12/2014
HoldingFair
valueFair
valueFair
valueFair
valueContract/
notional amount Assets Liabilities
Contract/ notional amount Assets Liabilities
Derivatives held for trading
Interest rate derivatives 800 14 - 800 23 -
Foreign exchange derivatives 16 1 - 3 1 -
Equity derivatives 61 9 10 69 10 11
Holding, total 877 24 10 872 34 11
INTERIM REPORT JANUARY – SEPTEMBER 2015
44
8 Determination and hierarchy of fair values >
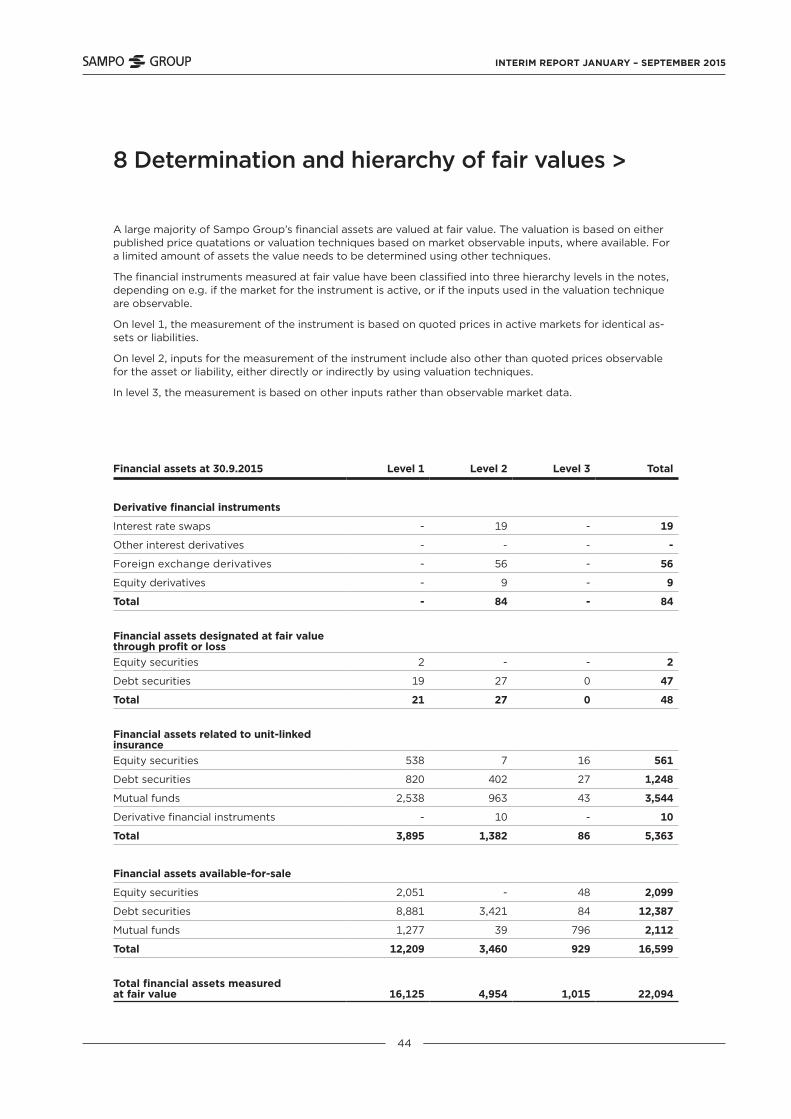
Financial assets at 30.9.2015 Level 1 Level 2 Level 3 Total
Derivative financial instruments
Interest rate swaps - 19 - 19
Other interest derivatives - - - -
Foreign exchange derivatives - 56 - 56
Equity derivatives - 9 - 9
Total - 84 - 84
Financial assets designated at fair value through profit or lossEquity securities 2 - - 2
Debt securities 19 27 0 47
Total 21 27 0 48
Financial assets related to unit-linked insuranceEquity securities 538 7 16 561
Debt securities 820 402 27 1,248
Mutual funds 2,538 963 43 3,544
Derivative financial instruments - 10 - 10
Total 3,895 1,382 86 5,363
Financial assets available-for-sale
Equity securities 2,051 - 48 2,099
Debt securities 8,881 3,421 84 12,387
Mutual funds 1,277 39 796 2,112
Total 12,209 3,460 929 16,599
Total financial assets measured at fair value 16,125 4,954 1,015 22,094
A large majority of Sampo Group’s financial assets are valued at fair value. The valuation is based on either published price quatations or valuation techniques based on market observable inputs, where available. For a limited amount of assets the value needs to be determined using other techniques.
The financial instruments measured at fair value have been classified into three hierarchy levels in the notes, depending on e.g. if the market for the instrument is active, or if the inputs used in the valuation technique are observable.
On level 1, the measurement of the instrument is based on quoted prices in active markets for identical as-sets or liabilities.
On level 2, inputs for the measurement of the instrument include also other than quoted prices observable for the asset or liability, either directly or indirectly by using valuation techniques.
In level 3, the measurement is based on other inputs rather than observable market data.
INTERIM REPORT JANUARY – SEPTEMBER 2015
45
> 8 Determination and hierarchy of fair values >
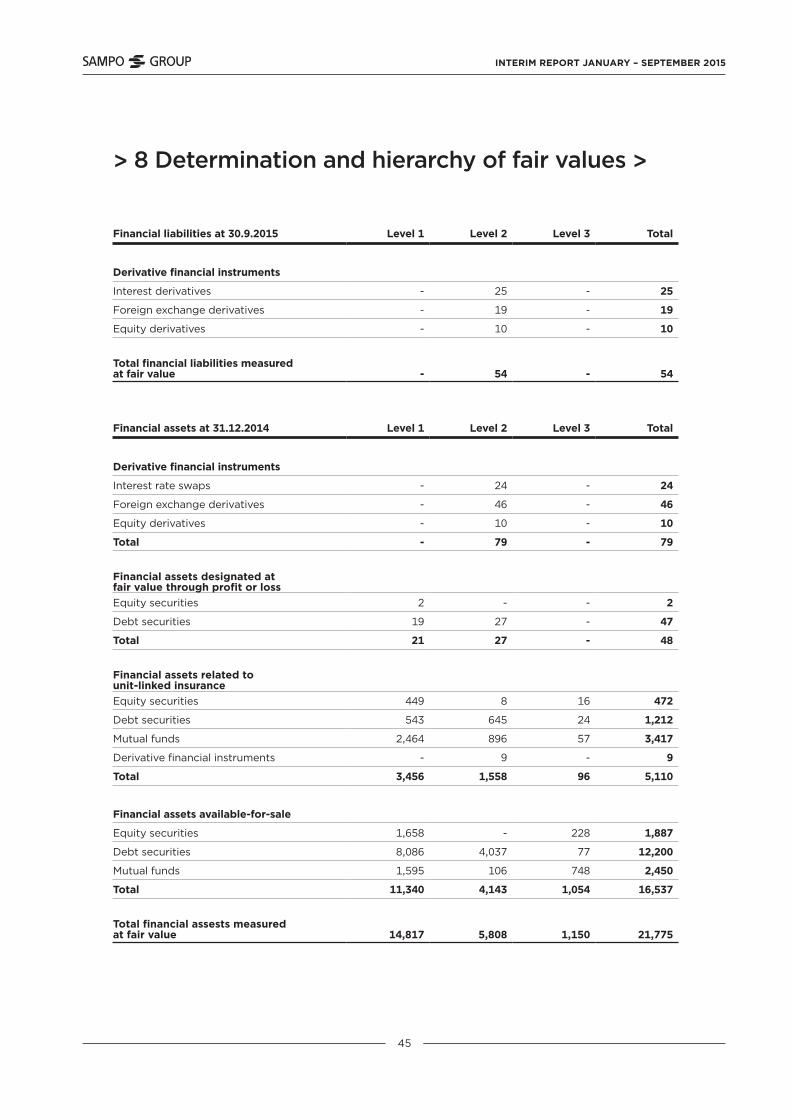
Financial liabilities at 30.9.2015 Level 1 Level 2 Level 3 Total
Derivative financial instruments
Interest derivatives - 25 - 25
Foreign exchange derivatives - 19 - 19
Equity derivatives - 10 - 10
Total financial liabilities measured at fair value - 54 - 54
Financial assets at 31.12.2014 Level 1 Level 2 Level 3 Total
Derivative financial instruments
Interest rate swaps - 24 - 24
Foreign exchange derivatives - 46 - 46
Equity derivatives - 10 - 10
Total - 79 - 79
Financial assets designated at fair value through profit or lossEquity securities 2 - - 2
Debt securities 19 27 - 47
Total 21 27 - 48
Financial assets related to unit-linked insuranceEquity securities 449 8 16 472
Debt securities 543 645 24 1,212
Mutual funds 2,464 896 57 3,417
Derivative financial instruments - 9 - 9
Total 3,456 1,558 96 5,110
Financial assets available-for-sale
Equity securities 1,658 - 228 1,887
Debt securities 8,086 4,037 77 12,200
Mutual funds 1,595 106 748 2,450
Total 11,340 4,143 1,054 16,537
Total financial assests measured at fair value 14,817 5,808 1,150 21,775

INTERIM REPORT JANUARY – SEPTEMBER 2015
46
> 8 Determination and hierarchy of fair values
Financial liabilities at 31.12.2014 Level 1 Level 2 Level 3 Total
Derivative financial instruments
Interest derivatives 2 21 - 23
Foreign exchange derivatives - 87 - 87
Equity derivatives - 11 - 11
Total financial liabilities measured at fair value 2 118 - 120
Transfers between levels 1 and 2
During the last quarter 2014, the Group started to utilise the BVAL Score information for level determination. As a result, there were several classification changes from level 2 to level 1. Correspondingly in 2015, debt securities available-for-sale EURm 277 (5,438) were transferred. Debt securities at fair value through p/l EURm - (19) were equally transferred. Equity securities EURm - (68) and debt securities EURm 324 (368), related to unit-linked insurance, were also transferred to level one. Debt seurities available-for-sale EURm 351 (-) were transferred from level one to level two. Respondingly, debt securities EURm 4 (-) related to unit-linked insurance were transferred.
Sensitivity analysis of fair values
The sensitivity of financial assets and liabilites to changes in exchange rates is assessed on business area level due to different base currencies. In P&C insurance, 10 percentage point depreciation of all other currencies against SEK would result in an effect recognised in profit/loss of EURm 5 (30) and in an effect recognised directly in equity of EURm -3 (-13). In Life insurance, 10 percentage point depreciation of all other currencies against EUR would result in an effect recognised in profit/loss of EURm 17 (35) and in an effect recognised directly in equity of EURm -84 (-94). In Holding, 10 percentage point depreciation of all other currencies against EUR would have no impact in profit/loss, but an effect recognised in equity of EURm -47 (-71). The comparison figures are as of 31 December 2014.
The sensitivity analysis of the Group’s fair values of financial assets and liabilities in differenct market risk scenarios is presented below. The effects represent the instantaneous effects of a one-off change in the underlying market variable on the fair values on 30 September 2015.
The sensitivity analysis includes the effects of derivative positions. All sensitivities are calculated before taxes.
The debt issued by Sampo plc is not included.
Interest rate Equity
Other financial
assets1% parallel shift down
1% parallel shift up
20% fall in prices
20% fall in prices
Effect recognised in profit/loss -60 34 - -4
Effect recognised directly in equity 207 -199 -669 -211
Total effect 147 -165 -669 -215
INTERIM REPORT JANUARY – SEPTEMBER 2015
47
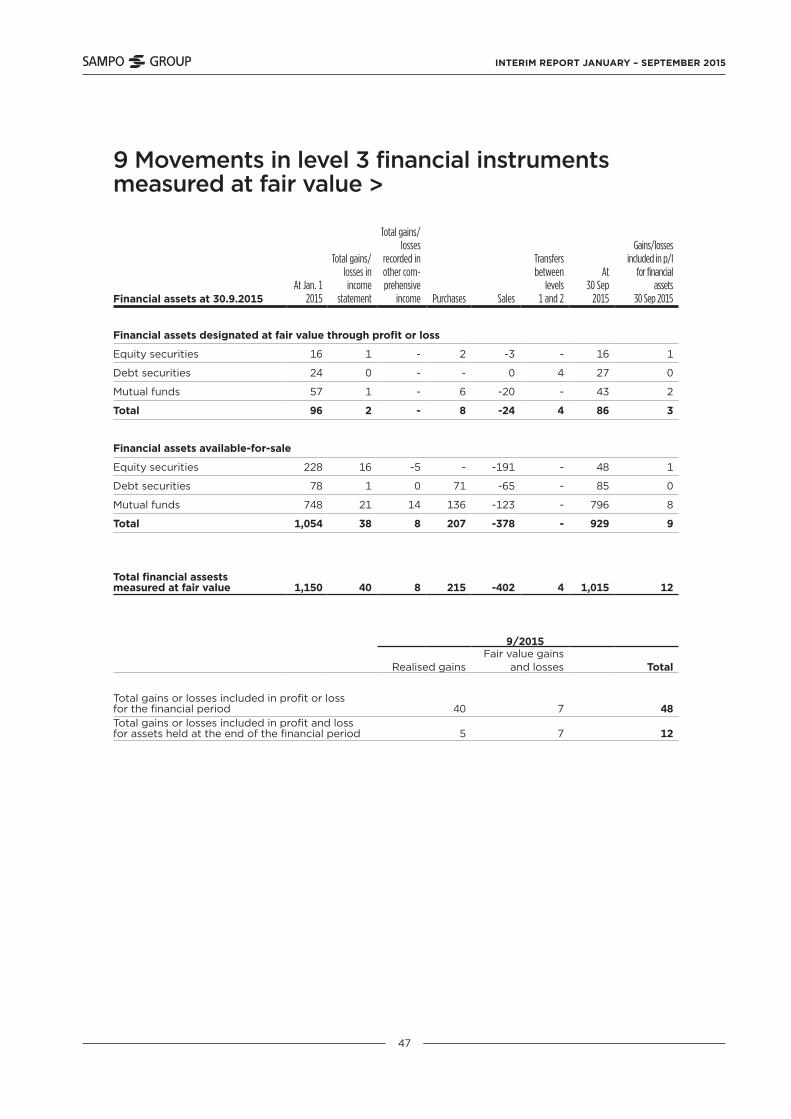
9 Movements in level 3 financial instruments measured at fair value >
Financial assets at 30.9.2015At Jan. 1
2015
Total gains/losses in income
statement
Total gains/losses
recorded in other com-prehensive
income Purchases Sales
Transfers between
levels 1 and 2
At 30 Sep
2015
Gains/losses included in p/l
for financial assets
30 Sep 2015
Financial assets designated at fair value through profit or loss
Equity securities 16 1 - 2 -3 - 16 1
Debt securities 24 0 - - 0 4 27 0
Mutual funds 57 1 - 6 -20 - 43 2
Total 96 2 - 8 -24 4 86 3
Financial assets available-for-sale
Equity securities 228 16 -5 - -191 - 48 1
Debt securities 78 1 0 71 -65 - 85 0
Mutual funds 748 21 14 136 -123 - 796 8
Total 1,054 38 8 207 -378 - 929 9
Total financial assests measured at fair value 1,150 40 8 215 -402 4 1,015 12
9/2015
Realised gainsFair value gains
and losses Total
Total gains or losses included in profit or loss for the financial period 40 7 48Total gains or losses included in profit and loss for assets held at the end of the financial period 5 7 12

INTERIM REPORT JANUARY – SEPTEMBER 2015
48
> 9 Movements in level 3 financial instruments measured at fair value
Financial assets at 31.12.2014At Jan. 1
2014
Total gains/losses in income
statement
Total gains/losses
recorded in other com-prehensive
income Purchases Sales
Transfers between
levels 1 and 2
At 31 Dec
2014
Gains/losses included in p/l
for financial assets
31 Dec 2014
Financial assets designated at fair value through profit or loss
Equity securities 14 2 - 3 -3 - 16 1
Debt securities 19 -1 - 18 -1 -10 24 0
Mutual funds 64 0 - 30 -20 -18 57 1
Total 97 1 - 51 -24 -28 96 2
Financial assets available-for-sale
Equity securities 243 11 1 30 -23 -33 228 -1
Debt securities 39 2 2 10 -6 30 78 2
Mutual funds 720 29 46 215 -262 - 748 62
Total 1,002 42 49 255 -291 -3 1,054 64
Total financial assests measured at fair value 1,099 43 49 306 -316 -31 1,150 66
12/2014
Realised gainsFair value
gains and losses Total
Total gains or losses included in profit or loss for the financial period 43 56 99Total gains or losses included in profit and loss for assets held at the end of the financial period 10 56 66

INTERIM REPORT JANUARY – SEPTEMBER 2015
49
10 Sensitivity analysis of level 3 financial instruments measured at fair value
9/2015 12/2014
Carrying amount
Effect of reasoably
possible alternative
assumptions (+ / -)
Carrying amount
Effect of reasoably
possible alternative
assumptions (+ / -)
Financial assets
Financial assets available-for-sale
Equity securities 48 -10 228 -18
Debt securities 84 -1 77 -4
Mutual Funds 796 -159 748 -148
Total 929 -170 1,054 -170
11 Investments related to unit-linked insurance
Life insurance 9/2015 12/2014
Financial assets as at fair value through p/lDebt securities 1,266 1,234Equity securities 4,105 3,890Loans and receivables 191 149Derivatives 10 9Life insurance, total 5,572 5,282
Elimination items between segments -18 -23
Group, total 5,554 5,259
The value of financial assets regarding the debt security instruments has been tested by assuming a rise of 1 per cent unit in interest rate level in all maturities. For other financial assets, the prices were assumed to go down by 20 per cent. Sampo Group bears no investment risks related to unit-linked insurance, so a change in assumptions regarding these assets does not affect profit or loss. On the basis of the these alternative assumptions, a possible change in interest levels at 30 September 2015 would cause descend of EURm 1 (4) for the debt instruments, and EURm 169 (166) valuation loss for other instruments in the Group’s other comprehensive income. The reasonably possible effect, proportionate to the Group’s equity, would thus be 1.6 per cent (1.6).
INTERIM REPORT JANUARY – SEPTEMBER 2015
50
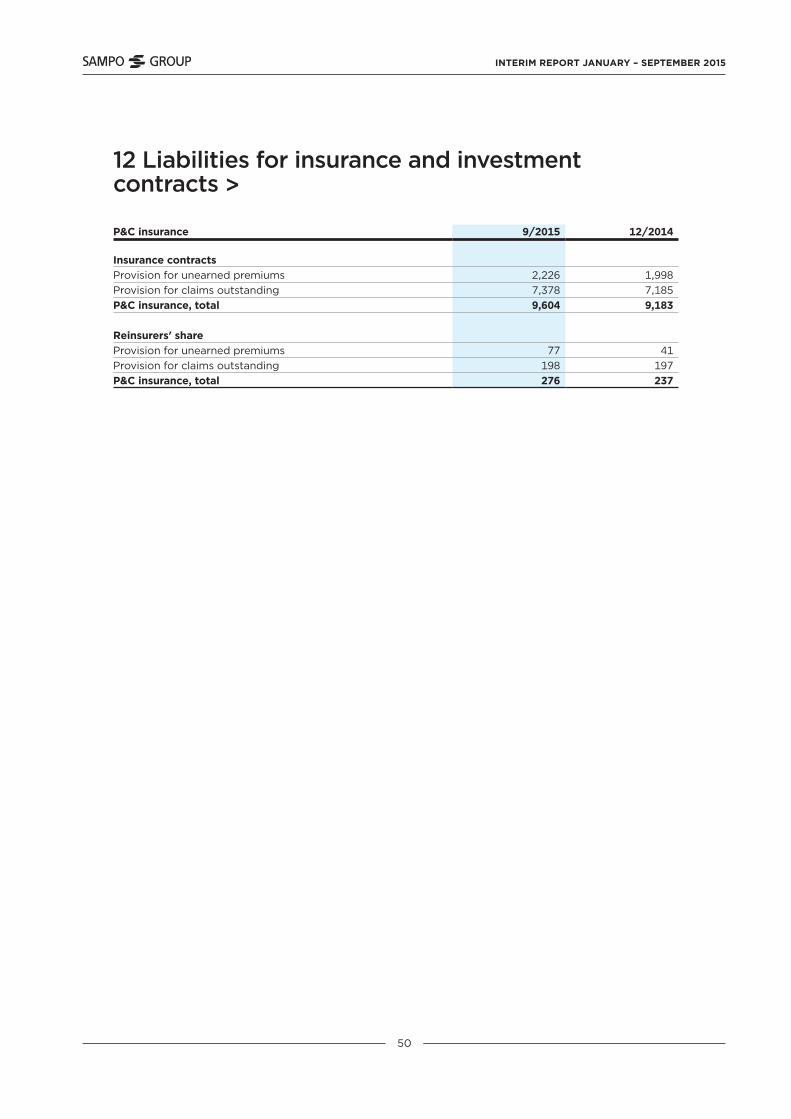
12 Liabilities for insurance and investment contracts >
P&C insurance 9/2015 12/2014
Insurance contractsProvision for unearned premiums 2,226 1,998Provision for claims outstanding 7,378 7,185P&C insurance, total 9,604 9,183
Reinsurers' shareProvision for unearned premiums 77 41Provision for claims outstanding 198 197P&C insurance, total 276 237

INTERIM REPORT JANUARY – SEPTEMBER 2015
51
> 12 Liabilities for insurance and investment contracts
Life insurance 9/2015 12/2014
Insurance contractsLiabilities for contracts with DPF Provision for unearned premiums 2,544 2,625 Provision for claims outstanding 2,446 2,433Total 4,990 5,058Liabilities for contracts without DPF Provision for unearned premiums 0 0 Provision for claims outstanding 1 -Total 1 0Total 4,991 5,058
Assumed reinsurance Provision for unearned premiums 3 1 Provision for claims outstanding 0 0Total 4 2
Insurance contracts, totalProvision for unearned premiums 2,548 2,626Provision for claims outstanding 2,447 2,434Total 4,994 5,060
Investment contractsLiabilities for contracts with DPF Provision for unearned premiums 25 4
Liabilities for insurance and investment contracts, totalProvision for unearned premiums 2,573 2,631Provision for claims outstanding 2,447 2,434Life insurance, total 5,020 5,065
Recoverable from reinsurersProvision for unearned premiums 3 3
Investment contracts do not include a provision for claims outstanding.
Liability adequacy test does not give rise to supplementary claims.
Exemption allowed in IFRS 4 Insurance contracts has been applied to investment contracts with DPF or contracts with a right to trade-off for an investment contract with DPF. These investment contracts have been valued like insurance contracts.
Group, total 14,624 14,248
INTERIM REPORT JANUARY – SEPTEMBER 2015
52
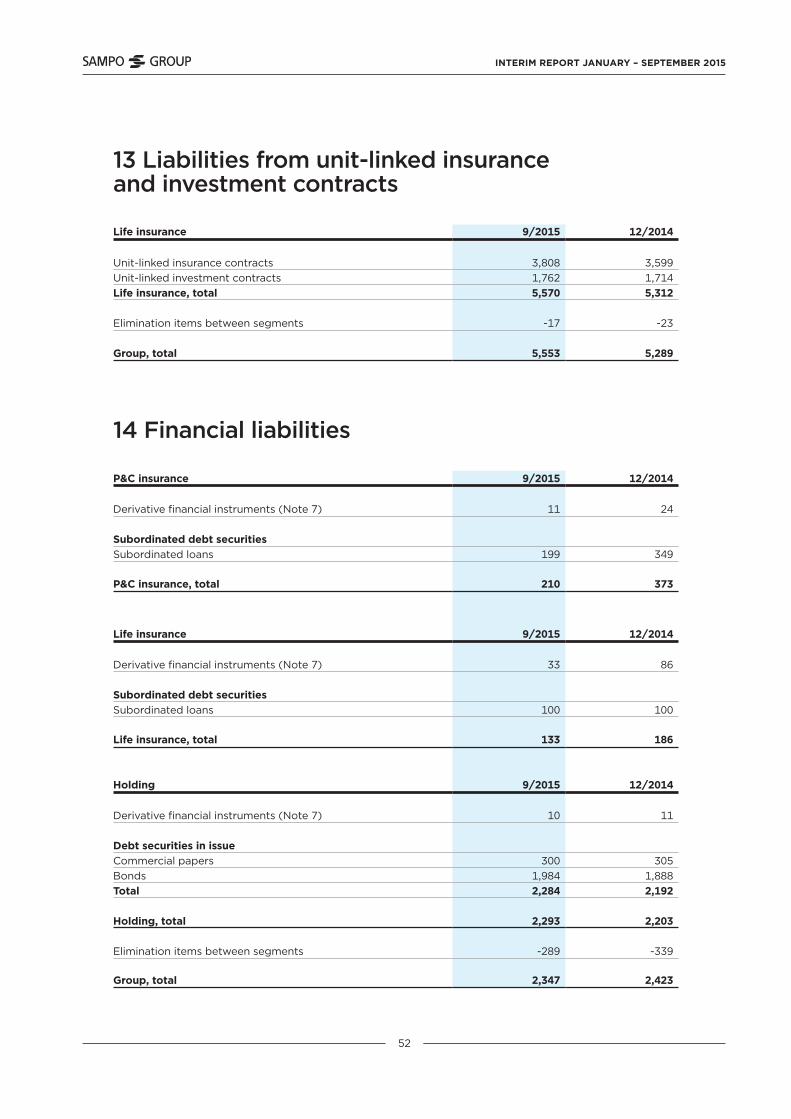
13 Liabilities from unit-linked insurance and investment contracts
14 Financial liabilities
Life insurance 9/2015 12/2014
Unit-linked insurance contracts 3,808 3,599Unit-linked investment contracts 1,762 1,714Life insurance, total 5,570 5,312
Elimination items between segments -17 -23
Group, total 5,553 5,289
P&C insurance 9/2015 12/2014
Derivative financial instruments (Note 7) 11 24
Subordinated debt securitiesSubordinated loans 199 349
P&C insurance, total 210 373
Life insurance 9/2015 12/2014
Derivative financial instruments (Note 7) 33 86
Subordinated debt securitiesSubordinated loans 100 100
Life insurance, total 133 186
Holding 9/2015 12/2014
Derivative financial instruments (Note 7) 10 11
Debt securities in issueCommercial papers 300 305Bonds 1,984 1,888Total 2,284 2,192
Holding, total 2,293 2,203
Elimination items between segments -289 -339
Group, total 2,347 2,423
INTERIM REPORT JANUARY – SEPTEMBER 2015
53
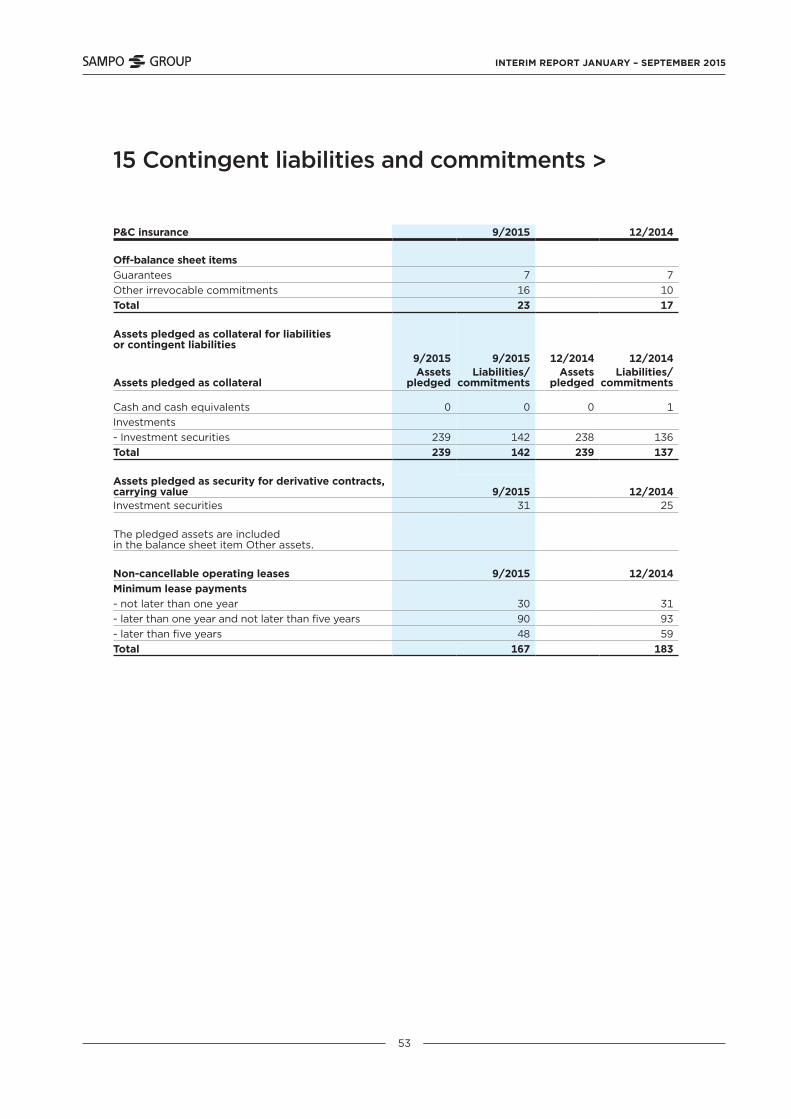
15 Contingent liabilities and commitments >
P&C insurance 9/2015 12/2014
Off-balance sheet itemsGuarantees 7 7Other irrevocable commitments 16 10Total 23 17
Assets pledged as collateral for liabilities or contingent liabilities
9/2015 9/2015 12/2014 12/2014
Assets pledged as collateralAssets
pledgedLiabilities/
commitmentsAssets
pledgedLiabilities/
commitments
Cash and cash equivalents 0 0 0 1Investments- Investment securities 239 142 238 136Total 239 142 239 137
Assets pledged as security for derivative contracts, carrying value 9/2015 12/2014Investment securities 31 25
The pledged assets are included in the balance sheet item Other assets.
Non-cancellable operating leases 9/2015 12/2014Minimum lease payments - not later than one year 30 31- later than one year and not later than five years 90 93- later than five years 48 59Total 167 183
INTERIM REPORT JANUARY – SEPTEMBER 2015
54
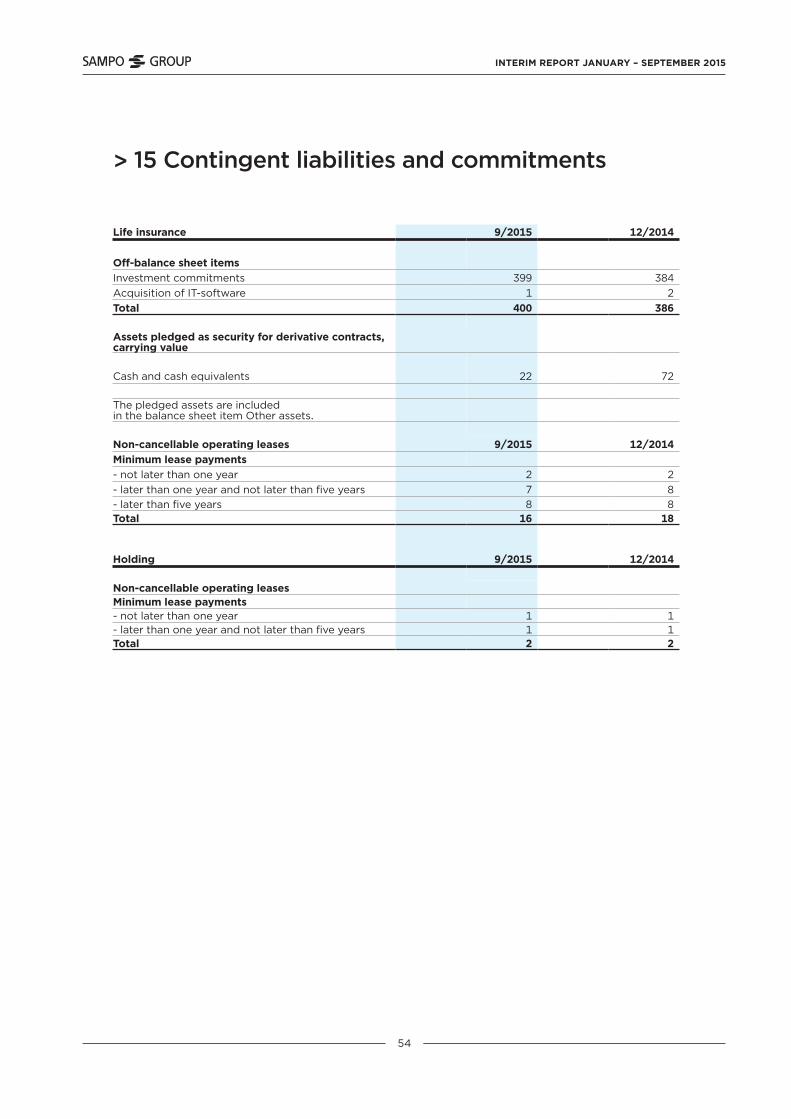
> 15 Contingent liabilities and commitments
Life insurance 9/2015 12/2014
Off-balance sheet itemsInvestment commitments 399 384Acquisition of IT-software 1 2Total 400 386
Assets pledged as security for derivative contracts, carrying value
Cash and cash equivalents 22 72
The pledged assets are included in the balance sheet item Other assets.
Non-cancellable operating leases 9/2015 12/2014Minimum lease payments - not later than one year 2 2- later than one year and not later than five years 7 8- later than five years 8 8Total 16 18
Holding 9/2015 12/2014
Non-cancellable operating leases Minimum lease payments - not later than one year 1 1- later than one year and not later than five years 1 1Total 2 2
INTERIM REPORT JANUARY – SEPTEMBER 2015
55
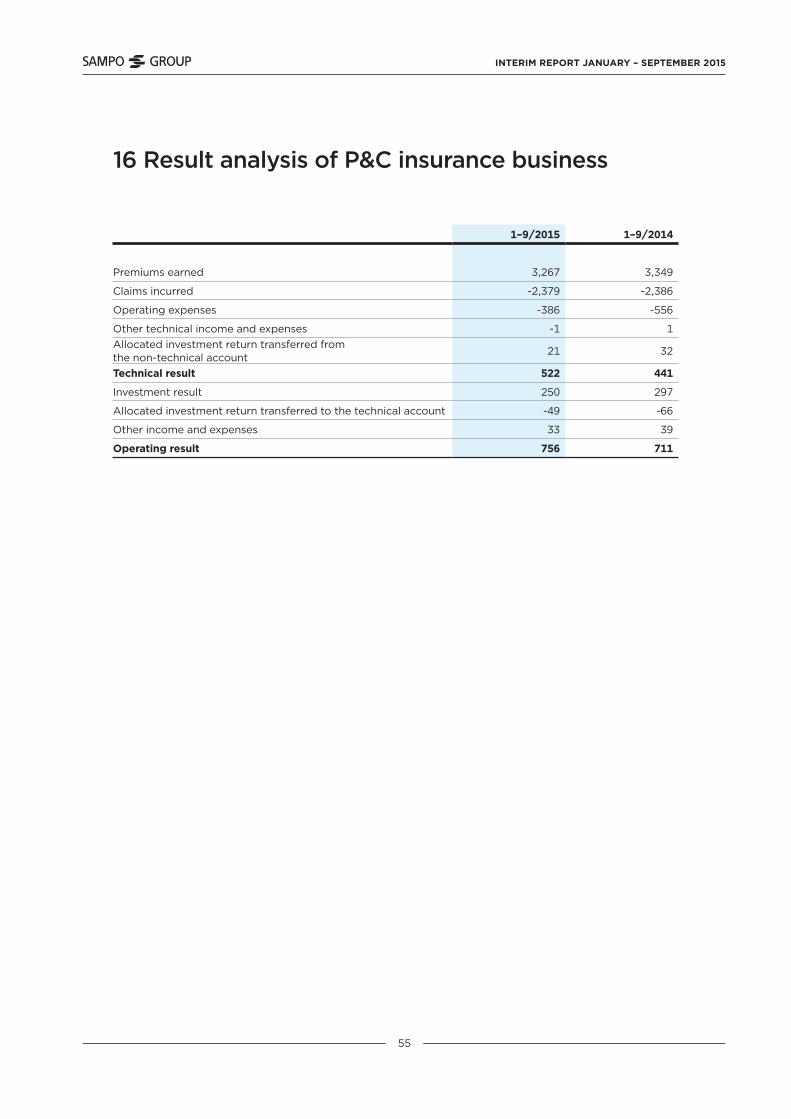
16 Result analysis of P&C insurance business
1–9/2015 1–9/2014
Premiums earned 3,267 3,349
Claims incurred -2,379 -2,386
Operating expenses -386 -556
Other technical income and expenses -1 1Allocated investment return transferred from the non-technical account
21 32
Technical result 522 441
Investment result 250 297
Allocated investment return transferred to the technical account -49 -66
Other income and expenses 33 39
Operating result 756 711

INTERIM REPORT JANUARY – SEPTEMBER 2015
56
17 Sampo plc’s income statement and balance sheet (FAS)
Income statement 1–9/2015 1–9/2014
Other operating income 12 11
Staff expenses -14 -14
Depreciation and impairment 0 0
Other operating expenses -8 -9
Operating profit -10 -12Finance income and expenses 656 472
Profit before appropriations and income taxes 646 460Income taxes -2 -
Profit for the financial period 644 460
Balance sheet 9/2015 12/2014
ASSETSIntangible assets 0 0
Property, plant and equipment 3 3
Investments
Shares in Group companies 2,370 2,370
Receivables from Group companies 296 325
Shares in participating undertakings 5,557 5,557
Receivables from participating undertakings 176 110
Other shares and participations 332 85
Other receivables 52 35
Receivables 78 97
Cash and cash equivalents 106 768
TOTAL ASSETS 8,971 9,351
LIABILITIESEquityShare capital 98 98
Fair value reserve -10 7
Invested unrestricted equity 1,527 1,527
Other reserves 273 273
Retained earnings 4,026 4,060
Profit for the year 644 1,050
Total equity 6,558 7,014
LiabilitiesLong-term 1,984 1,888
Short-term 429 450
Total liabilities 2,413 2,337
TOTAL LIABILITIES 8,971 9,351

12 AUGUST 2015
Sampo plc / Fabianinkatu 27 / 00100 Helsinki, Finland / Telephone +358 (0)10 516 0100
www.sampo.com / @sampo_plc / sampo-plc