overall development management model: a new...
TRANSCRIPT

OVERALL DEVELOPMENT MANAGEMENT MODEL: A NEW APPROACH FOR EMERGING COUNTRIES COMPARATIVE
ANALYSIS OF SIX COUNTRIES ON TWO CONTINENTS
Fabiana Sciarelli, Azzurra Rinaldi University Unitelma Sapienza (ITALY)
Abstract As most of the literature shows, social and economic factors are the main reasons of development (or lack of development) of a country: the scarcity of education, the absence of basic health standards, a low income population are the reasons of a vicious cycle of poverty that can be stopped by facing the poverty dimensions in a long term perspective.
In our article, we firstly carried on an analysis of the development actors.
Then, we analyzed many development plan implemented in Asia (India, Philippine, Myanmar) and in Africa (South Africa, Ethiopia and Benin), specially the cultural and social ones.
These steps allowed us to introduce the Overall Development Management Model, the Macro Management Strategic Model for the development of the weak areas.
The characteristics of the Overall Development Management Model are then given by: the consideration of human development as a whole; hybridization of different approaches; the division into three phases temporally differentiated (Development Lifecycle); a two-way approach, Top Down and Bottom Up; the strategic planning based on the use of instruments from different systems of economic and social science; the decreasing of the dependence between national and international public actors (Development Matrix Actors), that characterizes the implementation of national autonomy; the peculiar structure of the development plans; the involvement of the population; and the need for countries to define their own unique development process.
Indeed, the key factors to ensure that the emerging countries may be able to manage their growth process is the spread of expertise: material resources and foreign assets must be used for the creation of an independent development path, not a welfare state dependent on foreign aid.
Social and economic development, that is the basis of a sustainable development, must be founded on the culture of a country, its traditions, its religion, using these characteristics in order to find a very peculiar development path.
The mistakes made in the past related to the assumption that a development model was universal, applicable to all contexts, can no longer be reproduced.
We provide a method which can help each country to formulate its own development strategy.
This can be done by introducing a hybridized methodology between economics and management that uses tools that make the approaches synergistic with traditional Project Management, the Logic Framework Approach and the Result Based Management, so as to allow each country to plan and manage their own development process: An Overall Development Management Model.
The Overall Development Management Model, therefore, helps a country manager to achieve its balanced, sustainable and free development, choosing like a tree the direction of its path.
Keywords: Development, Education, Overall Development Management Model.
1 THE DEVELOPMENT ACTORS The actor is an individual who acts. In this context, the actors of development are all those organizations, institutions and individuals who act in favor of human development areas. There are several ways of being an actor of development, for example, a promoter of a development process, a financial or economic source, a process regulator, a receiver of the actions, a stakeholder or a partner of another actor. Therefore, the system gathers various types of actors such as the principal, secondary and supportive actors, global, regional and local actors, intergovernmental, governmental
Proceedings of INTED2017 Conference 6th-8th March 2017, Valencia, Spain
ISBN: 978-84-617-8491-22300

and non-governmental actors, social and economic actors and traditional and emerging actors. In many cases, the organization itself fulfills several roles within a developing process. For these reasons, it is not simple to classify the variety of actors in a developing process, without losing clarity and expositive effectiveness.
Therefore, we consider it more important to classify the organizations participating to developing processes of the weak areas (figure 1) according to two main distinguishing features:
1 The ‘legal’ status that can be public, private or both; 2 The intervention area, divided in global, regional or local.
Fig.1 - Development Actors Matrix [1].
Among the public actors, we can identify global and regional intergovernmental actors and governmental actors. Intergovernmental actors are those organizations that are founded by two or more governments. These structures can include governments from different continents (Global Intergovernmental Actor), from just one continent (Continental Intergovernmental Actor), or from a specific geographical, religious or cultural area (Regional Intergovernmental Actor).
Governmental actors are, instead, all those organizations established by only one government, for example, governmental commissions, public universities, public enterprises and so on. Of course in this case, there are only national actors.
Private actors, also called non-governmental (NGA), include all those subjects that act independently from any kind of government. In particular, NGOs, enterprises, social movements, private universities, private foundations and so on. These organizations can be global, regional, or local.
Lastly, there are public-private actors, which are all those foundations, associations, commissions, and enterprises that are based on partnerships between public and private actors.
As we will see later on, all these actors can perform in several different and multiple roles, they can be propositive or supportive actors, economic sources, process regulators, controllers etc.
2 DEVELOPMENT PROJECTS IN ASIA AND AFRICA Many governments focus on the objective of economic growth, rather than allowing a commensurate social, human and sustainable development, even if most of the literature shows that economic development is not sustainable in the long term if it is not supported by a general development strategy [1].
2.1 Economic Development In terms of economic development, in the last years, some emerging countries are performing quite well, despite the international crisis that hit most of the advanced economies in 2009.
2301

But, if we analyze GDP in real terms, we may see the huge differences in the amounts of GDP between advanced countries and emerging ones and also between the emerging economies.
This is what emerges from Fig. 1: also within the group of countries we focused on in our research, there are wide differences in GDP from the highest Indian value of to the lowest Beninese one.
From 200 to 2015, Benin’s GDP seems to show zero dynamism. Actually, the GDP growth rate of Benin was 4.6% in 2012, 6.9% in 2013, and 6.5% in 2014, and decelerated to 5% in 2015, after a drop in agriculture production. These results have been achieved thanks to a quite prudent fiscal policy, favorable weather conditions and economic growth in the near Nigeria. On the other side, since now, the country still has not started the necessary structural transformation of its economy, shifting gains and labour force from the traditional sectors to the higher-productivity ones.
Fig.2 - GDP [2].
As for Ethiopia, a real growth path can be seen only since 2004. Even if the absolute values of GDP are significantly lower than most of the there countries we focused on, the country is one of the fastest-growing countries in the world. Indeed, Ethiopia has witnessed a rapid economic growth, with real GDP growth averaging 10.9% between 2004 and 2014. This process lifted the country from being the second poorest in the world in 2000 to potentially becoming a middle income country by 2025.
During the same period, India has shown a level of GDP considerably higher than the other countries, also highlighting a trend of rapid and dynamic growth: the country has been only marginally affected by the international crisis of 2009, suffering a slowdown only in 2008 and promptly recovering in the subsequent years.
In Myanmar, the path to GDP growth started in 2007. Since then, the country has shown a GDP growth rate similar to countries like China, South Korea and Vietnam, thanks to the rapid expansion of the manufacturing sector and exports. We should also underline that, in 2014 Myanmar took 6th position in the international rankings on GDP growth rate. Finally, after two years of growth and stability, the country is now facing a more difficult economic environment, due to a supply shock from heavy flooding, a reduction of the new investments, and lower commodity prices of Myanmar’s main exports.
Even in this case of the Philippines, the trend is positive and we may see how the economic crisis affected the trend in 2009. After that, anyway, the GDP of the Philippines continued growing. Actually, the Philippines has become one of the most dynamic countries in East Asia: GDP grew at an average 6.2% from 2010 to 2015 (while from 2000 to 2009, the average GDP growth rate was 4.5%). In the first half of 2016, GDP growth rate in Philippines has been 6.9%, exceeding growth of China, Malaysia, Thailand and Vietnam.
Except for the decline between 2000 and 2002, the Gross Domestic Product of South Africa almost always showed a positive trend until 2011. Since then, there have been some internal factors that impeded economic growth, such as labour unrests, electricity shortages and drought, but also a
2302

growing policy uncertainty. From 2011, when GDP growth rate was 3.2%, South African growth slowed to 1.5 percent in 2014. Even if some progress is being made, infrastructure barriers in power, rail, and ports keep holding down production, exports, and investment.
We saw in Figure 1 that in most of the countries we analyzed, GDP has grown. Consequently, even GNI per capita PPP has increased.
In Benin, GDP growth was lower than the population growth, so, GNI per capita PPP could not increase as much as it could. Anyway, while it started at $1,300 in 2000, it reached $2,050 in 2015, still showing higher values than those of Ethiopia. The country suffers from some structural challenges that are not addressed yet in sectors like water and sanitation, energy, transport, and communication and this provides a partial explanation for the lack of a strong and positive link between economic growth and poverty reduction.
In Ethiopia, the GNI per capita PPP amounted to $490 in 2000 and became equal to $1620 in 2015. We certainly need to point out that while in 2000 Ethiopia was the poorest country in the world in terms of GNI per capita PPP, in 2014 it ranked in twelfth place, showing a very positive trend. Despite an high increase in GDP and a substantial decrease in the percentage of the population below the national poverty line, the absolute number of the poor in the country is almost the same as in 2000. Still, a significant portion of the population lives just above the poverty line and is very vulnerable to any kind of shock.
Fig. 3 - GNI per capita PPP [2].
In India, the value of this variable was $1,980 in 2000 and reached $6,030 in 2015. We must consider that the volume of population is much greater in India than in the other countries we analyzed. And this is one of the reasons why one of the world’s largest economies, like India, shows a GNI per capita PPP that is quite low. Anyway, in the last years, the country has made many efforts in reducing extreme poverty. The poverty rate decreased from 45.3% in 1994 to 21.9% in 2012. In the last decade, 137 million people were lifted out of poverty. Only from 2010 to 2012, 85 million people moved above the official poverty line.
GNI per capita PPP in Myanmar, that was equal to 1,000$ in 2000, rose to 4,930$ in 2015. Whereas since then it was a low-income country, in July 2015 Myanmar was reclassified by the World Bank as a lower-middle income country, thanks to its improving economic performance during the last two years. One of the main factors that determined this upgrade is the growing income level across the population. Despite that, many in Myanmar live near the poverty line and are vulnerable to economy-wide shocks.
GNI per capita PPP in the Philippines was $3,930 in 2000 and reached $8,940 in 2015. According to the most recent World Bank estimates, extreme poverty in the Philippines decreased from 10.6% in 2012 to 8.4% in 2015. In the same period, household income in real terms showed a continuous growth.
At the highest level of GNI per capita PPP we find South Africa, which population ranks last in the group. The GNI per capita PPP shows an upward trend throughout the period considered, except for a slight drop in 2009. This is another factor that confirms the integration of South Africa in the
2303
international context, since only integrated countries have been adversely affected by the crisis, while the marginal ones were not. We must also underline that South Africa still remains a very unequal economy with one of the highest inequality rates in the world: the top decile of the population has the 58% of the country’s income, while the bottom decile accounts for only 0.5% (the bottom half for less than 8%).
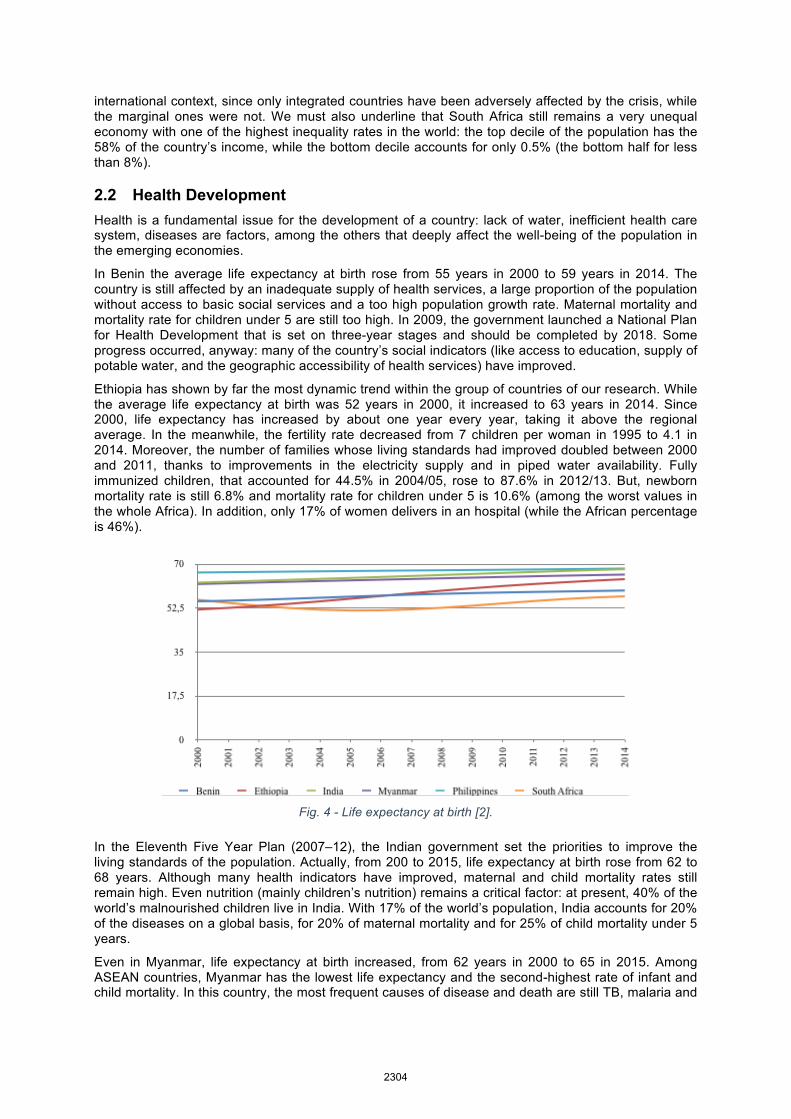
2.2 Health Development Health is a fundamental issue for the development of a country: lack of water, inefficient health care system, diseases are factors, among the others that deeply affect the well-being of the population in the emerging economies.
In Benin the average life expectancy at birth rose from 55 years in 2000 to 59 years in 2014. The country is still affected by an inadequate supply of health services, a large proportion of the population without access to basic social services and a too high population growth rate. Maternal mortality and mortality rate for children under 5 are still too high. In 2009, the government launched a National Plan for Health Development that is set on three-year stages and should be completed by 2018. Some progress occurred, anyway: many of the country’s social indicators (like access to education, supply of potable water, and the geographic accessibility of health services) have improved.
Ethiopia has shown by far the most dynamic trend within the group of countries of our research. While the average life expectancy at birth was 52 years in 2000, it increased to 63 years in 2014. Since 2000, life expectancy has increased by about one year every year, taking it above the regional average. In the meanwhile, the fertility rate decreased from 7 children per woman in 1995 to 4.1 in 2014. Moreover, the number of families whose living standards had improved doubled between 2000 and 2011, thanks to improvements in the electricity supply and in piped water availability. Fully immunized children, that accounted for 44.5% in 2004/05, rose to 87.6% in 2012/13. But, newborn mortality rate is still 6.8% and mortality rate for children under 5 is 10.6% (among the worst values in the whole Africa). In addition, only 17% of women delivers in an hospital (while the African percentage is 46%).
Fig. 4 - Life expectancy at birth [2].
In the Eleventh Five Year Plan (2007–12), the Indian government set the priorities to improve the living standards of the population. Actually, from 200 to 2015, life expectancy at birth rose from 62 to 68 years. Although many health indicators have improved, maternal and child mortality rates still remain high. Even nutrition (mainly children’s nutrition) remains a critical factor: at present, 40% of the world’s malnourished children live in India. With 17% of the world’s population, India accounts for 20% of the diseases on a global basis, for 20% of maternal mortality and for 25% of child mortality under 5 years.
Even in Myanmar, life expectancy at birth increased, from 62 years in 2000 to 65 in 2015. Among ASEAN countries, Myanmar has the lowest life expectancy and the second-highest rate of infant and child mortality. In this country, the most frequent causes of disease and death are still TB, malaria and
2304

HIV/AIDS: the incidence of TB is three times higher than the world average and one of the highest in the Asian region.
Among the countries we focused on, the Philippines is the country where life expectancy at birth reaches the highest levels since 2000. Despite that, the trend was less dynamic: from 66 years in 2000 to 68 years in 2015. One of the main problems is the persistence of HIV. This is why UNDP recently established 17 regional AIDS assistance teams with the aim to provide multi-sectoral support to contrast the growing HIV epidemic.
After falling from 56 years in 2000 to 53 years in 2010, life expectancy recovered to 62 years in 2014. The recent trend was mainly achieved thanks to the rapid diffusion of the antiretroviral treatment programs to fight HIV/AIDS and sustained by the decrease in both adult and infant mortality, as well as a gradual drop in the rate of female fertility.
Fig. 5 - Health expenditure, public (% of total health expenditure) [2].
In Benin, health expenditure per capita rose from 14$ in 2000 to 37 in 2014. The quality of health services provided is still too low and health workers are still not enough qualified; even the geographical distribution of the resources (health centers, workers and so on) is not efficient.
Ethiopia, with an heath expenditure per capita of 27$ in 2014 still remains far from the global average.
In 2000, India, had a very low per capita spending: $19. In 2015, it reached $75. In addition, health expenditure in India increased in almost every state even in 2015: health expenditure increased in 13 of the 14 states for which data are available.
Myanmar’s healthcare spending per person is the lowest among the countries we studied: while in 2000 the country showed an expense of $3, the value rose to $24 in 2012 and dropped to $20 in 2014. In the Philippines, total health-care expenditure per capita in nominal terms has increased steadily: from 2007 to 2011, the average increase in health expenditure per capita amounted to 5.2% and it reached a maximum value of in 135$ in 2014, after many years of positive trends, since 2009.
In South Africa the health care spending per capita is a the highest among the group of countries, as it accounts for 570$ in 2015, although this data could be influenced by the huge expenditure relative to HIV.
2.3 Education Development Education of human resources and their management is a fundamental tool of development.
A World Bank study [3] states that education has a large and positive influence on human development and health, in fact children born from more educated mothers are less likely to die in childhood and more likely to have higher birth weights and be fully immunized.
There are, unfortunately no substantial time series’ in order to better evaluate the increase, but even the existence of the data today has great significance. Data show that all countries analyzed lack a
2305

wide education strategy and that territorial inequalities in education are still evident between rural and urban areas and between male and female.
The situation of the countries analyzed though, in absolute value, makes it still very hard for the education sector to evolve.
Table 1. Mean Years of Schooling (of Adult) [2].
1990 2000 2010 2011 2012 2013 2014
Benin 1.6 2.6 3.2 3.2 3.2 3.2 4.4
Ethiopia N.A. 1.5 2.2 2.4 2.4 2.4 N.A.
India 3.0 3.6 4.4 4.4 4.4 4.4 N.A.
Myanmar 2.4 3.0 4.0 4.0 4.0 4.0 N.A.
Philippines 7.1 8.0 8.9 8.9 8.9 8.9 N.A.
South Africa 6.5 8.8 9.6 9.7 9.9 9.9 N.A.
The average years of school attended in India in 2013 are 4.4, against the 11.7 expected. The same numbers of years are expected even in the Philippines (11.7), but the country has an average school attendance of 8.9 years. The lowest data among the three Asian countries are presented by Burma, which sees only 8.6 years of schooling and less than half of attended years on average.
Ethiopia and Benin present discouraging data, even if increasing. It is sufficient to observe the average of the school year attendance, which in the first case was 2.4 and in the second 3.2 years. This suggests that there are large segments with an absence of education in the two countries.
South Africa however, has an average schooling attendance of almost 10 years, certainly better, but still not at an international level.
The Primary School Participation Ratio in South Africa is equal to about 90%, in India about 83%, in Ethiopia equal to about 64%, in the Philippines to about 63%, and equal to about 58% in Myanmar. The discordant data is presented, however, by Benin for which UNICEF [4] identifies a primary school attendance of about 70%.
The scenario changes completely when studying the data on secondary education. In fact, in Ethiopia and in Philippine the attendance rate decreases to 16%; in Benin and in Myanmar it is about 45%; in India is 50%.
Benin, which is anguished with the plague of youth labor, presents a young women literacy of about 30% of the female population, while the male rate rises to nearly twice as much.
The data of the Ethiopia, still remains at a very low level, even though the government’s education strategy set the objective of spreading a universal primary education in the country.
So, even if Ethiopian and Beninese governments seem to be aware of the importance of education in the development process of the country, the implementation of its programmes (also due to the bureaucracy) is often too slow and this requires some kind of support.
In South Africa, as stated previously, young people who graduate from secondary school and are qualified for admission to the University increased by 56%. In fact, there were 110.000 in 2009 and have become 172.000 in 2013. The MTSF (MediumTerm Strategic Framework) has set itself the goal of achieving 250.000 students by 2019.
In India, the Twelfth Plan addresses the strategies dedicated to the education sector as an important element for the development. The Sarva Shiksha Abhiyan (SSA) and the RTE have very much increased basic education. India, in fact, has a fair rate of literacy (around 90%), whereas territorial illiterate tribal areas and discrimination against women is still present and still very strong; on these elements the central and local government are implementing specific programmes. [1]
The data of the Philippines is connected to the cost and loss of income that a family faces for his son to attend the secondary school, as seen previously.
Myanmar, as we said earlier, implements specific policies, through the FESR on Higher Education, and this probably makes the difference.
2306

The Ethiopian Government in 2008 started trying to improve the quality of education through the School Improvement Programme launched under the General Education Quality Improvement Programme (GEQUIP). This programme intended to improve students’ performance through the creation of a conducive school environment, improving the school facilities, using tutorial classes and so on.
Also the Plan Décennal de Developpement du Secteur de l'Education (PDDSE) and the MTSF of South Africa, with the construction of Funga Lushaka Bursary for teachers, emphasizes the necessity of a quality adjustment of the national education system.
Even India invests in programs to increase retention and attendance to secondary school, and to improve its quality.
There are multiple factors that come into play in this including quality of education, employment opportunities, and the necessary environment in order to create or expand productive employment.
Instead, Benin presents a decrease of the per capita spending on education, despite the attention of the governmental and bilateral plans for this sector.
The analysis of the expenses for the education of the six countries is not easy as data are is fragmented and quite obsolete.
In the case of expenditure on GDP, you can see from table 2 that there are no available data for Myanmar and that the Philippines presented a low figure (3.4) in 2013, and that India has growing data, 3.8% in 2012. About the African countries we can see a decrease of expenditure in Benin (from 5.0 in 2010 to 4.4 in 2014), in Ethiopia (from 5.5 in 2011 to 4.5 in 2013) and in South Africa (from 6.4 in 2012 to 6.1 in 2014). But in the same time we can see a substantial increase in the last fifteen years.
Table 2. Government Expenditure on Education, total (% of GDP) [2]
Table 3. Government Expenditure on Education, total (on Total Expenditure) [2]
1990 2000 2010 2011 2012 2013 2014 1990 2000 2010 2011 2012 2013 2014
Benin N.A. 2.9 5.0 N.A. 4.9 4.6 4.4 Benin N.A. 13.5 26.1 N.A. 25.0 22.3 22.2
Ethiopia N.A. 4.0 4.5 5.5 5.6 4.5 N.A. Ethiopia N.A. 14.9 26.3 29.7 30.5 27.0 N.A.
India N.A. 4.3 3.3 3.7 3.8 N.A. N.A. India N.A. 17.5 11.7 13.7 14.1 N.A. N.A.
Myanmar N.A. N.A. N.A. N.A. N.A. N.A. N.A. Myanmar N.A. N.A. N.A. N.A. N.A. N.A. N.A.
Philippines N.A. 3.3 N.A. N.A. N.A. 3.4 N.A. Philippines N.A. 15.2 N.A. N.A. N.A. 20.3 N.A.
South Africa 5.3 5.4 5.7 6.0 6.4 6.0 6.1 South Africa N.A. N.A. 18.0 18.9 20.6 19.2 19.1
The government expenditure on total expenditure confirms the trend of spending, because South Africa, Ethiopia and Benin show a slight decrease from 2012 to 2013, but a substantial increase, even if small from 2000 to 2013.
The costs that the government committed in education, on the total expenditures of the government, are growing for India and equal to 14.1% in 2012 and for the Philippines (15.2 in 2000 and 20.3 in 2013). Unfortunately, data on Myanmar aren’t available.
All the data examined so far show us factually what we had already understood through the analysis of the strategies, principally that the six countries surveyed see the other elements of human development, that are health and education, as complementary or even instrumental for economic development.
This idea, although mitigated in some plans, although covered by various sectoral programmes, although recognized as a limit, permeates all the strategic systems of these six countries. The strategies that are realized in the two sectors are often due to the need for compliance with the trends of the international community, which also requests the achievement of specific sector objectives.
The rapid expansion in the access to education is a necessary but not a sufficient condition to ensure that population may have the knowledge and the skills that will enable them to follow a longer and more productive development path. Many factors come into play in this: quality of education,
2307

employment opportunities, and the environment where productive development may be created and expanded.
The six examined countries, therefore, in different measures, are still far away from the fourth SDG - ‘Ensure inclusive and quality education for all and promote lifelong learning’ - considering both the participation rates to education and to quality.
From the countries we studied, which are very oriented towards the achievement of economic development, it is clear from the strategic approach recounted so far, that the education is a point that is identified as nodal, because it is complementary to economic development and, therefore, to human development.
2.4 Human Development Index (HDI) Benin is the only country within the group to register a negative HDI rank change: it fell two positions only in the period 2009–14. Benin is still a country with low human development, since it continues showing disappointing results mostly in life expectancy, as we saw before, despite the health development plan that has been improved by the country’s Minister of Health in 2009 [5]. Anyway, HDI increased from 2000 to 2014, even if is is the second lowest value, after Ethiopia.
Table 4. Human Development Index.
2000 2005 2010 2011 2012 2013 2014
INDIA 0,496 0,539 0,586 0,597 0,600 0,604 0,609
MYANMAR 0,425 0,478 0,520 0,524 0,528 0,531 0,536
PHILIPPINES 0,623 0,640 0,654 0,653 0,657 0,664 0,668
BENIN 0,392 0,433 0,468 0,473 0,475 0,477 0,480
ETHIOPIA 0,284 0,347 0,412 0,423 0,429 0,436 0,442
SOUTH AFRICA 0,632 0,613 0,643 0,651 0,659 0,663 0,666
Even Ethiopia showed a rising Human Development Index, gaining two positions in the world ranking; from 2000 to 2010, the index basically doubled, even thanks to such programmes as the Sustainable Development and Poverty Reduction Programme (SDPRP-2002) and the Plan for Accelerated and Sustained Development to End Poverty (PASDEP) [1]. Ethiopia presents a life expectancy of 64 years, an increasing, yet low, GNI per capita PPP ($1,500 in 2014), and a schooling level that is characterized by wide areas of illiteracy. These data confirm us that even if the growth path of a country starts showing an high dynamism (like Ethiopia, whose GDP increased very fast during the last years), the path not always leads to an increase in the well-being of the population. Indeed, Ethiopia still is a low human development country and ranks 173rd.
India, for example, has reached a good level of economic development over the past twenty years, yet it let the other elements of human development a little behind. United Nations Human Development Report 2014 shows that India is a medium human development country, since it ranks 135th.
Myanmar shows the lowest HDI (0.536) in Asia. In 2001, the government launched its thirty-year National Long-Term Plan, that, in 2011, became the twenty-year Long-Term Planning and National Economic Development. Such a long-term plan is divided in short-term Five Year Plans and a triennial bridge programme based on the reforms, and the FESR, which identifies political priorities for the years from 2012 to 2015 [1]. The Philippines have the highest Human Development value within the group. The country is classified as medium-HDI and it ranks in 2014 115 out of 187 countries. Furthermore, between 1980 and 2012, life expectancy increased by 5.8 years, the years of schooling by 2.8 and the GNI per capita PPP from $2786 in 1980 to $7915 in 2014. South Africa shows a steady growth path in HDI since 1990. However, since, in the meanwhile, many other countries performed well in terms of HDI, South Africa only rose four positions in HDI world rank, mostly thanks to its high GN per capita PPP. In fact, in the two other indicators, South Africa has average values: a low level of life expectancy at birth and an acceptable average in years of schooling. The country really needs a push in investments in good strategies and programs to support
2308

healthcare, and to defeat HIV and tuberculosis. Indeed, these are the primary goals of both the National Development Plan and the Medium-Term Strategic Framework.
3 THE OVERALL DEVELOPMENT MANAGEMENT MODEL As many studies on the development of deprived areas highlight, a lack of development should be explained and faced by linking structural causes to temporary causes. Territorial inequalities are determined by resources, human factors, beliefs, religion and these are the issues that many governments may find harder to be managed, since they arise from local culture and traditions, while it might be easier to manage economic variables.
The economic growth of a nation should be balanced and should tend to persist over time, respecting thus the tangible and intangible resources of the countries. But the human development to which a country must strive not only has to be balanced and sustainable, but it must also be free.
As most of the literature, we are also convinced that economic and social growth must be founded on the culture of a country, its traditions, its religion, yet never forgetting to link these characteristics of the country to the perspectives of the internationally globalized markets.
The mistakes made in the past related to the assumption that a development model was universal, applicable to all contexts, can no longer be reproduced. Today it is necessary that the model of development of a country is linked to its distinctive traits, its history, its social, cultural and economic development, and created by the country itself. International cooperation, according to the old methods, has no reason to exist. The tangible and intangible foreign resources should be used for creating an independent development, not a welfare state dependent on foreign aid.
Funds and international skills are the key to start the development process, but they must have a beginning and an end.
An adequate strategy of growth should be the key element of the development process of the country. As an enlightened parent helps its child on the growth path to make it an independent individual, in the same way the international community must support the country in the early stage of development and then allow it to walk on its own feet and also determine the direction of its path.
We do not intend to give a universal solution, but we want to provide a method which can be used in all the situations, so that each country can formulate its own development strategy and implement it without too much effort.
This can be done by introducing a hybridized methodology between economics and management that uses tools that make the approaches synergistic with traditional Project Management, the Logic Framework Approach and the Result Based Management, so as to allow each country to plan and manage their own development process.
A Developmental State is one with sufficient organization and power to achieve its developmental goals, the ability to provide consistent economic guidance and rational and efficient organization and the power to back up its long- range economic policies. In this sense, it can even be viewed as a model of development that nonetheless differs from a minimalist state or other species of interventionist state such as the regulatory state and the welfare state. In the literature, it is also contrasted with weak states (that bow to the pressure mounted on them by the business or political elite) or predatory states (that tends to be extractive and exploitative of public resources for private purposes). This requires the state to have the capacity to control domestic in sighting and build consensus among the populace on the national developmental agenda by drawing attention to the long-term benefits to all.
Nowadays, the achievement of economic development alone is no longer sufficient. As we mentioned in the previous paragraphs, to follow a sustainable and balanced development path, it is necessary that all virtuous circle factors - Living Standards, Health, Education, Quality and Persistence - coexist in the development strategy.
The lack of just one of these factors, as shown by history, causes the circle to become vicious, ignoring the problems more than solving them.
The development model to which a state must necessarily aim is, therefore, a complex, complete, balanced and sustainable development model.
2309

A Sustainable Developmental State [1], in simple terms, must be a state that tends to be a strong player in the three dimensions of economy, health and education of a nation, trying to put together economic, social and human development.
More than a model of development, what we suggest it is a tool box for a growth path that can be used to achieve the desired stage of development. We are talking, therefore, of the Overall Development Model.
Fig. 6 Overall development model chart.
For the 'Overall Development Model' [1] we intend a human balanced, long-term and independent development, with 'Model' representing the method and the tools needed to achieve development.
The path that we indicate in this work is based on the idea of the development life cycle, which assumes that a country possesses the intention to develop, and that it wants to start its growth.
The characteristics of the Overall Development Model are then given by: the consideration of human development as a whole, in balance between areas, long-term and independent; hybridization of different approaches; the division into three phases temporally differentiated; a two-way approach, Top Down and Bottom Up; strategic planning based on the use of instruments from different systems of economic and social science; decreasing the dependence between national and international public actors, that characterizes the growth of autonomy; the peculiar structure of the development plans; the involvement of the population; and the need for countries to define their own unique development process.
All the features of the Overall Development Model, then, represent the method to programme and implement the development, even if, of course, it does not indicate the content of the latter.
These elements may be considered general, unlike those that will then make up the substance of the plans that need to be, as we have seen, completely defined in a peculiar way.
2310

As mentioned above, there are universal elements therefore, distinct in the three stages of the lifecycle, such as the method, universal goals of development (MDG [6] and SDG [7]) and the composition of the actors, and many specific elements, such as the duration of the plans, the objectives, the choice of strategies, methods of achieving results, the involvement and implementation, the system of raising the necessary funds for the development process and the resulting control systems.
The Overall Development Model, therefore, helps a country to achieve its balanced, sustainable and free development, choosing like a tree the direction of its path.
4 METHODOLOGY The analysis is carried out through a hybrid methodology consisting of:
a) On Desk Analysis of bibliography and of World Bank, UN, UNDP, UNICEF data;
b) Analysis of development strategic plans of Africa - South Africa, Ethiopia, Benin - and Asia - India, Philippines, Myanmar;
c) Interviews (about 100) with significant members of UN, UNDP, International NGOs, Universities and Governments.
REFERENCES [1] F. Sciarelli, A. Rinaldi, ‘Development Magement of Transforming Economies’, Palgrave
Macmillian, 2016.
[2] World Bank Data (January 2017).
[3] World Bank, ‘HIV/AIDS in India’, 2012. http://www.worldbank.org/en/news/feature/2012/07/10/hiv-aids-india
[4] Unicef Data (January 2017).
[5] UNDP, ‘Human Development Report 2010, The Real Wealth of Nations: Pathways to Human Development’, UNDP, 2010.
[6] United Nations, ‘The Millennium Development Goals Report 2011’, United Nation, 2011.
[7] United Nation web site www.un.org (January 2017).
2311