overall equipment effectiveness study
TRANSCRIPT

Improving the overall equipment effectiveness of automated machines in
volume driven manufacturing
TT Ndou
orcid.org/0000-0002-9456-7985
Mini-dissertation submitted in partial fulfilment of the requirements for the degree Master of Business
Administration at the North-West University
Supervisor: Mr B Manda
Graduation ceremony: May 2019
Student number: 28024052

Overall equipment effectiveness study
i
ABSTRACT
The study outlines the framework concerning Overall Equipment Effectiveness (OEE)
using Total Productive Maintenance in the Lubrichem automated volume driven
machinery. This research has been carried out using the data obtained from electronic
system called RS-production of October 2016 to March 2017 at Lubrichem Company.
The data were obtained through a tool for Overall Equipment Effectiveness called RS-
production. The tool system (RS-production) data was from four sections or department
of Lubrichem Company (Automated volume driven machines, Automated maintenance
workshop, Automated blending machines and Semi-automated machines) sections. A
conceptual framework was designed to determine the effect of OEE on Lubrichem
automated volume driven machinery and subsequently measures availability,
performance and quality losses in a system or machines.
The research survey was based on the sample of four divisions of Lubrichem industry
(Automated volume driven machineries, Maintenance workshop, Automated blending
machines and Semi-automated machines), including analysing the outcome of the
research using excel.
The objective of the thesis was to identify OEE losses, downtime sources and possible
improvement. The availability losses and planning factor were the highest in all four
divisions. To get rid of unplanned losses, root cause analysis was performed to lower
prolonging of planned change overs and setups that require Single Minutes Exchange
of Dies for external (SMED) and internal events.
There is a frailty relationship of the unplanned equipment losses which were grouped
into unplanned production breakdowns. The losses which were recorded were
identified, analysed and split into two to provide potential solutions. Some of the losses
were stated as ‘no reason’ because production teams did not furnish the data or
information. This requires awareness, training and educating of production personnel
who operate the machines.

Overall equipment effectiveness study
ii
Keywords: Single Minutes Exchange of Dies, Overall Equipment Effectiveness and
Cause Effect diagram.

Overall equipment effectiveness study
iii
ACKNOWLEDGEMENTS
I would like to thank god, my saviour for providing me with the opportunity to embark on
this journey of my studies.
This research is dedicated to my colleagues, employer and all other manufacturing
industry who intended to have continues improvement by improving overall equipment
effectiveness of volume driven manufacturing.
The study of this magnitude requires collaboration and support of different people who
deserve to be acknowledged. I would firstly like to thank my wife and kids for their
support and inspiration during this research. The grate words as a token of appreciation
goes to the following people:
• Prof Christoff Botha and prof Yvonne du Plessis for facilitating mini dissertation.
• Mrs Wilma Pretorius for continues support to resolve clearance seeking
questions related to MBA.
• Prof Johan Jordaan for his role at the scientific committee.

Overall equipment effectiveness study
iv
SOLEMN DECLARATION BY STUDENT
I Ndou Tshifhiwa Tesness declare herewith that the Mini Dissertation Research Proposal
(Chapter 1) entitled Improving the overall equipment effectiveness of automated
machines in volume driven manufacturing, which I herewith submit to North West
University, Potchefstroom Campus, in compliance/ partial compliance with the
requirements set for MBA degree is my own work and has not already submitted to any
other university.
Signature of the student University number 28024052
Signed at Durban South (Prospecton) this day 15 August 2018

Overall equipment effectiveness study
v
TABLE OF CONTENTS
LIST OF ABBREVIATIONS ........................................................................................... X
LIST OF FIGURES ........................................................................................................ XI
LIST OF TABLES ........................................................................................................ XII
1 CHAPTER 1: CONTEXTUALISATION OF THE STUDY ............................................. 1
1.1 Introduction ............................................................................................. 1
1.2 Background ............................................................................................. 1
1.3 Problem statement .................................................................................. 2
1.4 Objectives ................................................................................................ 2
1.4.1 Primary Objective. ..................................................................................... 2
1.4.2 Secondary Objectives. ............................................................................... 3
1.5 Scope of the study .................................................................................. 3
1.6 Research methodology ........................................................................... 3
1.6.1 Literature Review....................................................................................... 3
1.6.2 Empirical Study. ........................................................................................ 5
1.6.2.1 Research type. .......................................................................................... 5
The research type is the quantitative because the research seeks to explore,
explain and understand the effectiveness of the machines and
employees using OEE (Brannen, 2017). ................................................... 5
1.6.2.2 Quantitative method .................................................................................. 5
1.6.2.3 Qualitative method..................................... Error! Bookmark not defined.

Overall equipment effectiveness study
vi
1.6.2.4 Population and Sample Design. ................................................................ 6
1.6.2.5 Data collection. .......................................................................................... 6
1.6.2.6 Data analysis. ............................................................................................ 9
1.6.2.7 Importance and benefits of the proposed study ......................................... 9
1.7 Ethical consideration. ............................................................................. 9
1.7.1 Principles of research ethics. ..................................................................... 9
1.7.2 The law of beneficence. ........................................................................... 10
1.7.3 The law of respect for human dignity. ...................................................... 10
1.7.4 The law of justice ..................................................................................... 10
1.7.5 Consent for conducting the survey. ......................................................... 10
1.8 Value-addition and limitations of the study ........................................ 10
1.9 Layout of the study ............................................................................... 11
1.10 Chapter summary .................................................................................. 12
2 CHAPTER 2: LITERATURE REVIEW ON OVERALL EQUIPMENT
EFFECTIVENESS (OEE) ........................................................................... 13
2.1 Introduction ........................................................................................... 13
2.2 Total Productive Maintenance (TPM) ................................................... 14
2.3 Introduction to Overall Equipment Effectiveness (OEE) .................... 16
2.4 Definitions of OEE ................................................................................. 16
2.5 The Purpose of OEE .............................................................................. 17
2.6 Chronic and sporadic disturbances .................................................... 18

Overall equipment effectiveness study
vii
2.7 Six big losses of OEE ............................................................................ 19
2.8 Evolution of OEE ................................................................................... 20
2.9 Calculating the OEE of the machines .................................................. 21
2.10 Data collection for OEE ......................................................................... 23
2.11 Set-up time ............................................................................................. 25
2.12 Cycle time .............................................................................................. 26
2.13 Single Minute Exchange of Dies (S.M.E.D) .......................................... 26
2.14 Five (5) WHY’S analysis ........................................................................ 27
2.15 Fishbone (Cause-Effect) Diagram ........................................................ 28
2.16 Chapter Summary .................................................................................. 29
3 CHAPTER 3 RESEARCH APPROACH ................................................................... 30
3.1 Introduction ........................................................................................... 30
3.2 Quantitative method .............................................................................. 30
3.3 Qualitative method ...................................... Error! Bookmark not defined.
3.4 Population and Sample ......................................................................... 31
3.5 Data collection instrument. .................................................................. 32
3.6 Case study design ................................................................................. 34
3.7 Analysis .................................................................................................. 35
4 CHAPTER 4 RESULTS, DISCUSSION AND ANALYSIS .......................................... 38
4.1 Introduction ........................................................................................... 38

Overall equipment effectiveness study
viii
4.2 Data collection ....................................................................................... 38
4.3 OEE of results and discussion for all four departments .................... 42
4.4 OEE results and discussion of automated volume driven
machines. ............................................................................................... 43
4.5 OEE results and discussion of Automated Maintenance
workshop. .............................................................................................. 45
4.6 OEE results and discussion of Automated Blending production
machines ................................................................................................ 48
4.7 OEE results and discussion of Semi-automated production
machines ................................................................................................ 50
4.8 Analysis and Discussion of the results ............................................... 51
4.8.1 Analysis of Automated volume driven machines ..................................... 52
4.8.2 Analysis Maintenance workshop for automated machines. ..................... 53
4.8.3 Automated blending machines. ............................................................... 54
4.8.4 Semi-automated machines. ..................................................................... 55
5 CHAPTER 5: CONCLUSION AND RECOMMENDATIONS ...................................... 55
5.1 Introduction ........................................................................................... 55
5.2 Conclusions ........................................................................................... 56
5.3 Identify the source of down time .......................................................... 57
5.4 Identify ways to improve Overall Equipment Efficiency of the
machines ................................................................................................ 58

Overall equipment effectiveness study
ix
5.5 Identify actual performance improvement opportunities for the
plant, based on information obtained through the literature
study. ...................................................................................................... 58
5.6 Recommendations ................................................................................ 60
5.7 Further research .................................................................................... 61
6 REFERENCES .......................................................................................................... 63
6 ANNEXURE .......................................................................................................... 70
6.1 Annexure: B, Machines Samples ......................................................... 70

Overall equipment effectiveness study
x
LIST OF ABBREVIATIONS
FMEA Failure Mode Effective Analysis.
MP Maintenance Prevention.
OEE Overall Equipment Effectiveness.
OEM Operations Equipment Manufactures.
SOP Standard Operations Procedure.
SPC Statistical Process Control.
TBM Time-Based Maintenance.
TC Total Count.
TPM Total Productive Maintenance.
TPM Total Productive Maintenance.
TQM Total Quality Management.

Overall equipment effectiveness study
xi
LIST OF FIGURES
Figure 2.1: Production performance losses by chronic ................................................. 19
Figure 2.2: Overall equipment effectiveness and Computation ................................... 20
Figure 2.3: Fishbone diagram of unscheduled returns ................................................. 28
Figure 3.1: RS-Production system connected to the machines………..…………………32
Figure 4.1 Percentage loses within all the machines. ................................................... 41
Figure 4.2: OEE results of different automated volume driven machines ..................... 42
Figure 4.3: OEE Maintenance workshop for automated machines……… . ……………46
Figure 4.4: OEE results for Semi-automated production ........................................ ….47

Overall equipment effectiveness study
xii
LIST OF TABLES
Table 1.1: Understanding of Qualitative and Quntitative methods .................................. 7
Table 2.1: Charateristics of chronic disturbance .......................................................... 18
Table 2.2: Shift time table ............................................................................................. 21
Table 3.1: Qualitatitve and Quantitative understanding ................................................ 30
Table 3.2: Daft table of project ...................................................................................... 34
Table 4.1: Four department of Lubrichem Vs data clloection ....................................... 37
Table 4.2: Total time registered .................................................................................... 37
Table 4.3: Setup/Changeover time per piece ............................................................... 38
Table 4.3: Cycle time recorded ..................................................................................... 38
Table 4.4: Total availability and OEE for all four department ........................................ 38
Table 4.5: Aggregate stoppage reasons and time of downtime losses ......................... 39
Table 4.6 Average OEE value for the Lubrichem Company ........................................ 39
Table 4.7: Highest average OEE of four department ……………….…………………….40
Table 4.8: Lowest average OEE parameter of Lubrichem company………..……….….40
Table 4.9: Average downtime losses for automated volume driven machines……..….43
Table 4.10: Downtime losses for Automated maintenance workshop…….…...………..45
Table 4.11: Downtimes losses for automated blending machines……..…………..……47
Table 4.12: Downtime losses of Semi-automated machines…….………………………49
Table 4.7: Highest average OEE of four department .................................................... 40

Overall equipment effectiveness study
1
1 CHAPTER 1: CONTEXTUALISATION OF THE STUDY
1.1 Introduction
This study focuses on improving the Overall Equipment Effectiveness (OEE) of high
volume driven machines and semi-automated machines using the Total Productive
Maintenance (TPM) approach at Lubrichem Company.
The chapter outlines the following: the background, the research problem statement,
primary and the secondary objectives, methodology applied, the limitations as well as
the overview structure of the research.
1.2 Background
“If you cannot measure it, you cannot improve it.” 67(Kaufman & Reichert, 2018:267).
In today’s business world, companies need to emphasise competitiveness,
effectiveness and efficiency in the manufacturing of goods and services. The
competitiveness in the business industry is measured by the increasing sales and
market share which translates to returns on investments or profits.
During the manufacturing process defects, inefficiencies and unidentified losses need to
detected and eradicated. Empirical studies carried out in the manufacturing industry
highlighted the need to use measurement techniques correctly to measure
performance(De Wilde, 2014:44). When working with performance measurement, the
following questions needs to be addressed: how and what to measure.
In manufacturing industries, production machines are critical. They are required to be
available for production if the company needs to stay competitive in the market
according to (Hill, 2017). Businesses need to optimise and improve their productivity to
prevent unplanned production losses and eliminate defects. This improves quality of the
product ultimately lowers the manufacturing costs, helps meet customer specifications
or demands and to remain competitive in the market (Ross, 2017).
According to Domingo and Aguado (2015:9033), TPM philosophy was launched with
metrics of OEE. The OEE is a tool which is used to measure productivity of the

Overall equipment effectiveness study
2
machines using three elements which are performance, available and quality. It
identifies potential losses and provides corrective actions that could be used to
eliminate potential losses. The measurement of OEE can be done on the raw material
for used for production, men and machines. The advantages of OEE are as follows:
• It reduces maintenance cost and machines downtime resulting in improved
machines life cycle.
• It identifies bottlenecks and improves productivity.
• It reduces defects, scraps and reworks of products resulting in increased quality.
• It increases man power efficiency resulting in increased of productivity.
As stated Ohunakin et al. (2012:130), in research in the Nigerian beverage industry, the
OEE implementation increased availability, quality and performance by over 50%. This
resulted in increased productivity, reduced process waste, scraps, rework and
unplanned losses.
1.3 Problem statement
Lubrichem operates over 850 machines to achieve its production targets. These volume
driven machines form the backbone of production at Lubrichem. In the past two years, it
has been noted that these machines are not operating at their full production capacity
(Lubrichem Company, 2018). This is an overall equipment effectiveness problem and it
has negatively affected Lubrichem’s bottom line.
Management challenge is to decipher and isolate the cause of the problem.
1.4 Objectives
The study comprises of primary and secondary objectives.
1.4.1 Primary Objective.
The main purpose of this study is to determine why operations team are not reaching
the production target in all the shifts.

Overall equipment effectiveness study
3
1.4.2 Secondary Objectives.
The secondary objectives are:
• To do literature study that will show how to identify ways to improve overall
equipment efficiency of the machines.
• To identify the source of downtimes during production.
• To prescribe solutions to the eliminate downtimes and reach production targets
The scope of the study is briefly outlined below.
1.5 Scope of the study
The study is set in an operations management environment. It involves the principles of
efficiency, availability and effectiveness of production machines in a high volume driven
manufacturing environment. The research method used for the study is briefly
discussed below.
1.6 Research methodology
This research methodology section outlines the methodology that was used to conduct
this research. It consists of a literature review and an empirical study. A review of the
research design, research instrument, data collection and analysis techniques that were
used are also outlined.
1.6.1 Literature Review.
Identifying and eliminating losses improves productivity. Total Productive Maintenance
(TPM) is one way of maintaining equipment or machines in collaboration with the
Overall Equipment Effectiveness (Jin et al., 2016). The following sources were used to
obtain a comprehensive overview of the topic:
• Approved journals.
• Approved articles.

Overall equipment effectiveness study
4
• Internet.
• Textbooks.
• Previous dissertations
The literature study defines Overall Equipment Effectiveness (OEE) as a hierarchy of
standard measurement developed to evaluate how high volume driven manufacturing
operations can effectively use machines and raw materials in manufacturing operations
(Cochran, 2017). It is based on the labour efficiency, availability, performance and
quality.
Therefore: OEE = Availability x Performance x Quality
Standard Measurement 1: Availability
Availability (A)= Run time / Total time
Availability is measured based on the percentage machines running time while making
the product divided by the total time which the machines was running.
Standard Measurement 2: Performance
Performance (P)= Total parts produced/ Target counter
Performance is measured based on the percentage total parts produced divided by the
target production counter. It answers the question how well is the machine running?
Standard Measurement 3: Quality
Quality (Q)= Good count/ Total Count
Quality is measured based on the percentage of good parts out of the total parts
produced on the machine divided by total number of goods which the machine has
produced.
A brief description of how the empirical study is carried out is discussed below.

Overall equipment effectiveness study
5
1.6.2 Empirical Study.
The empirical study outlines specific techniques, measurement instruments (electronic
RS-Production system) used and the activities initiated in conducting the research of
qualitative.
1.6.2.1 Research type.
The research type is the quantitative because the research seeks to explore, explain
and understand the effectiveness of the machines and employees using OEE (Brannen,
2017).
1.6.2.2 Quantitative method
This method deals with emphasized and generated numerical information. Quantitative
method produces good results for the data collected in group sample and comprising of
data information from group sample as stated by Darmer and Freytag (1995). It
presents good understanding of theory and research. Tezel and Barker (2016), defined
it as “explaining phenomena by collecting numerical data that are analysed using
mathematically based methods (statistics)”.
Table 1.1: below shows understanding of Quantitative methods.
Research
phases
Quantitative data collection
Sampling • Reduce sampling by adequate size of sampling
• Random sampling
Permissions • Individual authorising access to site.
• Board review
• Individual
Data sources • Check list.
• Instrument
• Public document

Overall equipment effectiveness study
6
Recording data • Instruments with valid and reliable scores.
Administer data
collection
• Attend to ethical issues
• Standard procedure
1.6.2.3 Population and Sample Design.
Lubrichem operates over 867 production machines in different categories as shown in
the table below. This is entire machine population. A sample of 192 machines was
selected as shown in the same table below. This was deemed representative enough as
the machines in each category are the same.
Production machine category No of
machines
No. of machines used as a
sample
Automated volume driven machines 244 23
Automated maintenance workshop 347 69
Blending machines 157 62
Semi-automated machines 119 38
Total 867 192
Table 1.2: Machine sampling for the quantitative study
1.6.2.4 Data collection.
Collection of data refers to the registration of values for a certain variable. Data can be
registered manually or automatically, and, in some cases, this can be done
simultaneously. Xu and Croft, (2017) suggested that automatic measures used to
collect information are probably relevant in the long run.

Overall equipment effectiveness study
7
The researcher used electronic RS-production system as methods of collecting the
data. The primary data was collected using RS-Production system to scientifically
confirm the management findings. The RS-Production system data is based on these
• Totals time registered
• Set up/changeover times per piece
• Cycle time recorded ranges
• Aggregated stoppage reasons
• Average OEE values for the Lubrichem Company
Statistical data on RS- Production was collected from October 2016 to July 2018.
Throughout the research, discussions and the interviews were made and brainstormed.
The research questions were answered using interviews, discussions and analysis and
data subsequently transcribed.
The OEE measurements depend on the source of data including how it is collected. The
data has to be accurate and not biased according to Taylor (2018). The method used in
the collection of data is a vital aspect needed in the calculation of OEE.
Data collection can vary from manual to much automated, as correct input of
parameters acquired from the production system is essential for OEE calculations (Xu
and Croft, 2017). Manual data collection which mainly happens in low-tech industries
consists of a registry, where operators are required to fill in the causes and duration of
breakdowns as well as reliable comments about minor stoppages and speed losses.
According to Vogel-Heuser and Rösch (2016), in high-tech industries, an automatic
OEE calculation system is governed by sensors linked to the equipment, automatically
recording the start time and duration of stoppages while prompting the operator to make
available the system with correct information about their specific downtime causes. With
automatic method, opportunities are made available for operators to set up lists of
potential downtime causes, scheduling the available operating time and constructing an
automatic OEE calculation for any specific time period.

Overall equipment effectiveness study
8
As long as the data input are provided in the system, it is not only possible to provide
OEE results but makes it easier to retrieve a variety of reports of production
performance and visualization of the performance results from the system.
However, too much information in the system can be a waste of time for the operators
and they will have to search for each downtime cause. Reluctance against data
collection from operators and foremen are some of the major challenges faced by many
industries.
Wickens and Holland, (2015) found it necessary to convince operators as some do
believe that some disturbances have a major impact on efficiency which later
measurements show that to be completely wrong. With automatic data collection, the
system is quite expensive, complex and is collected at an aggregated level. On the
contrary, manual data collection can be very detailed as losses can be fully examined.
It is necessary to introduce both manual and automatic data collection methods coupled
with training of the operators of OEE as a performance measure, and on various
parameters affecting the OEE outcome. Main reasons for this would be to qualify the
quality of input data in line with an increase in the competence of operators and creating
a better involvement of the operators in identifying potential performance loss factors as
well as providing system with accurate information.
Quantitative measurements for the OEE calculation were collected from a large number
of machines in the various industries under a period of three months. Machine
downtimes were registered with a use of computer by the help of the operators as
suggested by (Ahmad & Gani, 2015).
The researcher used the following instrument to collect data: RS-Production system,
voice recorder during interview and skype recording video for interview with night shift
employees. The researcher did not have control factors that might influence the
behaviour and performance of participant under study thereby reporting the outcome as
they are (Dezsö, 2012).
Furthermore, the researcher explained the purpose of study and the objectives to the
participants and assured their confidentiality. Interview questions were formulated in

Overall equipment effectiveness study
9
English because it is medium communication language in Durban South (Prospecton)
manufacturing industries.
1.6.2.5 Data analysis.
The quantitative was handled through basic statistical analysis.
On one hand, a deductive approach was used to analyses the qualitative data based on
the structure predetermined by the researcher. The data was transcribed, and trends
deduced.
1.6.2.6 Importance and benefits of the proposed study
The following are the benefits of the current study:
• Identification of possible root causes of poor quality of manufactured products
• Propose quality improvement strategies and solutions to the existing problems
• Propose better methods of improving the quality of products
• Suggest methods of implementing quality awareness culture in the factory
• Identifying necessary skills that can help in improving quality of products in a
manufacturing environment and
• Identify factors that will help the company improve its manufacturing performance
Heading 3
1.7 Ethical consideration.
Staff members such as operators, artisans and supervisors face ethical challenges
when carrying out their duties. According to Harriss, (2013), when employees are used
as study participants during investigating research care was exercised because the
rights of individuals which need to be protected.
1.7.1 Principles of research ethics.
Research ethics observed in this study are in accordance with those stated by Denzin,
(2016) namely the principles of beneficence, respect for human dignity and of justice.

Overall equipment effectiveness study
10
1.7.2 The law of beneficence.
The law of beneficence protects the participants from freedom from being harmed, the
risk benefits proportion and freedom from abuse. Participants were informed that they
were not obligated to answer question which they were uncomfortable with.
Furthermore, they were given liberty to ask questions to eliminate any uncertainty and
to make them feel unrestricted. Clarifications were provided to operators concerning
their right not to partake in this investigative study.
1.7.3 The law of respect for human dignity.
The law covers the right to self-determination and expose. The right to self-
determination was tracked by providing the participants with the right to stop
participating if they were uncomfortable or not keen to answer specific questions and
not to participate at all if they are not interested. The participants were informed of their
right to refuse from participating.
1.7.4 The law of justice
The law of justice covers the right to fair treatment and concealment. The participants’
values, belief, life style and habits were respected as part of the right to fair treatment.
The participants were interviewed one by one secretly and the data collected were
treated with anonymity.
1.7.5 Consent for conducting the survey.
Consent for conducting the survey was obtained from Lubrichem Company Director in
Durban. Each participant was completely made aware about the nature of the survey
and requested to participate. No compensation was paid, and no participant suffered
any mistreatment for declining to participate in the survey. Each participant who
concurred to participate signed a form.
1.8 Value-addition and limitations of the study
This study’s contribution shows what the degree (extent) of automated machines,
employees’ engagement is, and the possible link between engagement and the impact

Overall equipment effectiveness study
11
it has on the performance of the Overall Equipment Effectiveness of the company. This
type of study has never been conducted within this environment, and as such a valuable
contribution could be made to more effective performance management within this
context.
The use of RS-Production system in the research constitutes a limitation. At best, these
relationships were analysed and described, no causality is established. Therefore, the
establishment of relationships in the study serves only to set-up certain patterns which
can be compared with previous theoretical research regarding the chronological
relationships of the different variables being studied (Wohlwill, 2016).
Another limitation is that the study was done using a sample of four division of the
Lubrichem Company and might not represent the Petrochemical industry.
The layout of the whole study is summarized below.
1.9 Layout of the study
This study is divided into five chapters:
• Chapter one introduced the content of the paper and explained why the topic was
chosen for the research. The chapter presented the problem statement, the
research goals, methods and research limitations.
• Chapter two literature review done by other company
• Chapter three reports the research method that was employed to achieve the
goals of the research project. Aspects that will be covered include research
design, measuring instruments that will be used to gather data and then data
analyses techniques will be discussed.
• Chapter four focuses on the results of the study. The results were then discussed
by focusing on the implications of the findings.

Overall equipment effectiveness study
12
• Chapter five discusses the conclusion reached resulting from the study as well as
any recommendations that can be made to management and recommendations
for future studies.
1.10 Chapter summary
Chapter one provided the background and motivation including the problem statement,
primary and secondary objectives, scope, research methodology to be utilised,
limitations and layout of the study.

Overall equipment effectiveness study
13
2 CHAPTER 2: LITERATURE REVIEW ON OVERALL EQUIPMENT
EFFECTIVENESS (OEE)
This chapter outlines the theoretical references used during this study. The theoretical
frame work involves Total Productive Maintenance (TPM) method which directly forces
machines operators to participate in preventive maintenance of the machines (Poduval
et al., 2015:310). TPM is measured using the metric tool called Overall Equipment
Effectiveness (OEE). The objectives of TMP are to eliminate machines breakdown,
unplanned stoppages, waste, inefficiency of manpower and incidents. OEE identifies
losses and categorize them into three factors which are quality, availability and
performance.
2.1 Introduction
Stakeholders and company directors expect machines to operate at 100% capacity and
at their full capacity with good high quality of production. However, this is somewhat
impossible due to process losses which are unplanned as well as planned. According to
the Japan Institute of Plant Maintenance (JIPM), Total Productive Maintenance (TPM) is
a strategy to increase effectiveness of the machines in operation in the production
environment (Jain et al., 2015:506). The OEE values were adopted from the Japanese
model.
According to Law, (2015), OEE has the following list of benefits:
• Measurements clarification between results and effort.
• Measurement creates a common language.
• Measurement continuous improvement.
• Measurement for motive of change.
• Measurement simply delegation.
• Measurement for identifying problems.
• Measurements to manage focused management.
• Measurements to benchmark (comparison).
Overall equipment effectiveness study
14
OEE measurement can be used within any manufacturing environment because it can
measure the first performance of the manufacturing machines which creates platform to
benchmark for continues improvement (Afy-Shararah et al., 2018:2099).
2.2 Total Productive Maintenance (TPM)
The Japanese modified productive maintenance (PM) and preventive maintenance
(PM) concept and called it Total Productive Maintenance. According to Szewczak and
Piekarczuk (2016:680), the founder of TPM philosophy collected the information of
different tasks to optimize efficiency using maintenance with the assistance of the
machines operators.
According to Ross (2017), top management and employee empowerment as well as
commitment should work as a team to have continuous improvement and to eliminate
waste. Machine maintenance team responsibilities are directly reduced as the results of
team work (Katzenbach & Smith, 2015). When team members are effective, they don’t
disturb each other because they are focused on continuous improvement and team
work (Goldratt & Cox, 2016). The machine operators feel empowered using TPM and
they strive for not having defects and no breakdown.
Total Productive Maintenance is described as follows:
Total, that stands for;
• Involving everyone who works in the organisation and sharing of skills through
collaborations.
• Elimination of defects, incidents and breakdowns.
Productive
• Certain task can be performed during production.
• Minimising problems during production.
• Exceed customer’s expectations.
Maintenance
• Restoring machines to Original Equipment Manufacturers (OEM) standard.

Overall equipment effectiveness study
15
According to Jain et al. (2015:505), Japan Institute of Plant Maintenance (JIPM)’s
introduced TPM pillar initiatives to be implemented to improve machines to run
smoothly. Below are the eight pillars of TPM.
Development management
• Eradicate problems as much as possible when running new machines.
• Learn from the existing machines.
• Bring new idea to improve maintenance.
Office TPM
• Increase synergy between businesses.
• Empower employee to take decision.
• Solutions to lower the cost.
• Improve housekeeping 5S in the offices.
Safety, health and environment
• Promote safe working conditions and environment.
• Eliminate injuries and incidents.
• Provide Standard Operating Procedures (SOP)
Education and training
• Imparting technical training on new technology.
• Empower employees to perform different task.
• Promote career path and succession plan.
• Evaluate skills and update to be relevant.
Quality maintenance
• No wastes.
• Address machines problem.
Planned maintenance

Overall equipment effectiveness study
16
• Use maintenance planning for the machine.
• Implement check list.
• Improving MTTR and MTBF
Focused improvement
• Identify and eliminate losses.
• Use 2W and FMEA analysis to find the root cause.
• Reach improved machines target.
• Increase OEE on production machines.
Autonomous maintenance
• Empower operator to own the machines.
• Lubricate, clean, adjust, tighten and inspect production machines.
2.3 Introduction to Overall Equipment Effectiveness (OEE)
Overall equipment effectiveness is a metric that uses numbers (quantitative) to measure
productivity of the manufacturing machines. This tool measures unknown costs and
those costs that are not applicable to the machines (Baumers et al., 2016:198)
In the manufacturing environment machines are expected run 100% with high quality
production and at full capacity. It is impossible to achieve 100% availability and quality
on the machines due to unforeseen circumstance that are unplanned and sometimes
with planned circumstances.
2.4 Definitions of OEE
Overall Equipment Effectiveness (OEE) is part of total productive performance (TPM)
philosophy introduced by Seiichi Nakajima in the 1980s’. It is a measurement tool used
on TPM
• Machine failure or breakdown.
• Adjustment and set-up.
• Minor stoppages or idling.

Overall equipment effectiveness study
17
• Speed losses or reduced speed.
• Defect.
• Rework
(Bakri et al., 2012)used 85% as the benchmark or OEE value which acceptable
worldwide. It was measuring components such as:
• Availability rate at 90%.
• Performance rate at 95%.
• Quality rate at 99%.
After 1988, a lot of research was conducted to find and clarify the best levels of quality,
performance and availability for high volume machines. According to Pinto and
Goldberg, (2017) OEE value which is more than 50% was acceptable for benchmarking
purpose.
On one hand, Domingo and Aguado (2015), stated that an acceptable OEE values
should be between 60% and 70% while Singh and Clements (2018) argued that OEE
values between 30% and 80% are acceptable for benchmarking.
According to Braglia and Frosolini (2016), a 68% OEE value was acceptable as the
average benchmark. However, this was very low as compared to 95% rate as found by
Domingo and Aguado (2015). A performance rate of 68% contributed to time losses and
idling due to small stoppages and this led to greater losses that were worsened by
availability losses.
2.5 The Purpose of OEE
The values of OEE can be used for benchmarking in any manufacturing environment.
The initial results of OEE values can be compared with the current obtaining values to
measure and propose the possible improvement to be made, as posited by Lee and
Bagheri (2015).

Overall equipment effectiveness study
18
The application of OEE values can be used to differentiate performance between
machines. According to Maskell and Baggaley (2016), poor performing machines can
be separated from high performing one and prescriptive measures applied to remedy
the situation.
Furthermore, OEE can be used for practical lean accounting: a proven system for
measuring and managing the lean enterprise. In this vein, OEE can be used as the
framework to pinpoint and improve certain aspect of the manufacturing machines.
2.6 Chronic and sporadic disturbances
The OEE metric is used to identify machines that are not effective, machines that are
not adding value, machines that are wasting the resources and identify losses. These
losses, called manufacturing disturbances are divided into two (McDowell & Michaletz
2017) namely;
• Chronic disturbances; and
• Sporadic disturbances.
According to McDowell & Michaletz (2017), chronic disturbances are hidden, small and
confusing because they are the results of the sub-cause. They occur repeatedly and
have high cost because the machine can’t be used all the time due to consistence
problem.
Chronic disturbances are latent and difficult to identify because they are ‘factory defects’
(Original Equipment Manufacture did not see it as well). The characteristics of chronic
disturbance should be placed under hidden losses or obvious losses (McDowell &
Michaletz, 2017),
Table 2.1: Below is the characteristic of table of chronic disturbance.
Loses Obvious losses Hidden losses
Sporadic breakdowns ✓ ✓

Overall equipment effectiveness study
19
Chronic breakdowns
Setup and adjustment ✓ ✓
Idling and minor stoppages ✓
Speed ✓
Sporadic quality defects
Chronic quality defects
✓ ✓
Figure 2.1: Production performance losses because of chronic and sporadic disturbances
(Andersson, Bellgran, 2015).
2.7 Six big losses of OEE
According to McDowell and Michaletz (2017), OEE was introduced with an intention to
eliminate all defects and breakdowns in the manufacturing industries. The intended
benefits were high production, high quality, low inventory cost, increase in manpower
efficiency and availability.
McDowell & Michaletz (2017) suggested six big losses which cause unplanned
downtime losses and affects machine availability for production.

Overall equipment effectiveness study
20
Figure 2.2 Overall equipment effectiveness and Computation procedure (Domingo and
Aguado, 2015)
2.8 Evolution of OEE
OEE has been defined by different authors. The first author to define OEE was
McDowell & Michaletz (2017). Other authors came with different definitions over the
years.
Stange and Etz (2014), stated that the manufacturing industry competitiveness depends
on productivity and availability of machines while Jonsson, Stange and Etz (2014),
stated that OEE is a tool to measure losses in the manufacturing disturbances which
are chronic or sporadic. On one hand, Pai and Srinivas (2016), in their research stated
OEE is a quantitative tool to measure productivity in different machines.

Overall equipment effectiveness study
21
2.9 Calculating the OEE of the machines
The process of identifying ways to improve machine OEE systematically requires the
calculation of OEE step by step. The following calculation of OEE was done in the
Lubrichem manufacturing company which operate 24 hours a day.
Table 2.2 Shift Time Table
Shift Shift Duration (Time) Planned stoppages Downtime Remarks
Shift 1 06:00 to 14:00 Lunch 12.00 ~ 01.30 90min
Shift 2 14:00.30 to 22:00 Lunch 12:00 ~ 13:30 90min
Shift 3 22:00 am to 06:00 am Lunch 00.00 ~ 01.30 90min
Production Data.
Operating Time= Shift length x 90 min
= 24hous x 60min
= 2160 min/day
Working days in a month.
= 25 x 2160
= 112 320 min/month
Planned down time.
= Cleaning+ Downtime+ Meeting Time
= (30 +270 + 15) min
= 315 min/day
A sample calculation for the bottleneck machine PAAC 06 is given below. The other
machines values are calculated and recoded on the table below (refer to Table 2.1)
PAAC-06 Machine:
Planned stoppage time = Setup/changeover + Break time.
= 300 min + 315 min

Overall equipment effectiveness study
22
= 615 min/day
= 615min x 25
= 15375 min/month
Unplanned down time = Mechanical breakdown + Electrical breakdown + Safety device
breakdown
= 52.40 Hrs + 18.40 Hrs + 19.40 Hrs = 90.20 x 60
= 5412 min/month
Total Production Parts= 195 600 Nos.
Total Rejection Parts = 21 600 Nos.
Good Parts = Total Production Parts – Total Rejection Parts.
= 1 95 600 – 21 600
= 1 74 000 Nos.
Ideal Run Rate = 12 parts/min
Production time = Operating time – Down time.
= 36000 – 15375
= 20625 min
Operating Time = Planned Production Time – Unplanned Down Time.
= 20625 – 5412
= 15213 min
OEE Factors.
Availability = (18213/ 20625) x 100
= 88.09%
Performance = (195500 / 18213) /12 x 100
= 89.45%
Quality = (173900 / 195500) x 100

Overall equipment effectiveness study
23
= 88.95%
Therefore, OEE=77.09x 89.45x 88.95
= 70.08%
2.10 OEE formulation
According to Nakajima (1988), OEE is has three factors and it is calculated in
percentages with the formula below.
(OEE)= Availability (A) x Performance (P) x Quality (Q) x %
The acceptable worldwide value is 85% which is consist of:
▪ Availability 90.0 %
▪ Performance 95.0%
▪ Quality 99.9%
▪ Planned working hours of EE is calculated as follows:
▪ Planning factor OEE = Planning factor x (Availability x Performance x
▪ Quality) rate
▪ Net operating rate = Number produced x Actual cycle time
▪ Quality rate = Total number produced – Number Scrapped
2.10 Data collection for OEE
Collection of data refers to the registration of values for a certain variable. According to
Wickham (2016), data can be registered manually or automatically, and, in some cases,
there can be done simultaneously. Posavac (2015), suggest automatic measures used
to collect information are probably relevant in the long run.
The method used in the collection of data is a vital aspect needed in the calculation of
OEE. Data collection can vary from manual to much automated, as correct input of
Overall equipment effectiveness study
24
parameters acquired from the production system is essential for OEE calculations
(Andersson & Bellgran, 2015).
Manual data collection which mainly happens in low-tech industries consists of a
registry, where operators are required to fill in the causes and duration of breakdowns
as well as reliable comments about minor stoppages and speed losses. In high-tech
industries, an automatic OEE calculation system is governed by sensors linked to the
equipment, automatically recording the start time and duration of stoppages while
prompting the operator to make available the system with correct information about their
specific downtime causes. With automatic method, opportunities are made available for
operators to set up lists of potential downtime causes, scheduling the available
operating time and constructing an automatic OEE calculation for any specific time.
The data inputs are provided in the system. It is not only possible to provide OEE
results but makes it easier to retrieve a variety of reports of production performance and
visualization of the performance results from the system. However, too much
information in the system can be a waste of time for the operators and they will have to
search for each downtime cause. Reluctance against data collection from operators and
foremen are some of the major challenges faced by many industries.
Gugerty and Karlan (2018) found out that it was necessary to convince operators as
some do believe that some disturbances have a major impact on efficiency which later
measurements show that to be completely wrong. With automatic data collection, the
system is quite expensive, complex and is collected at an aggregated level. On the
contrary, manual data collection can be very detailed as losses can be fully examined.
It is necessary to introduce both manual and automatic data collection methods coupled
with training of the operators of OEE as a performance measure, and on various
parameters affecting the OEE outcome. The main reasons for this would be to qualify
the quality of input data in line with an increase in the competence of operators and
creating a better involvement of the operators in identifying potential performance loss
factors as well as providing system with accurate information. Quantitative

Overall equipment effectiveness study
25
measurements for the OEE calculation were collected from many machines in the
various industries under a period of three months. Machine stops were registered with a
use of computer by the help of the operators as suggested by (Gumus & Topaloglu,
2016).
2.11 Set-up time
Toyota was unhappy with the waiting period of the cars for customer and they had to
introduce lean manufacturing concept on the manufacturing process. According to
Gumus and Topaloglu (2016), it is important minimise the cost of machines setup by
introducing lean manufacturing because it reduces waiting time.
Lean manufacturing allows the preparations of raw materials to be brought closer to the
machines before the actual production start. Certain steps such as testing, inspections,
setting and loading of the new tool can be eliminated, the whole process can improve
production, reduce waiting time, improve efficiency and effectiveness of the machines to
exceed customer expectation. The following are the most common setup delay:
• Program failure
• Tool change
• Waiting for raw material.
• Searching or waiting for missing tool.
• Machine failure.
• Cleaning machines
• Material loading.
• Setup (tools).
• Inspections
According to Maskell and Baggaley (2016), reduction of machine setup time increases
the potential to produce more products for the customer and remove bottlenecks on the
process.

Overall equipment effectiveness study
26
2.12 Cycle time
Cycle time corresponds to the time required to produce a product under continuous
production. According to Luo and Wang (2015), cycle time is the running speed of the
machines which is divided into short and long cycle. Good cycle time improves the
machines to produce more with continuous improvement.
2.13 Single Minute Exchange of Dies (S.M.E.D)
SMED was introduced by Shigeo Shingo in 1950. There is a high need to exceed
customer expectation worldwide especially while manufacturing high volume and small
sized products. The process of SMED eliminates waste by improving efficiency and
effectiveness in the manufacturing industries by bringing all raw materials close to each
which are required to complete the product (Thompson & Moroni, 2016).
The term “single minute” is referred to as spending less time (10min) to start up the
machines or to change production. Below are the advantages of applying SMED;
• Lowering cost by preventing defects and unnecessary inventory.
• Rapid change that improve quality instantly.
• Lower the use the machine.
• Lower batch size production
• Improve flexibility, changeover and throughput.
According to Thompson & Moroni, (2016), changeover or setup is post adjustment or
preparation done once before or after the changeover. It is divided into:
• Internal setup that take place during shutdown.
• External setup that take place when the machine under operations.
SMED system is implemented in any setup using the following four steps (Thompson &
Moroni, 2016).

Overall equipment effectiveness study
27
Step 1: Identifying and separating external and internal.
External set up are more applicable for operators to minimise the chances of making
rejects by adjusting and setting the running machines. Internal set is applicable to
technicians of the machines to perform maintenance and clean the machine whiles the
machine is on shutdown.
Step 2: Converting internal setups to external setups.
Running time of the machines is increase based on the system of converting internal
setup time to external setup.
Step 3: Reorganizing all aspects of setup.
5S and good housekeeping is the pillar behind reorganising all aspect setup because
everything needs to be its place with less destruction.
Step 4: Performing parallel setup activities.
The components used on the machines need to conform to certain standard that include
the raw materials. Set up process needs to be documented in a form of check list or
SOP.
2.14 Five (5) WHY’S analysis
Five (5) Why’s analysis is a technique which is used to probe the root cause of the
problem with question asking method. According to Dave and Hämäläinen (2015), five
(5) whys identify defects or the root cause of the problems. Five (5) whys does not solve
the problem as it is an analysis tool to identify the main reason why there is problem
and why it originated.
The problem needs to be clearly defined and it can be used by anyone even if they
don’t have experience in the department but follow the systematic why of asking the
problem. It is effective, simple, engaging, flexible and comprehensive. Below is how to
use five (5) why questioning method.

Overall equipment effectiveness study
28
Statement: The overhead crane is always tripping power supply.
Why 1
Why did the overhead crane trip the power supply? Because of damage cable
Why 2
Why is the cable damaged? Because it was loose and touch the crane track.
Why 3
Why did the cable lose? Because it wasn’t fastened inside the cable trunk.
Why 4
Why was it not fastened on the cable trunk? Because the technician did not
comply to wiring code.
Why 5 and Root cause
Why did technician not comply to wiring code? Because he COC issues to
confirm good workmanship.
2.15 Fishbone (Cause-Effect) Diagram
The Cause-Effect Diagram is also known as Ishikawa diagram. It is used to identify the
root cause of a problem. Kauro Ishikawa was accredited for championing this technique
in 1960 (Juran). This technique is used to analyse a problem systematically using the
cause and effect approach. It provides the relationship link effects and multiple sources
of the cause. The process requires the team involvement in brainstorm using the
experience of the process but allowing the systematic approach to guide them
(Saldaña, 2015).
Cause-Effect diagram is the best tool to qualitative and quantitative approach
(Bloomberg and Volpe, 2018). Sub-causes of the main problem are structured on
heading such as materials, man, money, machines and methods to identifying the
potential causes. Below is the Cause-effect diagram of unscheduled returns identifying
causes for spares shortages.

Overall equipment effectiveness study
29
Figure 2.3: Fishbone diagram of unscheduled returns, (Cheh, 2014).
2.16 Chapter Summary
This chapter outlined the history of quality, quality performance, market and financial
performance, product quality and TQM practices and quality culture within
manufacturing. The following chapter discusses the research methodology used in this
study and concludes with a summary.

Overall equipment effectiveness study
30
3 CHAPTER 3 RESEARCH APPROACH
3.1 Introduction
This chapter outlines the how methodology of this study was planned and performed. It
discusses the data collection methods.
The approach is a combination of qualitative and quantitative nature. According to Bell
and Bryman (2018), it is essential to choose the correct methods of collecting the data
of the research. Quantitative and qualitative data collection techniques are the common
to be used in scientific research
3.2 Quantitative method
This method deals with emphasized and generated numerical information. Quantitative
method produces good results for the data collected in group sample and comprising of
data information from group sample as stated by Darmer and Freytag (1995). It
presents good understanding of theory and research. Tezel and Barker (2016), defined
it as “explaining phenomena by collecting numerical data that are analysed using
mathematically based methods (in particular statistics)”.
Table 3.1 below shows understanding of Quantitative methods.
Research
phases
Quantitative data collection
Sampling • Reduce sampling by adequate size of sampling
• Random sampling
Permissions • Individual authorising access to site.
• Board review
• Individual
Data sources • Check list.
• Instrument
• Public document
Recording data • Instruments with valid and reliable scores.
Overall equipment effectiveness study
31
Administer data
collection
• Attend to ethical issues
• Standard procedure
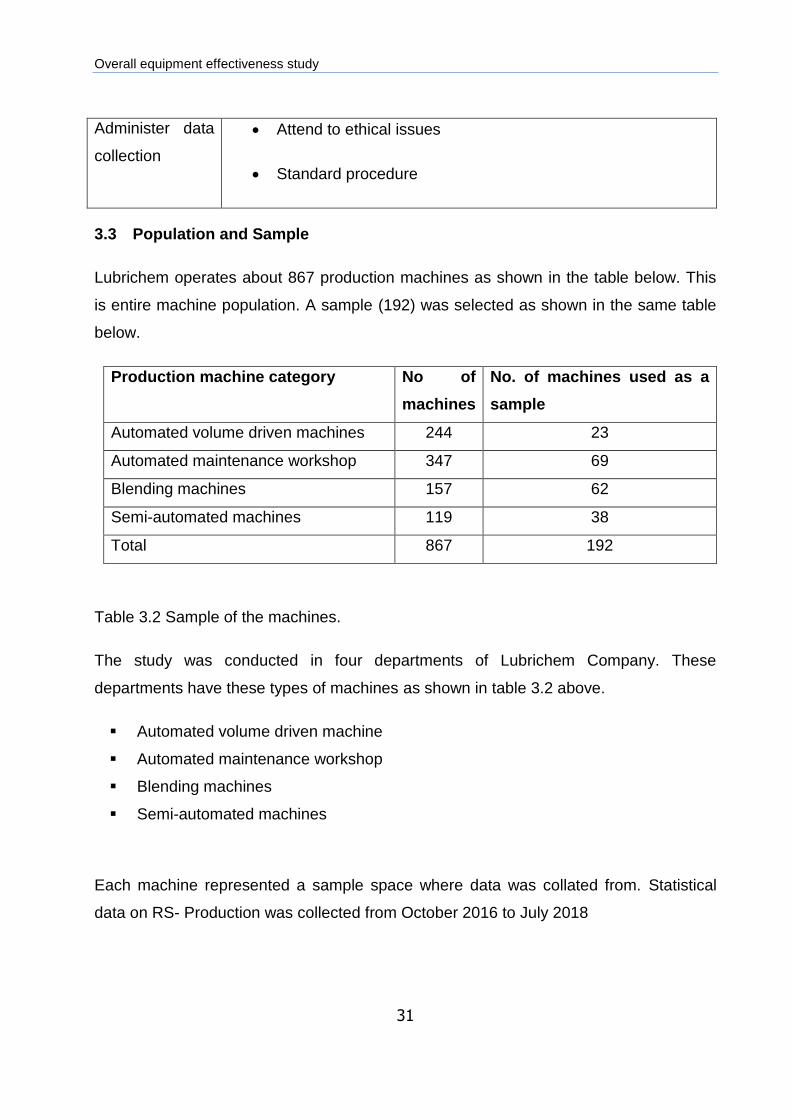
3.3 Population and Sample
Lubrichem operates about 867 production machines as shown in the table below. This
is entire machine population. A sample (192) was selected as shown in the same table
below.
Production machine category No of
machines
No. of machines used as a
sample
Automated volume driven machines 244 23
Automated maintenance workshop 347 69
Blending machines 157 62
Semi-automated machines 119 38
Total 867 192
Table 3.2 Sample of the machines.
The study was conducted in four departments of Lubrichem Company. These
departments have these types of machines as shown in table 3.2 above.
▪ Automated volume driven machine
▪ Automated maintenance workshop
▪ Blending machines
▪ Semi-automated machines
Each machine represented a sample space where data was collated from. Statistical
data on RS- Production was collected from October 2016 to July 2018

Overall equipment effectiveness study
32
3.4 Data collection instrument.
Collection of data refers to the registration of values for a certain variable. Data can be
registered manually or automatically, and, in some cases, this can be done
simultaneously. Xu and Croft, (2017) suggested that automatic measures used to
collect information are probably relevant in the long run.
The researcher used electronic RS-production system as methods of collecting the
data. The primary data was collected through RS-Production system at Lubrichem
Company. This study is a scientific research because it analyses the production data
differences and relationships. The RS-Production system data was used to compute the
following
• Total time registered
• Set up/changeover times per piece
• Cycle time recorded ranges
• Aggregated stoppage reasons
• Average OEE values for the Lubrichem Company
Throughout the research, discussions and the RS-Production system were populated in
the tables and brainstormed. The research questions were answered using RS-
Production system figures, discussions and analysis and data subsequently transcribed.
The OEE measurements depend on the source of data including how it is collected. The
data has to be accurate and not biased according to Taylor (2018). The method used in
the collection of data is a vital aspect needed in the calculation of OEE.
Data collection can vary from manual to much automated, as correct input of
parameters acquired from the production system is essential for OEE calculations (Xu
and Croft, 2017). Manual data collection which mainly happens in low-tech industries
consists of a registry, where operators are required to fill in the causes and duration of
breakdowns as well as reliable comments about minor stoppages and speed losses.
Overall equipment effectiveness study
33
According to Vogel-Heuser and Rösch (2016), in high-tech industries, an automatic
OEE calculation system is governed by sensors linked to the equipment, automatically
recording the start time and duration of stoppages while prompting the operator to make
available the system with correct information about their specific downtime causes. With
automatic method, opportunities are made available for operators to set up lists of
potential downtime causes, scheduling the available operating time and constructing an
automatic OEE calculation for any specific time period.
As long as the data input are provided in the system, it is not only possible to provide
OEE results but makes it easier to retrieve a variety of reports of production
performance and visualization of the performance results from the system.
However, too much information in the system can be a waste of time for the operators
and they will have to search for each downtime cause. Reluctance against data
collection from operators and foremen are some of the major challenges faced by many
industries.
Wickens and Holland, (2015) found it necessary to convince operators as some do
believe that some disturbances have a major impact on efficiency which later
measurements show that to be completely wrong. With automatic data collection, the
system is quite expensive, complex and is collected at an aggregated level. On the
contrary, manual data collection can be very detailed as losses can be fully examined.
It is necessary to introduce both manual and automatic data collection methods coupled
with training of the operators of OEE as a performance measure, and on various
parameters affecting the OEE outcome. Main reasons for this would be to qualify the
quality of input data in line with an increase in the competence of operators and creating
a better involvement of the operators in identifying potential performance loss factors as
well as providing system with accurate information.
Quantitative measurements for the OEE calculation were collected from a large number
of machines in the various industries under a period of three months. Machine
downtimes were registered with a use of computer by the help of the operators as
suggested by (Ahmad & Gani, 2015).

Overall equipment effectiveness study
34
The researcher used the following instrument to collect data: RS-Production system,
voice recorder during interview and skype recording video for interview with night shift
employees. The researcher did not have control factors that might influence the
behaviour and performance of participant under study thereby reporting the outcome as
they are (Dezsö, 2012).
Furthermore, the researcher explained the purpose of study and the objectives to the
participants and assured their confidentiality. Interview questions were formulated in
English because it is medium communication language in Durban South (Prospecton)
manufacturing industries.
3.5 Case study design
The data was gathered by RS-Production system software after the interview with the
employees of Lubrichem Company. The RS-Production was used to collect secondary
data because it is a software that record all the stoppages and the alarm or the cause of
the downtime. The RS-Production system can collect the data and perform automatic
OEE calculations
Figure 3.1 below shows RS-Production connection to the manufacturing process.
Figure 3.1: RS-Production system connected to the machines.
The figure above shows how the RRS-Production system software is connected to the
production machines and how it collects the data. The RS Blackbox is connection to
the operator monitor and machine A and B. The Blackbox read all the activities

Overall equipment effectiveness study
35
(including, stoppages, alarm, rejects, production figure and availabilities of the
machines).
Mechanical signals are used for
• Cycle Signal
• Operating Signal
• Defects Signal
• Processing signal
• Automatic Coding Signal
The operators note the deviations, disturbance and production figures on the monitor.
Data collected by RS Blackbox is automatically stored on the server for future reference
and record keeping. The server will store the date in the EXCELL spread sheet that has
all the formulas to calculate OEE and analysing the results. The system helps
Lubrichem Company to improve efficiency and understand their losses.
3.6 Analysis
The quantitative aspect was analysed through statistical approach while the deductive
approach was used for the qualitative results. In this study, the qualitative data provided
a good background for the problem statement and supported the quantitative approach
by making data more understandable (Rubin and Babbie, 2016).
The project took 20 weeks which required lot of planning. The author used the Gantt
chart for plotting unplanned and planned meetings to ensure a seamless research.

Overall equipment effectiveness study
36
Table 3.2 Draft table of project planning
Week Task
1 Intrdoction to project (Lubrichem company)
2 to 3 Meeting with Lubrichem company and project planning
4 to 5 Literature studies
5 to 6 Meeting, data collection and literature studies
7 to 8 Meeting, data collection and literature studies
9 to 14 Meeting and analysis of thesis.
15 to 20 thesis
3.7 Validity and Reliability
According to Graban (2016), validity is framework of improving engagement of
communication between all the employee and outline reactions of deviations in the
production process. Zimbardo and Boyd (2015) state that the validity as standard of
prevent new employees to minimise the chances of making mistakes.
Validity can be achieved in the following ways:
• Face validity: experience people are requested to base on their years of
knowledge.
• Concurrent validity: relevant question to the study.
• Predictive validity: new measure of job satisfaction.
• Construct validity: deduce hypotheses from the theory that is relevant to the
concept.
• Convergent validity: measures of the same concept developed through other
methods.
According to Streiner and Norman, (2015), reliability is continuing measurement of
concept using internal reliability, stability and inter-observer consistency.
• Internal reliability: determine whether respondents’ scores on any one indicator.
• Stability: asking the stability of the measure over time.
Inter-observer consistency: lack of consistency in decision making

Overall equipment effectiveness study
37
According to Weimer and Vining (2017), the interview question needs to be simple and
straight forward that lead to limiting the participant from providing the wrong answer.
The following control was in place (data collection, conclusion and interpretation) to
ensure validity and reliability achieved in all steps of the research process. Raw data
was analysed with descriptive approach to improve transparency when there were
setbacks

Overall equipment effectiveness study
38
4 CHAPTER 4 RESULTS, DISCUSSION AND ANALYSIS
4.1 Introduction
This chapter presents the results of the OEE measurements performed in this case
study and a discussion on the qualitative interviews.
4.2 Data collection
The study was conducted in four departments of Lubrichem Company mentioned on the
table below. The table represents the statistical data that was collected:
Production machine category No of
machines
No. of machines used
as a sample
Automated volume driven machines 244 23 [FB type]
Automated maintenance workshop 347 69 [MW type]
Blending machines 157 62 [AU]
Semi-automated machines 119 38 [308, 184, 149, S3
and E6]
Total 867 192
Table 4.1: Four department of Lubrichem Vs data collected
The data collected was further tabulated and presented, after applying the mathematical
formulas presented in the literature, as
• Total time registered (table 4.2)
• Set up/changeover times per piece (table 4.3
• Cycle time recorded ranges (table 4.4)
• Aggregated stoppage reasons (table 4.5)
• Average OEE values for the Lubrichem Company (table 4.6)
Total scheduled production time 357190 hours

Overall equipment effectiveness study
39
Total operation time 170925 hours
Total downtime 186265 hours
Table 4.2: Total time registered
Types of set-up (Changeover) time Number of pieces
Single set-up time Less than 5 pieces
Short set-up time 5-25 pieces
Medium set-up time 25-200 pieces
Long set-up time Greater than 200 pieces
Table 4.3: Setup/Changeover times per piece.
Types of cycle times Time
Single cycle time Less than 2 seconds
Short cycle time 2-60 seconds
Medium cycle time 1-5 minutes
Long cycle time Greater than 5 minutes
Table 4.4: Cycle time recorded ranges
Total Availability 47,9%
Average Availability 49% without considering Total schedule
production time
Average OEE 43,5% without considering Total schedule
Table 4.5 Total Availability and OEE for all four departments.

Overall equipment effectiveness study
40
The results of downtime losses and stoppage reasons for all four departments are
summarised in the table 4.5 below. This same data is shown in the graph in figure 4.1.
Downtime losses
(Aggregate Stoppage
Reasons)
Time Percentages of Losses
Step/Changeovers 17591 hours 28.4%
Machines/Techniques 9354 hours 15.1%
No reason code / /
Shift changes and breaks 3641 hours 5.9%
Unplanned production 13669 hours 22.1%
Planned
service/Maintenance
4277 hours 6.9%
Other planned stops 1946 hours 3.1%
Lack of accessories 549 hours 0.9%
Lack of personnel 4631 hours 7.5%
Micro stoppage 2985 hour 4.8%
Personal time 82 hours 0.1%
Problem with internal
materials
1535 hours 2.5%
Problem with external
materials
1041 1.7%
Quality issues/rework 634 hours 1.0%
Total 61933 hours 100%
Table 4.5: Aggregated stoppage reasons and time of downtime losses.
The OEE values were calculated as follows:
Production machine category Average EE

Overall equipment effectiveness study
41
Automated volume driven machines 49,9%
Automated maintenance workshop 49,8%
Blending machines 38,7%
Semi-automated machines 43,3%
Table 4.6: Average OEE values for the Lubrichem Company.
The table 4.7 below shows the quality values compared with the other OEE parameters.
Production machine
category
Average
availability
Average
performance
Average quality
Volume driven machines 58,76% 82,60% 100%
Maintenance workshop 55,98% 89% 100%
Blending machines 44,70% 89,70% 95,9%
Semi-automated machines 44,90% 96,20% 99,8%
Table 4.7: Highest average OEE parameter for the four departments
The results show that low availability negatively affects the OEE values.
Production machine
category
Average
availability
Average
performance
Average quality
Volume driven machines 58,76% 82,60% 100%
Maintenance workshop 55,98% 89% 100%
Blending machines 44,70% 89,70% 95,9%
Semi-automated machines 44,90% 96,20% 99,8%
Table 4.8: Lowest average OEE parameter for the Lubrichem Company

Overall equipment effectiveness study
42
4.3 OEE of results and discussion for all four departments
The general response from the 16 respondents concurred that the machines cannot run
for 24hours without breakdowns or unplanned stoppages. Annexure A gives a tabular
summary of the questions and the responses.
The data from the RS Production was summarised in figure 4.1 below.
Figure 4.1: Percentage loses within all the machines.
The above diagram shows the downtime reasons and the contribution of each reason in
section of the plant.
Changeover/Setup stoppages was the biggest contributor with 28.4%, followed by
unplanned production at 22.1%. These two reasons accounted for over 50.5% of the
stoppage time.
The third reason was losses due to techniques or machines which were at 15,1%,
shortage of operations and maintenance personnel was at 7.5%. Therefore, the six
reasons accounting for 80% of all stoppages were

Overall equipment effectiveness study
43
• Changeover/Setup stoppages
• unplanned production
• techniques or machines
• Shortage of maintenance personnel
• Planned maintenance and service
• Shift changes and breaks
4.4 OEE results and discussion of automated volume driven machines.
The mean OEE results on the automated volume driven machines (FB14, FB15, FB44,
FB40 and FB46) are shown in figure 4.2.
Figure 4.2: OEE results of different automated volume driven machines.
The Overall Equipment Effectiveness analysis of different automated volume driven
machines between the month of October 2016 and March 2017 shows a huge increase
in average Overall Equipment Effectiveness values on the machines FB (14, 15, 44, 40
and 46).
Two specific machines (44 and 46) had a significant increase of OEE results from 0%
during the month of October to 81% and 76% respectively. The values of OEE variance

Overall equipment effectiveness study
44
were the results of availability, performance, planned factor and quality losses. Quality
and performance had the highest Overall Equipment Effectiveness values in the
automated volume driven machines.
The losses in the automated volume driven machines department were also collated.
The table below shows the percentage of all the losses with the different factors of the
OEE on the machines. Planned losses was 24% which were caused by
techniques/machines, break (lunch and tea time), shift changes, planned
maintenance/service, internal and external material, other planned stops.
Factors Losses Stoppage reasons Percentages
Availability Planned Losses Machines/Techniques 10%
Shift changes and
breakdowns
1%
Planned
serviced/Maintenance
5%
Other planned stops 2%
Lack of accessories 0%
Stoppage of
personnel
2%
Personal time 0%
Problem with internal
materials
4%
Problem with external
materials
0%

Overall equipment effectiveness study
45
Table 4.9: Average downtime losses for automated volume driven machines.
The availability losses on the machines from the above table were caused by the
unplanned production/ breakdown, production changeover and machines set up. These
losses contributed 24% and 14% respectively, summing up to a total of 38%.
4.5 OEE results and discussion of Automated Maintenance workshop.
All respondents raised the concern that they were unable to reach the production
targets because of the unavailability of the machines, continuous breakdown and poor
product quality. The RSP production data on the graph below shows that there were low
OEEs for the month of October 2016. However, since the implementation of Total
Maintenance Planning (TPM) in November 2016, the productivity, quality and availability
values have improved.

Overall equipment effectiveness study
46
The table below shows the average downtime for automated maintenance workshop for
machines MW6, MW40, MW39, MW21 and MW29.
Figure 4.3: OEE results over time for Maintenance workshop for automated machines
The maintenance workshops machines increased the Overall equipment effectiveness
values (quality, performance and availability) after implementing maintenance planning
within some of their machines. Among the machines sampled, the result of Overall
Equipment Effectiveness values on machines MW (6, 40, 39, 21 and 29) continuously
improved.
The machine MW 6 had the highest increase in Overall Equipment Effectiveness value
from 3.9% during October 2016 to 88.3% in March 2017. This was followed MW 39
whose value increased from 22.4% to 50.7% respectively.
The highest Overall Equipment Effectiveness value was 88.3% in October for MW 29
machine, highest values was different from months to months while maintenance
planning was gaining the effectiveness. The losses of Maintenance workshop machines
are classified and defined as planned maintenance.

Overall equipment effectiveness study
47
The total of planned related losses was 25% which were caused by
techniques/machines, breaks (lunch, and tea time) while attending to the machines,
shift handover, planned maintenance/service, planned stoppages, lack of accessories
like spares and tools and shortage of staff/personnel.
The table below show the results Automated Maintenance workshop losses
Table 4.10 Downtime losses for Automated Maintenance workshop.
The table above shows average Maintenance workshop losses which were availability
(planned and unplanned losses), performance and quality losses. The cause of
availability losses was unplanned/breakdowns, machines changeover/setup and
production changeover.
Furthermore, these losses were up to 16% of which 3% was directly caused by
breakdowns and 13% of machines set ups and production change overs. Performance

Overall equipment effectiveness study
48
or micro losses were 5% while quality issues or reworks were 2%. The unknown losses
accounted to 52% of the downtimes.
4.6 OEE results and discussion of Automated Blending production machines
The mean OEE results on Blending automated production machines (AU 9, AU10,
AU19)
Figure 4.3: OEE results for Blending automated production machines
The OEE results of Blending automated production machines between October 2016
and March 2017 were recorded. There was a huge increase in average OEE values on
machines AU (9, 10 and 19).
The figure above shows Overall equipment effectiveness results of the machine AU (19
and 10) significantly improved to 50 %. Machine AU 9’s Overall equipment effectiveness
values increased to 46.3% in March 2017 as compared to October 2016.
The result of each of the three machines losses within the Blending automated
production machines were caused largely by techniques/machines, breakdowns, shift
handover and shift changes. Furthermore, issues like planned maintenance/service,

Overall equipment effectiveness study
49
planned stoppages, shortage of operations personnel, problems with internal and
external material, machines unplanned breakdown, unplanned production,
changeover/setups also contributed to the performance stoppages.
Table 4.11: Downtime losses for other Automated Blending production machines
Planned losses accounted for 37% while availability losses were 26% and machines
breakdown contributed 5%. In addition, production changeovers /setups resulted in 21%
stoppage time while performance losses were 3%.
However, quality was good because there were no were losses associated with it.
There was 34% of unknown losses.

Overall equipment effectiveness study
50
4.7 OEE results and discussion of Semi-automated production machines
The mean OEE results on Semi-automated production machines (308, 184, 149, S3
and E6) are presented below in figure 4.4
Figure 4.4: OEE results for Semi-automated production machines
In the semi-automated production machines, a total of 35 machines were used on this
research. Out of 35 machines E 6, S3, 184, 308 and 149 had a slight increase of
Overall equipment effectiveness values as from October 2016 until March 2017.
The value “0” indicates that there were no values of overall equipment effectiveness
recorded. The machines increase Overall equipment effectiveness as follows: 308, S3
and 149 was above 50%, machine 184 was below 50%, E6 was 0.3% during October
2016 and increase to 7% during March 2017.
The planned losses identified has negatively affecting Overall equipment effectiveness
amounting to 11% were caused by planned maintenance/service planned stoppages,
shortage of operations personnel and internal and external issues. The availability

Overall equipment effectiveness study
51
losses were unplanned caused by machines unplanned production, breakdown, setting
up of the machines and production changeover.
In addition, machine breakdowns were 13%, setting up of the machines was 11%.
Quality and performance losses were 0% while unknown losses were 65%.
Table 4.12: Downtime losses Semi-automated production machines.
4.8 Analysis and Discussion of the results
Overall equipment effectiveness results can be improved by focusing on the major
losses and ways to eliminate them. Unknown losses accounted for a significant amount
in all the types of production machines as shown in the table 4.13 below.

Overall equipment effectiveness study
52
Production machine category Unknown losses %
Automated volume driven machines 36%
Automated maintenance workshop 52%
Blending machines 65%
Semi-automated machines 34%
Table 4.13: Major losses all four-different section.
These major losses could have had a major influence on the results because it is
excluded during the calculation of the Overall equipment values in all four sections.
According to Maskell and Baggaley (2016), different measures should be included
during calculation of OEE because it makes it difficult to understand right measures in
the correct way. The unknown losses of semi-automated machines are lowest as
compared to the other sections.
Unknown losses can affect overall equipment effectiveness drastically because it is
unpredictable.
4.8.1 Analysis of Automated volume driven machines
The OEE value for the Automated volume driven machines was found to be 49. 9%.
This is directly influenced by the performance and availability rates of 58%, 60%, 76%
and 82% were as quality is 100%.
Some of the machines were affected by planned losses of 24%. Only a few individual
machines had good OEE results. The rest were affected by planned losses up to a total
of 24%. The following are losses that can be eliminated:
• Maintenance/Planned service can be eliminated with 5% by scheduling
production running time.

Overall equipment effectiveness study
53
• Shortage operations personnel can be eliminated with 2% by improving poor
planning.
• Problems with external and internal material can be eliminated with 4% by pre-
testing and verification before running production.
In the automated blending machines, unknown losses were 36%. This is a big concern
because it has major potential to affect the results of OEE in different ways as it is not
linked to the Overall equipment effectiveness factors.
Operators gave the reasons that they were not sure what attributed or system failure or
they forgot giving reasons due to reluctance, negligence and overloaded by work.
Training and development is required for employees because most of them thy have
basic qualification which results on lack on hands on and scientific knowledge of
problem solving the problem.
Availability losses in table 4.8 are the highest and it directly contributes negatively to
the Overall equipment effectiveness results. Availability losses were 38% which were
caused by breakdown and unplanned production on the machines, setting up and the
machine and changeover of production was 24% and 14% respectively.
Machines breakdown and unplanned production should have been separated to know
the exact contributing factor. Single Minute Exchange of Dies (S.M.E.D) method could
help to reduce changeover and set up losses. Cause-effect diagram can be utilized to
help identify breakdown causes and eliminate/reduce the 24% of machines breakdown
losses. Five (5) whys root cause analysis can be used to identify and list the reasons for
each loss.
4.8.2 Analysis Maintenance workshop for automated machines.
The Overall equipment effectiveness values were 49% and it is equivalent to that of
automated volume driven machines. It is influenced by the performance, availability and
losses rate of 98%, 55% and 89% respectively while quality is 100%. Planned losses

Overall equipment effectiveness study
54
affected most of the machines by 25%. Planned losses can be eliminated using the
following methods:
• Good planning can eliminate break, lunch and shift changes losses with 6%.
• Scheduling production time can eliminate maintenance or service losses with
4%.
• Good planning can eliminate shortage of operations personnel with 2%.
Unknown losses were 52% and it was the highest. Table 4.10 shows unknown loss as
highest after the Blending automated machines. The operators need to attend training
and development to address the issue. Planned losses were 25% from the automated
volume driven maintenance workshop. 5 whys root cause analysis can be used to
identify and list the reasons for each loss. Single Minute Exchange of Dies (S.M.E.D)
method could help to reduce changeover and set up losses. Cause-effect diagram can
be utilized to help identify breakdown
4.8.3 Automated blending machines.
The Overall equipment effectiveness values for the Automated blending machines was
43.3%. The OEE values were influenced by availability, performance and quality rate at
44%, 96% and 99.8%.
The OEE rate of individual machines was good but affected by planned losses of 37%.
Planned losses from automated blending machines are high as compared to other
sections. The following planned losses can be eliminated as follows:
• Scheduling production time can eliminate maintenance or service losses with
6%.
• Good planning can eliminate shortage of operations personnel with 10%.
Unknown losses were 34% and it was the lowest. If these losses were eliminated, it
would have enhanced the results positively. Planned losses were 37% from the
automated volume driven maintenance workshop. Five (5) whys root cause analysis
can be used to identify and list the reasons for each loss. Single Minute Exchange of
Dies (S.M.E.D) method could

Overall equipment effectiveness study
55
4.8.4 Semi-automated machines.
The Overall equipment effectiveness value of 33.7% was the lowest value compared to
the semi-automated machines. The losses are influenced by performance and
availability rates with 89.7%, 44% and 70% respectively while quality is at 95.9%.
Planned losses affected the other machines by 11%. Good planning could eliminate
shortage of operations personnel with 2%.
The highest losses were under automated blending plant at 65%. This is highest on all
the four sections. Planned losses are the lowest in all four different sections with only
11% of the losses. Improvement could be done to reduce planned losses due to
shortage of operations personnel by (4%), Availability losses with the machines
breakdown by 13% and changeover and machines setting by 11%. 5 whys root cause
analysis can be used to identify and list the reasons for each loss. The performance
factor was 0% and best as compared to other four sections.
5 CHAPTER 5: CONCLUSION AND RECOMMENDATIONS
5.1 Introduction
This study was conducted to analyse of overall equipment effectiveness within four
departments namely:

Overall equipment effectiveness study
56
• Automated volume driven machines,
• Automated maintenance workshop,
• Automated blending machines and
• Semi-automated machines by identifying all the losses.
Operations Equipment Effectiveness provided the full version of how different processes
can be efficient and improve performance within the four departments. This study
provided the data of with the main cause of the stoppages and therefore the decision
maker can make informed decision to confront all manufacturing process.
5.2 Conclusions
The objectives of Overall Equipment Effectiveness are to improve business
competitiveness in the manufacturing industry by reducing waste, improving availability,
performance and quality to have continues return on investment (ROI) and producing
increased productivity.
The worldwide values of Overall Equipment Effectiveness are 85% where the
availability is expected to be 90%, performance 95% and quality 99.9%. These values
reduce the chances of the potential losses since they are acceptable standards in world
class countries: difference between ideal and actual states.
According to Williamson (2006), there is no world class value which is based on the
empirical study conducted in the different sectors of Lubrichem or Petrochemical
industry.
Adjustment and setup time increases all the time when the company run different types
of production and it will affect the Overall Equipment Effectiveness value. The only OEE
parameter that suits this value is the average quality factor. The average Overall
Equipment Effectiveness values are affected by the quality rate, performance and
availability rates.

Overall equipment effectiveness study
57
Lubrichem automated blending is the one with highest and best Overall Equipment
Effectiveness parameter than other three departments. The quality and performance
rates were 96.2% and 99.8 % respectively. Generally, the lowest or worst Overall
Equipment Effectiveness parameter is the availability in all four departments of
Lubrichem Company. This is affected by the highly overwhelming losses or based on
limitations of on the unknown losses that were not recorded.
This study had three main objectives which were answered with help of research
questions. The objectives of the study are mentioned below including how they are met.
5.3 Identify the source of down time
Sources of down time was identified using RS-Production system (refer to Table 4.1)
and they are mentioned below.
• Machines service/maintenance caused by poor planning.
• Setup/changeover caused by poor production planning.
• Breakdown caused by lack of maintenance planning.
• Quality issues/rework caused by lack quality management tool (check list, histo-
graphs, bar chart, pie chart and SPC).
• Shortage of personnel due to poor planning.
• Micro stoppages caused by chronic disturbance.
• Cleaning (housekeeping) of the machines is done during operating hours leading
to production delays.
• Time is lost during loading and setting of job on machines resulting in setup
delay.
• Production changeover consumes time from one job to another due to the actual
set up of the machines during operating time.
• Machines have break downs due to improper cleaning and lubrication of parts
which results in the unavailability of the machines for production.
• No planned maintenance schedule for machines which results in performance
loss.

Overall equipment effectiveness study
58
• Tools break frequently due to operator inefficiency resulting in performance loss.
5.4 Identify ways to improve Overall Equipment Efficiency of the machines
Overall Equipment Efficiency was improved after implementing TPM on this study (refer
to table 4.2, machines FB 44 and FB 46).
Machines OEE was improved from 0% during the month of October to 81% and 76.8%
respectively in March. The following factors were improved:
• Availability of the machines (planned maintenance to prevent breakdowns).
• Quality on the product and raw material. (using check list, SPC and graphs).
• Performance of the machines (setting the machine prior running production)
5.5 Identify actual performance improvement opportunities for the plant, based
on information obtained through the literature study.
• All four department of Lubrichem Company should continuously use
maintenance planning to reduce breakdown of the machines.
• Production planning will improve production and reduce the time to set the
machine and changeover. Raw material can be brought closer to the machine,
production testing and be done before actual running time.
• The company can use Statistical Process Control (SPC) to manage production
quality. SPC will stop the machine automatically if it is making defects and run
again after the problem is addressed.
• Continuously implementing TPM will improve the performance above 90%. The
machines will always be available for production and producing quality.
According to Hutchins (2016), the measurement is important because it helps in
decision making and invariably plays an important role for benchmark for potential
continues improvements.

Overall equipment effectiveness study
59
There is prominent level of needs to determine why some of the stoppages reasons
were not recorded or recorded as unknown. The OEE of all four departments were poor.
This indicates and verifies that they are working manual recording as per respondents
of the interview and they are not using the OEE concepts and implement the
fundamental principles theory of the OEE. The potential reasons for this problem from
the interviews are
• That they guess they have a better machines efficiency than what they don’t see,
they need to evaluate their process.
• New operators do not understand how machines work.
• Machines are difficult for operators to operate them.
• Operators prone to procrastination.
• Operators think they can measure their performance.
• Machines don’t work properly.
• Nobody cares about the machines.
• Data is not relevant.
• Change procedure and management.
• Misused and misunderstood.
• No future improvement.
Plant communication needs to be improved and cascaded to all levels to prevent
resistance to change especially on those who run the machines on the daily basis.
Effective communication can improve performance and gain momentum to sustainable
competitiveness. The tools known as Cause-Effect diagram and five (5) whys are for
any simple or complex systems and can be used to find the root cause of problems
related to losses of the OEE on the machines, process, man, methods and materials.
The process of running automated machines requires lots investment on the employees
so that they can understand the machines.
The benefits of OEE are:
• Accurate data collection.

Overall equipment effectiveness study
60
• Effective and efficiency usage of the machines.
• Able to make informed decision (clear and visible reporting).
• Quality monitoring machines and energy efficiency.
In all four departments, availability related losses were big and played a role for low
OEE especially in October, November and December. Changeovers and setups were
the major loss which called for the implementation of SMED.
According to Tekin and Arslandere, (2018), the introduction of SMED will minimise the
cost of inventory as well as exceeding customer expectations. Overall Equipment
Effectiveness at Lubrichem Company will increase the speed, quality and availability
because it the ratio related to the equipment and it can be measured.
5.6 Recommendations
Future recommendation would be informing all the operators and personnel before any
of these solutions are implemented. Since people are sometimes resistant to change,
the need to be motivated as well as providing a clear reason for these changes should
first be brought forward.
Secondly, training and empowering the staff creates awareness and promotes a sense
of responsibility on their part. A system should also be designed to fit the specific
process in any industry.
Qualitative research can be carried out in gathering data based on interviews (through
phone or face-to-face), through questionnaires addressed to operators and the entire
management teams. Data from a build cross-functional team work could help create a
more reliable and valuable data.
Further unplanned measures due to breakdowns of machines might require preventive
maintenance, or vibration analysis. Future research may be done to explore:
• Operation and production design.

Overall equipment effectiveness study
61
• The dynamics of translating equipment effectiveness or loss of effectiveness in
terms of cost.
• Machine design or mechanical design.
• Frequency studies on man hours (Human OEE).
5.7 Further research
One important aspect that could further improve the work already carried out in this
thesis would be quantitative research. Some of the difficulties encountered during this
work were;
• Unavailability of data from some machines limiting the research.
• Incomplete data from some machines.
Since this research had a short time frame, it is recommended that a quantitative
research should be applied to as to gather more quantitative data. This can be done in
the form of questionnaires either open-ended, closed-ended or a combination of both.
Contact methods may gather information through mail, telephone or personal interview.
Questionnaire consists of a set of questions presented to the various industries so as to
get their own interpretation (answers). This will help answer some of the questions that
might help solve the OEE problem in return. High quality can be established due to
effectiveness and efficiency due to effort put by man, machine, method and material.
Future recommendation would be informing all the operators and personnel before any
of these solutions are implemented. Since people are sometimes resistant to change,
the need to motivate as well as providing a clear reason for these changes should first
be brought forward.
Training and empowering the staff creates awareness and promotes a sense of
responsibility on their part. A system should also be designed in other to fit the specific
process in any industry. Qualitative research can be carried out in gathering data based
on interviews (through phone or face-to-face), through questionnaires addressed to

Overall equipment effectiveness study
62
operators and the entire management teams. Data from a build cross-functional team
work could help create a more reliable and valuable data.
Further unplanned measures due to breakdowns of machines might require preventive
maintenance, or vibration analysis. Future research may be done to explore;
• Operation and production design.
• The dynamics of translating equipment effectiveness or loss of effectiveness in
terms of cost.
• Machine design or mechanical design.
• Frequency studies on man hours (Human OEE).

Overall equipment effectiveness study
63
6 REFERENCES
Afy-Shararah, M., Rich, N.J.I.J.o.O. & Management, P. 2018. Operations flow
effectiveness. A systems approach to measuring flow performance. 38(11):2096-2123.
Ahmad, R.W., Gani, A., Hamid, S.H.A., Shiraz, M., Yousafzai, A., Xia, F.J.J.o.N. &
Applications, C. 2015. A survey on virtual machine migration and server consolidation
frameworks for cloud data centers: 52:11-25.
Bakri, A.H., Rahim, A.R.A., Yusof, N.M., Ahmad, R.J.P.-S. & Sciences, B. 2012.
Boosting lean production via TPM: 65:485-491.
Baumers, M., Dickens, P., Tuck, C., Hague, R.J.T.f. & change, s. 2016. The cost of
additive manufacturing: machine productivity, economies of scale and technology-push:
102:193-201.
Braglia, M., Frosolini, M. and Gallo, M., 2016. Enhancing SMED: Changeover Out of
Machine Evaluation Technique to implement the duplication strategy. Production
Planning & Control, 27(4), pp.328-342.
Brannen, J., 2017. Mixing methods: Qualitative and quantitative research. Routledge.
Brannen, J. 2017. Mixing methods: Qualitative and quantitative research: Routledge.
CG, R., Pai, P., Srinivas, T.R. and Raghavendra, M.J., 2016. OEE-A Tool to Measure
the Effectiveness of TPM Implementation in Industries-A Review.
Cheh, K.M., 2014. Analysis of Overall Equipment Effectiveness (OEE) within different
sectors in different Swedish industries.
Chinniah, Y., 2015. Analysis and prevention of serious and fatal accidents related to
moving parts of machinery. Safety science, 75, pp.163-173.

Overall equipment effectiveness study
64
Cochran, D.S., Foley, J.T. and Bi, Z., 2017. Use of the manufacturing system design
decomposition for comparative analysis and effective design of production systems.
International Journal of Production Research, 55(3), pp.870-890.
De Wilde, P.J.A.i.C. 2014. The gap between predicted and measured energy
performance of buildings: A framework for investigation. 41:40-49.
Dave, B., Hämäläinen, J.P. and Koskela, L., 2015. Exploring the recurrent problems in
the last planner implementation on construction projects. In Proceedings of the Indian
De Wilde, P., 2014. The gap between predicted and measured energy performance of
buildings: A framework for investigation. Automation in Construction, 41, pp.40-49.
Diesendorf, W., 2015. Insulation co-ordination in high-voltage electric power systems.
Elsevier
Denzin, N.K. 2016. Searching for Yellowstone: Race, gender, family and memory in
the postmodern west: Routledge.
Dezsö, C.L. & Ross, D.G.J.S.M.J. 2012. Does female representation in top
management improve firm performance: A panel data investigation. 33(9):1072-1089.
Domingo, R. & Aguado, S.J.S. 2015. Overall environmental equipment effectiveness
as a metric of a lean and green manufacturing system. 7(7):9031-9047.
Franklin, A.C. and Franklin, D.P., 2016. The J & P transformer book: a practical
technology of the power transformer. Elsevier.
Frank, O.L., 2014. Exploring a best practice approach to operability and maintainability
of low carbon buildings in the UK (Doctoral dissertation, University of Nottingham).

Overall equipment effectiveness study
65
Goldratt, E.M. & Cox, J. 2016. The goal: a process of ongoing improvement:
Routledge.
Goetsch, D.L. and Davis, S.B., 2014. Quality management for organizational
excellence. Upper Saddle River, NJ: pearson.
Gugerty, M.K. and Karlan, D., 2018. Ten reasons not to measure impact—And what to
do instead. Stanf. Soc. Innov. Rev.
Graban, M., 2016. Lean hospitals: improving quality, patient safety, and employee
engagement. CRC press.
Harriss, D. & Atkinson, G.J.I.j.o.s.m. 2013. Ethical standards in sport and exercise
science research: 2014 update·. 34(12):1025-1028.
Ishimaru, A., 2017. Electromagnetic wave propagation, radiation, and scattering: from
fundamentals to applications. John Wiley & Sons.
Hill, T. 2017. Manufacturing strategy: the strategic management of the manufacturing
function: Macmillan International Higher Education.
Jain, A., Bhatti, R.S., Singh, H.J.I.J.o.Q. & Management, R. 2015. OEE enhancement
in SMEs through mobile maintenance: a TPM concept. 32(5):503-516.
Jin, X., Siegel, D., Weiss, B.A., Gamel, E., Wang, W., Lee, J. & Ni, J.J.M.r. 2016. The
present status and future growth of maintenance in US manufacturing: results from a
pilot survey. 3.
Katzenbach, J.R. & Smith, D.K. 2015. The wisdom of teams: Creating the high-
performance organization: Harvard Business Review Press.

Overall equipment effectiveness study
66
Kaufman, J. & Reichert, K.J.P.C.C.M. 2018. “What Is Measured Gets Improved”(or If
You Cannot Measure It, You Cannot Improve It). 19(3):267-268.
Larcher, D. and Tarascon, J.M., 2015. Towards greener and more sustainable batteries
for electrical energy storage. Nature chemistry, 7(1), p.19.
Lean Construction Conference (ILCC 2015). Institute for Lean Construction Excellence.
Lerch, C. and Gotsch, M., 2015. Digitalized product-service systems in manufacturing
firms: A case study analysis. Research-Technology Management, 58(5), pp.45-52.
Lidow, A., Strydom, J., De Rooij, M. and Reusch, D., 2014. GaN transistors for efficient
power conversion. John Wiley & Sons.
Luo, X., Wang, J., Dooner, M. and Clarke, J., 2015. Overview of current development in
electrical energy storage technologies and the application potential in power system
operation. Applied energy, 137, pp.511-536.
Macpherson, A., 2015. Cooperative Learning Group Activities for College Courses.
Maddox, D., 2015. Taking “resilience” out of the realm of metaphor. How do you
measure resilience in cities? How would you know if your city or your community was
resilient?. People.
Maskell, B.H., Baggaley, B. and Grasso, L., 2016. Practical lean accounting: a proven
system for measuring and managing the lean enterprise. Productivity Press.
McDowell, N.G., Michaletz, S.T., Bennett, K.E., Solander, K.C., Xu, C., Maxwell, R.M.,
Allen, C.D. and Middleton, R.S., 2017. Predicting chronic climate-driven disturbances
and their mitigation. Trends in ecology & evolution.

Overall equipment effectiveness study
67
McKittrick, J.T., Kinney, S., Lima, S. and Allen, M., 2018. The first 3 minutes: Optimising
a short realistic paediatric team resuscitation training session. Nurse education in
practice, 28, pp.115-120.
Ohunakin, O.S., Leramo, R.O.J.J.o.E. & Science, A. 2012. Total productive
maintenance implementation in a beverage industry: a case study. 7(2):128-133.
Poduval, P.S., Pramod, V.J.I.J.o.Q. & Management, R. 2015. Interpretive Structural
Modeling (ISM) and its application in analyzing factors inhibiting implementation of Total
Productive Maintenance (TPM). International Journal of Quality & Reliability
Management, 32(3):308-331.
Polito, V. & Wickens, M.J.E.E.R. 2015. Sovereign credit ratings in the European Union:
a model-based fiscal analysis. 78:220-247.
Ross, J.E. 2017. Total quality management: Text, cases, and readings: Routledge.
Rossi, P.H., Lipsey, M.W. & Henry, G.T. 2018. Evaluation: A systematic approach:
Sage publications.
Singh, R.K., Clements, E.J. and Sonwaney, V., 2018. Measurement of overall
equipment effectiveness to improve operational efficiency. International Journal of
Process Management and Benchmarking, 8(2), pp.246-261
Sinha, A.K. and Kumar, R., 2018. Generation of high voltage using cockcroft–walton
voltage multiplier circuit.
Szewczak, E. & Piekarczuk, A.J.B.o.t.P.A.o.S.T.S. 2016. Performance evaluation of
the construction products as a research challenge. Small error–big difference in
assessment? , 64(4):675-686.
Taylor, J. 2018. Quality assurance of chemical measurements: Routledge.

Overall equipment effectiveness study
68
TEZEL, B.A., Barker, C. & AZIZ, Z. 2016. Using quantitative approaches to enhance
construction performance through data captured from mobile devices. Research
Methodology in the Built Environment. Routledge. p. 99-112).
Thompson, M.K., Moroni, G., Vaneker, T., Fadel, G., Campbell, R.I., Gibson, I.,
Bernard, A., Schulz, J., Graf, P., Ahuja, B. and Martina, F., 2016. Design for Additive
Manufacturing: Trends, opportunities, considerations, and constraints. CIRP annals,
65(2), pp.737-760.
Vogel-Heuser, B., Rösch, S., Fischer, J., Simon, T., Ulewicz, S., Folmer, J.J.J.o.s.e. &
applications. 2016. Fault handling in PLC-based industry 4.0 automated production
systems as a basis for restart and self-configuration and its evaluation. 9(01):1.
Weimer, D.L. and Vining, A.R., 2017. Policy analysis: Concepts and practice.
Routledge.
Wickens, C.D., Hollands, J.G., Banbury, S. and Parasuraman, R., 2015. Engineering
psychology & human performance. Psychology Press.
Witten, I.H., Frank, E., Hall, M.A. and Pal, C.J., 2016. Data Mining: Practical machine
learning tools and techniques. Morgan Kaufmann.
Wohlwill, J.F. 2016. The study of behavioral development: Academic Press.
Xu, J. & Croft, W.B. 2017. Quary expansion using local and global document analysis.
(In. Acm sigir forum organised by: ACM. p. 168-175).
Zimbardo, P.G. and Boyd, J.N., 2015. Putting time in perspective: A valid, reliable
individual-differences metric. In Time perspective theory; review, research and
application (pp. 17-55). Springer, Cham.
Zhao, M., Jiao, J. & Lin, J.J.I.T.o.I.I. 2018. A Data-driven Monitoring Scheme for
Rotating Machinery via Self-comparison Approach.

Overall equipment effectiveness study
69

Overall equipment effectiveness study
70
6 ANNEXURE
6.1 Annexure: B, Machines Samples
Semi-automated machines Average OEE
AU 11 27,6%
AU 12 41,5%
AU 13 27,9%
AU 1 28,5%
AU 22 28,2%
AU 14 21,2%
AU 15 48,3%
AU 16 49,2%
AU 17 53,7%
AU 2 73,6%
AU 3 13,1%
AU 4 65,5%
AU 18 47,6%
AU 8 59,5%
AU 9 42,9%

Overall equipment effectiveness study
71
AU 10 46,2%
AU 5 36,1%
AU 6 27,6%
AU 7 29,4%
AU 19 39,3%
AU 20 5,7%
AU 21 22,8%
Total 38,0%
Average OEE for Mechanical workshop machines
MW 5 36,0%
MW 21 51,9%
MW 6 45,5%
MW 7 37,0%
MW 20 45,9%
MW 12 80,9%
MW 13 78,2%
MW 36 28,5%
MW 10 58,0%
MW 30 43,9%

Overall equipment effectiveness study
72
MW 31 68,1%
MW 42 65,5%
MW 43 28,6%
MW 32 53,1%
MW 11 42,8%
MW 37 30,1%
MW 44 15,2%
MW 66 18,4%
MW 34 63,8%
MW 33 63,3%
MW 8 71,1%
MW 14 48,0%
MW 15 66,8%
MW 45 61,5%
MW 22 85,3%
MW 23 72,7%
MW 24 71,5%
MW 47 42,8%
MW 48 51,0%
MW 49 48,0%

Overall equipment effectiveness study
73
MW 50 50,8%
MW 51 38,2%
MW 52 20,8%
MW 53 37,0%
MW 54 44,8%
MW 46 29,6%
MW 9 21,2%
MW 1 38,1%
MW 2 20,0%
MW 3 34,3%
MW 38 15,7%
MW 55 12,9%
MW 56 30,1%
MW 39 32,8%
MW 25 76,0%
MW 16 71,5%
MW 40 30,9%
MW 41 24,2%
MW 57 23,1%
MW 58 22,5%

Overall equipment effectiveness study
74
MW 17 51,2%
MW 59 62,5%
MW 60 53,7%
MW 61 58,4%
MW 62 63,6%
MW 63 52,4%
MW 26 74,2%
MW 27 79,3%
MW 28 64,1%
MW 29 70,3%
MW 64 52,4%
MW 35 63,0%
MW 65 2,1%
MW 18 40,7%
MW 4 58,5%
MW 19 73,4%
MW 66 66,6%
Total 48,3%
9.4. Average OEE for food and beverage machines
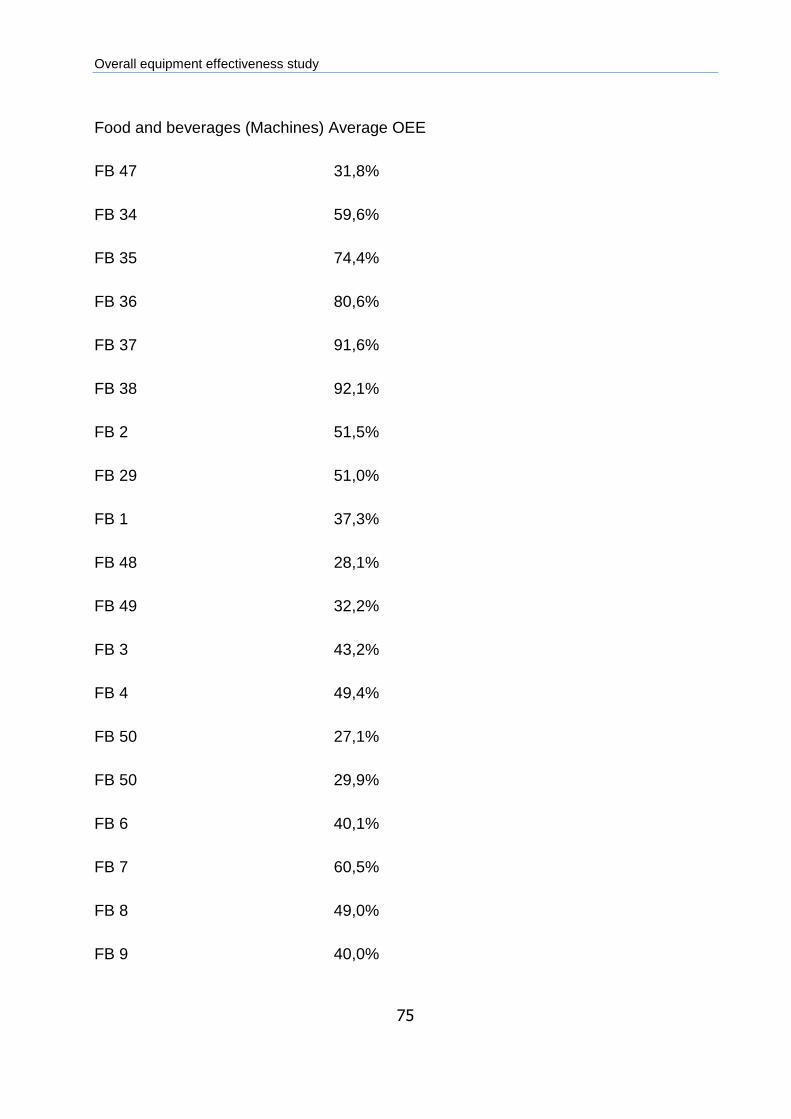
Overall equipment effectiveness study
75
Food and beverages (Machines) Average OEE
FB 47 31,8%
FB 34 59,6%
FB 35 74,4%
FB 36 80,6%
FB 37 91,6%
FB 38 92,1%
FB 2 51,5%
FB 29 51,0%
FB 1 37,3%
FB 48 28,1%
FB 49 32,2%
FB 3 43,2%
FB 4 49,4%
FB 50 27,1%
FB 50 29,9%
FB 6 40,1%
FB 7 60,5%
FB 8 49,0%
FB 9 40,0%
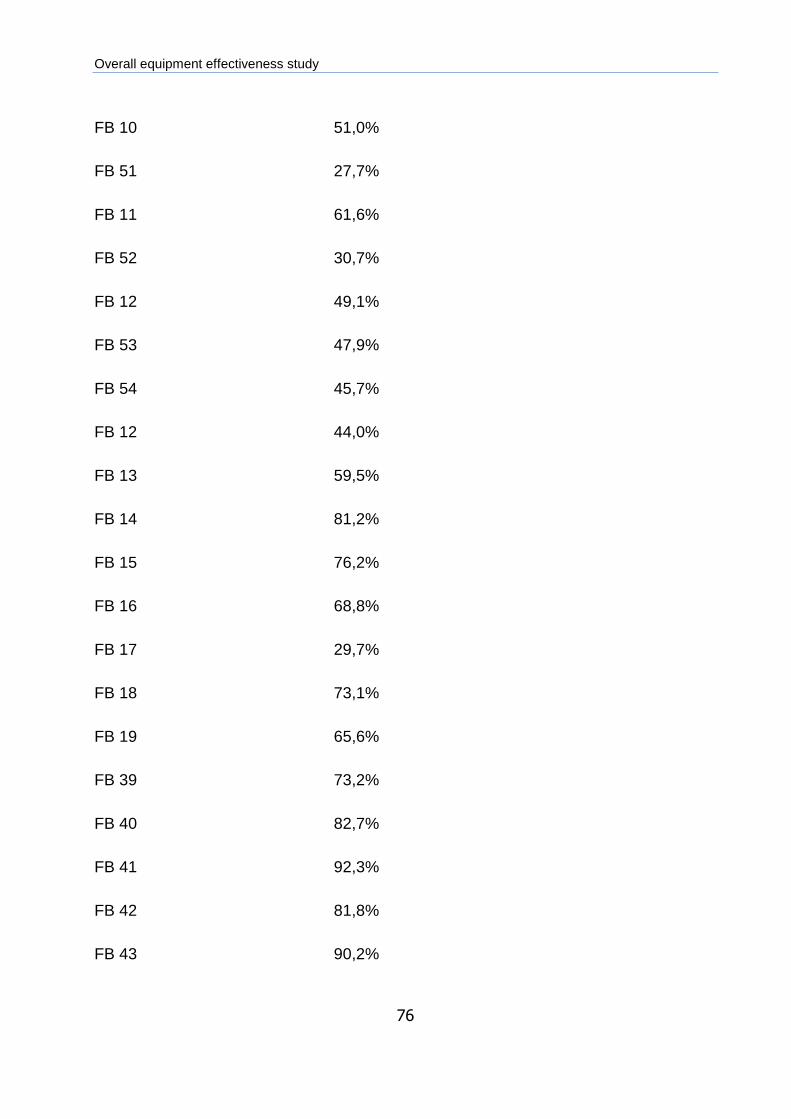
Overall equipment effectiveness study
76
FB 10 51,0%
FB 51 27,7%
FB 11 61,6%
FB 52 30,7%
FB 12 49,1%
FB 53 47,9%
FB 54 45,7%
FB 12 44,0%
FB 13 59,5%
FB 14 81,2%
FB 15 76,2%
FB 16 68,8%
FB 17 29,7%
FB 18 73,1%
FB 19 65,6%
FB 39 73,2%
FB 40 82,7%
FB 41 92,3%
FB 42 81,8%
FB 43 90,2%

Overall equipment effectiveness study
77
FB 30 71,7%
FB 31 64,3%
FB 32 70,1%
FB 33 47,2%
FB 20 13,5%
FB 21 22,6%
FB 22 25,5%
FB 23 34,4%
FB 24 17,6%
FB 25 28,8%
FB 55 16,8%
FB 56 13,7%
FB 26 21,0%
FB 56 14,8%
FB 57 16,5%
FB 58 1,6%
FB 27 30,6%
FB 28 35,6%
FB 44 59,2%
FB 45 41,6%

Overall equipment effectiveness study
78
FB 46 46,0%
Total 48,2%
9.5. OEE results for Semi-automated production machines:
17 54,3%
139 43,9%
140 56,6%
148 42,9%
149 52,2%
150 56,9%
154 63,8%
155 37,0%
161 56,2%
162 20,3%
164 52,5%
166 42,2%
167 37,1%
168 27,7%
169 61,3%
170 26,9%
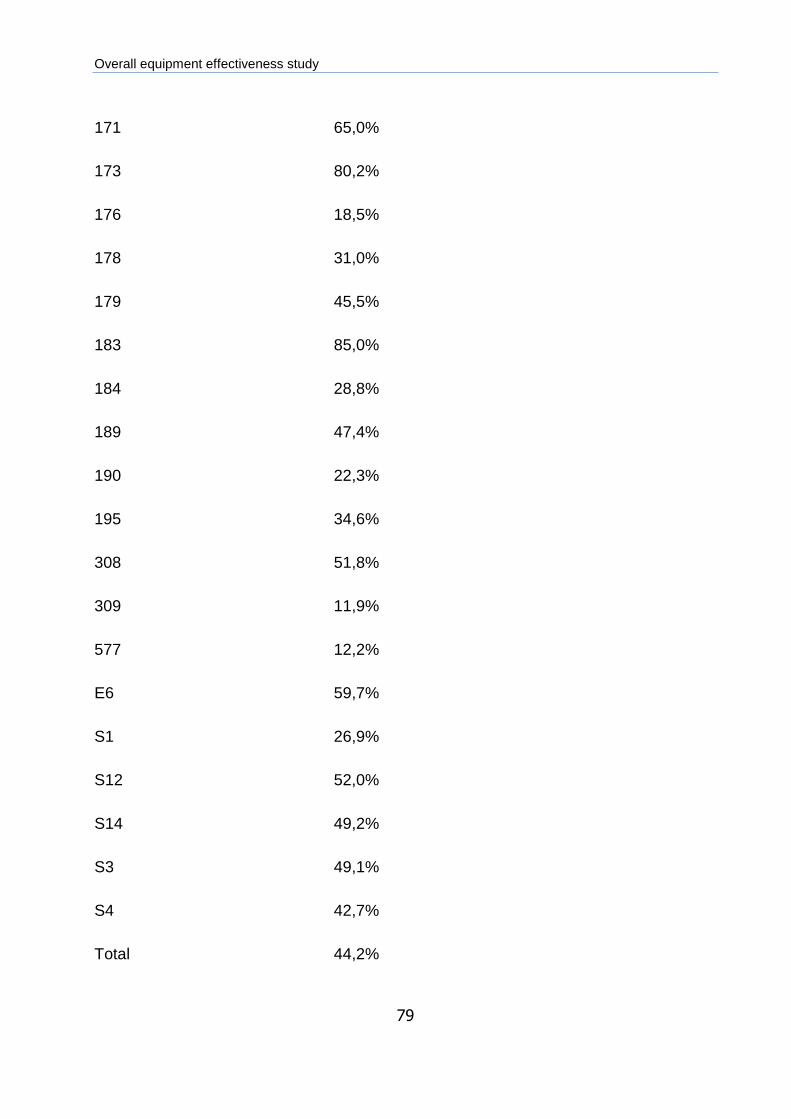
Overall equipment effectiveness study
79
171 65,0%
173 80,2%
176 18,5%
178 31,0%
179 45,5%
183 85,0%
184 28,8%
189 47,4%
190 22,3%
195 34,6%
308 51,8%
309 11,9%
577 12,2%
E6 59,7%
S1 26,9%
S12 52,0%
S14 49,2%
S3 49,1%
S4 42,7%
Total 44,2%

Overall equipment effectiveness study
80
Ornery
brat