overcoming squeezing in the yacambú-quibor tunnel, venezuela · overcoming squeezing in the...
TRANSCRIPT

Overcoming squeezing in theYacambú-Quibor Tunnel
Venezuela
Prepared for RocNews Spring 2009

Overcoming squeezing in the Yacambú-Quibor tunnel, Venezuela The Yacambú-Quibor tunnel in the State of Lara in Venezuela finally broke through on 27 July 2008 after 32 years of technical, financial, contractual and political problems. The 4.0 m diameter 23.3 kilometre long tunnel will transfer 347 million cubic metres water per year from the wet tropical Orinoco basin, on the eastern flank of the Andes, to semi arid Quibor valley on the western flank of the Andes. During the last 18 years, rock mechanics expert Evert Hoek has been consulting on the project. His experiences have been described in several lectures and publications (e.g. 2008 Kersten Lecture, 2000 Terzaghi lecture). Most recently a paper with Rafael Guevara submitted to the journal Rock Mechanics and Rock Engineering describes how the problems of high stress and poor rock quality were overcome with intelligent engineering solutions. Much of the analysis was conducted using the Finite Element program Phase2. In particular, the new 'liner designer' that is part of Version 7 helped show the deficiencies in older designs and contributed to the latest support design used in the final 2 km of the tunnel. This article briefly describes some of these analyses. Look for more details in the soon to be published journal paper.
Figure 1. Project location. Cover Photo: Downstream face of the ridge in which the Yacambú dam is located. The downstream face of the concretefaced rockfill dam can be seen in the centre of the photograph.

Figure 2. Cross section along tunnel alignment. Construction history Between the start of the project in 1975 and the completion in 2008, a total of eight different contracts were awarded to carry out the excavation work. The early contracts used hard rock Tunnel Boring Machines (TBMs) since initial site investigations at the dam site suggested most of the rock encountered would be of reasonable quality and strength. By 1979 it was evident that the weak tectonically deformed rock encountered during tunnelling presented a serious problem (see Figure 3). One TBM became trapped in the squeezing rock and had to be later excavated (Figure 4). Drill and blast methods were used in the later contracts and different techniques were employed to deal with the squeezing conditions, specifically the use of yielding support. This met with varying degrees of success as will be shown below.

Figure 3. Tectonically deformed graphitic phyllite at the tunnel face.
Figure 4. Left: Floor heave about 100 m behind the Intake drive TBM in 1979 at a depth of 400 to 425 m below surface. Right: Excavation of the remains of the TBM in 1987 during the fourth contract.

Rock mass properties The 32 years required for the excavation of the Yacambú-Quibor tunnel coincided with significant developments in the field of rock engineering. The rock mass classification systems of Barton et al (1974) and Bieniawski (1974) had only been introduced two years before the start of construction and were virtually unknown in the Americas. Numerical analyses techniques for underground excavation design were in their infancy and personal computers only became available in the early 1980s. European techniques for dealing with squeezing conditions were seldom used in the Americas and were only used on a regular basis at Yacambú-Quibor from about 1990 onwards. Descriptive methods for estimating rock mass properties, required for support design calculations, were gradually replaced by rock mass classification methods based on detailed geological observations. In the mid 1990s the Geological Strength Index (GSI) classification was adopted on site in order to provide information for input into the Hoek-Brown failure criterion (Hoek and Brown, 1997). Parameters required to model the rock using the Hoek-Brown failure criterion were estimated from laboratory testing, back analysis of squeezing tunnels, visual assessment of the rock quality and experience from previous projects. Both short-term and long-term parameters were produced to account for deterioration of the rock mass over time. Analysis of problematic tunnel sections Hoek and Marinos (2000) presented a method for identifying sections of a tunnel with a high potential for squeezing based on the ratio of rock mass strength to in-situ stress. For the Yacambú-Quibor tunnel a similar analysis was carried out (Figure 5) and the results were used in the design of the lining for the final and deepest stretch of the tunnel and in evaluating sections requiring rehabilitation before putting the tunnel into service. One example of a problematic section is at Chainage 2 + 100. Ten years after construction, the installed support failed and the tunnel had to be re-excavated as shown in Figure 6. An analysis of the support capacity of the lining installed in this section was carried out using the Rocscience program Phase2 Version 7.

Figure 5. Potential problems along the tunnel.
Figure 6. Initiation of failure and final rehabilitation of the tunnel at Chainage 2 + 100.

Figure 7. Modified horseshoe section used at Chainage 2 + 100 in type D2 rock with a GSI rating of 26 to 37 at a depth below surface of 570 . This section of the tunnel was constructed with excavation by means of a roadheader of a modified horseshoe shaped tunnel as shown in Figure 7. Support consisted of high-strength shotcrete and steel sets with 2 sliding gaps as shown. The 20 cm gaps allowed a convergence of about 10 cm or 2% before the sets carried load. Since the tunnel was excavated by roadheader it was not possible to place the invert at the same time as the steel sets described above. In many cases the invert was not placed until the face had moved ahead approximately 50 m. The invert itself consisted of 50 cm of shotcrete with an embedded invert strut in the form of a W 6 x 20 steel rib. A Phase2 model of the tunnel section was constructed to examine the mechanisms of failure. In the model it was assumed that the tunnel invert was placed a long distance (say 50 m) behind the face. This delay in the invert closure means that in the short term, the invert carries virtually no load other then the dead load of equipment in the tunnel. However, the long term loading of the tunnel, due to deterioration of the rock mass within the plastic zone, results in a large increase in both the axial thrust and the bending moment in the invert, as shown in Figure 8. As illustrated in Figure 6, failure of the lining initiates at the connections between the arch and the invert and progresses to overall failure of the invert and the arch.
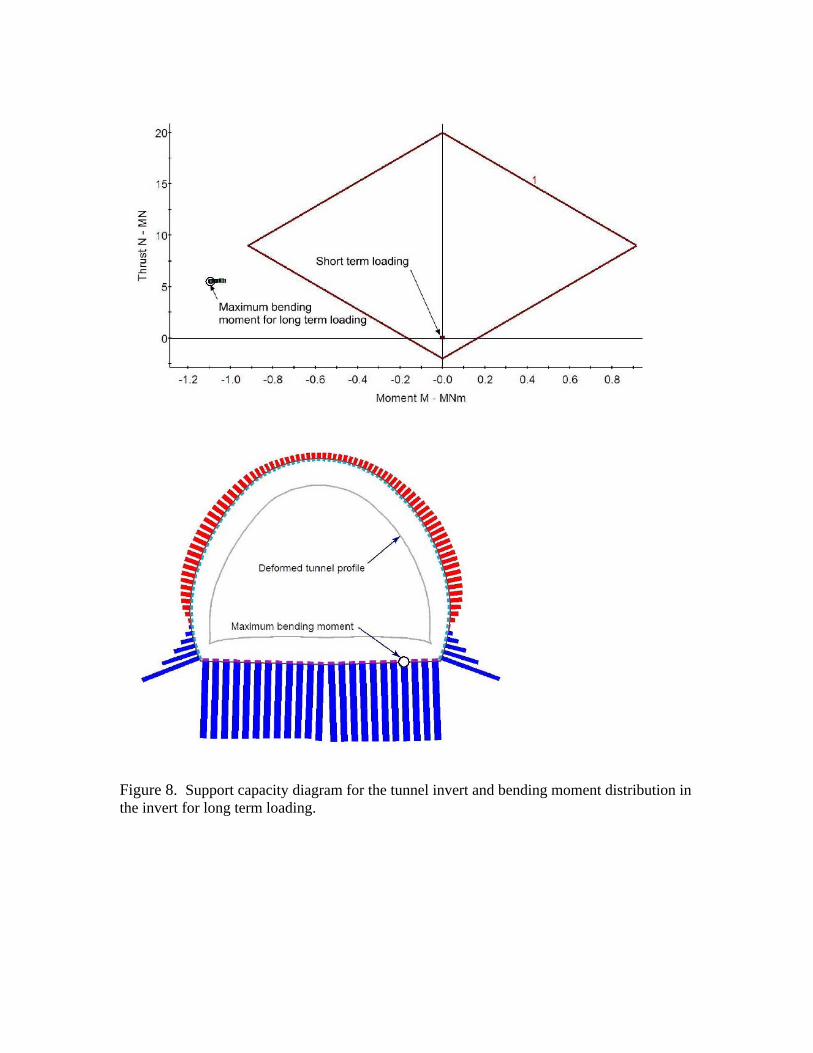
Figure 8. Support capacity diagram for the tunnel invert and bending moment distribution in the invert for long term loading.

Final design for highly stressed section The section of the tunnel from Chainage 10 + 000 to 12 + 000 has been mined in recent years and a full circular lining with sliding joints has been installed. The section of tunnel is highly stressed and has the potential for the failure of inadequately designed linings. The lining is a combination of steel sets and shotcrete with a 60 to 70 cm total thickness. The lining is constructed in two parts with the first part placed as close to the face as possible. This consists of CP 160 R steel ribs at 1 m spacing with two sliding joints installed below the springline. This arrangement is illustrated in the Figure 9 and the inset shows detail of sliding joint with a shotcrete gap. The shotcrete gap closes automatically or is filled with shotcrete at 15 m behind the face. A second layer of 40 to 50 cm of reinforced shotcrete is then placed over the initial layer described above.
Figure 9: Installation of a circular lining in heavily stressed rock. The inset shows the sliding gap and the shotcrete window over this gap. Reinforcement for the second layer of shotcrete is visible in this shotcrete gap. The design was again analysed using Phase2. The support capacity curves for the initial 20 cm thick shotcrete lining with embedded steel ribs are shown in Figure 11. The initial installation, with the sliding joints open, results in zero axial thrust and a small amount of bending. Some very minor cracking of the shotcrete could occur at this early stage. Once the joints close, the axial thrust carried by the initial lining increases until the short term loading

condition is reached at the end of construction. Note that the factor of safety of the initial lining is approximately 2 at this stage. The deterioration of the rock mass in the plastic zone surrounding the tunnel results in an increase in loading on the lining. The result of this can be seen in the increase in axial load in the initial lining (Figure 11) for long term conditions. The final factor of safety of this initial lining is approximately 1.2. The support capacity curves for the final 40 cm thick internal lining of reinforced shotcrete are shown in Figure 12. This lining carries very low loading at the end of construction, depending upon how soon it was installed after the initial lining. However, this loading increases significantly as the rock mass surrounding the tunnel deteriorates with time and as the final lining picks up its share of the total load. Figure 12 shows that, under long term loading conditions, the factor of safety for the final lining is approximately 1.5. The analysis described above represents a sound lining design that has been applied to much of the recently constructed lining in poor quality rock under very high cover. The use of the sliding joints in the initial lining allows the tunnel to deform safely. The installation of a second lining of adequate thickness results in a complete lining of adequate capacity for both short and long term loading.
Figure 10. Assembled steel set with two sliding joints in the site workshop

Figure 11. Support capacity curves for the initial 20 cm thick shotcrete lining with embedded CP 160R ribs with sliding joints.

Figure 12. Support capacity curves for the final 40 cm thick reinforced shotcrete lining.

Conclusions
he long and difficult excavation history of the Yacambú-Quibor tunnel spans a period of
s
eferences
arton, N.R., Lien, R. and Lunde, J. 1974. Engineering classification of rock masses for the
ieniawski, Z.T. 1973. Engineering classification of jointed rock masses. Trans S. Afr. Inst.
uevara, R., Cerda, P. and Carrero, R. 2004. Túnel Yacambú-Quibor, Experiencia de ario
oek, E. and Brown, E.T. 1997. Practical estimates or rock mass strength. Intnl. J. Rock
oek, E. and Marinos, P. 2000. Predicting Tunnel Squeezing. Tunnels and Tunnelling
arinos, P and Hoek, E. 2000 GSI – A geologically friendly tool for rock mass strength
Ttime that includes major advances in rock mechanics and accepted tunnelling techniques. The time span includes the creation of the Hoek-Brown failure criterion, the widespread use of quantitative rock mass classification systems, the adoption of European tunnelling procedures and the rise of computer modelling of engineering design. Despite many setbacks, the tunnel was eventually completed as all of the latest tunnelling techniquewere used in designing the excavation and support for the final stretch through the mosthighly stressed portion of the tunnel. R Bdesign of tunnel support. Rock Mech. 6(4), 189-239. BCiv. Engrs 15, 335-344 GConstrucción - Reparación Tramo entre las Progresivas 12+800 a 12+950. XVIII SeminVenezolano de Geotécnia Geoinfraestructura: “La Geodesia en el Desarrollo Nacional”. HMech. & Mining Sci. & Geomechanics Abstracts. 34 (8), 1165-1186. HInternational. Part 1 – November 2000, Part 2 – December, 2000. Mestimation. Proc. GeoEng2000 Conference, Melbourne. 1422-1442.