overcoming the hurdles for pat and implementation of …€¦ · –rtrt/pat then can enable...
TRANSCRIPT

Overcoming the Hurdles for PAT
and Implementation of Real-Time
Release Testing - RTRT
Dr. Gert Thurau
MSD Manufacturing Division

Property of Merck Manufacturing Division 2012
Merck & Co., Inc, Whitehouse Station, NJ,. All rights reserved
2
Definition of PAT
Process Analytical Technology:
– In-line, on-line, at-line measurements (but not off-line
= laboratory)
– Real-time or in time-scale of processing step
– Analyzer based and model-based real-time
approaches
Many definitions (FDA, compendia, literature..)
All are useful…
Definition used in this presentation:

Property of Merck Manufacturing Division 2012
Merck & Co., Inc, Whitehouse Station, NJ,. All rights reserved
3
ICH Q8 (R) Definition of RTRT
• Real-time release testing (RTRT)
– The ability to evaluate and ensure the acceptable
quality of in process and/or final product based on
process data, which typically includes a valid
combination of measured material attributes and
process controls.
• Definition does not specify:
– How fast is “real time”?
– Is Process Analytical Technology used?
– Is there release testing?
– Can refer to drug substance, however most examples discussed are for drug
product

Property of Merck Manufacturing Division 2012
Merck & Co., Inc, Whitehouse Station, NJ,. All rights reserved
4
Types of RTRT Approaches
A. Analyzer/”test-replacement” type
approaches
– Analytical testing moves from end product
testing to further upstream
– Direct or indirect replacement of conventional
release tests – use of PAT
B. Process-model based approaches
– Comprehensive process models
– To verify process is in Design Space
– To replace most testing* and predict
product quality based on raw material and
processing data
*Current examples mostly to replace some end-product tests
that cannot be put online (i.e. dissolution)

Property of Merck Manufacturing Division 2012
Merck & Co., Inc, Whitehouse Station, NJ,. All rights reserved
5
A. Analyzer based approaches
• Shift of analytical control from an off‐line, post‐ manufacturing approach to an approach where data is
generated during manufacturing
– Full or partial RTRT - all or selection of tests done during
manufacturing
– Typically RTRT refers to no post-production release testing
• RTRT does not mean less testing - in fact it often means
more analytical data is generated
– Process Analytical Technology (PAT) allows generation of more
measurements without significant additional resources

Property of Merck Manufacturing Division 2012
Merck & Co., Inc, Whitehouse Station, NJ,. All rights reserved
6
A. Analyzer based approaches,
cont.
• RTRT often requires a combination of favorable product properties, and good process understanding – For example product is stable with no degradates => no need for
degradate testing
– Dissolution testing replaced by disintegration test
• For those analytical tests done “on-line” equivalency to finished product testing is generally needed – PAT methods compared to reference/conventional analytical
methods
– Technical limitations in microbiology and stability tests
A big initial advantage of “test-replacement” approaches is that at any point in time a reference method can be used on a sample.

Property of Merck Manufacturing Division 2012
Merck & Co., Inc, Whitehouse Station, NJ,. All rights reserved
7
Historical timeline of Analyzer-
Based RTRT Approaches
• 2004-2005 Sanofi-Aventis Tablet Product
– Initial FDA PAT initiative “PAT comparability protocol” including many NIR
methods
– Filed but not implemented
• 2006 MSD/Merck Tablet Product
– Filed and implemented for new product
– Globally accepted in 80+ markets
• Since then
– Multiple implementations, typically by main pharma companies
– New and already marketed products
– Increasing complexity (lower drug loadings, more complex formulations)

Property of Merck Manufacturing Division 2012
Merck & Co., Inc, Whitehouse Station, NJ,. All rights reserved
8
Analyzer-based RTRT Examples
Pfizer1
MSD/Merck
Sanofi-Aventis2
GSK1
1) IQ industry user meeting/IFPAC 2012
2) IFPAC meeting 2004

Property of Merck Manufacturing Division 2012
Merck & Co., Inc, Whitehouse Station, NJ,. All rights reserved
9
B. Process Model based approaches Multivariate Data Analysis (MVDA)
• Use of process models (mostly multivariate) to control
process or predict – vs. measure – in-process material
and finished product attributes
Inputs into models:
–Raw material properties
–In-process
measurements
–Equipment parameter
Outputs of models:
–Process within Design
Space?
–Fault detection
–Finished product
properties prediction
Process
Model
• Today multivariate process models are often used in combination with
analyzer based RTRT
• Model predicts finished product property that cannot be analyzed via “real-
time test” (i.e. dissolution)
Property of Merck Manufacturing Division 2012
Merck & Co., Inc, Whitehouse Station, NJ,. All rights reserved
10
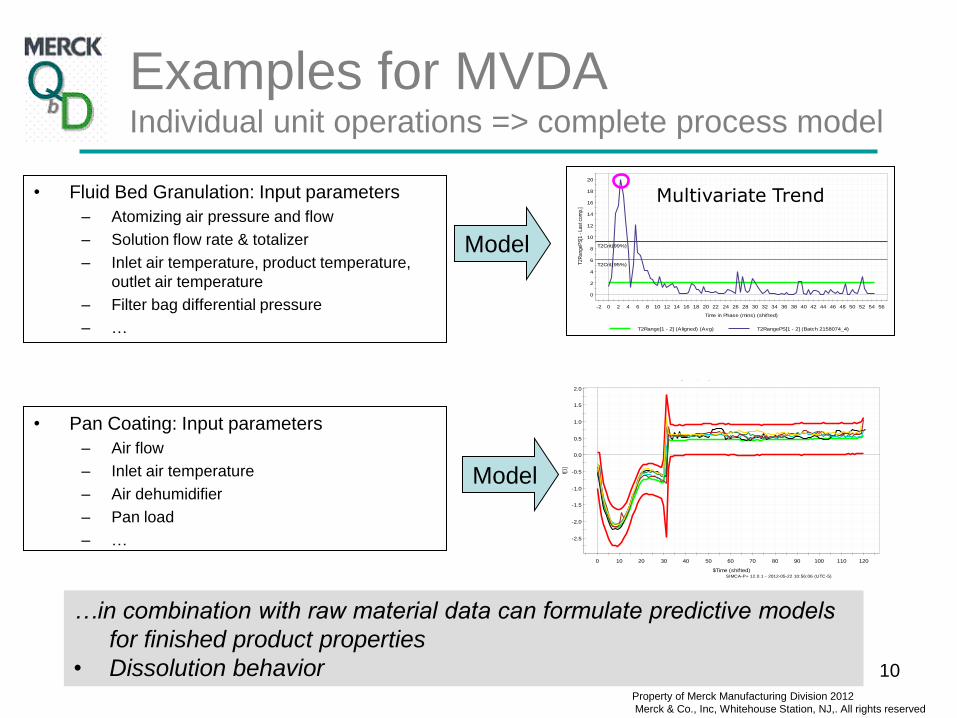
Examples for MVDA Individual unit operations => complete process model
• Fluid Bed Granulation: Input parameters
– Atomizing air pressure and flow
– Solution flow rate & totalizer
– Inlet air temperature, product temperature,
outlet air temperature
– Filter bag differential pressure
– …
• Pan Coating: Input parameters
– Air flow
– Inlet air temperature
– Air dehumidifier
– Pan load
– …
0
2
4
6
8
10
12
14
16
18
20
-2 0 2 4 6 8 10 12 14 16 18 20 22 24 26 28 30 32 34 36 38 40 42 44 46 48 50 52 54 56
T2R
ange
PS
[1 -
Las
t com
p.]
Time in Phase (mins) (shifted)
Janumet_G2_WP69_01.M2:GRANULATING, PS-testset
Predicted Hotelling's T2Range[1 - Last comp.]
T2Crit(95%) = 6.02899 T2Crit(99%) = 9.29155
T2Range[1 - 2] (Aligned) (Avg) T2RangePS[1 - 2] (Batch 2158074_4)
T2Crit(95%)
T2Crit(99%)
SIMCA-P+ 12.0.1 - 2012-05-08 15:32:09 (UTC-5)
Multivariate Trend
-2.5
-2.0
-1.5
-1.0
-0.5
0.0
0.5
1.0
1.5
2.0
0 10 20 30 40 50 60 70 80 90 100 110 120t[1]
$Time (shifted)
Janumet_P500_WP69_01.M2:COATING
Scores [Comp. 1]
SIMCA-P+ 12.0.1 - 2012-05-22 10:56:06 (UTC-5)
Model
Model
…in combination with raw material data can formulate predictive models
for finished product properties
• Dissolution behavior

Property of Merck Manufacturing Division 2012
Merck & Co., Inc, Whitehouse Station, NJ,. All rights reserved
11
Comments on MVDA based
approaches to RTRT • Challenge to fully explore “outside design-space” in full-scale
production – Sensitivity of model to relevant failure modes can be difficult to prove
• So far limited examples for full RTRT with elimination of end-product testing – Typically models run for monitoring, in parallel to conventional testing
– Hesitation to “switch over” to full model control • Industry
• Regulatory agencies

Property of Merck Manufacturing Division 2012
Merck & Co., Inc, Whitehouse Station, NJ,. All rights reserved
12
Real-Time Release Testing &
Quality by Design
• According to ICH QbD IWG they do not have to
come together
– Can do RTRT without QbD
– Can definitely do QbD without having RTRT!
…however in practice…
–Quality by Design leads to increased process understanding
–Process understanding is foundation of Real-time Release Testing
–RTRT/PAT then can enable further ongoing process understanding (= extension of QbD learning into life cycle of product)

Property of Merck Manufacturing Division 2012
Merck & Co., Inc, Whitehouse Station, NJ,. All rights reserved
13
Advantages of RTRT (In combination with QbD)
1. Typically more integrated control strategy – Relationships between raw materials, in-process tests and
finished product properties better understood
– Earlier control points than end-product testing
2. Better data for use in process understanding – Often more data to use per batch
– Supports stage III/ongoing process verification
– PAT analyzer can detect process drifts easier
3. Better Quality Assurance than conventional end product testing – Source: EMA guidance on real-time release testing

Property of Merck Manufacturing Division 2012
Merck & Co., Inc, Whitehouse Station, NJ,. All rights reserved
14
Advantages of RTRT, cont. (In combination with QbD)
4. Involvement of manufacturing operations in Quality Control – More ownership of Quality
– Up-scale of job functions
5. Potential savings through elimination of end-product testing – Capital assets, expenses, staffing
6. The ultimate lean process – Product is tested when it is manufactured
– => no “supply chain issues” between manufacturing and laboratory
Property of Merck Manufacturing Division 2012
Merck & Co., Inc, Whitehouse Station, NJ,. All rights reserved
15
Challenges with RTRT
1. Technical/scientific limitations – not every product/process is currently amenable to RTRT
2. Investment – Capital investment in PAT and IT systems
– New skill sets required in manufacturing sites
3. Management and execution of innovative approaches to – Analytical testing
– Setting of specification – large number of samples tested, expl. Uniformity of dosage units
– Roles and responsibilities in manufacturing and Quality control

Property of Merck Manufacturing Division 2012
Merck & Co., Inc, Whitehouse Station, NJ,. All rights reserved
16
Challenges with RTRT, cont.
4. Limited experience with long-term performance of PAT methods (for example NIR) in the pharmaceutical industry
5. Today still more regulatory attention than conventional control strategies
– More intense interaction during review
– More involved pre-approval inspections/subsequent GMP inspections
– Global expectations very different

Case Study – Benefits and
Challenges
MSD/Merck Real-Time Release
Testing Product

Property of Merck Manufacturing Division 2012
Merck & Co., Inc, Whitehouse Station, NJ,. All rights reserved
18
Product and process introduction
• Indication diabetes (DPP4 Inhibitor)
• Solid oral dosage form – Tablet
– 3 strengths which are weight-multiples
– ~ 30% active by weight
• Direct compression process with taste-masking overcoat
• Initial approval 2006 – FDA, EMEA
– Subsequent approval in > 110 markets world-wide
• Developed into high volume product ( > 850 batches annually)
Property of Merck Manufacturing Division 2012
Merck & Co., Inc, Whitehouse Station, NJ,. All rights reserved
19
Product attributes that supported
RTRT for this product
• Simple direct compression process with good development history of uniformity – Relatively high active content (~30%)
• Very good stability*
• No degradates*
• BCS class I with well understood disintegration/dissolution behavior
Disclaimer: These attributes are not mean as universal guidance, there are
scenarios/attributes for other products which can support RTRT approaches.
* for approved stability window, under approved storage conditions and packaging

Property of Merck Manufacturing Division 2012
Merck & Co., Inc, Whitehouse Station, NJ,. All rights reserved
20
Merck Fully Supports QbD
• Merck has embraced QbD as a strategic initiative on
how we develop and manufacture products
– QbD provides a consistent framework for developing high quality
products that provide benefits to our patients and meet our
customer’s needs
– QbD promotes systematic, scientific and risk-based approaches
to product and process development
• Merck is executing a company-wide QbD strategy and
playbook
• All of Merck’s development programs now follow the
QbD approach
– Work processes are established to realize Merck’s QbD strategy

Property of Merck Manufacturing Division 2012
Merck & Co., Inc, Whitehouse Station, NJ,. All rights reserved
21
RTRT in the context of QbD for this product
• This product was Merck’s first venture into QbD principles in 2005-2006 – Participation in FDA QbD pilot program
• “Quality by Design (QbD)” approaches used in – Development
• “Design Space”
• Systematic assessment of control strategy elements – Analytical/testing
– Process equipment
– Procedures
– Manufacturing • Implementation of control strategy
• Process monitoring plan
• Ongoing improvement/learning
• QbD elements covered in this presentation – Control strategy (RTRT approach)

Property of Merck Manufacturing Division 2012
Merck & Co., Inc, Whitehouse Station, NJ,. All rights reserved
22
Control Strategy for Product – Real-Time
Release Testing for Product Release
API Blend
Lubricant Blend
Compress
Film coat
PAT Testing Approach
Manufacturing Floor
Disintegration
NIR ID
Appearance
Manufacturing Floor
NIR Composite Assay
On-line Dosage Uniformity by
Weight
Traditional Release
Approach
Laboratory
Lab Tests
HPLC
Content Uniformity
Composite Assay
Degradates
ID
Dissolution
Appearance

NIR technology for tablet
analysis

Property of Merck Manufacturing Division 2012
Merck & Co., Inc, Whitehouse Station, NJ,. All rights reserved
24
Challenges of this NIR method
implementation
Challenge Solution
In 2005 limited external applicable
guidance and very limited precedence in
industry
•Apply widely accepted standards where
possible (i.e. ASTM)
• Capture more details of strategy and
execution in submission, engage in
discussion with reviewers pre-/post
submission
Existing quality system not in all aspects
conducive to support NIR method for this
purpose
Adopt changes to existing quality system
(vs. creation of new quality system)
Method validation and update expertise
in manufacturing site evolving
Training, knowledge transfer and close
collaboration with central expert group for
life cycle of product

Property of Merck Manufacturing Division 2012
Merck & Co., Inc, Whitehouse Station, NJ,. All rights reserved
25
Reference
values
PAT CALIBRATION &
DEPLOYMENT
At-line NIR
Assay
Calibration
tablets
y
EMPIRICAL
Multivariate
Calibration
(PLS)
S
Calibration
Spectra
PLS Model
of rank = K
M
variables
N
samples
X
Production
tablet
Prediction
spectrum
Concentration
value by NIR
Outlier metrics:
REAL-TIME
results
confidence!
Deployment
software
x

Property of Merck Manufacturing Division 2012
Merck & Co., Inc, Whitehouse Station, NJ,. All rights reserved
26
Concentration Data - History
Average Concentration by batch (mg/g)
1,399 Batches plotted (representing nearly five years of production)
Original average and control limits shown – these were set by first 30 batches produced.

Property of Merck Manufacturing Division 2012
Merck & Co., Inc, Whitehouse Station, NJ,. All rights reserved
27
Within Batch Concentration
Trending
Early Batch Recent Batch
With over 1,000 batches between these two batches and nearly 5 years of production, the consistency of concentration values is excellent.

Property of Merck Manufacturing Division 2012
Merck & Co., Inc, Whitehouse Station, NJ,. All rights reserved
28
NIR Quality Assurance/
Model Life Cycle Management • NIR does not use daily reference standard or ‘calibrator tablet’
– Instead previously developed calibration is used
– No routine comparison to reference method
• Quality assurance of measurement through model verification via:
– Reference method analysis (initial launch, change control, investigation)
– Spectral outlier diagnostics (routine operation)
• Model life cycle management:
– NIR is able to detect subtle differences in material properties
– Model (but not method) will change over time (example new source of API)
– Well accepted concept -Foundation is strong analytical science and solid change control Quality System
So, how robust are these initially developed NIR calibrations?

Property of Merck Manufacturing Division 2012
Merck & Co., Inc, Whitehouse Station, NJ,. All rights reserved
29
Multivariate Outlier Metrics
K-dimensional PLS
Model subspace
(plane)
In-space outlier
(high M-distance)
N NIR spectra
(M variables
each) used to
build model
• Calibration spectra
define “normality”
• Any new spectrum
can be abnormal in
2 ways:
1. in-space, and
2. out-of-space
7500 8000 8500 9000 9500 10000 10500-2
-1
0
1
2
3
wavenumber (cm-1)
inte
nsity
Out-of-space outlier
(high F-value)
7500 8000 8500 9000 9500 10000 10500-2
-1
0
1
2
3
7500 8000 8500 9000 9500 10000 10500-2
-1
0
1
2
3
4
• Monitoring of metrics is imperative: REAL-TIME NIR results confidence !
• Two metrics reflect different NIR failure modes both must be monitored!

Property of Merck Manufacturing Division 2012
Merck & Co., Inc, Whitehouse Station, NJ,. All rights reserved
30
PAT Method Events
1/1/2006 1/1/2007 1/1/2008 12/31/2008 12/31/2009 12/31/2010
25mg
50mg
100mg
MAR, JUL 06: 3 NIR
models put into
service
10.3.2010 C 132 MD alarms over
8 batches! No sign differences
Investigation of outlier metric
limits (too “tight”???)
18.3.2011
(all): new
MD limits set
using 95%
CL
30.6.2011 C:
model
update 29.7.2009
B: 6 MD
alarms
over 2
weeks, no
sign
difference
•Cmodel generated useful metrics right away; A and B models did so after a model
update
• Since 2006, only 6 confirmed tablets with sign. differences (out of >120k!)
• all of which were flagged by the outlier detector!
• none of which were confirmed as product quality issues!
• However, 132 false alarms for C model in 2010
A and B model
updates
B model update effect
on F value
A strength B strength C strength
12.2.2007
C: 2 F
alarms,
sign.
difference
2 4 6 8 10
x 104
0
500
1000
1500
Sample
F v
alu
e
F value
F above limit
F below limit
27.1.2009
C: 1 F
alarm,
sign.
difference
B: 3
separate
MD
alarms,
sign.
difference

Property of Merck Manufacturing Division 2012
Merck & Co., Inc, Whitehouse Station, NJ,. All rights reserved
31
Conclusions for NIR Method
Robustness
• Spectral outlier use is appropriate to assure
method performance
– Limits are set to detect method performance issues
– With large process history, opportunity to adjust limits
to mitigate nuisance investigations
• NIR method extremely robust over 5 years of
production
– Includes transfer to other instruments, other
manufacturing sites

Property of Merck Manufacturing Division 2012
Merck & Co., Inc, Whitehouse Station, NJ,. All rights reserved
32
Regulatory Reviews/Inspections
• RTRT/PAT approaches are usually the center of any review or inspection
– Unusually large number of detailed questions
• >80 CMC questions in initial filing
• Many aspects of PAT method scrutinized in recent inspections
– Diversity of background and familiarity with RTRT in inspectors
– Can be intimidating scenario for manufacturing sites
• However:
– Focus of questions typically on learning and understanding, not
challenging
– Strong integration into routine Quality System in sites is assuring (no
“special PAT Quality rules”)
• Routine testing and release flow
• Investigations
• Transfers (within site, between sites)
Property of Merck Manufacturing Division 2012
Merck & Co., Inc, Whitehouse Station, NJ,. All rights reserved
33
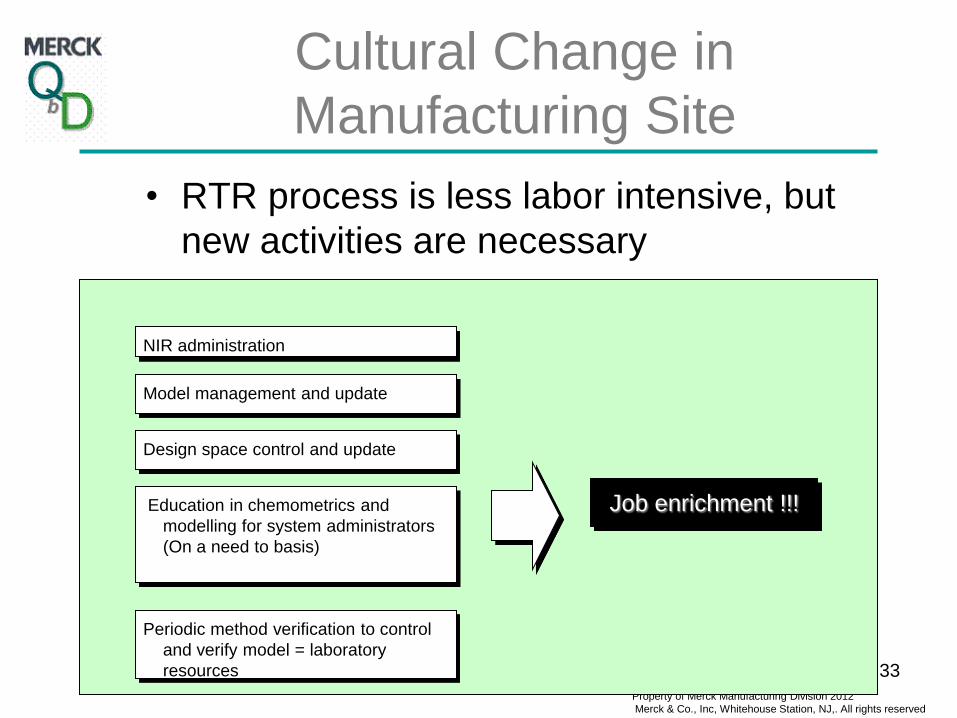
Cultural Change in
Manufacturing Site
Education in chemometrics and
modelling for system administrators
(On a need to basis)
Design space control and update
Periodic method verification to control
and verify model = laboratory
resources
Model management and update
Job enrichment !!!
NIR administration
• RTR process is less labor intensive, but
new activities are necessary

Property of Merck Manufacturing Division 2012
Merck & Co., Inc, Whitehouse Station, NJ,. All rights reserved
34
Real-Time Release Testing
Business Assessment
• Additional business benefits in
– Inventory Management
Opportunities
– Reduction in Waste
- 97.3 %
Quality Cycle Time per batch
7
1
1
1
0
1
2
3
4
5
6
7
8
9
Conventional
Process
RTR Januvia
Cal.
Days
Lead Time /batch (QA)
Lead Time /batch (Lab)- 75%
RTR Economics - FTE's
0.0
1.0
2.0
3.0
4.0
5.0
6.0
2007 2008 2009 2010 2011 2012 PP
Year
FT
E FTE Savings
Total FTE for RTR

Property of Merck Manufacturing Division 2012
Merck & Co., Inc, Whitehouse Station, NJ,. All rights reserved
35
Conclusions
• Real-Time Release Testing is advancing within
the pharmaceutical industry
– Number of examples increasing
– Sophistication of approaches increasing
• Challenges exist both on scientific, business
and regulatory aspects
• Experiences within currently running
implementations are clear indications of benefits

Property of Merck Manufacturing Division 2012
Merck & Co., Inc, Whitehouse Station, NJ,. All rights reserved
36
Acknowledgements
• Eric Ahuja, Niya Bowers, Manoharan
Ramasamy, John Higgins, Nathan Pixley,
Charles Miller, Steve Short
• Beppe Mazzochi, Gianmaria Ghisoni, Paola
Carrera, Jennifer Blatteau

Backup slides

Property of Merck Manufacturing Division 2012
Merck & Co., Inc, Whitehouse Station, NJ,. All rights reserved
38
Sampling Plan for CU and Assay
• Core tablets are obtained every 15 minutes from the tablet press via automated sampling system – The number of tablets tested varies by dose and batch factors
• Samples for NIR analysis – 3 tablet per “time location” per side (station) of the tablet press
– Typical number of tablets for 100mg dose is 72 tablets tested by NIR
• 36 tablets for side 1, 36 tablets for side 2
• This corresponds to 12 locations (with 3 replicates)
• 12 locations x 15 minutes = 3 hours of compression
• Tablet weight data – Between 240-690 tablets analyzed (distributed by location and
side-of-press)

Property of Merck Manufacturing Division 2012
Merck & Co., Inc, Whitehouse Station, NJ,. All rights reserved
39
Release calculations
• Composite Assay
– Each NIR result is in concentration units (mg/g of active)
– NIR results are averaged
– Composite Assay (%LC) is calculated using average
NIR mg/g and average tablet weight
– Specification 95-105%
• Content Uniformity
– Use weight uniformity instead of content uniformity
(relatively high drug load)
– Specifications based on large n counting test