overconfident people are more exposed to “black …ftp.iza.org/dp9009.pdfoverconfident people are...
TRANSCRIPT

DI
SC
US
SI
ON
P
AP
ER
S
ER
IE
S
Forschungsinstitut zur Zukunft der ArbeitInstitute for the Study of Labor
Overconfident People Are More Exposed to“Black Swan” Events:A Case Study of Avalanche Risk
IZA DP No. 9009
April 2015
Nicolao BoniniStefania PighinEnrico RettoreLucia Savadori
Federico SchenaSara ToniniPaolo Tosi

Overconfident People Are More Exposed to “Black Swan” Events:
A Case Study of Avalanche Risk
Nicolao Bonini University of Trento
Stefania Pighin
University of Verona, University of Trento
Enrico Rettore University of Padua, FBK-Irvapp and IZA
Lucia Savadori
University of Trento
Federico Schena University of Verona
Sara Tonini
University of Trento
Paolo Tosi University of Trento
Discussion Paper No. 9009
April 2015
IZA
P.O. Box 7240 53072 Bonn
Germany
Phone: +49-228-3894-0 Fax: +49-228-3894-180
E-mail: [email protected]
Any opinions expressed here are those of the author(s) and not those of IZA. Research published in this series may include views on policy, but the institute itself takes no institutional policy positions. The IZA research network is committed to the IZA Guiding Principles of Research Integrity. The Institute for the Study of Labor (IZA) in Bonn is a local and virtual international research center and a place of communication between science, politics and business. IZA is an independent nonprofit organization supported by Deutsche Post Foundation. The center is associated with the University of Bonn and offers a stimulating research environment through its international network, workshops and conferences, data service, project support, research visits and doctoral program. IZA engages in (i) original and internationally competitive research in all fields of labor economics, (ii) development of policy concepts, and (iii) dissemination of research results and concepts to the interested public. IZA Discussion Papers often represent preliminary work and are circulated to encourage discussion. Citation of such a paper should account for its provisional character. A revised version may be available directly from the author.

IZA Discussion Paper No. 9009 April 2015
ABSTRACT
Overconfident People Are More Exposed to “Black Swan” Events: A Case Study of Avalanche Risk
Overconfidence is a well-established bias in which someone’s subjective confidence in their own judgments is systematically greater than their objective accuracy. There is abundant anecdotal evidence that overconfident people increase their exposure to risk. In this paper, we test whether overconfident people underestimate the probability of incurring an avalanche accident. An avalanche accident is a typical “black swan” event because it has a low probability of occurring but has potential dramatic consequences. To test whether the overconfidence bias affects the decision of backcountry skiers to go on a ski trip under different levels of avalanche risk, we measured individual cognitive traits and then used a random effect logit model to measure their effects on the probability to take the tour, by controlling for other observable characteristics of the respondent. We show that 1) overconfidence is widespread even in our sample and 2) practitioners who are more prone to overestimate their knowledge are also more likely to take the risk associated with a ski trip exposed to avalanche danger. This suggests that overconfident people are more exposed to black swan events. JEL Classification: D83, D84, C2 Keywords: cognitive bias, risky decision, backcountry skiing, measurement errors, logit model Corresponding author: Enrico Rettore Department of Economics and Management University of Padova Via del Santo 33 35121 Padova (I) Italy E-mail: [email protected]

1
1. Introduction
A black swan event is something unexpected and unpredictable at the time it occurs, with a
dramatic impact on those exposed to it [1]. Some events, such as avalanches, manifest themselves as
tragic black swan events, due to their dramatic severity and their rarity. Traditionally, much attention
was devoted to risk analysis and risk management aspects both in experimental research and in
education programs. Only in recent years, the contribution of human factors to accidents began to
assume a growing relevance, focusing researchers’ and educators’ attention on cognitive aspects such
as overconfidence, haste, inexperience and complacency [2] [3].
The aim of the present research is to explore how overconfidence (OC), and other cognitive
factors, behaviourally affect decisions under the threat of black swan events.
OC is generally defined as the difference between how much one thinks she knows
(confidence) and how much one actually knows (accuracy) [4] [5] [6] [7]. Since the seminal work by
Lichtenstein and Fischhoff [4] a large number of studies have examined OC (for reviews see [8] [9]).
The interest for this cognitive trait in the scientific community is well represented by [10]: “No
problem in judgment and decision making is more prevalent and more potentially catastrophic than
overconfidence”.
The original meaning of the term OC was closely related to calibration and probability
judgment research. In psychology, individual calibration capacity is usually measured on the basis of
general knowledge questions: participants have to answer a set of questions and then to assess the
probability that their answers are correct. Well-calibrated individuals are those who are able to
correctly assess their amount of mistakes. Miss-calibration phenomena appear when an individual is
not able to correctly assess her amount of mistakes. Notwithstanding, the meaning of the term has
frequently been stretched beyond its original definition. In some research fields, OC is considered a
sign of other cognitive traits or biases, and its original definition has been extended to the context of
positive illusions, especially to the better-than-average effect [11], to the unrealistic optimism [12]
and to the illusion of control [13]. OC has been advocated as a potential explanation for real world
decisional failures, contributing to market bubbles, financial collapses, policy failures, and costly
wars [14] [15] [16] [17] [18], but this cognitive trait has been studied mostly in lab experiments (see
for example [6] [19]) with little attention in determining its role on shaping real world decisions. One
exception is represented by the investigation of the role of OC in pathological gambling domain,
where it has been shown to lead to deficits in decision-making [20] [21] [22].
In the present study, we adopted the original definition of OC in terms of miss-calibration,
and we measured OC in a domain-independent task in order to investigate the role of a general
cognitive trait, instead of one that is strictly related with individual expertise. In addition, we collected
data on those positive illusions that have been traditionally associated to mis-judgments of risk. In
particular, we measured the self-reported illusion of control [23] [13] [24] and unrealistic optimism
(Weinstein 1980). Illusion of control refers to individuals’ tendency to believe one can control, or at
least influence, outcomes that are clearly governed by chance and, thus, uncontrollable [25] [23].
Unrealistic optimism, also known as optimistic bias, is the tendency to show an unrealistic optimism
toward the future, thinking that negative events will happen less likely to the individual than to the
fellow other, while positive events will happen more likely to the individual than to the fellow other
[12].

2
Self-reported risk taking in the recreational domain [26] [27] was also included in the present
research. It assesses how much the individual declares that she will likely engage in a series of risky
recreational activities (such as rafting, paragliding, etc.).
Being related to the accuracy and the reliability of individual judgments, OC, and the other
cognitive traits described above, might presumably influence individual decisions to expose oneself
to dangerous situations. An excessive confidence in our own judgments, along with a great confidence
in our knowledge and our capacities, an illusionary feeling of control over the situation, a feeling that
only positive event can occur to us, and the tendency to seek for risky situations, can expose us to
more hazards, also when specific risk indicators and warnings are present.
Winter mountaineering is a paradigmatic field to test the effect of OC on the decision making
process. In fact, the consequence of the decision may be the very life of the skier. The case of
backcountry skiers (BS) features all the elements identified by the literature as key ingredients to the
insurgence of a decision in which OC plays a role. First, the objective evidence available to the BS is
far from compelling. In fact, it normally takes the form of a Weather&Avalanche (WA) report1,
which, in most instances, only provides the BS with a general overview of the level of avalanche risk
in the area. This is insufficient to state with a reasonable degree of certainty, whether or not a specific
slope would collapse under the BS herself. To a large extent, the decision is not driven by the objective
evidence. It is rather based on the BS own judgment. Therefore, the degree of confidence the BS has
on her own judgement plays a crucial role. Second, as the probability of occurrence of an avalanche
accident is small or very small in most instances, the BS is very likely not to have a direct experience
of the event. That is, she lacks fast and clear feedbacks to her decisions [6]. Additionally, when the
feedback comes, it is likely to be a fatal one. Lastly, the fact that the probability of the occurrence of
an avalanche accident is normally very small might induce the BS to just overlook it [7].
2. Materials and Methods
We asked a sample of BS’s to take part into a survey to collect information on their cognitive
traits, as well as on their attitude to practice backcountry skiing at alternative degrees of avalanche
risk. Then we studied whether cognitive traits are correlated to the decision to take the tour.
The set up of the experiment closely reproduces the way in which winter mountaineers draw
their decision on whether to take a tour and which one to choose for the next day. The evening before,
sat at their pc, practitioners collect information on snow and weather conditions from the WA report,
consider a list of options for their ski tour and finally decide.
People willing to take part in the study sent a message to a computerized system to receive
via e-mail the codes to enter an on-line questionnaire. Since the procedure fully preserves the
anonymity of the respondents there was no way of obtaining their written consent. The protocol has
been approved by the Comitato Etico per la sperimentazione con l'essere umano of the University of
Trento.
Three hundred and four (304) people – mostly backcountry skiers, only few of them using
snow-shoes – completed the questionnaire. We excluded twenty-nine respondents from the analyses
either because they reported not to be backcountry skiers nor winter hikers; or because they reported
1 Weather&Avalanche report is released on a regular basis by local agencies and describes the conditions of the weather and of the snowpack in a specific area. It also provides a forecast for the coming days.

3
to not know any of the tours listed in the questionnaire; or because they reported to be unwilling to
ride the easiest tour even in the most favourable weather condition. The final sample included 275
respondents (90% of them are backcountry skiers; see below). The typical respondent was a middle-
aged, experienced and skilled male, strongly committed to ski touring, who chooses and engages in
the tours together with peers at his same level of experience and skills. Table 1 provides a summary
description of the respondents.
The questionnaire is made up of three sections. The first section collects basic information:
age, gender, level of mountaineering experience, way of practicing ski touring or winter hiking (how
many tours per week, peers’ characteristics, who chooses and leads the tour), and the level of
understanding of a WA report.
The second section lists three local and very popular ski tours of increasing level of difficulty
(MSA to OSA in the Blachère scale), along with three WA reports characterized by a level of
avalanche danger ranging from level 2 – Moderate to level 4 – High (the European Avalanche Danger
Scale ranges from 1 - Low to 5 – Very High). Respondents were asked on their willingness to engage
in each of the three tours in every WA scenarios. In this way, we collected nine hypothetical decisions
for each respondent.
The third and last section measures overconfidence, illusion of control, unrealistic optimism,
and risk-taking attitude.
Tab. 1: Description of the 275 respondents selected for the analysis.
Age 41
% of male respondents 91
Years of experience 14
% of mountain guides or Italian Alpine Club instructors 30
% of backcountry skiers 90
% of respondents taking at least one tour per week 60
% of respondents regularly taking tours with equally experienced partners 60
% of respondents choosing the tour together with the partners 60
% of respondents reporting self-assessed average/high ski-touring ability 50
% of respondents correctly interpreting the keywords of the WA report 70
Overconfidence was assessed following [20] asking participants to answer 18 two-
alternatives, general-knowledge questions (i.e. not specific to the backcountry ski domain). After each
question people were asked to estimate the confidence that the answer was correct on a half-range
scale (from 50% to 100%). The OC score for the ith respondent was computed as the difference
between her own average confidence over the 18 answers (CONF), and her own percentage of correct

4
answers to the 18 questions (ACC). CONF could range from 50 to 100. ACC could range from 0 to
100 (50 is the lower limit up to random fluctuations). The theoretical range for the OC score goes
from -50 (extreme underconfidence) up to 100 (extreme overconfidence). Respondents who exhibit
a positive score believe that they know more than what they actually do. Similarly, respondents who
display a negative score believe that they know less than what they actually do.
Illusion of Control was measured using the Unrealistic Control Beliefs Scale [24], which
assesses perceived control over uncontrollable events. The scale comprises 15 items and answers are
given on a seven-points scale from “strongly disagree” to “strongly agree”. The individual score is
evaluated as the average over the 15 items.
Unrealistic Optimism was measured as suggested by [12]. Participants are asked to report how
much they think they are likely to experience a series of events as compared to some peers of the
same gender and age. 34 events among those proposed by [12] were selected, 12 positive and 22
negative. After inverting the scale for the negative events, the individual score was evaluated as the
average over the 34 items.
Self-reported risk taking was measured by the recreational sub-scale of the Domain Specific
Risk Taking scale (DOSPERT; [27]). The DOSPERT scale is designed to assess risk preferences
through self-report in five domains. We used only the items pertaining to the recreational domain.
The respondent is asked how likely she would engage in each of six risky practices. Answers were
given on a seven points scale, from “extremely unlikely” to “extremely likely”. The individual score
is evaluated as the average over the six items.
2.1 Analysis
Data were analyzed using the Rasch model [28]. Let Yij be the binary answer provided by the ith
respondent to the jth of the nine combinations ski tour/WA conditions (coded as YES=1, NO=0). We
modeled it as a function of 𝛼𝑖 – the ith respondent individual characteristic representing the largest
level of risk she is available to take – and of:
−γ𝑗
+ 𝜀𝑖𝑗∗ 𝑖 = 1 , 275 𝑗 = 1 , 9 (1)
the level of riskiness of the jth combination ski tour/WA condition as perceived by the ith respondent,
with 𝜀𝑖𝑗∗ being an unobservable random variable which for computational convenience we assume to
follow a zero-mean logistic distribution. Note that the quantity in (1) is made up of a component γ𝑗,
which is common to all the respondents, representing the average perceived level of riskiness, and a
second component 𝜀𝑖𝑗∗ , which is specific to each respondent. The ith respondent accepts the jth
combination ski tour/WA conditions – i.e. she takes the risk of going on that tour in those WA
conditions – if and only if her perceived riskiness is not larger than the largest level of risk she is
available to take, that is, if and only if the following inequality holds:
−𝛾𝑗 + 𝜀𝑖𝑗∗ ≤ 𝛼𝑖 (2)

5
It follows that, the probability of going on a tour at the average (perceived) level of riskiness 𝛾𝑗
for a respondent with a threshold for risk 𝛼𝑖 is:
Pr(𝑌𝑖𝑗 = 1|𝛼𝑖 , 𝛾𝑗) = Pr(−𝛾𝑗 + 𝜀𝑖𝑗∗ ≤ 𝛼𝑖|𝛼𝑖 , 𝛾𝑗) = Pr(𝜀𝑖𝑗
∗ ≤ 𝛼𝑖 + 𝛾𝑗|𝛼𝑖, 𝛾𝑗) = Λ(𝛼𝑖 + 𝛾𝑗) (3)
where Λ(. ) is the logistic cumulative distribution function. The individual specific threshold for risk,
𝛼𝑖, could depend both on observable, 𝑥𝑖, and unobservable, 𝑢𝑖, individual characteristics:
𝛼𝑖 = 𝛽𝑥𝑖 + 𝑢𝑖 (4)
where the vector 𝑥𝑖 includes the scores for the cognitive and personality traits and all the individual
characteristics that we want to control for (see below).
We end up with a random effect logit model [28]:
Pr(𝑌𝑖𝑗 = 1|𝑥𝑖 , 𝛾𝑗) = 𝐸𝑢{Λ(𝛽𝑥𝑖 + 𝑢𝑖 + 𝛾𝑗)} (5)
In evaluating the expected value in (5), we assume 𝑢 to be a zero mean Gaussian distribution,
whose variance is estimated along with the other parameters in the model.
Results of the logistic regression, reported in the next section, are presented as the marginal
effect (on the probability of skiing the tour) of each explanatory variable (for the binary variables, it
is the effect of switching each of them from 0 to 1). In other words, if the rth component of 𝑥 is a
continuous variable, its effect on the ith respondent is given by the partial derivative of (5) with respect
to that component :
𝐸𝑢{λ(𝛽𝑥𝑖 + 𝑢𝑖 + 𝛾𝑗)}𝛽𝑟 (6)
where λ(. ) is the first derivative of Λ(. ) with respect to its argument. Table 3 in the next section
summarizes the average of the individual marginal effect (6) evaluated across the 275 respondents
included in the sample.
2.2 The role of measurement errors
In this section, we focus on the cognitive trait that turns out to be central to our study, i.e. OC.
In particular, we explain why, due to measurement errors, the estimate of its effect from the standard
logit analysis is biased toward zero. In our study, the bias is rather considerable and deserves an in-
depth discussion. A handy correction to this bias emerges as a result of the following argument.
As already explained, the OC score is measured as the average over 18 items of the item-
specific difference between the respondent confidence and the respondent accuracy. Following a
standard two-way analysis of variance, we let 𝑧𝑖𝑗, i.e. the score on the 𝑗𝑡ℎ item for the 𝑖𝑡ℎ subject, to
depend on three components: an individual-specific effect, 𝑎𝑖, which is the true level of individual
OC whose average is normalized to zero; an item-specific effect, 𝑏𝑗; and a purely random zero average
component, 𝑣𝑖𝑗:

6
𝑧𝑖𝑗 = 𝑎𝑖 + 𝑏𝑗 + 𝑣𝑖𝑗 𝑖 = 1 , 275 𝑗 = 1 , 18 (7)
The item-specific component, 𝑏𝑗, is introduced to account for the degree of suitability of item
𝑗 to reveal the subjects’ overconfidence. There is clear evidence in the data that it varies across items.
Let us consider Figure 1. It presents the distribution of the difference between confidence and
accuracy, i.e. the OC scores of the 275 individuals in the sample, specific to two polar items out of
the 18 used in the questionnaire. Specifically, item A presents a distribution, which features two large
peaks at 100 and at 50 (along with a minor one at -50), the former one meaning that a sizeable
proportion of respondents believe they are correct (confidence=100), when, in fact, they are not
(accuracy=0). On the contrary, item B exhibits the largest peak at 0, i.e. confidence is equal to
accuracy to a notable fraction of respondents.
Fig. 1: Distribution of the difference between confidence and accuracy in two polar items
In order to measure 𝑎𝑖 as accurately as possible, we can proceed as follows:
𝑧𝑖. = 𝑎𝑖 + 𝑏. +𝑣𝑖. (8)
where the dot stands for the average over the 18 items. 𝑧𝑖., the observed OC score, is equal to the true
OC score, 𝑎𝑖, plus the measurement error, 𝑣𝑖. (plus 𝑏. which here plays as the average value of OC).
Note that 𝑣𝑖. has to be considered as a measurement error, since it does not convey any information
on the respondent’s OC, but rather it adds noise.

7
The parameter we would like to estimate is the coefficient on the true OC score in (5), 𝛽𝑎. In
addition, to assign a unit of measurement to OC we focus on the effect of a variation as large as one
standard deviation, i.e. we should multiply the regression coefficient by the standard deviation of the
true OC score, 𝜎𝑎. Instead, the parameter we are actually estimating is the coefficient on the observed
OC score 𝑧𝑖., 𝛽𝑧, times its standard deviation, 𝜎𝑧. The measurement error has an opposite influence
on the estimate. On the one hand, it induces an attenuation bias on the estimate of 𝛽𝑎 in that:
𝛽𝑧 =𝛽𝑎𝜎𝑎
2
𝜎𝑎2 + 𝜎𝑣.
2 (9)
where 𝜎𝑣.2 = 𝜎𝑣
2 /18 is the variance of 𝑣𝑖. (for more details, see [29]). On the other hand, equation
(8) implies that the measurement error induces an overestimation of 𝜎𝑎2 in that:
𝜎𝑧2 = 𝜎𝑎
2 + 𝜎𝑣.2 (10)
Therefore, ignoring the role played by the measurement error in the estimate, leads us to obtain
that the estimate of 𝛽𝑎𝜎𝑎 from the logit regression is affected by a multiplicative attenuation bias:
𝛽𝑧𝜎𝑧 = 𝛽𝑎𝜎𝑎 [𝜎𝑎
2
𝜎𝑎2 + 𝜎𝑣.
2]
0.5
(11)
Since both 𝜎𝑎2 and 𝜎𝑣
2 (along with 𝜎𝑏2) can be estimated by fitting equation (7) to the data, for the
bias to be corrected, it is sufficient to divide the estimated effect of the OC score by the attenuation
bias in equation (11).
In the appendix, we show that the multiplicative attenuation bias can be even smaller than the
one displayed in equation (11) if we also consider the other explanatory variables included in vector
𝑥 (in the specific case we are discussing, however, the difference is qualitatively negligible).
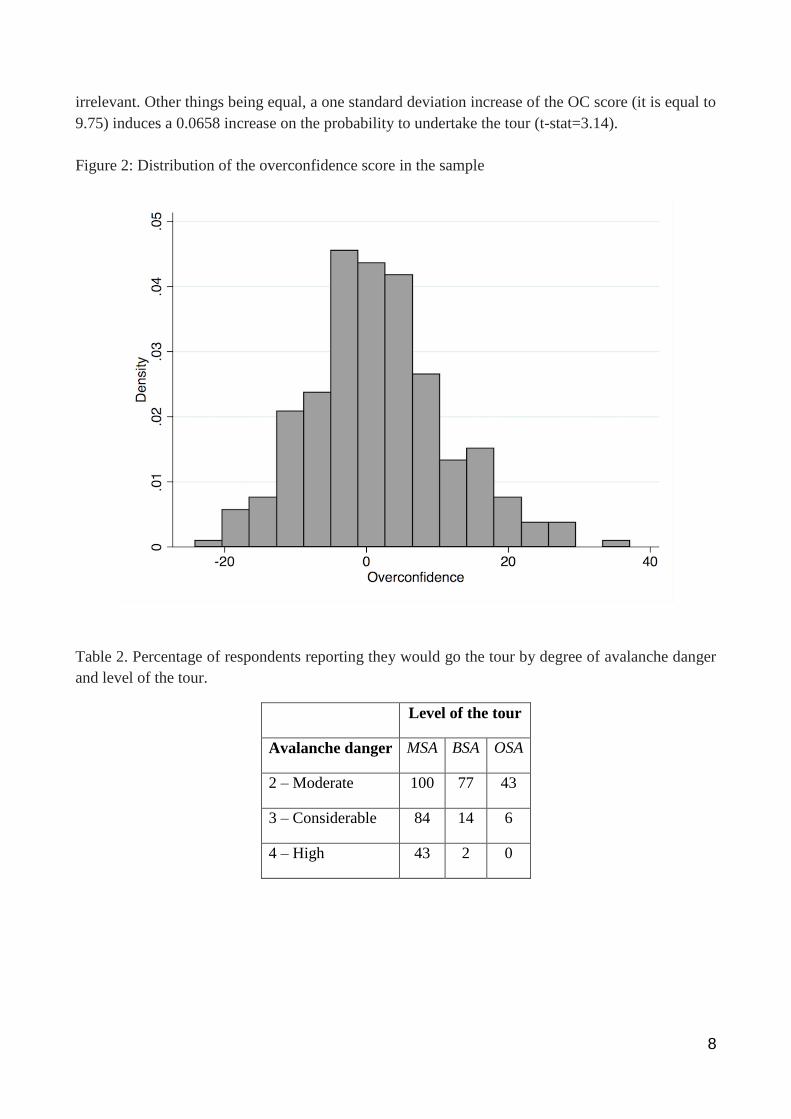
Finally, note that since the average OC is slightly positive (see Figure 2) as a result of the
measurement error, the proportion of respondents with a negative OC score in Figure 2 – i.e. the
proportion of underconfident in the sample – turns out slightly overestimated:
Pr(𝑧𝑖. < 0) = Pr(𝑎𝑖 + 𝑏. +𝑣𝑖. < 0) > Pr(𝑎𝑖 + 𝑏. < 0) (12)
3. Results and Discussion
Figure 2 shows the distribution of OC in our sample. Approximately 53% of the respondents
feature a positive value of the score, that is, they are overconfident.
Table 2 presents the hypothetical decisions as reported by the respondents. It displays the
expected pattern both over the level of difficulty of the tour and over the degree of avalanche danger.
Table 3 reports the results of the logit regression as the average marginal effect of the
explanatory variables on the probability to go on the tours. Both OC and risk taking matter in the
decision, while the other two traits, i.e. illusion of control and unrealistic optimism, turn out to be
8
irrelevant. Other things being equal, a one standard deviation increase of the OC score (it is equal to
9.75) induces a 0.0658 increase on the probability to undertake the tour (t-stat=3.14).
Figure 2: Distribution of the overconfidence score in the sample
Table 2. Percentage of respondents reporting they would go the tour by degree of avalanche danger
and level of the tour.
Level of the tour
Avalanche danger MSA BSA OSA
2 – Moderate 100 77 43
3 – Considerable 84 14 6
4 – High 43 2 0

9
Table 3. Results of the logit regression
decision Overconfidence 0.00675**
(0.00215)
Risktaking 0.216** (0.0871)
risktaking^2 -0.0242** (0.0111)
illusion_of_control -0.00485 (0.0307)
unrealistic_optimism 0.0203 (0.0253)
Activity 0.0789 1=ski mountaneering 0=winter hiking (0.0643)
south_tyrol 0.133* omitted category: Trentino region (0.0737)
Veneto -0.146*** omitted category: Trentino region (0.0437)
Gender 0.0742 1=male 0=female (0.0641)
years_experience -0.00115 number of years of experience in practising the activity (0.00245)
age_beginning 0.00522* age at which the practitioner started being engaged in the activity (0.00277)
certified_exp -0.123** 1=mountain guide or Alpine Club instructor 0=no certified experience (0.0415)
tour_done 0.0993** 1=the respondent undertook the tour at least once 0=never took the tour before (0.0345)
frequency2 (omitted category: frequency1 - go on a tour less
than once a week) -0.0142 go on a tour once a week (0.0474)
frequency3 (omitted category: frequency1 - go on a tour less
than once a week) 0.0225 go on a tour more than once a week (0.0619)
exp_company2 (omitted category: exp_company1 - less
experienced partners) -0.0440 equally experienced partners (0.0773)
exp_company3 (omitted category: exp_company1 - less
experienced partners) 0.0476 more exprienced partners (0.0995)
relative_exp2 (omitted category: relative_exp1 - self-assessed
low ski-touring ability) -0.0202 self-assessed average ski-touring ability (0.0499)
relative_exp3 (omitted category: relative_exp1 - self-assessed
low ski-touring ability) 0.0363 self-assessed high ski-touring ability (0.0804)
tour_choice2 (omitted category: tour_choice1 - the respondent
chooses the tour) -0.00767 tour choosen by respondent's partners (0.105)
tour_choice3 (omitted category: tour_choice1 - the respondent
chooses the tour) 0.132** tour choosen by the respondent together with her partners (0.0492)

10
Knowledge -0.0285 number of correct answers given to three specific questions on interpreting the keywords of the W&A report (0.0374)
bsa (omitted category: msa- moderate skier and alpinist / Blachère
scale) -0.596*** good skier and alpinist - Blachère scale (0.0267)
osa (omitted category: msa- moderate skier and alpinist / Blachère
scale) -0.749*** very good skier and alpinist - Blachère scale (0.0226)
danger2 (omitted category: danger1 - hazard level moderate) -0.536*** hazard level considerable / European Average Danger Scale (0.0269)
danger3 (omitted category: danger1 - hazard level moderate) -0.746*** hazard level high / European Average Danger Scale (0.0224)
N 2244 sigma_u 1.005 sigma_e Rho 0.235 Marginal effects; standard errors in parentheses
*p<0.10, **p<0.05, ***p<0.001
As already discussed, this estimate could be biased due to the noise brought in by the
measurement errors. In the sample, 𝑣𝑎𝑟{𝑣𝑖𝑗} is equal to 1261.10, so that, up to sampling error, the
variance of the measurement error is:
𝜎𝑣.2 =
1261.10
18= 70.06 (13)
On the other hand, 𝑣𝑎𝑟{𝑧𝑖.}=95.096. This means that accounting for the measurement error
(and up to sampling error), the variance of the true OC score is:
𝜎𝑎2 = 95.096 − 70.06 = 25.03 (14)
implying that 73.67% of the observed variability of the OC score, 𝑧𝑖., is due to the measurement error:
𝜎𝑣.2
𝜎𝑧𝑖2
=70.06
95.096= 0.7367 (15)
Therefore, up to sampling error, the attenuation bias in (11) turns out to be as large as:
[𝜎𝑎
2
𝜎𝑎2 + 𝜎𝑣.
2]
0.5
= [25.03
25.03 + 70.06]
0.5
= 0.51 (16)
Taking this into account, the estimated value of the effect of a one standard deviation increase
of OC is as large as:

11
0.0658
0.51= 0.1283
In other words, moving from an individual in the left tail of the distribution of the true OC
score – percentile 2.5, say – to an individual in the right tail of the same distribution – percentile 97.5,
say - the probability of undertaking a tour increases approximately by 0.50 (0.1283 ∗ 2 ∗ 1.96; for
convenience, here we refer to the Gaussian distribution).
The risk taking score induces an increase in the probability to undertake the tour of the same
order of magnitude as OC (but the effect is slightly nonlinear). However, there is a crucial difference
in how these two traits may be detrimental for the BS. In fact, while BS’s – and mountaineers in
general – know they are taking some risk and accept it – i.e. they are aware they are risk takers, they
are not at all aware of their own OC and how it influences their decision-making in the avalanche
domain. This way, they end up exposed to the black swan with a probability larger than the one they
attribute to the event. In the context of the decisions taken by an overconfident practitioner, the
substantial lack of awareness undermines all the efforts made by Snow & Avalanche services to
forecast more and more accurately the avalanche risk.
Concerning the control variables included in the regression, it is worth to note that a) the effect
of the age at which respondents have been taught is correlated positively with the probability to
undertake the excursion: ten additional years (meaning that respondents started later in life to practice
backcountry ski) implies an increase in the probability by as much as 0.05; b) mountain guides and
Alpine Club instructors are less prone to take risks associated with ski mountaineering: other things
being equal, the probability to undertake the tour is 0.12 lower; c) the effect of having a direct
knowledge of the tour is positively correlated: for those who did it in the past the probability to
undertake the tour is 0.1 larger; d) subjects who choose the excursion jointly with their mates are 0.13
more likely to undertake the tour.
4. Robustness checks
In this section we assess the robustness of our results to two possible misspecifications of the
analysis. First, there is clear evidence in our data that ACC, the proportion of right answers to the 18
questions is negatively correlated to OC. If ACC had an effect on the decision of the backcountry
skier – more cultured respondents might be less prone to take risk, say - omitting it from the regression
would result in a biased estimate of the effect of OC. As an extreme case, the positive effect we found
for OC might be entirely due to the effect of the omitted ACC. To check it we re-estimated the logit
regression including ACC as an additional regressor. The associated coefficient turns out to be
statistically zero.
Second, and at least partly related to the previous issue, by the way in which OC is defined,
at high values of ACC there is very little – or not at all - room for overconfidence. That is, to uncover
the possible overconfidence of respondents featuring a high ACC score with respect to the 18 items
we selected, an alternative choice of more difficult items should be administered to them. Note that
this mechanical consequence of the definition of OC might account at least partly for the negative
correlation we observe between OC and ACC. To assess whether it affects our estimate, we re-

12
estimated the logit regression excluding from the sample the respondents in the upper tail of the
distribution of ACC. The estimated value of the effect of OC turns out virtually unaffected by this
reshaping of the sample.
5. Conclusions
In this study, we explored how overconfidence and other cognitive factors affect the individual
decision to undergo a backcountry skiing tour exposed to the risk of avalanche. We show that 1)
overconfidence is present and widespread in the sample and 2) practitioners more prone to
overestimate their knowledge are also more likely to take the risk associated to a ski trip exposed to
the avalanche danger. In other words, ‘…our decisions can be influenced by factors that have nothing
to do with the situation, let alone objective facts. What makes those factors insidious is that for the
most part we are unaware of the “illogic” of our own thinking’ [30].
Our results are surely of interest to BS’s. A wrong assessment of the stability of a snow slope
unavoidably leads to an avalanche accident. To make things worse, experience, which could in
principle help the overconfident BS to better ponder her decisions, operates in the opposite direction,
exacerbating the problem. According to the Bayesian updating model developed by [31], upon
receiving new information the rational subject updates her prior beliefs on her own ability to draw an
appropriate decision by evaluating a weighted average of the prior belief and of the new information.
In the light of this, a BS, who successfully completes a number of tours, could erroneously revise
upward the beliefs on her own ability. This way disregarding that, given the low probability of
occurrence of an avalanche accident, a long sequence of successful outcomes is not necessarily the
result of the BS ability, but may occur purely by chance. Unfortunately, a consistent finding in
cognitive psychology is that people tend to take too much credit for their successes and too little
responsibility for their failures [32]. As applied to a case in which the probability of experiencing a
negative event is low or very low, the consequences of this self-enhancing attribution bias might be
extreme, leading to reinforce – rather than downward revise – the prior.
Despite the dramatic improvements over the last 30 years of the probability to survive an
avalanche accident, evidence from the Italian side of the Alps tells that the probability of a fatal
outcome is still above 0.15. Finding that OC plays a critical role in the decision of BS’s suggests that
making them aware of the illogic of their own thinking might be an effective tool to reduce their
exposure to the risk.
Our results are of interest also beyond the specific field of inquiry in all instances in which
decision making under risk is characterized by a trade-off between a more rewarding alternative under
the threat of a black swan and a less rewarding but safer option.
Acknowledgements
The authors thank Accademia della Montagna del Trentino for financial support; William J. Weber
for critical reading of the manuscript; Andrea Ichino for suggesting the robustness checks on our
results.

13
Appendix A
Here we consider the case in which the explanatory variable affected by measurement errors
– the OC score in our case – is included in the regression together with other explanatory variables.
The regression coefficient 𝛽𝑎 in equation (4) is the marginal effect of a unit variation of the true
overconfidence level 𝑎𝑖 on 𝛼𝑖, the largest level of risk the i-th respondent is available to take (and by
that way on the probability of undertaking the tour) holding the other explanatory variables constant.
By holding the other explanatory variables constant the variance of the OC score relevant to equation
(10) falls to 𝜎𝑎2(1 − 𝑅𝑎
2), where 𝑅𝑎2 is the proportion of the variance of the true OC score explained
by the regression on the other explanatory variables included in equation (4).
Clearly, 𝑅𝑎2 can’t be directly measured since the regression of the true OC on the other
explanatory variable is not feasible. The feasible regression is the one of 𝑧𝑖. – the observable OC score
– on the other explanatory variables. Let 𝑅𝑧2 be the fraction of the variance of 𝑧𝑖. explained by this
regression. Then the following identity holds:
(𝐴1) 𝑅𝑧2 =
𝜎𝑎2𝑅𝑎
2
𝜎𝑎2 + 𝜎𝑣.
2
from which we recover:
(𝐴2) 𝑅𝑎2 =
𝑅𝑧2(𝜎𝑎
2 + 𝜎𝑣.2)
𝜎𝑎2
This way we recover the multiplicative attenuation bias as:
(𝐴3) [𝜎𝑎
2(1 − 𝑅𝑎2)
𝜎𝑎2(1 − 𝑅𝑎
2) + 𝜎𝑣.2]
0.5
In the case of the regression of the observable OC score 𝑧𝑖. on the other explanatory variables
results are those in Table A1.
The 𝑅2 of this regression is as large as 0.086, definitely a very low value. But this is driven
by the large variance of the measurement error on the OC score. By taking it into account as in (𝐴2)
the 𝑅2 of the regression of the true overconfidence on the other explanatory variables turns out as
large as:
𝑅𝑎2 =
0.086 (25.03 + 70.06)
25.03= 0.33
Finally, the attenuation bias resulting from (𝐴3) turns out as large as:
[25.03(1 − 0.33)
25.03(1 − 0.33) + 70.06]
0.5
= 0.4395
just marginally lower than the one previously found.

14
Tab. A1: OLS regression of the OC score on the other explanatory variables included in the logit
regression.
overconfidence activity -1.662 1=ski mountaneering 0=winter hiking (2.154)
south_tyrol 1.387 omitted category: Trentino region (1.935)
veneto -2.317* omitted category: Trentino region (1.323)
gender 2.373 1=male 0=female (2.150)
Age 0.0700 (0.0790)
years_experience 0.0555 number of years of experience in practising the activity (0.0890)
certified_exp 4.406** 1=mountain guide or Alpine Club instructor 0=no certified experience (1.353)
frequency2 (omitted category: frequency1 - go on a tour less than once
a week) 0.443 go on a tour once a week (1.397)
frequency3 (omitted category: frequency1 - go on a tour less than once
a week) 1.907 go on a tour more than once a week (1.804)
exp_company2 (omitted category: exp_company1 - less experienced
partners) 2.434 equally experienced partners (2.247)
exp_company3 (omitted category: exp_company1 - less experienced
partners) 3.281 more exprienced partners (2.808)
relative_exp2 (omitted category: relative_exp1 - self-assessed low ski-
touring ability) -0.315 self-assessed average ski-touring ability (1.475)
relative_exp3 (omitted category: relative_exp1 - self-assessed low ski-
touring ability) -0.790 self-assessed high ski-touring ability (2.229)
tour_choice2 (omitted category: tour_choice1 - the respondent
chooses the tour) 1.120 tour choosen by respondent's partners (3.123)
tour_choice3 (omitted category: tour_choice1 - the respondent chooses
the tour) 2.632 tour choosen by the respondent together with her partners (1.729)
Knowledge -1.037 number of correct answers given to three specific questions on interpreting the keywords of the W&A report (1.108)
_cons -5.014 (5.167)
N 274
adj. R2 0.029 Standard errors in parentheses
*p<0.05, **p<0.01, ***p<0.001

15
References
[1] Taleb, NN. The Black Swan: The impact of the highly improbable. New York: Random House;
2007.
[2] Furman N, Shooter W, Schumann S. The roles of heuristics, avalanche forecast, and risk
propensity in the decision making of backcountry skiers. Leisure Sciences. 2010; 32(5): 453-
469.
[3] Schimelpfenig T. Teaching safety awareness. In: Gookin J, editor. NOLS wilderness educator
notebook. Lander, WY: National Outdoor Leadership School; 2003. p. 101-104.
[4] Lichtenstein S, Fischhoff B. Do those who know more also know more about how much they
know?. Organizational Behavior and Human Performance. 1977; 20: 159-183.
[5] Ronis DL, Yates JF. Components of probability judgment accuracy: Individual consistency and
effects of subject matter and assessment method. Organizational Behavior and Human
Decision Processes. 1987; 40(2): 193-218.
[6] Fischhoff B, Slovic P, Lichtenstein S. Knowing with certainty: The appropriateness of extreme
confidence. Journal of Experimental Psychology: Human Perception and Performance. 1977;
3(4): 552.
[7] Lichtenstein S, Fischhoff B, Phillips LD. Calibration of probabilities: The state of the art to 1980.
In: Kahneman D, Slovic P, Tversky A, editors. Judgment Under Uncertainty: Heuristics and
Biases. Cambridge, UK: Cambridge University Press; 1982. p. 275-324.
[8] Klayman J, Soll JB, Gonzalez-Vallejo C, Barlas S. Overconfidence: It depends on how, what, and
whom you ask. Organizational Behavior and Human Decision Processes. 1999; 79(3): 216-
247.
[9] Moore DA, Healy PJ. The trouble with overconfidence. Psychological Review. 2008; 115(2): 502.
[10] Plous S. The psychology of judgment and decision making. New York: McGraw-Hill; 1993.
[11] Svenson O. Are we all less risky and more skillful than our fellow drivers?. Acta Psychologica.
1981; 47(2): 143-148.
[12] Weinstein N. Unrealistic optimism about future life events. Journal of Personality and Social
Psychology. 1980; 39(5): 806-820.
[13] Langer EJ, Roth J. Heads I win, tails it’s chance: The illusion of control as a function of the
sequence of outcomes in a purely chance task. Journal of Personality and Social Psychology.
1975; 32(6): 951-955.
[14] Camerer C, Lovallo D. Overconfidence and excess entry: An experimental approach. American
Economic Review. American Economic Association. 1999; 89(1); 306-318.
[15] Johnson DD. Overconfidence and war. Harvard University Press; 2009.
[16] Johnson DD, Tierney D. The Rubicon theory of war: How the path to conflict reaches the point
of no return. International Security. 2011; 36(1): 7-40.
[17] Malmendier U, Tate G. CEO overconfidence and corporate investment. The Journal of Finance.
2005; 60(6): 2661-2700.
[18] Tuchman BW. The march of folly: From Troy to Vietnam. New York: Random House; 2011
[19] Cheng PYK. The trader interaction effect on the impact of overconfidence on trading
performance: An empirical study. Journal of Behavioral Finance. 2007; 8(2): 59-69.

16
[20] Goodie AS. The effects of control on betting: Paradoxical betting on items of high confidence
with low value. Journal of Experimental Psychology: Learning, Memory, and Cognition.
2003; 29(4): 598–610.
[21] Camchong J, Goodie AS, McDowell JE, Gilmore CS, Clementz BA. A cognitive neuroscience
approach to studying the role of overconfidence in problem gambling. Journal of Gambling
Studies. 2007; 23(2): 185-199.
[22] Hudgens-Haney ME, Hamm JP, Goodie AS, Krusemark EA, McDowell JE, Clementz BA.
Neural correlates of the impact of control on decision making in pathological gambling.
Biological Psychology. 2013; 92(2): 365-372.
[23] Langer EJ. The illusion of control. Journal of Personality and Social Psychology. 1975; 32(2):
311-328.
[24] Zuckerman M, Knee CR, Kieffer SC, Rawsthorne L, Bruce LM. Beliefs in realistic and
unrealistic control: Assessment and implications. Journal of Personality. 1996; 64(2): 435-
464.
[25] Taylor SE, Brown JD. Illusion and well-being: A social psychological perspective on mental
health. Psychological Bulletin. 1988; 103(2): 193.
[26] Weber EU, Blais AR, Betz NE. A domain‐ specific risk‐ attitude scale: Measuring risk
perceptions and risk behaviors. Journal of Behavioral Decision Making. 2002; 15(4): 263-
290.
[27] Blais AR, Weber EU. A domain-specific risk-taking (DOSPERT) scale for adult populations.
Judgment and Decision Making. 2006; 1(1).
[28] Agresti A. Categorical Data Analysis. Wiley; 2013.
[29] Wooldridge J. Introductory Econometrics: A modern Approach. South- Western; 2005.
[30] Larson S. Human Factors in Avalanche Incidents. 2006. Available from:
http://www.summitpost.org/human-factors-in-avalanche-incidents/188636.
[31] Anwar S, Loughran T. Testing a Bayesian learning theory of deterrence among serious juvenile
offenders. Criminology. 2011; 49: 667-98.
[32] Fiske SE, Taylor SE. Social Cognition. New York: McGraw-Hill; 2007.