overtopping of seawalls - assets.publishing.service.gov.uk · depth of water over mound of...
TRANSCRIPT

Overtopping of Seawalls
Research and Development
Project Record W5/006/5
4B A ENVIRONMENT AGENCY

All pulps used in production of this paper is sourced from sustainable managed forests and are elemental chlorine free and wood free
Overtopping ,ofSeawalk
R&D Project Record .W5/006/5
P Besley
Research Contractor:
H R Wallingford Ltd
Further copies of this report are available from: : Environment Agency R&D Dissemination Centre, c/o .- WRc, Frankland Road, Swindon, Wilts SN5 SYF WC tel: 01793-865000 fax: 01793-514562 e-mail: publications@wrcplc;co.uk~
Publishing Organisation Environment Agency Rio House Waterside Drive Aztec West Almondsbury Bristol BS32 4UD
Tel: 01454 624400 Fax: 01454624409
ISBN 1 85705 070 3
0 Environment Agency 1999
All rights reserved. No part of this document may be produced, stored in a retrieval system, or transmitted, in any forrn or by any means, electronic, mechanical, photocopying, recording or otherwise without the prior permission of the Environment Agency.
The views expressed in ‘this document are not necessarily those of the Environment Agency. Its officers, servants or agents accept no liability whatsoever for any loss or damage arising from the interpretation or use of the information, or reliance on views contained herein.
Dissemination Status Internal: Released to Regions External: Released to Public Domain
Statement of Use This document provides full details of the project on overtopping of sea defences and provides the background to the production of Technical Report W178 - Wave Overtopping of Seawalls: Design and‘Assessment Manual.
Research Contractor This document was produced under Environment Agency R&D Project W5-006 by:
HR Wallingford Ltd Howbery Par$ -Wallingford Oxfordshire OX10 8BA
Tel: 01491 835381 Fax: 01491832233
Environment Agency’s Project Manager . The Environment Agency’s Project Manager for R&D Project W5-006 was: Keith Slaney - North East Region
R&D Project Record W5/006/5

CONTENTS
LIST OF FIGURES
page
..‘ 111. ::
LIST OF TABLES iv
NOTATION V
EXECUTIVE SUMMARY vii
1. INTRODUCTION
1.1 Introduction
1.2 Objectives and Methodology
1.3 Report outline
l., ’
1
1
2
2. METHODS OF PREDICTING MEAN OVERTOPPING DISCHARGE : 3
2.1 Introduction 3
2.2 Sloping structures 3
2.3 Vertical structures 8
2.4 Composite structures 12
2.5 Conclusions and recommendations 13
3.
3.1
3.2
3.3
3.4
3.5
METHODS-OF PREDICTING PEAK,OVERTOPPING EVENTS
Introduction
Proportion of waves overtopping a structure
Maximum individual volume
Effect of angled wave attack
Conclusions
15
15
15
17.
17
18
4.
4.1
4.2
4.3
4.4
REVIEW OF SITE-SPECIFIC OVERTOPPING DATA
Introduction
Collation of details of overtopping studies
Assessment of the importance of the data
Assessment of gaps in data
19.
19
19
20
22
R&D Project Record W5/006/5 i
4.5 Data analysis
4.6 Conclusions
5.
5.1
5.2
5.3
5.4
5.5
5.6
5.7
5.8
5.9
CREST WALLS LOCATED ON ROCK-ARMOURED SEAWALLS
Introduction
Crest wall discharge coefficients
Bradbury et al’s data
Owen and Steele’s method
Discharge factors for walls on permeable slopes
Effect of recurved wall on discharge factors
Effect of crest berm width on discharge factors
Design chart
Conclusions
6.
6.1
6.2
6.3
6.4
6.5
6.6
6.7
6.8
ANALYSIS OF WAVE BY WAVE OVlZRTOPPING
Introduction
Experimental technique
Number of waves overtopping
Maximum individual overtopping event
Effect of angled wave attack on number of waves overtopping
Relationship between peak events and mean discharge
Peak flow rates
Conclusions
7.
7.1
7.2
7.3
7.4
THE EFFECT OF CREST BERM WIDTH ON OVERTOPPING DISCHARGES
Introduction
Previous work
Model tests
Test results
22
25
26
26
26
27
27
29
29
30
30
31
32
32
32
33
36
38
39
40
40
41
41
41
42
43
R&D Project Record W5/006/5 ii

7.5 Design guideline
7.6 Conclusions
44
45
8. TOLERABLE OVERTOPPING LIMITS :
8.1 Introduction
8.2 Model studies
8.3 Prototype experiences and observations
8.4 Mean discharges
8.5 Specification of tolerable overtopping
LIST OF FIGURES
Figure 2.1 Figure 2.2 Figure 2.3 Figure 2.4 Figure 2.5. Figure 2.6 Figure 2.7 Figure 2.8
Owen (1980) relationship for impermeable simple slopes Wave return wall Wave return wall design chart (Owen and Steele( 1991)) : Goda’s (1985) graphical design method Overtopping of vertical .wall (Allsop et al (1995)) De Waal’s (1994) -vertical wall overtopping data Vertical wall under impacting wave attack (Allsop et al (1995) Composite structure
Figure-4.1 Overtopping.of simply sloping smooth structure Figure 4.2 Overtopping of SHED armoured slopes with,and without crest berm ., Figure 4.3 Overtopping,of Antifer armoured slopes with crest berms. Figure 4.4 Overtopping of rock armoured slopes with crest,walls Figure 4.5 Overtopping of Accropode armoured slopes Figure-4.6 Effect of slope roughness on overtopping- Figure 4.7 Vertical seawall at Colwyn Bay. Figure 4.8 Overtopping of vertical seawall at Colwyn Bay.
Figure 5.1 Sections tested by Bradbury et al Figure 5.2 Owen and Steele’s (199 1) design chart Figure 5.3 Overtopping of section 14 Figure 5.4 Discharge factors of recurved wall on rock armoured slope Figure 5.5 Discharge factors of crest walls on rock armoured slopes Figure 5.6 Discharge factors for crest wall on rock armoured slope, W+h = 3.73 Figure 5.7 Discharge factors for crest wall on rock armoured-slope, W:ch = 2.64 Figure 5.8 Discharge factors for crest wall on rock armoured slope, W:+h = 2.09 Figure 5.9 Discharge factors for crest wall on rock armoured slope, W:sh = 1.55 Figure 5.10 Discharge factors for crest wall on rock armoured slope,.W:gh =-1.32 Figure 5.11 Discharge factors for crest wall on rock armoured slope, W*h = 0.94 Figure 5.12 Discharge factors for crest wall on rock armoured slope, Wbh = 0.74 Figure 5.13 1: Discharge factors for crest wall on rock armoured slope, W:*h = 0.55 Figure 5.14 Discharge factorsfor crest wall on rock armoured slope, W:+h = 0.40 Figure 5.15 Discharge factors.for crest wall on rock armoured slope,.W*h = 0.20
46
46
46
46
49
49
R&D Project Record W5/006/5 . . . 111

Figure 5.16 Discharge factors for crest walls on rock armoured slopes, selected values of WZh
Figure 5.17 Figure 5.18 Figure 5.19
Figure 5.20
Effect of recurved wall on discharge factors Effect of crest berm on discharge factors Discharge factors for crest walls on rock armoured slopes, selected values of Web Design chart
Figure 6.1 Number of waves overtopping a vertical wall, deep and shallow water Figure 6.2 Number of waves overtopping a vertical wall, impacting waves only Figure 6.3 Number of waves overtopping simple armoured slopes Figure 6.4 Number of waves overtopping sloped structures, all structural types Figure 6.5 Distribution of individual overtopping volumes: reflecting waves Figure 6.6 Distribution of individual overtopping volumes, impacting waves Figure 6.7 Predicted and measured maximum volume Figure 6.8 Relationship between mean discharge and peak event, (reflecting waves) Figure 6.9 Relationship between mean discharge and peak event (impacting waves) Figure 6.10 Relationship between mean discharge and peak event (Structure A) Figure 6.11 Relationship between mean discharge and peak event (Structure B)
Figure 7.1 Figure 7.2 Figure 7.3 Figure 7.4 Figure 7.5 Figure 7.6 Figure 7.7 Figure 7.8
Effect of crest width on overtopping, Lowe (199 1) Accropode armoured structure Rock armoured structure Overtopping without crest berm.(Accropode armoured structure) Overtopping without crest berm (rock armoured structure) . Effect of crest width on overtopping (Accropode armoured structure) Effect of crest width on overtopping (rock armoured structure) Effect of crest width on overtopping (dimensionless data)
Figure 8.1 Tolerable mean discharges
LIST OF TABLES
Table 2.1 Table 2.2 Table 2.3
Table 4.1 Table 4.2
Table 5.1 Table 5.2 Table 5.3
Table 7.1 Table 7.2 Table 7.3 Table 7.4
A and B coefficients : simply sloping seawalls A and B coefficients : bermed structures Roughness coefficients
Overtopping studies included in the review Type of overtopping measurements
Geometric parameters of sections tested by Bradbury et al Regression analysis to equation of form Df = X A+ ’ Regression analysis to equation of form Df = X Q”b ’
Herbert & Reeves (199 1) overtopping results Lowe (199 1) overtopping results Overtopping test wave conditions Overtopping test results
R&D Project Record W5/006/5 iv

NOTATION
a:b empirically determined coefficients (France, vertical walls) A,B empirically determined coefficients (Owen, slopes) A,B, C. Weibull fitting coefficients AC A<<, 4 Cf cw d Df h:: h Hs HSO LO N ow Nv
0, P(V) % Qb Q%
Q:%v
QL Q Qh Qd
RI1
Rd
RC
St11
sop
Till
T 1170
TP
T, 4” Vbar
Armour crest freeboard Dimensionless armour crest freeboard = A, / (T, (g H,)“.5) empirically determined coefficients crest berm reduction factor Crest berm width depth of water over mound of composite structure return wall discharge.factor wave breaking parameter.= (h/H,) (2n;hlgT,‘) water depth at the toe of the seawall significant wave height at the toe of the seawall offshore significant.wave height deep water wave length number of waves overtopping. number of waves in sequence overtopping ratio for angled wave attack probability of non-exceedance of individual -volume, V peak discharge at point of wave breaking mean overtopping base discharge (Owen and Steele) dimensionless mean discharge (Owen, slopes) = Q / (gT,,,Hs) dimensionless mean discharge (van der Meer and de Waal, slopes) = Q / (sop/(g H,: .tana))‘.”
dimensionless mean discharge. (France, vertical walls) = Q / (gH,3)0.” dimensionless mean discharge (Goda,.vertical walls) = Q / (2gH&‘)‘. dimensionless mean discharge (Allsop et al, vertical walls) = Ql(gh’)‘.‘/ h:e! dimensionless mean discharge (Allsop et al, composite structures) = Q/(gd’)‘.’ / d:?
mean overtopping discharge per unit length of seawall mean discharge measured at a distance of w behind crest roughness coefficient dimensionless crest freeboard (Owen, slopes) = R, / (Tlni(gH5)O.j ) dimensionless crest freeboard (van der Meer and de Waal, slopes) = R, (s,,,)~~~/ (H,b tan a)
dimensionless crest freeboard (Allsop et al, vertical walls) = (RJH,) h:* dimensionless crest.freeboard (Allsop et al, composite structure) = (R,/Hs)(d/H,)d.
crest elevation above still water level nominal wave steepness = H&b : offshore sea steepness =2nH,olgT,02 mean zero crossing wave period at the toe of the seawall . . offshore mean zero crossing period peak wave period at the toe of the seawall offshore peak wave.period : individual overtopping volume average individual overtopping volume
R&D Project Record W5/006/5 V

maximum individual overtopping volume wave return wall height dimensionless wave return wall height
angle of the seawall slope to the horizontal angle of wave attack to the normal ratio of wave height to water depth at breaking reduction factor for angled wave attack (France, vertical walls) total reduction factor = yb,‘{f,ys,yh (van der Meer and de Waal, Slopes)
reduction factor for berms reduction factor for roughness reduction factor for oblique short crested wave attack reduction factor for depth-limited wave attack reduction factor for structural type (France) reduction factor for number of waves overtopping Gamma function surf similarity parameter = tana / (s&O.
R&D Project Record W5/006/5 vi
EXECUTIVE SUMMARY
Man-made -defences, predominantly in the form of. seawalls protect approximately 860 kilometres (23%) of the English coast. These defences range from simple earth embankments, through vertical concrete walls and onto more complex composite structures often involving wave return walls and/or rock armouring. Regardless of structural type, the purpose of a seawall is usually to prevent erosion of the coastline and. to limit the risk of marine inundation of the hinterland.
Over the past twenty years much research has been undertaken in the UK and elsewhere into the overtopping performance of seawalls and related structures. In the UK the Ministry of Agriculture, Fisheries and. Food under Commission FD02 :has funded most of this research effort.
The research has concentrated on providing techniques for predicting the mean overtopping discharge, and hence consequent flood volumes and drainage requirements, for a range of commonly~occurring seawall types. Little, or no attention, has been paid to either. the peak individual (wave-by-wave) overtopping discharge or to the numberof waves likely to overtop a particular defence, despite the importance of these two parameters in determining the overall standard of performance of a sea defence.
It is now recognised that :- * peak overtopping discharges represent the most hazardous events for pedestrians ‘and
vehicles moving behind the wall, and that for certain seawall.designs the‘peak individual discharge may also be the event initiating .damage to, or failure of, the defence
l the -number of waves overtopping a seawall is the most easily. recorded -indicator of overtopping .performance, being amenable to both visual observation and capture on video cameras etc. As -such, if suitable relationships can be established, the number of overtopping waves provides the most obvious means of calibrating prediction techniques defined in terms of either mean or peak individual discharge.
This project record draws together and summarises previousresearch into the overtopping performance of seawalls. Data is re-analysed to provide a set of consistent design techniques, representing the most reliable approach to the assessment of seawall overtopping by wave action. The empirical formulae .presented in the Wave Overtopping of Seawalls.Design.and Assessment Manual,. R & D Technical Report W178, is based on the. data described within this project record.- :
The manual is intended to be.used by flood and coastal defence engineers responsible for the design of new seawalls or the assessment and possible remediation of existing structures.
KEY WORDS
Flood control works, coastal structures, breakwaters, vertical seawalls, sloping seawalls, mean and peak overtopping discharges, tolerable discharge, normal and oblique wave attack.
R&D Project Record W5/006/5 vii

1. INTRODUCTION
1.1 . Introduction
Over the last ten years MAFF have funded a long-term research programme into .methods to predict overtopping discharges over different types of sea defences. The performance of many structures such as embankments and vertical walls -has been analysed for a range of conditions,.under both normal and.oblique wave attack. In addition, complimentary work has been carried out in Holland and Italy, for dyke and composite caisson structures.-
The objective of this-project is to bring together results of all relevant work carried out to date and to present them-in the form of a design manual. Traditionally, design for-the overtopping of seawalls has been concerned with the.mean overtopping discharge. It has recently become acknowledged, however, that peak discharges are of greater significance to the safety of users of a seawall than mean discharges. The design methods presented in the manual will therefore provide means of calculating not just mean overtopping discharges but also peak overtopping discharges, expressed in terms of the largest volume contained in a single overtopping wave. The manual will .also make recommendations concerning tolerable overtopping limits in termsof peak discharges.
This project record describes the work involved in formulating the design methods recommended in the manual. It includes a review and assessment of research. previously conducted by HR Wallingford and.other organisations, as well as descriptions of research conducted especially for the purposes of this.project. The manual, .which summarises the work described in this report,- is published as Wave Overtopping of Seawalls R&D Technical ReportW178.
1.2 . Objectives and Methodology
The principal objective of the project was to collate ,and compile in an integrated format all the appropriate information regarding the- overtopping of seawalls. The work% and methods used in the project are described below:-
(0 A thorough- review of all the available. information. regarding the overtopping of seawalls was carried out. :This included data in the possession of HR Wallingford as well as other sources. The source data was largely in the form of physical model test results, but also included results acquired from prototype monitoring programmes-and on-site observations. All aspects of overtopping-were examined, including mean and peak discharges and tolerable limits.
(ii) Some aspects of overtopping have been the subject of a considerable number’ of investigations and- there. are inevitable differences in their methodologies and conclusions. Where data sources or design methods contradicted one- another, the most appropriate for inclusion in the manual had to be identified;
(iii) Areas in which data was regarded as insufficient were identified. Where appropriate, these gaps in,the knowledge were filled by additional experiments or by re-analysis of existing data.
R&D Project Record W5/006/5 1
(iv) The data was compiled in an integrated format which would form the basis of the new manual.
1.3 Report outline
The project record outline is described below: -
Chapter 2 provides a review of the most widely accepted methods of predicting mean overtopping discharges of seawalls. A variety of types of structure are examined, which include sloped and vertical seawalls. The effect of both normal and angled wave attack is considered. Where two or more calculation procedures are available their merits are discussed and the most appropriate method recommended.
Chapter 3 examines methods to predict peak overtopping events. Results are presented for a variety of structural types. This area has been the subject of considerably less research than mean discharges.
Chapter 4 examines site-specific data, i.e., that which is concerned with a specific structure rather than a structural type. Such data can be used to validate, and in some cases extend, prediction methods. As well as looking at model tests, Chapter 4 also examines the results of a prototype monitoring programme conducted on a vertical seawall.
The next three Chapters each examine in detail an aspect of overtopping design which was identified in the review as potentially benefitin g from additional research or analysis. Chapter 5 looks at the effectiveness of crest walls on permeable slopes, by re-examining an existing data set. A modified design method is proposed as a result.
Chapter 6 presents analysis of peak individual overtopping volumes. Model test data held by HR Wallingford in which individual wave-by-wave overtopping volumes were measured is re-examined. The relationships between mean and peak discharges are examined for a variety of structures.
Chapter 7 looks at the effect of a permeable crest berm on mean overtopping discharge, an area which is not sufficiently considered in existing design methods. A programme of model tests was commissioned and carried out. The results of these tests form the basis of a new design rule.
Chapter 8 examines tolerable overtopping limits in terms of peak events. The source data includes observations, experiences and video records from prototype seawalls under storm conditions.
R&D Project Record W5/006/5 2

2. METHODS OF PREDICTING MEAN OVERTOPPING DISCHARGE
2.1 Introduction
This chapter reviews the most widely accepted methods for predicting the overtopping of seawalls. A variety of structural forms are examined, including sloped-seawalls, vertical. seawalls, composite seawalls and seawalls with return walls. The effect of. both normal and angled wave attack is examined. In each case the merits of the various methods are discussed and recommendations made -as to. the most appropriate for inclusion in the manual. All’ the methods discussed here apply to mean discharges only. Prediction of maximum individual. overtopping volume is dealt with in Chapter 3.
2.2 Sloping structures
2.2.1 Normal- wave attack A considerable number of studies have been undertaken into the overtopping performance-of seawalls. Many of these earlier studies were completed in the USA and used regular wave physical model studies. Subsequently, a number of authors .have produced design methods to predict mean overtopping discharge. The most comprehensive series of random .wave studies was completed by Owen (1980),. who investigated the performance of simply sloping and bermed structures. More recently van der Meer and de Waal (1992) have .proposed an alternative set of equations. This section examines both of these methods in detail.
Owen (1980))carried out a number of physical model tests to study overtopping and determined a relationship linking the height of the seawall and the overtopping discharge. A. method was developed for predicting:. overtopping discharge utilising relatively simple,. straightforward formulae.
In Owen’s (1980) equation the height of the seawall and the discharge are expressed in terms of the dimensionless freeboard and the dimensionless discharge.: The dimensionless freeboard, R::, is defined as :-
Re = R, / (T,JgH,)‘.’ ) (2.1)
where R, is the crest elevation above still water-level T,,, is the mean zero crossing.wave period at. the toe of the seawall HS is the significant wave height at the toe of the seawall
Note that wave conditions are defined at the toe of the seawall. The numerical value of R:g is small when a low seawall is attacked by large or long period waves. The physical significance of Rois perhaps best appreciated if it is re-written in the following form :-
R:- = (R;/ H,) (s,,,/~K)~.~ (2.2)
where sill is the nominal wave steepness (= H&J. L, is the deep water wave length
R&D Project Record W5/006/5
The second definition indicates that, for waves of constant steepness, Ra is simply related to the ratio of the crest freeboard to the wave height.
The dimensionless discharge, Q*, is defined as :-
Q = Q / (gT,,HS) (2.3)
where Q is the mean overtopping discharge in terms of discharge per unit length of seawall.
Again the physical significance of QG is perhaps best illustrated by re-writing it as :-
Q+ = (Q / (gH,‘)0.5 ) (s,/2n)‘.j (2.4)
For waves propagating onto a beach or up a sloping seawall the peak discharge, qb, at the point of the wave breaking is given approximately by :-
qb = (gH,‘)O.’ / (2 8°‘5) (2.5)
where 6 is the ratio of the wave height to the water depth at breaking.
It can be seen therefore that Q:P can be re-written as :-
Q:l: = (Q / qb ) (S,,/27C)0~” / (2 6°.5) (2.6)
or in other words, for constant wave steepness and breaking ratio, Q:k is simply related to the ratio of the overtopping discharge to the wave breaking discharge.
Owen’s (1980) physical model tests led to an experimental formula linking the dimensionless overtopping discharge to the dimensionless freeboard for a simple seawall :-
Q:;: = A exp ( - B RJr ) (2.7)
where Q+ = Q / (gT,HS) R:b = R, / (Tm(gHJo.j) r = roughness coefficient A and B are empirically determined coefficients
A seawall is thus defined by its crest freeboard, and the gradient and roughness of its slope. The wave climate is defined by the mean period and significant waveheight at the toe of the structure.
Owen (1980) derived, or interpolated, values of A and B for simple seawalls ranging in slope angle from 1: 1 to 1:5. Figure 2.1 plots equation 2.7 for a selection of simply sloping impermeable seawalls. Owen (1980) also found that the equations derived for simply sloping seawalls could equally be applied to the bermed structures tested in the study, albeit with modified empirical coefficients. The original coefficients proposed by Owen (1980) have recently been revised as further research has become available. Tables 2.1 and 2.2 give the recommended values for simply sloping and bermed structures respectively. The values of A and B were determined experimentally within the following range of parameters :-
R&D Project Record W5/006/5 4
0.05 < R:g < 0.30 1o-6 < Q:s. < lo-* 1.5 < h/H, < 5.5 . 0.035 ,< W-L < 0.055
where h is the water depth at the toe of the seawall
Owen (1980) produced typical values of the roughness coefficient based upon the relative run-up performance of alternative types of construction. ‘Results are given in Table 2.3.
Work on structures armoured -with concrete units (Besley et al (1996)), suggests that the Owen (1980) formula, although giving an acceptable estimate of the hydraulic performance, does not accurately predict.the overtopping discharge over a wide range of RK Data suggest that’ the point at which the prediction line intersects the Q:$. axis depends on the type of armouring. Equation 2.7 can not account for this through .-variation of r alone. The intersection on the Q:x axis is given by the. coefficient A, which should be a function of the structure slope only.
To predict the. overtopping performance of a structure armoured with concrete units with confidence it is therefore recommended that model tests should be carried out.- Where this is not possible, model results from a similar configuration to that of the proposed design may be used.to estimate the mean overtopping discharge, using a regression based on A, B and,r=l: Where no model data is available the Owen (1980) formulae using.published values -of A, B and a roughness coefficient will give an estimate of .the mean overtopping discharge acceptable for use during the preliminary design stage.
An important factor affecting the performance of permeable seawalls.is the width of the crest berm. Very little data concerning the effect of permeable crest berms on- overtopping discharges is available. A variety of site-specific model tests had suggested that. the overtopping-discharge reduces by a factor of .lO for every 10m landward of the top of the sIope. This factor has been adopted as an approximate design rule.- It was felt, however, that a more precise relationship could be determined. A programme of model- tests was commissioned and carried out for this purpose. The results are described in Chapter 7 of this report.
The Owen (1980) method has been extended by. Owen and Steele (1991) to include the influence of wave return walls (Figure 2.2) located on impermeable seawalls. The effect of the return wall was. described by an empirically. determined discharge factor, Df. The discharge factor of a return wall is the ratio of the overtopping discharge over a seawall with the return wall in place to that over the same seawall without a return -wall. I Results were produced for a variety of seawall slopes and return .wall heights and presented in the form of a gr.aphical design method (Figure 2.3). The Owen and .Steele (1991) method isolated the effect of the height of the return wall from that of the seawall -on which it was based. .The discharge factor determined for a particular height of return-wall could be thus be applied. to other situations.
Bradbury et al (1988) derived an alternative method to describe the performance of return walls on .permeable slopes, Overtopping performance was described. in terms of the freeboard .of the overall structure. This approach does not -therefore address the question of the efficacy of raising. the crest wall as compared to raising the. armour:crest level. The
R&D Project Record W5/006/5 5

performance of wave return walls on permeable slopes was one of the areas identified as requiring additional analysis for the purposes of the manual. An examination of Bradbury et al’s (1988) original data set suggested that, with re-analysis, it could form the basis of an improved design method. This method is presented in Chapter 5 of this report.
Recently van der Meer and de Waal (1992) have proposed an alternative series of equations to estimate overtoppin g for simply sloping and bermed seawalls. Wave overtopping is expressed by one of two formulae, the choice of which depends on whether the structure is subject to plunging (breaking) or surging (non-breaking) waves. Plunging waves are defined as those where the surf similarity parameter, cop, < 2, whilst for surging waves &,,, 2 2.
The surf similarity parameter is defined as :-
(2.8)
where a is the angle of the seawall slope to the horizontal sop is the offshore sea steepness (=2nHS0/gTp0*) H,, is the offshore significant wave height T,, is the offshore peak wave period.
For plunging waves the crest freeboard and discharge are non-dimensionalised as follows :-
&, = R, & /(H,, tan a) (2.9)
Q+ = Q&so,, / (g H?, tan a)) (2. IO)
These equations are related using :-
Qi;,, = O.O6exp(-5.2R,,/y) (2.11)
where is the total reduction factor = ‘/b yfyf’y, yh is the reduction factor for berms is the reduction factor for roughness is the reduction factor for oblique short crested wave attack is the reduction factor for depth-limited wave attack
For surging waves the parameters are non-dimensionalised as follows :-
R:s,r = R, 1 H,,
Qe,, = Q&H:,,)
(2.12)
(2.13)
and are related by :- QC,, = 0.2exp (-2.6R:,, lr) (2.14)
The equations of Owen (1980) and van der Meer and de Waal (1992) both have advantages and disadvantages for the designer. The Owen (1980) equation is simple to use but-requires numerous empirical coefficients in order to study different wall profiles. Alternatively the van der Meer and de Waal (1992) equations are more complicated to use, but do not use
R&D Project Record W5/006/5 6

different empirical coefficients for. alternative seawall profiles. The drawback of reducing to one the number of empirical coefficients in the van der Meer and de Waal (1992) equations is that a significant amount of averaging has.been applied in the derivation of the equations. This has resulted in a loss of definition in the calculated overtopping discharges for any particular seawall profile.
Furthermore the work of Owen (1980) uses input wave conditions derived at the toe of the seawall. This is in contrast to van der Meer and de Waal (1992) who.use deep water wave conditions as input and then allow for. wave breaking through the use of yh. The method of calculating ~1, proposed by van der Meer and de Waal (1992) is strictly’only applicable to foreshore slopes of 1: 100. This may significantly influence the results on, say, UK shingle beaches backed by a seawall. Under extreme conditions the shingle beach may, be completely submerged and form a steep foreshore slope for the incident waves.
After much deliberation the authors have concluded that the method proposed by Owen (I 980) is presently the most appropriate- means of estimating overtopping discharges’ at smooth simply sloping and bermed seawalls around the UK coastline. It is considered that the use of a large.number of empirical coefficients is a minor drawback in comparison to the increased accuracy of the results.
2.2.2 Angled wave attack. : The work described. above applies to normal wave attack only. A variety of authors have investigated the influence of angled wave attack on overtopping discharge.
Owen (1980) and de Waal and van der Meer (1992) investigated the performance,of simply sloping and bermed seawalls under angled wave attack. Under long crested waves Owen. (1980) noted that overtopping could increase, compared to normal wave attack, for attack angles of up to 30” to the normal with the maximum increase occurring at 15”.
De Waal and van der Meer (1992) derived equations to describe the reduction factor for overtopping under oblique wave attack, -fp. It is intended that this factor.be used in the van der IMeer and de Waal equations (1992). described above (equations 2.11 and 2.14). For long-crested waves :-
yp = co? @-lo”> (2.15)
where p is the angle of wave attack to the normal in degrees.
Equation 2.15 is valid for yp 2 0.60. When 0’ I p I 60” then yp = 1.
For short-crested waves the reduction factor is given by :-
yp = 1 - 0.0033 p (2.16)
Banyard and Herbert (1995) have reported separate equations to describe the behaviour of simply sloping and, bermed seawalls in short-crested seas. These equations enable the overtopping ratio,. O,, to be calculated where 0, is defined as the ratio. of overtopping at a given wave angle to that predicted under normal wave attack., For simply sloping seawalls :-
R&D Project Record W5/006/5
0, = -0.000152 p” + 1 (2.17)
and for bermed seawalls:-
(2.18)
The behaviour of the two types of seawall differed considerably, with the bermed structure exhibiting a greater reduction in overtoppin g: for a given wave angle, than the simply sloping seawalls. The difference in performance was particularly noticeable at small angles of wave attack. Banyard and Herbert (1995) also found that the overtopping at angled attack was in all cases less for long-crested seas that for short-crested. The above equations can thus be applied conservatively to long-crested seas.
The authors concluded that the Banyard and Herbert (1995) method was most appropriate for inclusion in the manual. The de Waal and van der Meer (1992) equation and the Banyard and Herbert (1995) equations show similar trends and have a similar range of applicability. The de Waal and van der Meer (1992) equation, however, is intended for use with van der Meer and de Waal’s (1992) overtopping equations (2.11 and 2.14). As the overtopping manual will use Owen’s (1980) equation to calculate normal mean discharge, the Banyard and Herbert (1995) method is considered more appropriate.
The behaviour of recurved walls located on top of sloped seawalls under angled wave attack was also investigated by Banyard and Herbert (1995). They related the overtopping reduction factor to the discharge factor, Df, by the following equation :-
0, = - 1.18 Ln@f)-0.4 (2.19)
This equation is valid for all angles up to and including 45’ and is applicable to both short and long-crested seas. The general trend of the data showed that overtopping at angled wave attack is greater than that at normal wave attack (i.e. 0, > 1) for values of Df less than 0.3 1.
This contrasts with the results of Franc0 (1996) who found that, as with other structures, the overtopping of a recurve wall on a slope tended to reduce as the angle of attack increased. However, it is felt that the relative height of the wave return wall (and hence Df) may be an important factor in this phenomenon. The authors therefore recommend that the method of Banyard and Herbert (1995) be adopted even though it may be overIy conservative.
2.3 Vertical structures
2.3.1 Normal wave attack Vertical or near vertical seawalls protect a significant length of the UK coastline. These seawalls are common in urban areas and are often sited behind shingle or sandy beaches. A number of authors have studied the overtopping of vertical walls.
Goda (1985) investigated the overtopping performance of plain vertical seawalls for approach slopes of 1: 10 and I:30 and offshore sea steepnesses, som =2-nH,,-JgT,,2 ( where H,, and Tmo are respectively the offshore significant wave height and period) ranging from 0.012 to 0.036.
R&D Project Record W5/006/5 8

Goda (1985) proposed a design method .based on a:graphical format. For a given approach ‘. bathymetry and offshore.sea steepness, a dimensionless discharge, QgG, was plotted on the y- axis against h/H,, on the x-axis. .H is the depth of water at the toe of the structure and Q”G is given by :-
QG = Q / (2g&,“)“~” (2.20)
Lines of constant relative freeboard, RC/HSO, .were illustrated on each graph, where,R, is the height of the crest of the wall above still water level. Figure 2.4 shows an example.
The wave- conditions and bathymetry considered by Goda (1985) are generally unrepresentative of conditions around the UK coastline where storm sea steepnesses are greater and approach slopes are shallower. Consequently, work was carried out by Herbert (1993) to confirm and- extended the work of Goda (1985) to typical UK conditions. Conditions were varied to cover approach bathymetries of 1: 10, I.:30 and 1: 100 and offshore sea steepnesses of 0.017:< soln < 0.060, where som : 2~cH,,,/gT~~*. The measured overtopping data gave good agreement with the work of Goda (1985):
The weakness of the work of Goda (1985)‘and Herbert (1993) is that significant interpolation is required. The influence of the offshore bathymetry must be assessed by selecting the nearest simple seabed slope whilst graphs are only available for a limited number of offshore- sea steepnesses.
Analysis by Besley et al. (1994) suggested that the prediction method developed by Owen (1980) for slopes could be applied to vertical walls if inshore values of wave height and mean. period were used. Overtopping of a wall in relatively shallow waters depends on the inshore. wave height, period and form of breaking. Analysis of the tests on simple vertical walls completed at HR Wallingford in 1994 using the inshore wave conditions gave the following relationship between Q:: and R* :-
Q::: = 0.002 exp (-26.76 IL) (2.21) I
Franc0 (1993) conducted physical model studies to investigate the effects of overtopping,on vertical structures. Eventually a formally similar -approach to Goda (1985) was produced, using an exponential relationship linking .the height of the- structure and the. overtopping discharge. However the-. formula was expressed ,in terms of different dimensionless parameters:..
The dimensionless parameter that accounts for the influence of’ the structure freeboard on overtopping is simply expressed as the ratio of .the freeboard to the inshore wave height, RJH;:
The numerical value of RJH, is small when a low seawall is attacked by large waves. The parameter does not take account of the wave steepness and therefore assumes that the process of overtopping.is not directly influenced by the wave period.
The dimensionless parameter, Q”, that accounts for the mean overtopping discharge is expressed as :-
Q’. = Q / (gH,“)‘.j
R&D Project Record W5/006/5
(2.22)
9

The significant difference between Owen’s (1980) equation and France’s (1993) equation resides in the omission of any direct wave period or steepness term in the Franc0 (1993) parameters. A better correlation was generally achieved when fitting data to the Franc0 (1993) parameters, reflecting the low dependence on wave period of run-up on vertical walls.
Numerous physical model tests led to an experimental formula that links the overtopping discharge to the structure freeboard :-
Q” = a exp (-bWW’yx) (2.23)
Where a and b are experimental constants yX is a reduction factor which accounts for structural type
The reduction factor ‘ix is applied for a wide range of structures including simple vertical walls, retreated (shifted) crest walls, curved parapet walls, perforated front wall (wave screen) or rubble mound protection. Values of a and b have been proposed by a number of authors. The following is a brief summary.
Franc0 et al (1994) and Franc0 (1996, 1998) investigated the overtopping of vertical breakwaters in deep water only. The following equation was derived for relative freeboards ranging from 0.9 < RJH, < 2.2 :-
Q’ = 0.082 exp(-3.0RJHJ (2.24)
Allsop et al (1995) have derived an empirical equation of the same form as that of Franc0 as follows:-
Q” = 0.03 exp (- 2.05 RJH,) (2.25)
This equation, which covers a range of relative freeboards of 0.03 < R&I, < 3.2, is applicable to vertical walls in both deep and shallow water.
The data of Allsop et al (1995) is plotted with equations 2.24 and 2.25 in Figure 2.5. If equation 2.24 is extrapolated to higher values of relative freeboard, R,/H,, it under-predicts the overtopping discharge. As the bathymetry and the crest level of the models used were fixed, high values of relative freeboard correspond to shallower water depths and thus the presence of breaking waves.
The data from a separate study conducted by de Waal (1994) is shown in Figure 2.6. It can be seen that Allsop et al’s (1995) equation 2.25 and de Waal’s (1994) data set correspond quite closely.
At higher values of relative freeboard, Figure 2.6 suggests that there is considerably more scatter in the data. As explained above, these results correspond to conditions in which breaking waves predominate. Further analysis of the combined data sets of Allsop et al (1995) and de Waal (1994) has identified that the overtopping performance of vertical walls is dependent upon the type of incident wave conditions. In deep water waves hit the structure and are generally reflected back seawards (so called reflected waves). However, as the waves become limited by the available water depth, they are prone to break over the seawall (so
R&D Project Record W5/006/5 10

called impacting waves) causin g a change in the overtopping .performance. Overtopping equations were subsequently derived for both types of wave action.
A wave breaking parameter, h:k, was defined which dictates,whether .waves at the structure are dominated by impacting or reflecting waves. h:b is defined by :-
h:g = (h/H,) (2nhlgT,,‘) (2.26)
Reflecting waves dominate when hx > 0.3;. Impacting-waves dominate when h:g I 0.3. The formulation. of h:a reflects the fact that waves are more likely to break if the wavelength or the wave height is large compared to water depth.
Separating their data according to h:ti, Allsop et al (1995) determined that,-for h- > 0.3, the mean overtopping. discharge was accurately described by an equation of the .form of equations 2.23 to 2.25, but with-new a and b:parameters :-
Q’ = 0.05 exp ( -2.78 R&Is ) (2.27)
For h::: 2 0.3,.however, a different relationship was determined: To reflect the importance of wave breaking, new dimensionless discharge and freeboard parameters, both incorporating h:c, were defined thus :-
QI1 = q / ( gh” ) OS / h:::2
R,, =. (R,/Hs) h:::
(2.28)
(2.29)
Examination of all the results from both Allsop et al’s (1995) and de Waal’s (1994) data sets for which h:s < 0.3 produced the.following relationship :-
Qh = 1.37 x 1 Od R,, -? (2.30)
The data and the prediction line is shown in Figure 2.7. Equation 2.30 therefore .provides a good prediction of the mean overtopping discharge of a vertical wall subject to breaking waves.
The goodness of fit of the data was superior to all previous equations and, for this reason, equations -2.27 and 2.30 are recommended for use with vertical walls.
2.3.2 Angled wave attack
The influence of wave angle on the overtopping performance of a vertical -wall in short- crested and long-crested seas has been studied by Banyard and Herbert (1995). Overtopping under oblique waves was found to be up to eight times greater than the value for normal wave attack.
The value of the overtopping ratio, 01-: (defined above) was found.to be dependent upon on relative freeboard, R&I,. The overtopping ratio increased as the relative freeboard increased, i.e., the greatest increases in overtopping. were for. conditions in. which the normal wave attack discharge was expected to be small. Banyard and Herbert (1995) calculated the overtopping ratio on the basis of a predicted normal discharge rather than a directly measured
R&D Project Record W5/006/5 11

one. This allows considerable scope for inaccuracy: particularly in cases where the predicted normal discharge is small.
Further work on the overtopping performance of vertical walls under angled wave attack was carried out by Franc0 (1996). The overtopping equations of the form given above, were modified by the incorporation of a factor, y, thus :-
Q” = a exp (-bRJH,/y) (2.3 1)
y has the effect of changing the slope of the plot of Q” against R&I,. Values of y were determined for a variety of wave approach angles and for short and long crested waves and different wave steepnesses. For vertical walls the most severe case was found to be long crested waves. y was found to decrease linearly from 1 to 0.72 up to angles of 45’, after which it remained approximately constant up to an angle of 60’
The results were in contrast to those of Banyard and Herbert (1995) in that discharges were found to be lower under angled attack compared to under normal attack. It must be borne in mind that France’s results were obtained from a direct comparison between measured discharges at normal and angled attack. Furthermore they were backed up by those of other researchers (Danish Hydraulics Institute, reference not available) who achieved very similar results. For these reasons the method of Franc0 (1996) is recommended for use with vertical walls.
2.4 Composite structures
2.4.1 Normal wave attack A composite structure is a hybrid of a vertical wall and a rubble mound. An example is shown in Figure 2.8. Such structures are not common in the UK, although the methods described here can be applied to vertical structures repaired or improved by the addition of a rubble mound to the toe. Composite walls were examined by Allsop et al (1995) and it was discovered that the overtopping discharge was significantly affected by the relative size of the mound. In order to account for this the wave breaking parameter is re-defined using the depth of water over the mound, d, as well as h, as follows :-
d* = (d/H,) (2nhlgT,,‘) (2.32)
This parameter can be used to decide whether the mound is “small” or “large”. When d. > 0.3 the mound is defined as small and has little effect on the incident waves. In this case the structure behaves as a plain vertical wall and, since he > d*, reflected wave conditions apply. The overtopping discharge is then described by equation 2.27.
When d- 5 0.3, however, the mound is larger and begins to affect the incident waves. The dimensionless discharge and freeboard are then defined in a similar manner to those of vertical walls (equations 2.28 and 2.29) as follows :-
Rd = (R&&i) (d&i) d*
R&D Project Record W5/006/5
(2.33)
12
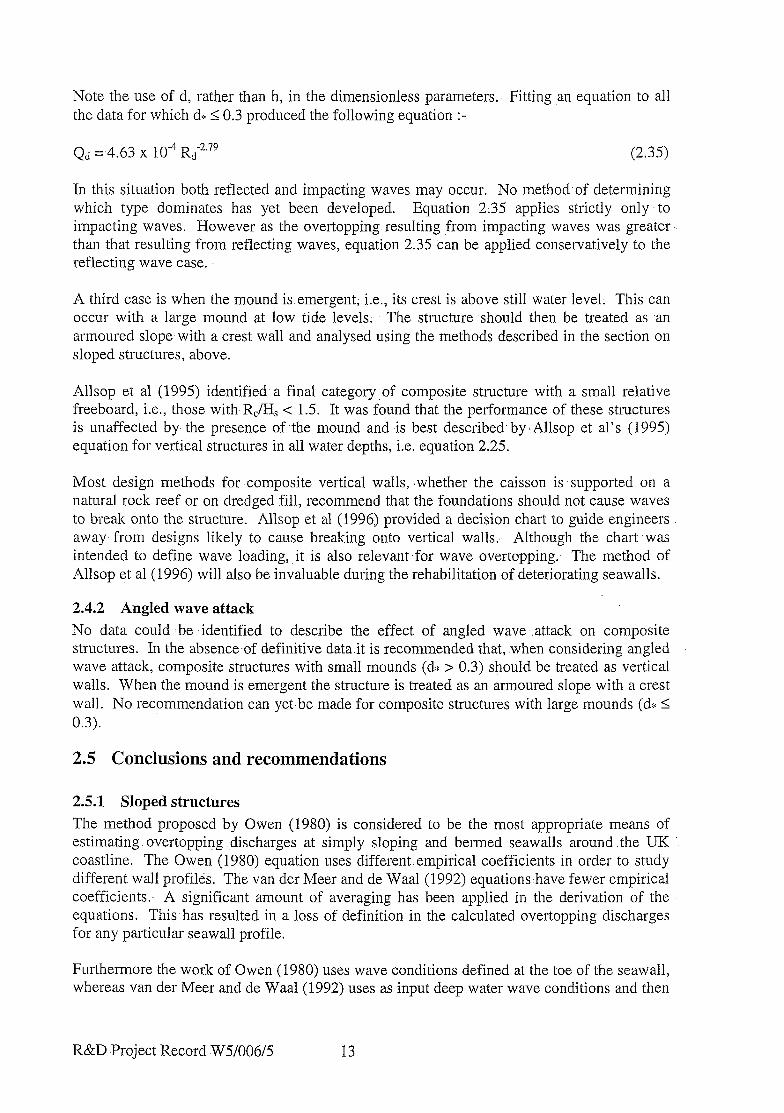
Note the use of d, rather than h, in the dimensionless parameters.. Fitting an equation to all the data for which d:> S 0.3 produced the following equation :-
Qd = 4.63 x lo-” Rd-7.7g (2.35)
In this situation both reflected and impacting waves may occur. No method-of determining which type dominates has yet been developed. Equation 2;35 applies strictly only to impacting waves. However as the overtopping resulting from- impacting waves was -greater than that resulting from reflecting waves, equation 2.35 can be applied conservatively to the reflecting wave case.
A third case is when the mound is emergent, i.e., its crest is above still water level; This can occur with a large mound at low tide levels. The structure should then be treated as an armoured slope with a crest wall and analysed using the methods described in the section on sloped structures, above.
Allsop et al (1995) identified- a final category,of composite structure with a small relative freeboard, i.e., those with, R,/I& < 1.5. It was found that the performance of these structures is unaffected by- the presence of -the mound and is best described- by LAllsop et al’s (1995) equation for vertical structures in all water depths, i.e. equation 2.25.
Most design methods for composite vertical walls, .whether the caisson is supported on a natural rock reef or on dredged fill, recommend that the foundations should not cause waves to break onto the structure. Allsop et al (1996) provided a decision chart -to guide engineers away- from designs likely to cause breaking onto vertical walls.,- Although the chart .was intended to define wave loading, it is also relevant.for wave overtopping.- The method of Allsop qt al (1996) will also be invaluable during the rehabilitation of deteriorating seawalls.
2.4.2 Angled wave attack No data could -be identified to describe the effect of angled wave .attack on composite structures. In the absence of definitive data it is recommended that, when considering angled wave attack, composite structures with small mounds (d:s > 0.3) should be treated as vertical walls. When the mound is emergent the structure is treated as an armoured slope with a crest wall. No recommendation- can yet be made for composite structures with large mounds (d:s I 0.3).
2.5 Conclusions and recommendations
2.5.1 Sloped structures The method proposed by Owen (1980) is considered to be the- most appropriate means of estimating overtopping. discharges at simply slopin, 0 and bermed seawalls around .the UK coastline. The Owen (1980) equation uses different.empirical coefficients in order to study different wall profiles. The van der Meer and de Waal (1992) equations.have fewer empirical coefficients.- A significant amount of averaging has been applied in the derivation of the equations. This has resulted in a loss of definition in the calculated overtopping discharges for any particular seawall profile.
Furthermore the work of Owen (1980) uses wave conditions defined at the toe of the seawall, whereas van der Meer and de Waal(1992) uses as input deep water wave conditions and then
R&D Project Record W5/006/5 13
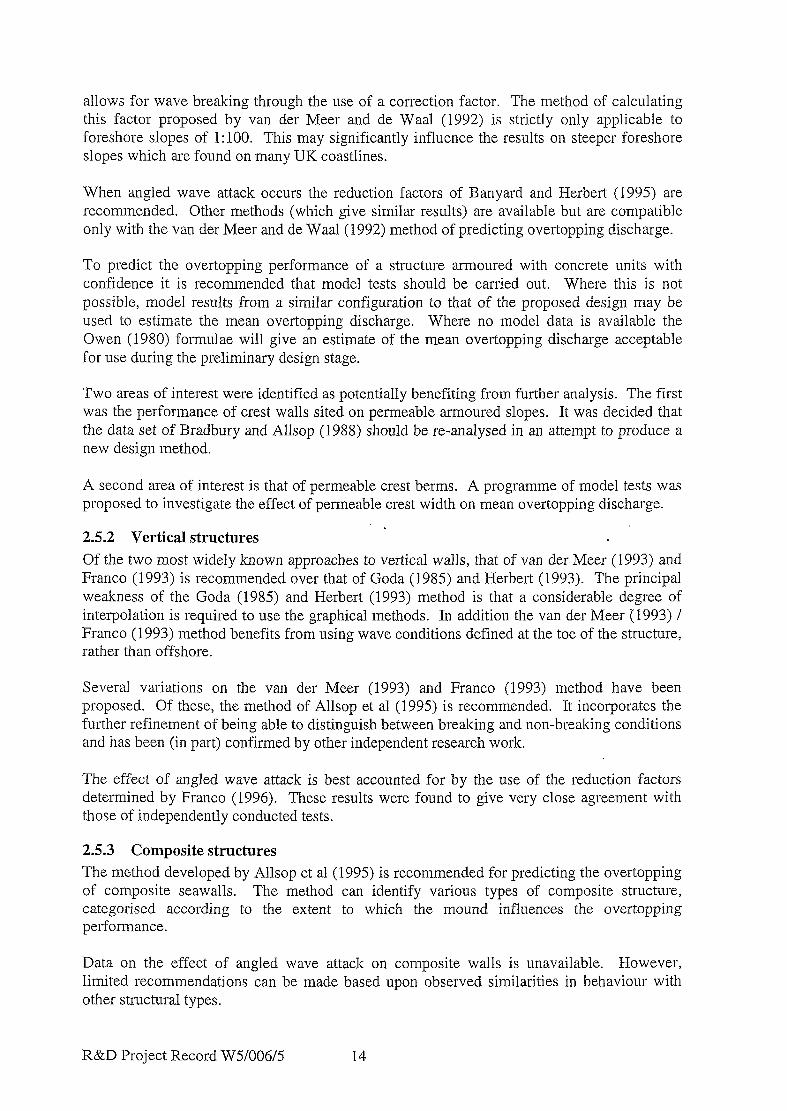
allows for wave breaking through the use of a correction factor. The method of calculating this factor proposed by van der Meer and de Waal (1992) is strictly only applicable to foreshore slopes of 1:lOO. This may significantly influence the results on steeper foreshore slopes which are found on many UK coastlines.
When angled wave attack occurs the reduction factors of Banyard and Herbert (1995) are recommended. Other methods (which give similar results) are available but are compatible only with the van der Meer and de Waal (1992) method of predicting overtopping discharge.
To predict the overtopping performance of a structure armoured with concrete units with confidence it is recommended that model tests should be carried out. Where this is not possible, model results from a similar configuration to that of the proposed design may be used to estimate the mean overtopping discharge. Where no model data is available the Owen (1980) formulae will give an estimate of the mean overtopping discharge acceptable for use during the preliminary design stage.
Two areas of interest were identified as potentially benefiting from further analysis. The first was the performance of crest walls sited on permeable armoured slopes. It was decided that the data set of Bradbury and Allsop (1988) should be re-analysed in an attempt to produce a new design method.
A second area of interest is that of permeable crest berms. A programme of model tests was proposed to investigate the effect of permeable crest width on mean overtopping discharge.
2.5.2 Vertical structures .
Of the two most widely known approaches to vertical walls, that of van der IMeer (1993) and Franc0 (1993) is recommended over that of Goda (1985) and Herbert (1993). The principal weakness of the Goda (1985) and Herbert (1993) method is that a considerable degree of interpolation is required to use the graphical methods. In addition the van der 1Meer (1993) / Franc0 (1993) method benefits from using wave conditions defined at the toe of the structure, rather than offshore.
Several variations on the van der Meer (1993) and Franc0 (1993) method have been proposed. Of these, the method of Allsop et al (1995) is recommended. It incorporates the further refinement of being able to distinguish between breaking and non-breaking conditions and has been (in part) confirmed by other independent research work.
The effect of angled wave attack is best accounted for by the use of the reduction factors determined by Franc0 (1996). These results were found to give very close agreement with those of independently conducted tests.
2.5.3 Composite structures The method developed by Allsop et al (1995) is recommended for predicting the overtopping of composite seawalls. The method can identify various types of composite structure, categorised according to the extent to which the mound influences the overtopping performance.
Data on the effect of angled wave attack on composite walls is unavailable. However, limited recommendations can be made based upon observed similarities in behaviour with other structura1 types.
R&D Project Record W5/006/5 14
3. METHODS OF PREDICTING PEAK OVERTOPPING EVENTS
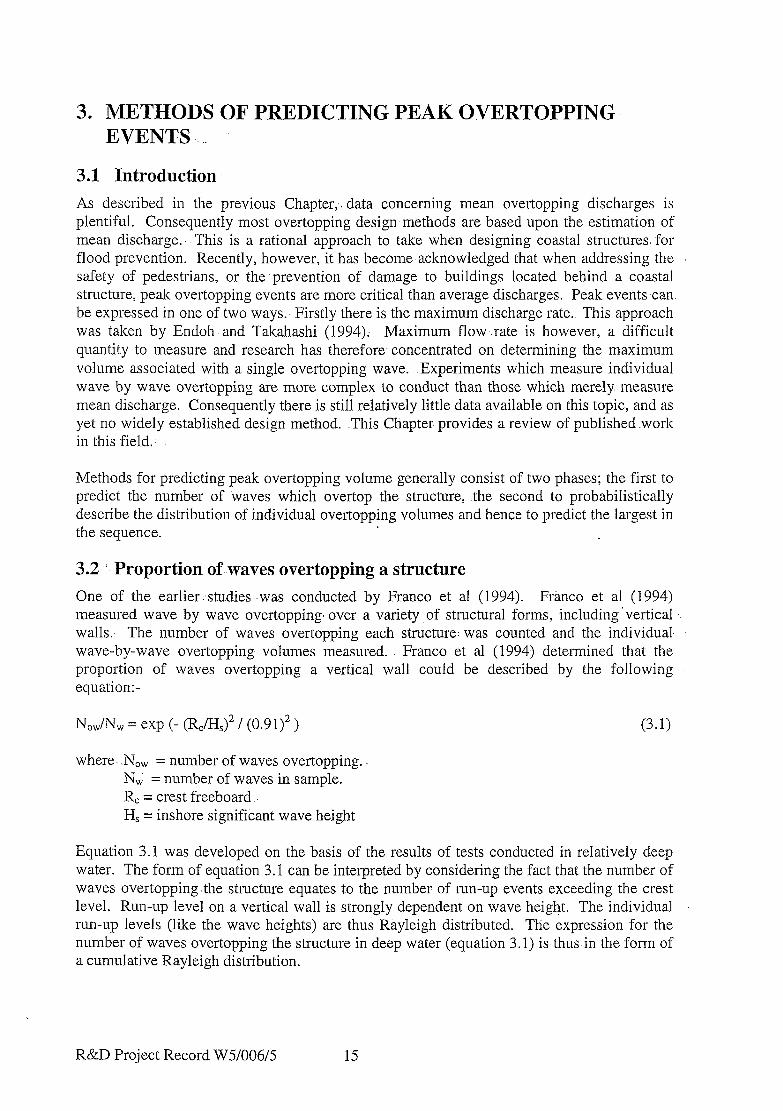
3.1 Introduction
As described in the previous Chapter,-. data concerning mean overtopping discharges is plentiful. Consequently most overtopping design methods are based upon the estimation of mean discharge. This is a rational approach to take when designing coastal structures. for flood prevention. Recently, however, it has become-acknowledged that when addressing the safety of pedestrians, or the prevention of damage to buildings located behind a coastal structure, peak overtopping.events are more critical than average discharges. Peak eventscan be expressed in one of two ways.- Firstly there is the maximum discharge rate.. This approach was taken by Endoh and Takahashi (1994). Maximum flow .rate is however, a difficult quantity to measure and research has therefore concentrated on determining the maximum volume associated with a single overtopping wave. .Experiments which measure individual wave by wave overtopping are more complex to conduct than those which merely. measure mean discharge. Consequently there is still relatively little data available on this topic, and as yet no widely established design method. .This Chapter provides a review of published .work in this field.-
Methods for predicting peak overtopping volume generally consist of two phases; the first to predict the number of waves which overtop the structure, the second to probabilistically describe the distribution of individual overtopping volumes and hence to predict the largest in the sequence.
3.2 :i Proportion of -waves overtopping a structure
One. of the earlier ,studies was conducted by Franc0 et al (1994). Franc0 et al (1994) measured wave by wave overtopping. over a variety of structural forms, including’vertical walls.. The number of waves overtopping each structure: was counted and the individual, wave-by-wave overtopping volumes measured. Franc0 et al (1994) determined that the proportion of waves overtopping a vertical wall could be described by the following equation:-
Now/N, = exp (- (RJHS)2 / (0.9 1)” ) (3.1)
where .N,, = number of waves overtopping. Ni = number of waves in sample. R, = crest freeboard H, = inshore significant wave height
Equation 3.1 was developed on the basis of the results of tests conducted in relatively deep water. The form of equation 3.1 can be interpreted by considering the fact that the number of waves overtopping the structure equates to the number of run-up events exceeding the crest level. Run-up level on a vertical wall is strongly dependent on wave height. The individual run-up levels (like the wave heights) are thus Rayleigh distributed. The expression for the number of waves overtopping the structure in deep water (equation 3.1) is thus in the form of a cumulative Rayleigh distribution.
R&D Project Record W5/006/5 15
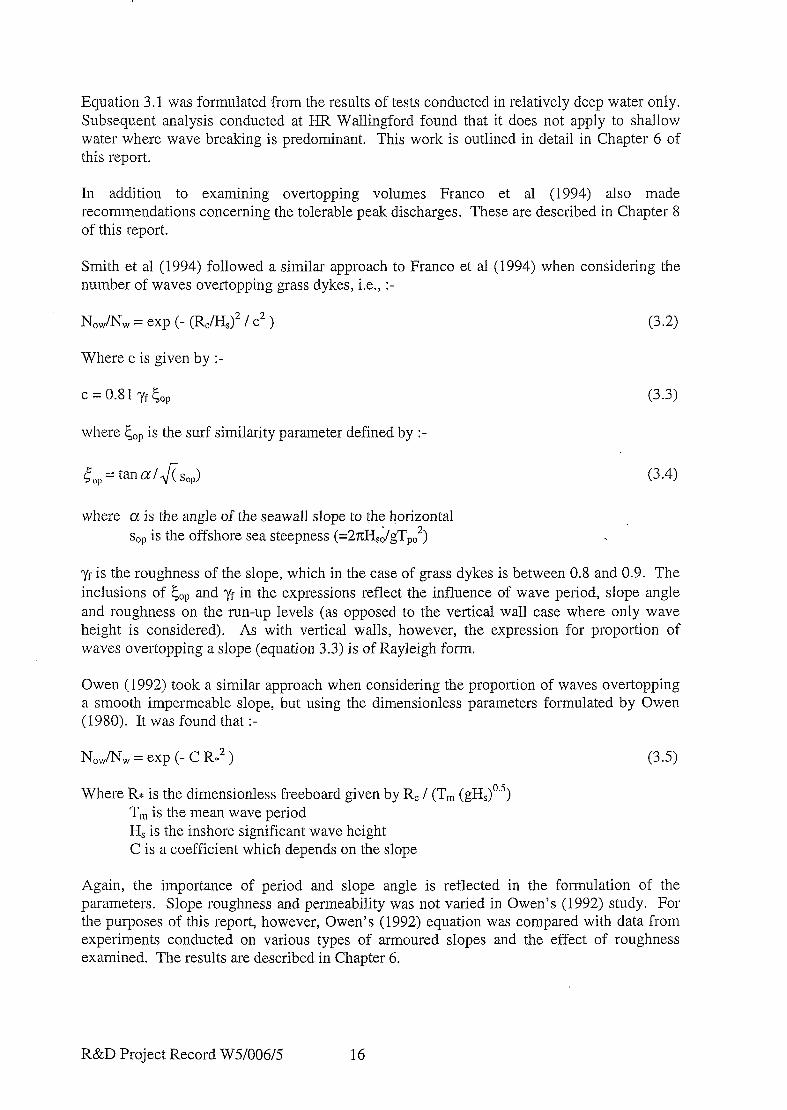
Equation 3.1 was formulated from the results of tests conducted in relatively deep water only. Subsequent analysis conducted at HR Wallingford found that it does not apply to shallow water where wave breaking is predominant. This work is outlined in detail in Chapter 6 of this report.
In addition to examining overtopping volumes Franc0 et al (1994) also made recommendations concerning the tolerable peak discharges. These are described in Chapter 8 of this report.
Smith et al (1994) followed a similar approach to Franc0 et al (1994) when considering the number of waves overtopping grass dykes, i.e., :-
NdNw = exp (- (RJHs)2 / c2 ) (3.2)
Where c is given by :-
c = 0.81 y&Jp (3.3)
where c,,,, is the surf similarity parameter defined by :-
5,,,, = tan &Lo,)
where a is the angle of the seawall slope to the horizontal sop is the offshore sea steepness (=2r~H~>gT~~~)
‘yf is the roughness of the slope, which in the case of grass dykes is between 0.8 and 0.9. The inclusions of & and q{f in the expressions reflect the influence of wave period, slope angle and roughness on the run-up levels (as opposed to the vertical wall case where only wave height is considered). As with vertical walls, however, the expression for proportion of waves overtopping a slope (equation 3.3) is of Rayleigh form.
Owen (1992) took a similar approach when considering the proportion of waves overtopping a smooth impermeable slope, but using the dimensionless parameters formulated by Owen (1980). It was found that :-
KdN, = exp (- C R.’ ) (3.5)
Where R?: is the dimensionless freeboard given by R, / (T,, (gH,)O.‘) T,, is the mean wave period H, is the inshore significant wave height C is a coefficient which depends on the slope
Again, the importance of period and slope angle is reflected in the formulation of the parameters. Slope roughness and permeability was not varied in Owen’s (1992) study. For the purposes of this report, however, Owen’s (1992) equation was compared with data from experiments conducted on various types of armoured slopes and the effect of roughness examined. The results are described in Chapter 6.
R&D Project Record W5/006/5 16
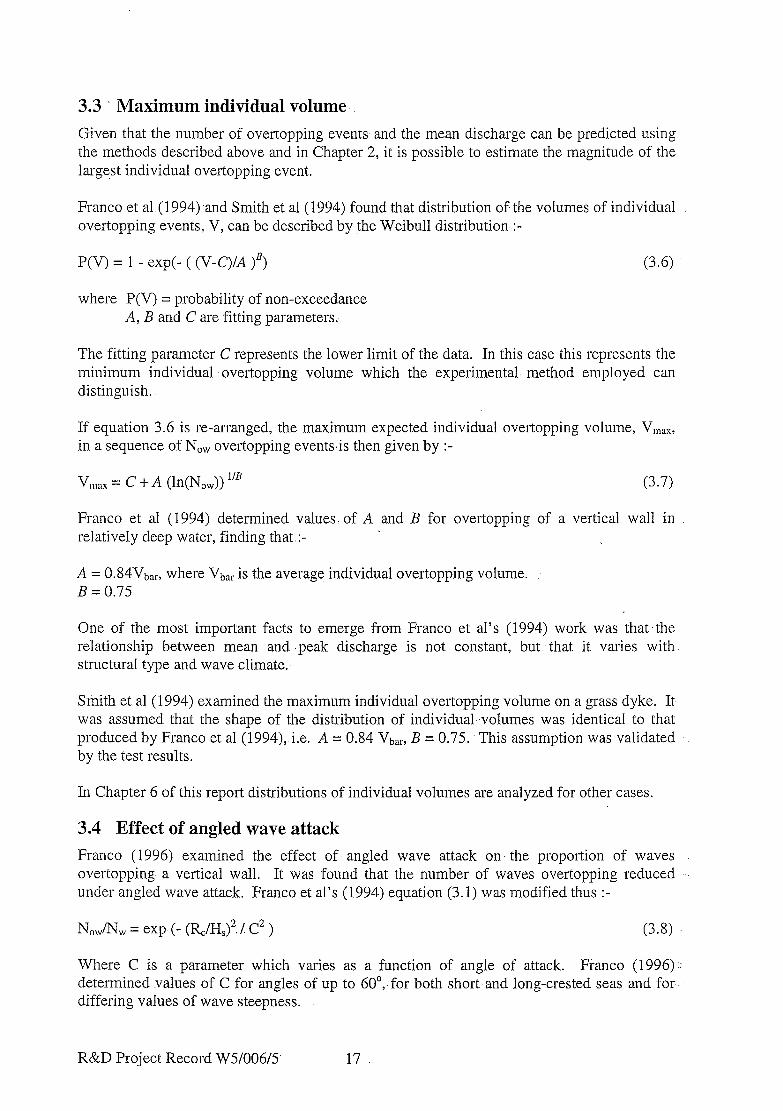
3.3 Maximum individual volume
Given that the number of overtopping events and the mean discharge can be predicted using the methods described above and in Chapter 2, it is possible to estimate the magnitude of the largest individual overtopping event.
Franc0 et al (1994) .and Smith et al (1994) found that distribution of, the volumes of individual overtopping events, V, can be described by the Weibull distribution-:-
p(v) = 1 - exp(- ( (V-C)/A )B) (3.6)
where P(V) = probability of non-exceedance A, B and C are fitting parameters.
The fitting parameter C represents the lower limit of the data. In this case this represents the minimum individual overtopping volume which the experimental. method employed can distinguish.
If equation 3.6 is re-arranged, the maximum expected individual overtopping volume, VlnaX, in a sequence of N,, overtopping eventsis then given by :-
V,,l,, = C + A (ln(N,,)) ‘B (3.7)
Franc0 et al (1994) determined values: of A and B for overtopping of a vertical wall in relatively deep water, finding that :-
A = 0.84Vb,,, where Vbar is the average individual overtopping volume. : B = 0.75
One of the most important facts to emerge from Franc0 et al’s (1994) work was that .the relationship between mean and .peak discharge is not constant, but that it varies with structural type and wave climate.-
Smith et al (1994) examined the maximum individual overtopping volume on a grass dyke. It- was assumed that the shape of the distribution of individual..volumes was identical to that produced by Franc0 et al (1994), i.e. A = 0.84 Vbar, B = 0.75.. This assumption was validated by the test results.
In Chapter 6 of this report distributions of individual volumes are analyzed for other cases.
3.4 Effect of angled wave attack
Franc0 (1996) examined the effect of angled wave attack on. the proportion of waves overtopping a vertical wall. It was found that the number of waves overtopping reduced .. under angled wave attack. Franc0 et al’s (1994) equation (3.1) was modified thus :-
N,,/N, = exp (- (R,/H,)‘./ C2 ) (3.8)
Where C is a parameter which varies as a function of angle of attack. Franc0 (1996) determined values of C for angles of up to 60”,-for both short,and long-crested seas and for differing values of wave steepness.
R&D Project Record W5/006/5 17

Franc0 (1996) found that for normal wave attack with long-crested seas that C = 0.9 1, in agreement with Franc0 et al (1994), and for angled wave attack C < 0.91. Similar reductions were noted for short crested seas.
For sloped structures, Franc0 (1996) determined reduction factors to be incorporated in Smith et al’s (1994) equation for the number of waves overtopping a slope (equation 3.2), thus :-
(3.9)
Franc0 (1996) produced very similar results to Smith et al (1994) for long crested waves with normal attack (finding that ypow = 0.94 rather than 1) and finding that ypow < 1 for angled attack.
3.5 Conclusions
Most overtopping design methods are based upon the estimation of mean discharge. When addressing the safety of users of a coastal structure2 or the prevention of damage to buildings located behind a coastal structure, peak overtopping events are more critical than average discharges. Prediction methods for individual overtopping volumes are less well established than that those for mean discharges.
In order to predict the maximum individual overtopping volume it is generally necessary to estimate the number of waves which overtop the structure. This can be achieved by considering the run-up of the individual waves: Probabilistic methods can then be employed to estimate the largest individual volume in the waves which overtop the structure. The Weibull distribution has been shown to be suitable for this purpose.
R&D Project Record W5/006/5 18
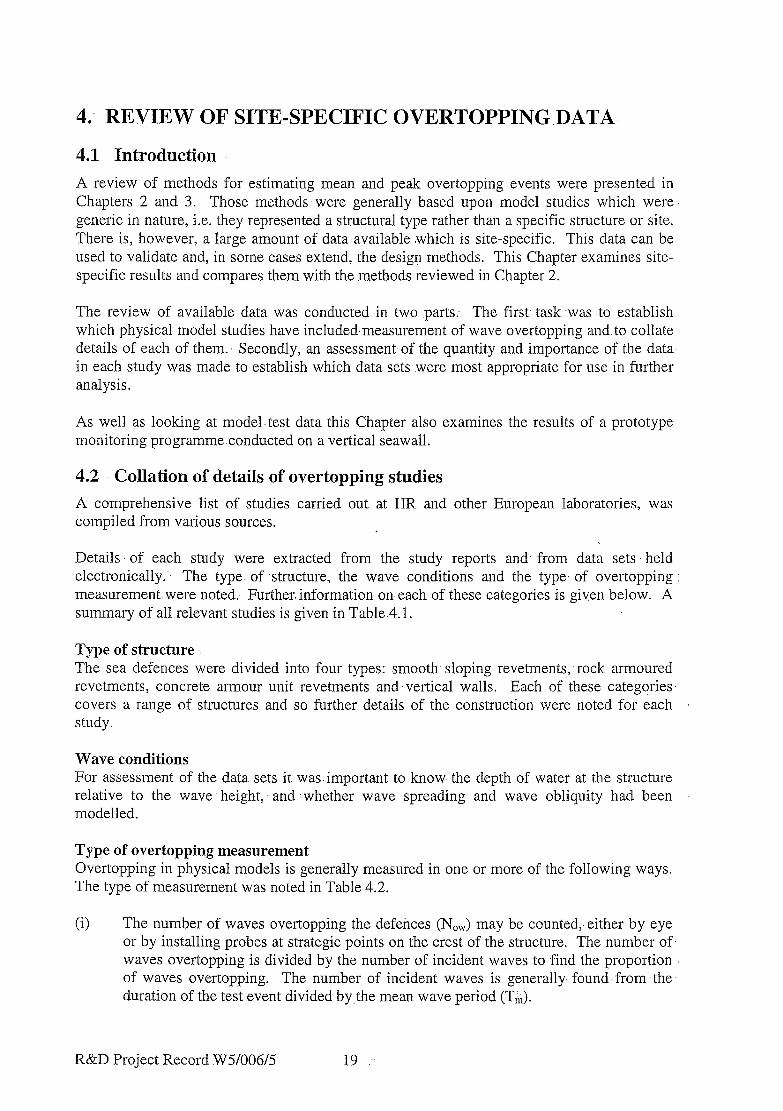
4. REVIEW OF SITE-SPECIFIC OVERTOPPING.DATA
4.1 Introduction
A review of methods for estimating mean and peak overtopping .events were presented in Chapters 2 and 3. Those methods were generally based upon model studies which were- generic in.nature, i.e. they represented a structural type rather than a specific structure or site. There is, however, a large amount of data available .which is site-specific. This data can be used to validate and, in some cases extend, the design methods. This Chapter examines site- specific results and compares them with the methods reviewed in Chapter 2.
The review of available data was conducted in two parts: The first task was -to establish which physical model studies have included,measurement of wave overtopping and to collate details of each of them.’ Secondly, an assessment of the quantity and importance of the data- in each study was made to establish which data sets were most appropriate for use in further analysis.
As well as looking at model test data this Chapter also examines the results of a prototype monitoring programme conducted on a vertical seawall.
4.2 Collation of details of .overtopping studies
A comprehensive list of studies carried out at HR and other European laboratories, was compiled from various sources.
Details of each study were extracted from the study reports and, from data sets held electronically. The type of .structure, the wave conditions and the type. of overtopping : measurement .were noted. Further. information on each of these categories is given below. A summary of all relevant studies is given in Table.4.1.
Type of structure The sea defences were divided into four types: smooth sloping revetments, rock armoured revetments, concrete armour unit revetments and vertical walls. Each of these categories covers a range of structures and so further details of the construction were noted for each study.
Wave conditions For assessment of the data sets it was.important to know the depth of water. at the structure relative to the wave height, and ‘whether wave spreading and wave obliquity had been modelled.
Type of overtopping measurement Overtopping in physical models is generally measured in one or more of the following ways. The type of measurement was noted in Table 4.2.
(9 The number of waves overtopping the defences (N,,) may be counted,- either by eye or by installing probes at strategic points on the crest of the structure. The number of, waves overtopping is divided by the number of incident waves to find the proportion of waves overtopping. The number of incident waves is generally found from the. duration of the test event divided by.the mean wave period (T&).
R&D Project Record W5/006/5 19
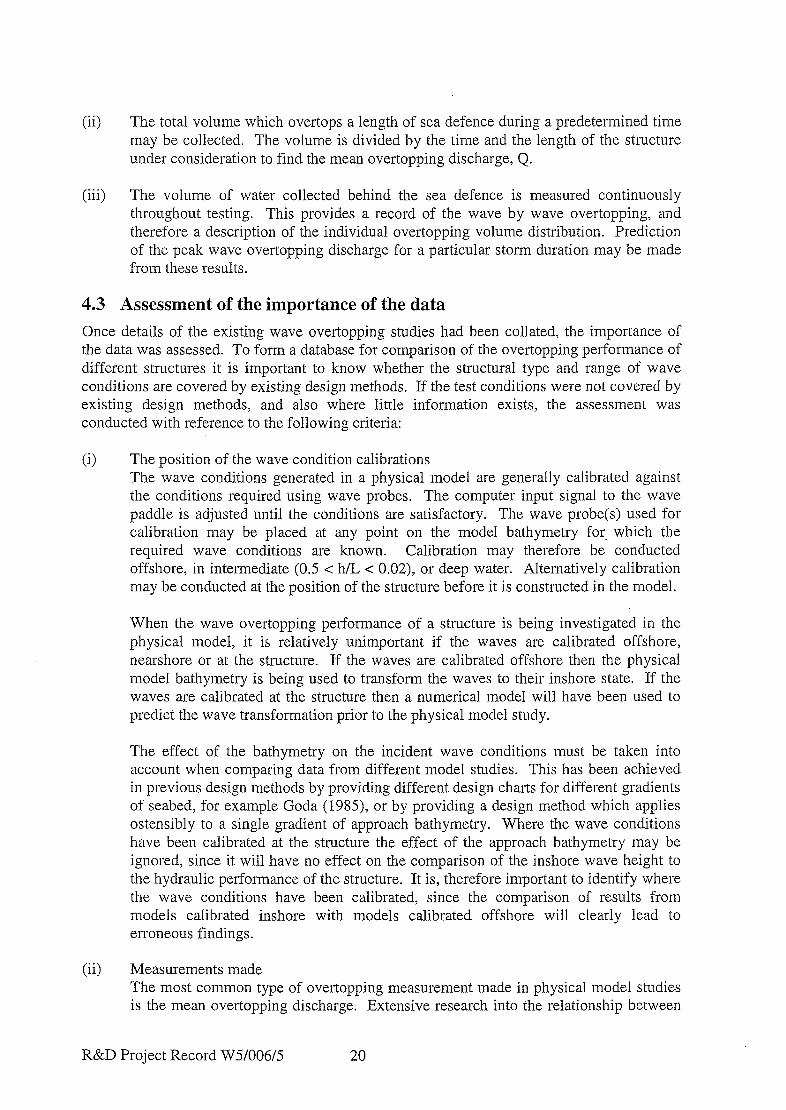
(ii) The total volume which overtops a length of sea defence during a predetermined time may be collected. The volume is divided by the time and the length of the structure under consideration to find the mean overtopping discharge, Q.
(iii) The volume of water collected behind the sea defence is measured continuously throughout testing. This provides a record of the wave by wave overtopping, and therefore a description of the individual overtopping volume distribution. Prediction of the peak wave overtopping discharge for a particular storm duration may be made from these results.
4.3 Assessment of the importance of the data
Once details of the existing wave overtopping studies had been collated, the importance of the data was assessed. To form a database for comparison of the overtopping performance of different structures it is important to know whether the structural type and range of wave conditions are covered by existing design methods. If the test conditions were not covered by existing design methods, and also where little information exists, the assessment was conducted with reference to the following criteria:
(9 The position of the wave condition calibrations The wave conditions generated in a physical model are generally calibrated against the conditions required using wave probes. The computer input signal to the wave paddle is adjusted until the conditions are satisfactory. The wave probe(s) used for calibration may be placed at any point on the model bathymetry for. which the required wave conditions are known. Calibration may therefore be conducted offshore, in intermediate (0.5 < h/L < 0.02): or deep water. Alternatively calibration may be conducted at the position of the structure before it is constructed in the model.
When the wave overtopping performance of a structure is being investigated in the physical model, it is relatively unimportant if the waves are calibrated offshore, nearshore or at the structure. If the waves are calibrated offshore then the physical model bathymetry is being used to transform the waves to their inshore state. If the waves are calibrated at the structure then a numerical model will have been used to predict the wave transformation prior to the physical model study.
The effect of the bathymetry on the incident wave conditions must be taken into account when comparing data from different model studies. This has been achieved in previous design methods by providing different design charts for different gradients of seabed; for example Goda (1985), or by providing a design method which applies ostensibly to a single gradient of approach bathymetry. Where the wave conditions have been calibrated at the structure the effect of the approach bathymetry may be ignored, since it will have no effect on the comparison of the inshore wave height to the hydraulic performance of the structure. It is, therefore important to identify where the wave conditions have been calibrated, since the comparison of results from models calibrated inshore with models calibrated offshore will clearly lead to erroneous findings.
(ii) Measurements made The most common type of overtopping measurement made in physical model studies is the mean overtopping discharge. Extensive research into the relationship between
R&D Project Record W.5/006/5 20

(iii) Types of structure The most common type of structure to be tested is the -rubble mound with. rock- armour. Although concrete armour units -are. alsb. tested frequently, there are many different types of armour.unit.- Consequently, only a few data sets are available for- each type. Physical model testing of plain sloping and vertical walls have also been carried out.
(iv> Obliquity / wave spreading Most structures are tested from only one wave direction, usually. the predominant wave direction for the study site. Where a number of wave directions are required an investigation of the overtopping’ performance under oblique wave attack. may be conducted in a wave basin. Wave flume. studies are only used- for studying normal wave,attack on sea defences.
The waves generated in physical modelsare generally long-crested, where successive wave crests are parallel and the wave energy propagates in one direction, only. These conditions are generated using a wave paddle which extends the full width of the. model. Under certain circumstances, short-crested waves are used, where spreading of the wave energy is simulated. Such conditions are created using -a wave machine with short paddle segments, which are individually controlled by the wave generation computer. Short-crested waves provide a more realistic simulation of the wave conditions which occur. where winds are.locally generated.
(v> Improvement of quality of. data : If only offshore wave conditions were available and the foreshore bathymetry .was known, inshore wave conditions. were calculated at the toe of the structure. Inshore wave conditions were calculated using the BR Wallingford WENDIS model which represents. the physical processes of shoaling due to depth variation, and energy dissipation due to bed friction and wave breaking. The model ,has been calibrated against physical model- data sets. The model was also compared to design curves from the wave energy. decay model ENDEC, and to computations using Goda’s
the structural form of the sea defence, the wave condition and the mean discharge has been conducted previously and is reviewed in Chapter 2. Since the design methods based on this research are well established, most of the recent physical model testing has been conducted where the proposed structure is not-covered by existing desigq methods. The data from such testing can therefore be .used- to revise and.extend the existing methods.
Fewer studies include measurement of the number of waves overtopping. A limited number of studies include the measurement of both the mean overtopping discharge and the number of waves overtopping. This data~ is more useful since it allows verification of previous design methods and also allows a direct comparison,between the two methods of measurement.
Wave by wave overtopping measurement allows analysis of the distribution of wave overtopping, which may -be used to relate mean discharge to peak discharge. Unfortunately, since. the equipment and testing procedures required to conduct such experiments is more,expensive, relatively few studies have used this method.
R&D Project .Record W5/006/5 21
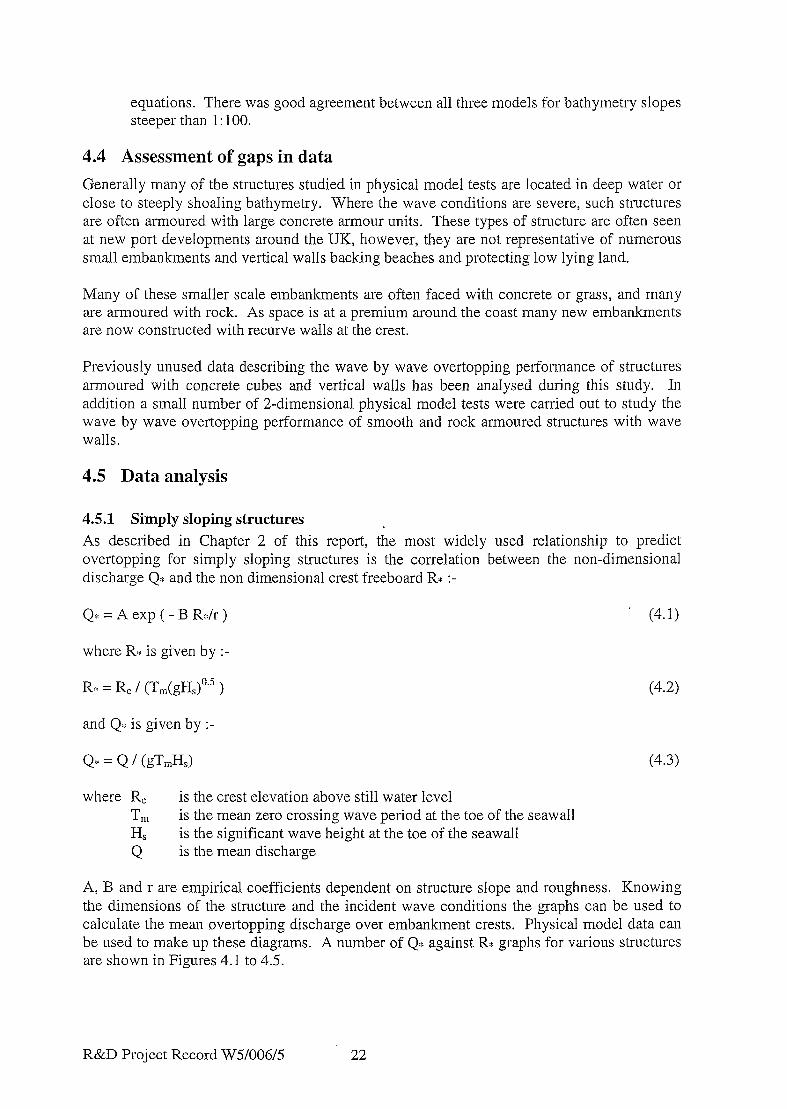
equations. There was good agreement between all three models for bathymetry slopes steeper than 1: 100.
4.4 Assessment of gaps in data
Generally many of the structures studied in physical model tests are located in deep water or close to steeply shoaling bathymetry. Where the wave conditions are severe, such structures are often armoured with large concrete armour units. These types of structure are often seen at new port developments around the UK, however, they are not representative of numerous small embankments and vertical walls backing beaches and protecting low lying land.
Many of these smaller scale embankments are often faced with concrete or grass, and many are armoured with rock. As space is at a premium around the coast many new embankments are now constructed with recurve walls at the crest.
Previously unused data describing the wave by wave overtopping performance of structures armoured with concrete cubes and vertical walls has been analysed during this study. In addition a small number of 2-dimensional physical model tests were carried out to study the wave by wave overtopping performance of smooth and rock armoured structures with wave walls.
4.5 Data analysis
4.51 Simply sloping structures As described in Chapter 2 of this report, the most widely used relationship to predict overtopping for simply slopin, u structures is the correlation between the non-dimensional discharge Q* and the non dimensional crest freeboard R:g :-
Q::: = A exp ( - B RJr ) ’ (4.1)
where R:i; is given by :-
R* = R, / (Tm(gH,)“.5 )
and Qe is given by :-
Q:g = Q / (gT,,HJ (4.3)
where R, Tn, K Q
is the crest elevation above still water level is the mean zero crossing wave period at the toe of the seawall is the significant wave height at the toe of the seawall is the mean discharge
A, B and r are empirical coefficients dependent on structure slope and roughness. Knowing the dimensions of the structure and the incident wave conditions the graphs can be used to calculate the mean overtopping discharge over embankment crests. Physical model data can be used to make up these diagrams. A number of QC+ against R:r graphs for various structures are shown in Figures 4.1 to 4.5.
R&D Project Record W5/006/5 22

The first figure in the series, Figure 4.1, shows the. relationship. between the mean overtopping- discharge and the non dimensional crest freeboard R:b for a simply sloping: smooth structure assessed by Owen (1980); .The graph shows that for a given value of R:i: the- performance of 1: 1.5 and l:2 slopes are very similar. Reducing the,slope of the structure to. 1:4, for ,instance: significantly reduces the overtopping discharge.
Owen’s (1980) method of analysis can be applied: to armoured structures by use of the roughness coefficient, r. The performance of two single layer hollow cube -structures is shown in Figure 4.2.. The structures are very similar ( slopes = 1: 1.5 and 1: 1.33 respectively). The only major difference.is the crest detail. The -1: 1.5 sloping structure had a 5m wide rock. berm at the crest, the other structure had no.berm. Also plotted is the Owen (1980) prediction line with r = 0.55 (the-generally accepted figure for hollow cube armour units);. -The upper set of data, relating to the structure without a berm, compares extremely well with the Owen prediction for a simply sloping armoured structure with r .= 0.55.
It is interesting to note that the slopes of the 2 regression lines through each- set of data are very similar, however, the lines are offset. The presence of the 5m rock berm at the crest of the other structure significantly reduces the overtopping discharge, moving the data set down the Q:: axis.
The performance of four Antifer cube armoured structures is illustrated in Figure 4.3. Each has a small horizontal berm (approximately 4m wide)’ at the crest. The performance of the 1:2 sloping structure appears, to be better-that the 1: 1.5 slope. This result,does not agree with Owens data for smooth slopes where the performance of 1: 1.5 and 1:2 slopes were similar. The general trend is. clear however; their performance is better than that predicted. by Owen’s (1980).equation with r = 0.55. -This is;again, a result of the crest berms.
Tests such as those described above have led an approximate .rule -being adopted;- that for every 1 Om landward of the top of the slope the mean overtopping. discharge may be.reduced by a factor of approximately 10. It was decided that thisrule. should ‘be confirmed (or modified) by a new set of model tests. Chapter 7 describes this work in detail.
The performance of four similar-rock armoured structures is shown in Figure 4.4. All the slopes lie between 1: 1.5 and l-:3. However, each structure also has a wave return wall located on its crest. The data is scattered due to the various slope angles and configurations.of the wave .wall; However, a trend can be seen. The- data all lies below the Owen (1980) prediction for a 1:2 sloping structure with r. = 0.55 as applicable to 2 layers of rock: armour. The better performance is due to the recurve walls located behind the armour crest.
It was decided on the-basis of,this data to re-examine the performance of wave return walls on permeable armoured slopes. This work is described in detail in Chapter.5 of this report.
Recent, tests suggest that the two most efficient concrete armour units are Dolos’(two layers) and Accropodes (single layer).‘-The performance of two Accropode structures is compared in. Figure 4.5. Comparing .this data with that of the other structures the performance ,of the Accropode structureimproves significantly at larger values of RK The Owen (1980) equation with r = 0.3 is also plotted in Figure 4.5. The regression- line passes through the data- set, however, it is only appropriate over a small range of RK As the roughness of the structure. increases the applicability of the Owen regression reduces.
R&D .Project Record .W5/006/5 23
The final graph in the series (Figure 4.6) illustrates the effect of increasing the roughness of the armouring for structures having slopes of 1:1.5 and 1:2. Note, reducing the steepness of the slope reduces the mean overtopping discharge. As the roughness of the armour increases from a smooth slope to the most effective 2 layer Dolos structure the mean overtopping discharge reduces significantly. For example, assuming Rs = 0.1 the non-dimensional discharge Q reduces from 2x10” for a smooth slope to 2 x 10e6 for the Dolos armoured structure (r = 0.3), a factor of 1000. As long as the slope and roughness of the structure can be defined and compared with one of the known armouring units then a rough estimate of the mean overtopping discharge may be made from the data provided in Figure 4.6.
The data above shows that the Owen (1980) method, based on coefficients A and B and roughness coefficient, r , gives an acceptable first estimate of the mean overtopping discharge. The data, however, shows that both the slope of the regression line, given by B/r, and also the location at which the regression line cuts the Q+ axis, given by the constant A, can vary depending on the type of structure. Some of these discrepancies are a result of structural details such as crest berms and return walls, which are not explicitly taken into account by Owen’s (1980) equation but can significantly affect overtopping performance. Owen’s (1980) equation also becomes less accurate for structures with very low roughness coefficients.
Where more accuracy is required, and model data is available for a similar structure, an alternative approach is to assume r = 1 and fit a regression line through the data to find values of A andB.
4.52 Vertical walls
Site-specific data on vertical walls is rarer than that concerning sloped structures. However, one study of a prototype seawall is available.
A vertical wall at Colwyn Bay in North Wales frequently suffers significant overtopping during storms from the north and north-east (Herbert 1996). The structure affords protection to a promenade and roadway immediately behind its crest. The coastline is characterised by a sandy lower beach with some patches of cobbles and an upper shingle beach, the width of which varies along the frontage. A vertical stone-faced seawall, approximately 3m high is sited at the rear of the beach. A typical cross section is illustrated in Figure 4.7. Overtopping measurements were undertaken in a series of short-term deployments during storm events in late January 1994. Storm events were predicted by identifying spring tidal dates and monitoring the Meteorological Office Weathercall forecasting system during periods of storm activity.
A wave/tide recorder was used to measure the inshore wave conditions and water levels. A large calibrated tank captured overtopping water. Each series of overtopping measurements was completed over about three hours during periods of high tides.
The data from the wave/tide recorder was filtered using high and low pass filters to separate the wave component (high frequency) from the water level record (low frequency). The wave record was analysed using spectral methods to give the inshore significant wave height, Hsz and mean and peak wave periods, T, and T,. At the shoreline the direction of wave energy was perpendicular to the axis of the seawall (within 1Ll0”). Analysis of the wave conditions at the site indicated a mean wave period of approximately 5-6 seconds so an averaging interval of 10 minutes was equivalent to about 100 waves.
R&D Project Record W5/006/5 24
The mean overtopping discharge derived using the empirical formulae described.in Chapter 2 were compared with the measurements from the field. Equation 2.26 assessed the form of the wave reaching the structure, and it was found that the wave breaking parameter, h:,, was less than 3.0 for all but one of the analysis intervals, which suggested that impacting waves dominate. For impacting waves the non-dimensional overtopping discharge Qh -is given by equation 2.30. The field. data and the trend line by given equation .2.30 are compared in Figure 4.8, with relatively good agreement. A best fit line is also shown.
4.6 Conclusions
A selection of site-specific data has been examined with: reference to the design methods presented in Chapter 2. The design methods presented for armoured slopes and vertical walls have generally been validated by the site-specific- data. In some cases however the results have highlighted the need for design methods to account for structural details, such- as crest berms and return-walls. In the case of crest berms,.it was decided that a programme of model tests should be commissioned to investigate in more detail than was previously available their affect on overtopping discharges.
R&D Project Record W5/006/5 25
5. CREST WALLS LOCATED ON ROCK-ARMOURED SEAWALLS
5.1 Introduction
One of the areas identified in Chapter 2 as requiring additional analysis was the effectiveness of crest walls located on top of armoured seawalls. Bradbury et al (1988) carried out a set of experiments to investigate the performance of such structures. Owen and Steele (1991) conducted similar experiments usin g smooth,. impermeable slopes and .developed an empirical design method on the basis of .their results. The method developed by Owen and Steele was extremely flexible and allowed the performance of a wide,range of return ,walls to be predicted: -An examination of Bradbury-et al’s original .data set suggested that, with re- analysis, it could form the basis of a similar design method.
5.2 Crest -wall discharge coefficients :.
Owen and Steele (1991) examined the problem of the effectiveness of recurved crest walls located on top of smooth, impermeable slopes. A crest wall. discharge coefficient, Df, was defined as:-
Q = Q&b (5.1)
where Q is the overtopping discharge over a seawall section with.a crest wall and Qb is the base discharge, i.e., the overtopping -discharge over the same section, under- identical conditions, but with. the crest wall removed. Df should always take a value between 0 and 1. This expression of crest wall effectiveness differs from the definition used by other authors; e.g. Bradbury et al (1988), which relates the discharge over a section with a crest wall to the discharge over the same section if the crest wall were:removed and the slope were continued to the same level as the top of the crest wall. Owen and Steele adopted the definition of equation 5.1 so that a more direct measure of the effectiveness of the crest wall alone can be made rather than that of the seawall / crest wall. combination..- The results can therefore-be more readily applied to other situations.
Owen and Steele evaluated Df for various combinations of seawall slopes and crest wall dimensions. The results are presented in the form of a desigq’chart. It is intended that the overtopping rate of the seawall in the absence of the return wall is first estimated and that the appropriate value of Df is then applied from the design chart.
Bradbury et al examined the problem of crest walls. on armoured slopes; The overtopping was examined in terms of the freeboard of the overall structure.. Bradbury et al computed new values of A and B coefficients for use in Owen’s (1980) method; -It was intended that designers use the values of A and B relevant to the model which their structure most closely resembled. This approach did not fully address the question of the efficacy of raising the crest wall as compared to raising the armour crest level. To’rectify this Owen and Steele extended. their method to rough, permeable slopes by applying it to the.data of Bradbury et. al. The results follow the same general trends as those from the smooth, impermeable wall tests, although with considerably more scatter in the data. It was concluded that return walls on permeable slopes are more effective than those on impermeable slopes.
R&D Project Record W5/006/5 26
Only a small sub-section of Bradbury et al’s data set which deals with recurved walls was used for this purpose, the same subsection of data was used by Owen and Steele to make a direct comparison with their own data.
This Chapter applies the analysis method developed by Owen and Steele to a more extensive selection of Bradbury et al’s data set in an attempt to develop design curves for the effectiveness of wave return walls on rough permeable slopes.
5.3 Bradbury et aI’s data
The data used in the calculation of the discharge coefficients are based on the results of a series of model tests conducted by Bradbury et al (1988). Included in the series of tests were measurements of overtopping of a variety of crest walls on top of simple rock slopes. The geometries of the model sections whose performance is examined in this report are shown in Figure 5.1. The principle parameters of the models along with the test codes used in the original study are shown in Table 5.1.
All the results are from tests conducted with rock slopes of 12. The armour layer in all cases consisted of 2 layers of rock. The majority of the test sections had crest berm widths, Cw, of 0.15m and armour crest levels, A,, of 1.555m, the principal geometric variable being the crest wall height, Wh. There are: however, several exceptions. One section (11) had a wider crest berm width of 0.3m so that the effect of the berm width could be investigated. A further section (13) had a recurved (rather than a simple rectangular) crest wall.
5.4 Owen and Steele’s method .
Smooth Impermeable Slopes The discharge factors presented by Owen and Steele (1991) relate the overtopping of a crest wall on top of a seawall, Q, to the overtopping of the same seawall in the absence of a crest wall, Qb. Qb can also be considered as the discharge which arrives at the base of the crest wall. For the purposes of calculatin g Df, Qb was not measured, but estimated using the method of Owen (1980), whereby the dimensionless overtopping, Q:Cb, is related to the dimensionless crest freeboard, A-c, by the following equation:-
Q::b = A exp (-B A:?, / r) (5.2)
where Q:‘:b = Qb / (T,, g H,) A:k, = A, / (T,, (g H,)“.5)
and A, B and r are empirically determined coefficients, describing the slope and roughness of the seawall (see Chapter 2 of this report). H, and T, are the significant wave height and mean period, both defined at the toe of the seawall, respectively.
For various combinations of smooth, impermeable seawalls and crest walls Owen and Steele calculated Df based on measured values of Q and values of Qb estimated from equation 5.2, using a value of A:%, equal to the freeboard of the armour slope crest. The results were presented in the form a design chart which plots Dfagainst adjusted dimensionless crest berm freeboard, X:s, for various values of dimensionless crest wall height, W+h, given by :-
W*h = Wh/A, (5.3)
R&D Project Record W5/006/5 27
X+. is a modified value:of A*,, adjusted with empirically determined factors for crest berm width and seawall slope., Figure 5.2 shows Owen and Steele’s final design chart. One of the principal conclusions of the study :was that :-
“..the. discharge factor increases as the dimensionless crest. elevation decreases: in other words the wave return wall ,is more effective when there is less water arriving at its base. When very large quantities of water arrive at the return wall it becomes “drowned”, and has very little effect on the overtopping discharge.”
This is reflected in the trends shown in Figure-5.2.
Rough permeable slopes Owen and Steele used the results from section 13 of Bradbury et al’s data to estimate ,the discharge coefficients of crest walls on rock slopes. Section 13 was selected as it had a recurved wall similar in profile to the one used in the original work on smooth slopes.
Whilst considering equation 5.2 adequate to estimate Qt, for -smooth, impermeable slopes, Owen and Steele carried out additional tests (designated section -14) to provide an direct measurement of Qb for the rock slopes. Section 14 had similar dimensions .to the other sections used. by Bradbury. et al. but with. no crest wall. This feature allows Qb to be calculated for the other structures. Thus -for each structure an accurate estimatecan be made of the overtopping performance in the absence of a crest wall.
If equation 5.2 is used to estimate.Qb the empirical coefficients; for 2 layers of rock armour at a slope of 1:2, are as follows :-
A = 9.39 x lo-“. B = 21.6 r = 0.55
The measured overtopping performance of section 14, along. with the predicted result from equation 5.2 is shown in Figure 5.3. As can be seen equation 5.2 overestimates the overtopping discharge. Thisis in part a result of- the presence of the permeable crest berm: A more accurate method is to fit a form of equation 5.2 to the data by settingr equal. to 1 and, by plotting lnQ::b against ARC and determining A and B from the least squares method. The results are also plotted on Figure 5.3.
The result of this analysis is that the overtopping discharge which the model sections would experience in the absence of their crest walls can be described by the equation :-
&, = 0.01608 exp(-67.92 A-,) (5.4)
This allows the crest wall discharge factors to be.accurately calculated.
The estimate of Qb. thus determined was then used in the calculation .of Df for section. 13. Figure 5.4 shows the results for section 13 along with those for the equivalent smooth; impermeable slope. Df is plotted against A+,, as in the original work of Owen and Steele. As each sectionwas tested at two water levels,- each provides two sets of data when grouped according to We. It can be seen that, for a constant level of A:+ the crest wall on a rough, permeable slope is more effective than one on a smooth, impermeable slope.
R&D Project Record W5/006/5 28
It was suggested that :-
“As the wave runs up the slope and onto the crest, its forward progress is arrested by the return wall, increasing the depth of water on the crest. For an impermeable slope the remainder of the wave runup to some extent rides over this cushion of water and a fraction overtops the wave return wall. On a permeable slope the increased depth of water on the crest causes a greater head difference from the crest to the bottom of the slope, increasing the reverse drainage down through the armour layer and, to a lesser extent, the underlayer. The remainder of the runup therefore finds it more difficult to overtop the wave return wall.”
5.5 Discharge factors for walls on permeable slopes
The discharge factors for the walls on sections 4, 5, 6, 7, 8 and 9 were calculated using equation 5.1, where Qb is given by equation 5.4. Graphs showing Df against A+ for all of the sections tested are shown in Figure 5.5. The data are grouped according to constant values of Woh. The general trend of the data can be seen to follow that predicted by Owen and Steele (1991). This accords with the conclusion that the effectiveness of the wall decreases as the quantity of water reaching it increases.
Owen and Steele‘s method of analysis involved plotting In@f) against ln(A:b,) and fitting a straight line to the data points, effectively fitting to the data an equation of the form :-
Q=XA:<,Y (5.5)
The slope of the line will give the parameter Y, whilst the intersection with the ln(Df) axis will provide the parameter X.
Initially the full data set was grouped in data groups of W*h. The results are shown in Figures 5.6 to 5.15 and the coefficients X and Y, along with the r2 correlation factor of the fit are given in Table 5.2. As can be seen there is a considerable degree of scatter in all of the data groups, with generally low values of r2. The lowest values of r2 arise from groups with a small number of data points and a limited range of A:+ e.g. the results for Wsh = 1.32 and W-h = 0.94. This results in calculated values of the slope constant, Y, which are inconsistent with the overall trends. It was decided, therefore, to discard groups with r2 < 0.25.
A further problem arises at high levels of W*h (i.e., >1.5) where the results are less sensitive to changes in W.h. The results for W:gh = 2.64, 2.09 and 1.55 produce very similar relationships. It was decided, therefore, to combine these data sets and to designate Web for the combined group as the weighted average of all three, i.e., 1.96.
The resulting curves are plotted in Figure 5.16. Results are shown for W*h = 3.73, 1.96 and 0.4. The result for W:eh = 0.2 is also included to provide a lower limit to the data set. It can be seen that the general behaviour of the crest walls on permeable slopes is similar to those on impermeable slopes,
5.6 Effect of recurved wall on discharge factors
Section 13 was the only section tested which had a recurved wall profile rather than a simple rectangular wall profile. Other than the wall profile the section dimensions were identical to those of models 6 and 9. These sections were tested at two water levels each, so two groups
R&D Project Record W5/006/5 29
of Woh data are available. .The results of models 6, 9 and 13 are plotted in Figure 5.17. It can be seen that the effect of the recurved wall is to reduce the discharge factors compared to ‘... those of the-simple rectangular walls. When the relative-wall height is low (Web =.0.55) the recurved wall makes a greater difference at higher-values of Asc. This,is to be expected as at low values of A*, the wall will become “drowned” and its profile will be of less significance. In the case of the greater relative wall height (W:kh = 1.55) there is little difference between- the two data sets.
5.7 Effect of crest berm width-onydischarge factors
A wider. crest berm provides a larger permeable surface-through which the water building up
against the crest wall can drain. Crest walls on wider bermed structures would be expected to be more efficient. However, the effect of the berm width on the discharge factors is difficult to determine precisely as no direct data is available ‘on the discharge, Qt,; of the wider bermed section (model 1 I).:,--Chapter 7 of this report presents a new method for estimating the effect of the crest berm on overtopping discharge. An equation was derived thus :-
Cf = 3.06 exp (- 1.48 (Cw/l&)) (5.6)
where Cf = crest width reduction factor Cw = crest width H, = inshore.significant wave height
Cf is the ratio of the discharge behind a crest berm of width :Cw to that with no crest berm present. The discharge with no crest berm *present was estimated using Owen’s equation (5.2) with the appropriate empirical factors. This figure was then used to estimate the crest wall discharge factor, Df, for section 11. The results are plotted onFigure 5.18, along,with those of sections 6 and 9 which had identical crest walls. It can be seen that there is practically no difference between the Df values of the sections with and without the wider crest berm for the higher relative wall -height. The differences at the lower relative wall height are small. It must be stressed that thiscomparison cannot be made with -the same degree as accuracy as others in this chapter, since Qb was not directly measured::.
5.8.. Design chart.
Owen and Steele (1991) concluded that the efficiency of the crown wall is primarily -a function of the volume of water arriving at its base, Qb: As slope roughness was not a factor in Owen and Steele’s experiments, armour crest freeboard. and slope angle were the only parameters affecting Qb. Df was therefore described as a function of A+, and.slope by,,the parameter X0: When considering armoured slopes however the roughness must also .be taken into account., Determining a direct relationship between Df and QKb should therefore make the results more generally applicable.
For this -purpose a similar approach was taken as for the determination of, -relationships between Df and A+,. For each group of constant W*h an equation of the following form was fitted to the data:-
Df=XQ:xb.Y (5.7)
Q:*b was estimated from equation 5.4. As before, there was. a considerable amount of scatter, and problems arose with those groups which have a small number of data points and a limited
R&D.Project Record W5/006/5 30
range of Q::+ Parameters X and Y are given in Table 5.3 along with the regression analysis data. Values of r2 are similar to the equivalent fit of Dr to ACT.
Regression lines were plotted for W:sh = 3.73; 1.96, 0.4 and 0.2. The results are plotted in Figure 5.19. In order to produce a more convenient design chart, interpolation between these values then produces a design chart, Figure 5.20. Given that the base discharge, Qb, can be estimated, Figure 5.20 can be used to determine the reduction factor, Df, for any height of crest wall. When a crest berm is present allowance must be made for it in the calculation of Qb, using the method outlined in Chapter 7 of this report.
5.9 Conclusions
A revised method of estimating the effect of a crest wall on a rock-armoured slope has been presented. The data of Bradbury et al (1988) was re-analysed using the method proposed by Owen and Steel (1991). A design chart has been produced which provides a more flexible method of estimating the effectiveness of a wide range of crest walls.
R&D Project Record W5/006/5 31

6. ANALYSIS OF WAVE BY WAVE OVERTOPPING
6.1 Introduction
In situations where the safety of personnel is of primary interest, overtopping limits are best defined in terms of peak events rather than average discharge. The most effective way of defining the peak. event is by the maximum individual volume of water which .overtops the structure during the course of a storm. This Chapter describes the analysis of the results of. model tests in .which the wave-by-wave overtopping volumes were individually measured. Such data is available for a.variety of structural types. This Chapter starts with,a description of the experimental technique employed at HR Wallingford for this type of test. Very similar methods have been employed at other laboratories. The statistical methods employed in analysing the results are then described. The Chapter concludes with recommendations for <. predicting the peak-overtopping event for a variety of structural forms and wave conditions.
6.2 Experimental, technique 4
Tests were run for a duration equivalent to approximately 1000 waves. The length of the wave sequence (the time taken before the wave record begins, to repeat) was considerably longer than the actual test length, thus ensuring that any particular group of waves only occurred once. All data were collected at 20Hz and saved to disk..
All water overtopping the structures was collected in a series of tanks positioned behind the model. Water levels in the tanks were measured continuously using either electromagnetic float- gauges or load cells. When measurement was by float gauge the tanks were split into sections of.different plan area to allow. the accurate measurement of low discharge. The continuous measurements allowed the volume of water overtopping the seawall per wave to be assessed. Readings from the float-gauges or load cells were noted before and after each test, enabling the mean overtopping discharge over the test length to be determined.
During. each test the number of waves overtopping the structure was counted using overtopping probes positioned at the structure’s crest. As an overtopping-wave passes the structure, an electronic voltage pulse is triggered.
All -wave.overtopping data was recorded for,post analysis using WARP, a real time wave recording and analysis package developed at HR-Wallingford. This program allows the time varying.voltage of an instrument to be recorded at a specified time interval and the digitally. converted-.data to be stored. In most cases three or four channels of overtopping data were recorded i.e., two probes on top of the structure measuring the number of waves overtopping, and either a load cell or one probe in each -of the measuring tanks recording the change in level of the rising water. A typical recording interval was 0.0%. for--each channel of data. The test length varied between 20-40 minutes in the model.
To translate the raw data a separate computer program.was written to assess the number of overtopping waves which actually produced. enough water to be measured with sufficient accuracy in the tank, and to assess the individual volume of those waves. The logic of the. program is described below.
The first step was to pick- out overtopping waves measured ,by one of the two overtopping probes. This consisted of searching. through the raw data until a deviation from~ the base
R&D Project Record W5/006/5 32

signal was found. This indicated the start of an overtopping wave, although not necessarily one which would add significantly to the overall volume. The data file consisted of the time value of the start of each pulse and is referred to as the spike file. The second step was to search through the raw data of the overtopping tank level to find the change in level between two successive overtopping waves as indicated on the spike file. This was achieved by allowing for the time delay between the overtopping event and the increase in level in the tank. When a level gauge was used in the tank it recorded an oscillation after every overtopping event. To allow for this effect, an average of the tank readings over the last few seconds before the arrival of the next wave was taken as the baseline. A similar baseline was found for the next event and the volume of the wave was calculated from the difference in these two averaged readings.
Allowances were made in the program for those tests where two tanks were used and water overflowed from one to the other. Threshold parameters were set by the operator (for both the spike file and the tank level file) to reject waves considered to be caused by noise on the signal. A further parameter, which could be set by the operator, was the length of time over which the averaging of the baseline between overtopping waves was calculated. This method allowed full control of the data to achieve the best results from various test results.
Output from the program consisted of a data file, listing the following parameters: 1. the input parameters 2. the volume of each overtopping wave and its time of entry 3. the total volume of water collected (litres per metre) as calculated from the
summation of the individual waves , 4. the overall volume as calculated from the start and end readings of the tank file(s) 5. the average discharge in l/s/m
Data from this file was then imported into spreadsheets in which wave by wave overtopping volume distributions were calculated. During the tests a check was made on the nui-nber of overtopping waves actually occurring on the model. There was a very good comparison with the number of overtopping events defined by the program giving confidence in the overall assessment of the procedure.
4.3 Number of waves overtopping
6.3.1 Vertical walls Franc0 et al (1994) conducted experiments, using methods similar to those described above, to investigate wave by wave overtopping of a vertical wall. The following equation was developed to predict the number of waves overtopping the wall :-
NV,& = exp (- (RJH, / 0.91)2) (6.1)
where N,, is the number of waves overtopping. N, is the number of waves in the sample. R, is the crest freeboard. H, is the inshore significant waveheight.
The tests were conducted in relatively deep water so that non-breaking wave conditions predominated (see Chapter 3 of this report).
R&D Project Record W5/006/5 33
The number of waves overtoppin g the structure ‘equates to the number of run-up events exceeding the crest. level. As run-up level is closely dependent on wave height, the. distribution of overtopping events is of Raleigh-form.
A similar series of tests was conducted at HR Wallingford (Allsop et al (1995)). The main difference between HR Wallingford’s tests and those conducted by Franc0 et al (1994) were that HR Wallingford’s tests. incorporated -both shallow and deep-water conditions. The results concerning the proportion of overtopping waves are plotted in Figure 6. I, along with the prediction line-given by equation 6.1. The data labels indicate values of h/Hs, where h is the water depth at the toe of. the structure. Values .of h/H, > 3.0 indicate relatively deep water. It can. be seen that equation 6.1 offers a reasonable approximation to the results for h/H, >3.0. Fitting .an exponential- relationship. to the deep water. data only produces the following equation :-
N,,,,,/N, = exp (- (RJH, / 0.909)?) (6.2)
Although the data set is rather limited in size, it produces a very similar result. to that of Franc0 et a1.(1994).
When the water is shallow and breaking waves predominate, this equation under-predicts N - Wcl’ There are two- principle reasons for this. Firstly, where waves break in significant ,I numbers the distribution of individual wave heights diverges from the Raleigh form. Secondly, the mechanism by which individual. waves overtop the structure is altered; being:- no longer dominated by simple run-up..! Waves which break onto the face of-the structure generate a different, (and more.chaotic) water motion than those which reflect and-run up it. It is clear that the results for breaking conditions must be distinguished from those for non- breaking conditions, and that they require a different method of analysis.
It is useful at this point to return to the analysis of mean discharge (Chapter 2). The influence of shallow water on mean overtopping, discharges over vertical walls was .examined--by Allsop et al (1995). For simple vertical walls constructed on a shallow-sloping,bathymetry a wave breaking parameter, h:g, was defined which dictates whether waves at the structure-are dominated by impact (breaking) waves or by reflecting/pulsating (non-breaking). waves. h:- is defined by :-
h- = (h/H,) (27ch/gT,,‘)
where T,, is the inshore mean wave period ..
Reflecting waves were found-to-dominate when h:g > 0.3. Impacting waves dominate when h::: < 0.3. The formulation of h:b reflects the fact that waves are more likely -to break if the wavelength or the wave height is large compared to water depth.
Allsop et al (1995) found that when ho > 0.3;the overtopping.discharge is well described by an equation relating it to R&I,. When h:x 1.0.3, however, it was found:that the overtopping discharge was better described-by relating it to a parameter which took account of the degree of wave breaking. The new parameter, Rh, was defined as :-
R,, = (RJH,) h:k (6.4)
R&D Project Record W5/006/5 34

The data of Allsop et al (1995) concerning the number of waves overtopping, Nwo, was examined in terms of RI, (Ref. Madurini). Values of N,, are plotted against Rh for all results with h::: I 0.3 in Figure 6.2, and produce the following equation :-
N,,/N, = 0.03 1 Rh-‘.” (6.5)
Equation 6.5 shows good correlation with the data over a range of Rh. It is interesting to note that the proportion of waves overtopping is most over-predicted when h:t = 0.26, close to the upper limit of he < 0.3.
On the basis of the above analysis it is recommended that when ho > 0.3, the proportion of waves overtopping the structure should be estimated using equation 6.1. When h+ 5 0.3 equation 6.5 should be used.
6.3.2 Sloped structures
Owen (1992) showed that for smooth slopes, as for vertical walls, the number of waves overtopping was approximately equal to the number of waves with a calculated run-up greater than the crest elevation, i.e. :-.
N,,,/N, = exp(-C R:,‘) (6.6)
where N,, is the number of waves overtopping NJ is the number of waves in the sequence C is a parameter which depends .on the seawall slope R:k is the dimensionless freeboard given by, R, / (T,, (gH,)0.5) .
It is reasonable to assume that the same will hold for armoured slopes. The proportion of overtopping waves is plotted against Re’ for a selection of seawalls in Figure 6.3. All the structures have slopes of 1:1.5 but have various types of armour, i.e., CBS, Antifers and Dolos. Also plotted is a line representing a smooth slope, produced by interpolating a value of C between Owen’s results for 1: 1 and 1:2 slopes. As expected, the results for the armoured slopes have fewer overtopping waves than the smooth slope for a given level of R:s.
Since the run-up level of waves is a function of slope roughness, the number of waves overtopping an armoured slope is expected to be :-
N&N, = exp(-C (Rdr)” (6.7)
A series of lines representing equation 6.7 with different values of roughness, r, is plotted on Figure 6.3, using r = 0.3 for the Dolos units, r = 0.5 for the Antifers and r = 0.8 for the CB’s. There is a good correlation between the data points and the lines produced by equation 6.7.
Unfortunately the amount of data available from studies with slopes other than 1: 1.5 is limited. This is a result of the fact that the majority of tests of armoured structures are conducted on site-specific models. The structures generally have features such as berms and return walls which equation 6.7 cannot account for. It must be remembered that equation 6.7 is applicable only to simple slopes.
Various methods of analysis were investigated in an attempt to predict the number of waves overtopping more complex types of sloped structures. However, no satisfactory method was
R&D Project Record W5/006/5 35
developed for accounting for the various structural details. Eventually it was decided. that the proportion of waves overtopping- could best be described by relating it to the dimensionless mean overtopping discharge, QK An equation was fitted to the data as follows :-.
N&N, = 55.41 Q::: o.G34 for 0 < Qe’< 0.0008 (6.8a)
N&N, = 2.502Qe ‘.I” for 0.0008 I Qk > 0.01 (6.8b)
N ow = Nv for Q* > 0.01 (6:8c)
where N,, is the.number of waves overtopping NW is the number of waves in the sequence Q:s is the dimensionless overtopping discharge, given by Q:g =-Q / (TmgHs)
The data, prediction lines and 95% confidence limits for Q*:< 0.0008 are shown in Figure 6.4. As expected there is a considerable degree of scatter.. .This is probably due to the variation in structural forms and wave conditions which occur in the data.
6.3.3 Composite structures No data is available to describe the number of waves overtopping composite structures. It is therefore suggested that rules developed for other structural types be applied. Structures with a small mound could be treated as vertical walls subject to reflecting waves. Structures with a large mound could be treated as vertical walls subject to impacting waves. The distinction between structures with large and small mound is made using the d:r parameter, given by equation 2.32.
6.4 Maximum individual overtopping event,
6.4.1. The Weibull distribution Given that the-:number of overtopping, events N w,, can be predicted using the methods- described above, and that the mean discharge is known (see Chapter 2) it is now possible to estimate the magnitude of the largest individual overtopping event.
The volumes of individual overtopping events, V, can -.be described by a Weibull distribution:-
p(v) = 1 - exp(- ( (V-C)/A )B) (6.9)
where P(V) = probability of non-exceedance.and A, B and C are empirical coefficients.. The coefficient C represents the lower limit of the data, representing the minimum individualzi volume that the experimental method can distinguish; .A and.B are determined by fitting the Weibull equation to the experimental data.
The maximum expected individual overtopping.. volume, VlllaX, in a sequence of N,, overtopping waves is then given by :-
V lllax = C + A (ln(N,,)) l/B
R&D Project Record W5/006/5 36
6.4.2 Vertical walk
France et al (1994) determined values of A and B for overtopping of a vertical wall in relatively deep water, giving an expression for A in terms of Vbar the average individual overtopping volume :-
A = 0.84Vb,,, and B = 0.75 (6.11)
A two parameter Weibull distribution (assuming C = 0) was fitted to the results of the HR Wallingford data. Sample probability plots of V/Vb, for impact and reflecting conditions are shown in Figures 6.5 and 6.6 respectively. The results correspond well with the Weibull distribution, except at low values of V/V bar, where there is a divergence. Accurate prediction of discharges at low probabilities of non-exceedance is of little interest to the present study. At high probabilities of non-exceedance, the inclusion of C makes little difference to the shape of the distribution as C is very small for all the data sets used. It was therefore decided that the Weibull distribution should be fitted to values of V > Vbar only, as this gives the most reliable estimate of V,,,.
The average value of B for reflected waves in the HR Wallingford data set (B = 0.754) was very similar to Franc0 et al’s (1994) result of B=0.75. For impact dominated waves B was found to average 0.854.
Values of A can be determined from the relation:-
Vbar = c + A I? (1 + l/B) (6.12)
Where I is the Gamma function that can be found in mathematical tables. For reflecting waves A= 0.843 Vbar (compared with A = 0.84 Vb,, from Franc0 et al (1994)), but for impacts, A=0.922 Vbar.
When reflected waves predominate (i.e., when he > 0.3) the maximum individual overtopping VolLlme, Lax, in a series of N,, overtopping waves, is therefore given by :-
V ,,,= = 0.843 Vbar (ln(Nwo))1’0.754 (6.13)
When impact waves predominate (i.e., when hB < 0.3) the maximum individual overtopping is given by :-
(6.14)
Values of V,,,, estimated from equations 6.13 and 6.14 (using measured Vbar and N,,) are presented in Figure 6.7, plotted against measured values of V,,, from the HR Wallingford data set. A reasonable correlation is obtained.
Franc0 (1996) determined values of B for vertical walls and found that B was dependent on wave steepness and on whether the waves were short-crested or long-crested. For a wave steepness of 0.02 Franc0 (1996) found that B = 0.66 and 0.72 for long-crested and short- crested waves respectively. For a steepness of 0.04 the corresponding results were 0.82 and 0.94. As small values of B indicate larger maximum volumes, these results will be recommended in the manual as a conservative approach.
R&D Project Record W5/006/5 37

6.4.3 Sloped structures Individual wave overtoppin g volumes were analysed from a variety of tests on sloped structures, including both site-specific and generic model studies. The overtopping events are distributed in a similar way to those of a vertical wall, i.e:, they fo1low.a Weibull distribution for V > Vbar. At lower levels of V there is a divergence from the Weibull distribution, so as. before the Weibull parameters were calculated for V > Vba,. only. There was generally more variation in the parameters A and B than in the case of the vertical structures. This is to be expected as the structures included in the study ‘incorporated .a variety. of features, such as berms and crest walls etc. However, no distinct pattern emerged to enable particular values to be associated withspecific structural types or sea conditions. If the.averages of all values of A and B are taken, then the equation describing the maximum individual overtopping volume for a sloped structure is :-
V,,,, = 0.921VbX (ln(N,,))“0.853 (6.15)
Franc0 (1996) also examined sloped-structures and found that values of B were generally’o. 1 higher than the equivalent vertical wall.results.
6.4.4 Composite structures No data is available describing the distribution ,of individual. waves overtopping composite structures. It is therefore suggested that rules developed for other structural types be applied. Structures with a small mound could be treated as -vertical walls subject to reflecting .waves. Structures with a large mound could be treated as vertical walls subject to impacting waves.
6.5 Effect of angled wave attack on number of waves overtopping
Chapter 3 describes France’s (1996) reduction factors’ for predicting the- number of waves overtopping a- vertical wall under angled wave attack. The reduction factors are intended for’ use in Franc0 et al’s(1994) equation (6.1 above) which applies only to non-breaking waves. There is at present no satisfactory method for predicting the effect of angled wave attack on the number of waves overtopping a vertical wall when breaking waves predominate.
Franc0 (1996) also determined reduction factors for’ sloped structures; These factors are intended for use with Smith -et al’s (1994) equation for predicting the number of waves overtopping a slope, which was based upon the van der Meer and de Waal (1992) expressions for run-up and overtopping. As explained in Chapter 2 of this report it was decided. that the manual would utilise the Owen (1980) method for calculating mean discharges- over sloped structures and that the Banyard and Herbert (1995) equations would be used to describe effect of angled attack. Banyard and Herbert .(1995). did not measure the number of .waves overtopping. However, Franc0 (1996) concluded that as a result of angled attack the mean discharge was reduced. Similarly the number of waves overtopping were reduced but to a lesser extent. It should be noted that a particular level of mean discharge distributed over a smaller number of waves gives larger values, of individual volume, -therefore a conservative approach is to under-predict the number of waves overtopping.. It is recommended that the same reduction factor calculated for.the mean discharge be applied to the number of waves overtopping.
R&D Project Record W5/006/5 38
6.6 Relationship between peak events and mean discharge
6.6.1 Vertical walls
Reflecting waves The analysis presented above may be used to develop relationships between mean discharge and peak events.
Reflecting waves are those for which h* > 0.3. Given a description of the structure and the wave climate the mean overtopping discharge, Q, of a vertical wall in reflecting waves can be estimated using the methods described in Chapter 2. The proportion of overtopping waves, N,, / Nw, can then be calculated using equation 6.1. The average volume, Vbar, per overtopping wave can then be calculated. The volume of the largest overtopping event in a sequence of waves can then be estimated using equation 6.13.
Measured values of V,,, are plotted against measured values of Q for the HR Wallingford tests in Figure 6.8. Each data point represents the largest overtopping event in a test with a duration corresponding to 1177 wave periods. A nominal scale has been applied to present the data as prototype equivalent values. Incident wave height, HS, ranged from 0.7m to 0.5m.
Also plotted on Figure 6.8 is the relationship between Q and V ,nax predicted using equations 6.1 and 6.13 along with the method for predicting mean discharge given in Chapter 2. Prediction lines are given for wave heights of H, = 0.7m and 1.5m. It can be seen that for a given value of Q, the predicted maximum individual overtopping volume increases significantly with increasing H,. This is in accordance with the findings of van der 1Meer & Janssen (1995) for overtopping of sloping dykes and demonstrates that specifying safety limits only in terms of mean discharge can be misleading.
The results of Franc0 et al’s (1994) tests using 1000 waves are also plotted in Figure 6.8. The wave heights varied from 3m to 5m, considerably higher than those used in this study. The values of V,,,, measured are accordingly higher. The general trend, however, follows that of the HR Wallingford results.
Impacting waves Impacting waves are those with hY I 0.3. The mean overtopping discharge, Q, can be estimated using the method described in Chapter 2, and the proportion of overtopping waves using equation 6.5. The average volume, Vbar, per overtopping wave can then be calculated. The volume of the largest overtopping event in a sequence of waves can then be estimated using equation 6.14.
The results of the impacting waves using HR Wallingford data are shown in Figure 6.9. The incident wave conditions ranges from H, = 0.16m to 0.2m, T, = 1.59s to 2.5s and h from 0.34m to 0.43m. The hs parameter, which governs the “breaking performance” of the waves, varies from 0.1 to 0.26. Also plotted on Figure 6.9 is a prediction line valid between h:*= 0.1 to 0.26. The predicted value of V ,nax is fairly insensitive to changes in h:b.
R&D Project Record W5/006/5 39

6.6.2 Sloping structures
A similar exercise was carried out using two sets of site-specific results for armoured seawalls. Results are shown in Figures 6.10 and 6.11.. Equation 2.3 from chapter 2 along with equations 6.8 and 6.15 from this chapter were used to estimate the relationship. between mean discharge, Q, and peak event, V,,,. As can be seen the equations predict the general trend of the data, although there is some divergence. This may in part be due to the uncertainties in equation 6.8 and the A and B parameters discussed above.
6.7 Peak flow rates
Model tests suggest the time over which -the peak individual volume is discharged is approximately 40% of the mean wave period.. This relation can be used to estimate the peak flow if required.
6.8 Conclusions.
The method proposed by Franc0 et al (-1994), based on a Rayleigh distribution of run-up levels; provides an accurate estimate of the number of waves which overtop a vertical wall in predominantly non-breaking conditions. When wave breaking predominates however, different processes occur. The waves are non-Rayleigh distributed and run-up levels are affected by interaction of the breaking waves with the wall. A method has been described which takes account of these factors.
The Rayleigh distribution of run-up levels also provides a reasonable estimate of the number of waves which overtop a simply sloped structure. For more complex types of sloped structure however, such as those with berms and crest walls, no reliable method of predicting the number of. waves overtopping- a structure. from run-up levels could be determined. The most effective way of estimating the number of waves overtopping is to relate it to the mean discharge rate.
The distribution of overtopping volumes can be represented by a Weibull distribution. The parameters of the distribution vary with structural type and wave conditions. Parameters have been presented for various situations. i
The relationship between mean discharge and maximum event is not constant, but varies with, wave climate .and. type of structure. When- specifying overtopping limits. for safety it is therefore important to try and estimate the largest overtopping volume.
R&D Project Record W5/006/5 40

7. THE EFFECT OF CREST BERM WIDTH ON OVERTOPPING DISCHARGES..
7.1 -.,,Introductidn
This.Chapter describes a series of physical model tests conducted at HR Wallingford in order to investigate the effect of crest berm-,width. on the mean overtopping discharge of an armoured seawall. This is an area which has not been the subject.of much-previous research, and yet experience has shown the crest berm width to be a major influence on the- performance of seawalls and breakwaters. One method to assess the performance of crest berms was formulated from the results of several site-specific model tests. The-rule of thumb suggests that for every 10m back from the crest, the overtopping .will .reduce by a factor of 10. This Chapter briefly,examines the data on which this rule was based. A revised design guideline is then. presented, based on the results of new tests conducted specifically. to examine the effect of crest berm width.
7.2 Previous work
The existing guideline was formulated from the results of several site-specific model studies conducted, at HR Wallingford. Two of the most significant of these were Herbert & Reeves (1991) and Lowe (1991). This section examines the data from the two studies andsuggests ways in which the .work could be extended.
Two sea defence structures, both-rock-armoured slopes, were.assessed by Herbert & Reeves (1991):,- The tests were designed to investigate .rock armour stability, the level of wave reflections and the overtopping discharge for a number of extreme conditions. Overtopping was measured in a calibrated tank immediately behind the top of the armour slope. The tests were intended to investigate how much of the airborne overtopping water would .reach a distance of 10m behind the*top of the armour, slope. For this reason, the tank was split into two compartments so that any airborne water landing further back than 10m from the crest could be measured separately. Measurements were taken throughout the whole 6 hour prototype test duration. The data collected are shown -in Table 7.1, which gives the total discharge measured in both sections of the tank, Qo,- and the discharge measured only in the rearward section, Qlo, Wave conditions were defined offshore.
The effectiveness of-a crest berm of width, Cw, in reducing overtopping discharge can be quantified by a reduction factor, Cf, given by the ratio:of the overtopping discharge measured behind the crest berm to that measured when the berm is not present, i.e.,
G=QJQo (7.1)
where Qw = measured discharge at distance Cw behind crest Qo = measured discharge with no berm
In the case of these tests, the overtopping measured in the rearward tank can be considered equal to that which would be experienced behind a 10m wide crest berm. The sum of the discharge in both tanks,will -be the discharge experienced if no-berm is present. It must be’ remembered that these values only apply to airborne water. On a real structure some s. overtopping .water will,reach a distance of 10m by flowing over the crest berm.
R&D Project Record W5/006/5 41

Values of Cf for the Herbert & Reeves (1991) data are given in Table 7.1. C, generally falls between 0.07 and 0.33 and averages 0.15.
More detailed experiments were carried out on a model armoured seawall by Lowe (199 1). The purpose of the tests was to determine the degree of movement or displacement of the armour and to determine the overtopping experienced at certain distances behind the crest.
Overtopping of the seawall was measured using a collecting tank placed directly behind the top of the armour slope. The collecting tank had five compartments separated by walls set at 5.0, 6.3, 8.0, 11 .O and 20m from the top of the slope. Test results are shown in Table 7.2. As with the Herbert & Reeves (1991) data, wave conditions are defined offshore. The discharge given for a particular distance in Table 7.2 refers to the total discharge which was measured beyond that distance.
The reduction factor, Cf, (as defined above) is plotted in Figure 7.1 for each distance. Results are divided according to rock armour size. There is a considerable degree of scatter in the data. The average reduction factor for a crest width of 10m is approximately 0.06 and for a 20m crest width 0.003. Some variation in reduction factor can be seen with rock size. The fact that the results for 6.8t rocks generally lie between those for 2.5t and 5t however, suggests this is not an important parameter and that the scatter is more likely to be due to other factors or simply to the inherent inaccuracies in the method.
These two sets of results were, in part, the basis of the design rule quoted in the introduction. Because of the way in which the tests were conducted only airborne water was cohected at a number of locations behind the crest. This does not accurately reflect the behaviour of water flowing over a crest berm. Consequently a new programme of tests was conducted which accurately represented this effect. The results are described in the following section.
7.3 Model tests
7.3.1 Facilities The physical model tests were carried out in HR Wallingford’s deep random wave flume. The flume is 52m long and has an operating range of water depths at the paddle of between 1.3m and 1.7m. For most of its length the flume is split into 1.2m wide central test channel and two side absorption channels. Splitter walls of graduated porosity between the central and side channels are designed to minimise the level of re-reflected waves. The central channel terminates in a 1Om long ‘finger flume’. The test section is constructed close to the end of the finger flume and is bounded on both sides by glass walls. The wave paddle is a buoyant sliding wedge driven by a double acting hydraulic ram. A computer, using software developed at HR Wallingford, controls the paddle enabling either regular or random waves to be produced.
7.3.2 Test sections
The models were constructed to a scale of 1:31.8. The bathymetry (seabed profile) was constructed at a slope of 1:70 and was manufactured from a layer of cement mortar overlying a compacted sand fill. The bathymetry was placed to within a vertical accuracy of +/-0.05m and a horizontal accuracy of +/- O.lm.
R&D Project Record W5/006/5 42

Two separate sections were tested;. an Accropode-armoured section and a rock-armoured section with slopes of 1: 1.5 and 1:2 respectively. The cross section of the Accropode structure is shown in Figure 7.2: The Accropodes were hand placed to a specific laying pattern by a qualified. member of. .personnel. Both the core and underlayer rock were designed to reproduce a realistic level of porosity. A small crest wall was located behind the top row of.Accropodes, at a level equivalent to 9.0m OD.‘.-The crest berm was armoured with 6% rock armour placed behind the crest wall.. A rock toe was also:used to ensure stability. of the Accropodes.
The rock-armoured structure (Figure.7.3) had a slope of 1:2 to maintain consistency with the data of Lowe (1991). Rock armour of 10 - 12t was used on the front face and-!for the crest berm. The toe was constructed of 6% rock.
7.3.3 Test procedures The same wave conditions were used to test both structures, these-are shown in Table.7.3. The wave conditions used were designed to cause a wide range of overtoppingidischarges.. All wave conditions were calibrated in the flume before,any structure .was built. A shingle- .. spending beach located at the. end of the flume ensured that ,reflections,.during calibration were reduced to a minimum. Twin- wire. resistance type wave gauges were used at the. calibration point,. which was at the, toe. of the structure, to measure the wave height and period.
Each .test consisted of the running of one wave. conditions for a period equivalent sto 1000 waves. The, length of the wave sequence (the time taken before the wave record begins to repeat) was considerably longer than the actual test length.,- This safeguards against any group of waves being repeated.
Each test was repeated with-varying crest widths, starting with:no crest berm and increasing, in 5m increments up -to 20m. Water overtopping the structure was collected-. on a chute, located behind the,. crest berm. The chute ran -into a calibrated tank in which the mean overtopping discharge was measured electronically. The crest berm reduction factor,- Cf, was calculated as the ratio of measured overtopping with a berm to that without a berm. :
7.4 Test results
7.4.1 Comparison with Owen’s equation. The overtopping results for both structures are shown in Table 7.4. A plot.of dimensionless overtopping,. Q:z, against dimensionless crest freeboard, R;I;, for the Accropode and rock- armoured structures are shown in Figures 7.4 and 7.5 respectively. These graphs are compiled with data for seawalls with no crest berms.- Q* and R:g are defined by equations 2.3 and 2. l- from Chapter 2 of this -report. Also plotted in each case is the predicted relationship. between Q:x and R. from equation 2.7, using the appropriate values of. A and B from Table 2.1 with r =.0.55 for the rock-armoured structure and r = 0.4 for the Accropode structure. A good i correlation’.is obtained in the case of the.-rock armoured structure. For the Accropode structure the correlation is acceptable; although, as noted in Chapter 4 of this report;the slope of the line is not accurately reproduced by the A and B coefficients.
R&D Project Record W5/006/5 43

7.4.2 Effect of berm width Values of Cf for both structures are given in Table 7.4. Cf is plotted against crest width in Figure 7.6 for the Accropode-armoured structure. An exponential trend line has been fitted to each test data set. There is very little variation in the trend of Cf with crest width from test to test. The results show that the crest berm is more effective on this structure than the design rule quoted above suggests. An average reduction factor of approximately 0.03 results from a 10m crest width, compared to the previously estimated value of 0.10.
The reduction factors are plotted against crest width for the rock armoured structure in Figure 7.7. As with the Accropode tests there is very little variation with wave condition. For a crest width of 10m C, is approximately 0. I, a similar result to that obtained in the previous studies. Visual observations suggest that the majority of water arriving at the collection chute is in fact airborne.
The performance of the crest berm on the rock-armoured structure is not as good as that of the Accropode-armoured structure, despite the fact that the berms were armoured with rock in both cases. There could be several explanations for this. The increased roughness of the Accropodes may influence the patterns of flow at the crest. Alternatively the design of the Accropode seawall itself may be influencing the results. A small concrete seawall is located just behind the crest of the Accropodes (Figure 7.2). This wall helps to hold the Accropodes in place, thus making them more secure. It also has the effect of reducing the amount of water that passes through the armour at the crest, and diverts flow upwards, possibly increasing the effectiveness of the crest berm.
7.5 Design guideline
The results described above have been used to formulate a revised formula for predicting the effect of crest berms on overtopping discharges. The first point to note is that the Accropode structure generally demonstrated a more efficient crest berm than the rock structure. The reasons for this are not entirely clear, although it is possible that it is due to differences in the details of the models. In order to take a conservative approach the design recommendation will therefore be made on the basis of the rock structure results only.
Clearly the most important parameter is the crest width. The most appropriate way of non- dimensionahsing the crest width is by calculating its ratio to the incident wave height at the toe of the structure, H,.
A plot of Cf against dimensionless crest width, Cw/H,, for both the rock and Accropode structures is shown in Figure 7.8. There appears to be a good correlation in both cases, with relatively little scatter. Equations were fitted to both sets of data, as follows :-
For Accropode armoured structures: Cf = 4.35 exp(-2.1 Cw/H,) (7.2)
For rock armoured structures: Cf.= 3.06 exp(-1.5.Cw/H,) (7.3)
The equations result in values of Cf of 1 when Cw/H, = 0.7 and 0.75 for the Accropode and rock-armoured structures respectively. This may suggest that a berm with a width C, less than H, x 0.7 will be relatively ineffective.
R&D Project Record WY00615 44
7.6 Conclusions
The effectiveness of crest berms in reducing -mean overtopping i discharges has been investigated by a new set of model tests. The results are broadly in agreement with Lprevious studies. The previously accepted.design rule was that the overtopping discharge reduced by -a factor of 10 every 10m behind the top. of the.slope: i This rule has; been confirmed for crest widths up to 20m wide. The new tests are a more realistic reflection of ,prototype structures. Results have been expressed-in a non-dimensional form which can be incorporated in design methods. The berm behind. the Accropode-armoured structure was more effective- than that behind the rock-armoured structure. It is not-entirely clear whether this is due to minor difference in crest detail or any inherent properties of the armour.units. Consequently the results from the rock-armoured structure have been used, so that a conservative approach is taken.
R&D.Project Record W5/006/5 45

8. TOLERABLE OVERTOPPING LIMITS
8.1 Introduction. I’
Overtopping limits have traditionally been specified in terms of mean discharge rates. The generally accepted limits (Simm (19913) are reproduced in .Figure 8.1. This is a rational approach to take when designing for flood prevention. When attempting- to assess safety levels however, this approach is questionable, as the maximum individual event is expected to be of greater significance. The analysis presented in chapter 3 of this report, demonstrates that, for a given level of mean discharge, the volume of the largest overtoppingi event will. vary with wave conditions and structural.type. It is thus inconsistent to specify.safety levels with sole reference to mean discharge levels.
5.2 Model studies
Data correlating individual overtopping events with hazard levels are-rare. One of the few studies was carried out by Franc0 et al (1994), who conducted experiments which investigated safe overtopping limits for pedestrians and vehicles. It was demonstrated, by means of ‘model tests and experiments on volunteers; that the danger. level which an individual overtopping event represents can be-directly related to its volume. A volume was defined as “safe” if it created a less than 10% chance of the individual who is subjected to it falling over. An event ,was defined as “very .dangerous” if it created a greater than 90% chance of the individual subjected to it falling over.
Franc0 et al (1994) discovered that the .“safe” limit varied with structural type.. A given volume overtopping a vertical structure was found to be more dangerous than the same: volume overtopping a sloped, armoured structure. The “safe’? limit- for a vertical- wall was found to be O.lm”/m, whilst for a sloped, armoured structure it was 0.75m3/m. For the same I structures, the “very dangerous” limits were 0.75m3/m and 2m’/m respectively. However,*.,, Franc0 et al (1994) also noted that a volume as low as 0.05m3/m could unbalance an . individual when striking their upper body without warning. The latter f@re was determined from experiments on volunteers rather than from model tests and can thus-be considered more realistic.
Franc0 et al (1994) determined very different limits for different types of structure. It- is thought that such differences may be due to the structure’s crest detail; in particular the height of any parapet wall, if present. This factor determines how the overtopping water jet impacts upon the individual.
8.3 Prototype experiences and-observations
8.3.1’ Full scale grass dyke tests Smith et al (1994) reported on full-scale tests conducted on grass dykes. An observer stood on the crest of the dyke as it was being tested. One of the objects of the experiment was to determine safe overtopping limits for personnel carrying out inspection and repair work. Smith et al (1994) concluded that work was unsafe when the mean discharge exceeded-.] 0 l/s/m. From an examination of Smith et al’s -(1994) data this corresponded to a maximum individual volume, .V,m,, of -approximately 1.6m”/m: This is between the- “safe” and “very dangerous” limits for the sloped, armoured structure.determined by Franc0 et al (1994), and accords with. their observation. that safe limit of V ,nax varies with structural type. One reason
R&D Project.Record W5/006/5 46
for this variation may be the different way in which the water strikes the individual. Smith et al (1994) reported that the vast majority of the overtopping discharge acted on the observer’s legs only. It must also be borne in mind that the safety limits for trained personnel (such as the observer in Smith et al’s (1994) tests) working on a structure and anticipating overtopping are higher than those for other users.
8.3.2 Colwyn Bay vertical wall
Information on prototype safety is available from Herbert (1996) who monitored overtopping at a vertical seawall at Colwyn Bay, Wales. During the installation and operation of the apparatus it was noted that personnel could work safely on the crest of the wall during mean discharges of up to 0.1 l/s/m. When the mean discharges exceeded 0.1 l/s/m it was considered unsafe. This limit is considerably lower than that given by Smith et al (1994). Individual overtopping volumes were not measured, however, the methods described in the preceding chapters of this report can be used to provide an estimate of Vmax, given that the mean discharge and the incident wave conditions are known. This process results in an estimated V ,nnx of approximately O.O4m”/m for the sea state which caused the 0.1 l/s/m mean discharge. This is in close agreement with Franc0 et al’s (1994) estimate of the volume which could cause someone to lose their balance.
Herbert (1994) also noted that overtopping became a danger to vehicles when the mean discharge exceeded 0.2 l/s. Using the process described above it was determined that this corresponds to a V ,nax of approximately 0.06m3/m.
8.3.3 Endoh & Takahashi An alternative approach to defining safety limits of individual overtopping events is to look at them in terms of peak discharge. Endoh and Takahashi (1994) conducted experiments on volunteers to determine the peak flow rates which would be dangerous to pedestrians. Using a similar method to Franc0 et al (1994) they subjected volunteers to high rates of flow and determined the point at which they were unbalanced. Instead of tota volume however, they measured flow rates. They also developed a numerical model based on the computed drag forces on a person. Good agreement was found between the predicted and measured flow rates at which the person feI1 over. They extended the study to predict flow rates which would carry people over handrails and barriers.
The way in which the water struck the volunteer was, as in the experiments of Smith et al (1994), on the legs only. From an examination of Endo and Takahashi’s (1994) results it would seem that, typically, a flow rate of 0.8 to lm”/s/m unbalanced the volunteer. Assuming the duration of the flow in a prototype wave would be several seconds, this corresponds to an individual overtopping volume of approximately 2 to 3 m’/m. This accords reasonably well with the result of Smith et al (1994).
8.3.4 Orkney Islands Churchill Barriers For the purposes of this report observations of overtopping at three sites have been made using video footage recorded on-site. The three locations were Churchill Barriers in the Orkney Islands, Sidmouth on the south coast of England and Towyn on the north Wales coast. Of these only the Churchill Barrier site gave enough data to provide a full analysis. The methods described in the preceding chapters of this report were used in conjunction with information from the video tapes to estimate the mean and peak overtopping rates.
R&D Project Record W5/006/5 47

Footage of a storm occurring on 5t” - 6t1’ of January 1996. was available at the Churchill Barrier site.. An extensive sequences of video was taken from one location at the southern end of the site. A knowledge of the site from earlier .studies allowed the incident wave conditions and water levels to be estimated.
The conditions used in the analysis were as follows. The Barrier consists of a sloping, concrete block armoured 1: 1 gradient slope,with a fltit-topped crest: carrying a two lane road, at about 5.08m ODN. There is a crash barrier at the edge of each carriageway.. The sea bed level at the toe was taken as - 4.67m ODN.. The estimated water level during the storm was I .39m ODN, which is the same as the predicted high tide at Wick on 5th January. This gave a water depth of 6.06m. Depth-limited wave conditions were assumed to be occurring during the storm: The depth limited significant wave height is given by 0.55 x water depth, and is therefore 3.33m. From the video the wave period was estimated at 7.2 seconds;- giving a sea steepness of: 0.041. Also; and most importantly, an estimate was made from the video of. the:. proportion of overtopping waves. This was found to be 40%. This value can be used to estimate the dimensionless discharge, Q:<; (using equations 6.8(a) to 6.8(b)) as 4.2~10~~.
From the definition of Q* (equation 2.3)
Q = QC TA g H, = 0.0989 m”lsim .. 03.1)
The video lasted 2040 seconds, .giving a total overtopping volume of 202m”/m. .The number of overtopping waves, Now, is 113. The average volume per overtopping wave, Vba,-, is therefore 1.79m”/m. Finally, equation 6;15’ gives the maximum overtopping. volume in the sequence :-
V ,,,= = 0.921 Vbar (ln N,,.,,) ““‘853 =. lO.‘,?,m?‘/m (8.2)
To confirm this figure the mean discharge was estimated .using equation 2.7. with the. appropriate values of A and B from Table-3.1 and assuming.r = 0.55. ‘This results in Q = 0.07Om’Mm and V,,l, = 7.15m’/m. The differences in these predictions are well within the accuracy limits of the methods involved.
Whether considered in terms of mean or peak discharges, the overtopping experienced during this storm was well’ in excess of safety limits suggested by all the relevant studies. For example, Herbert (1996) considered a mean discharge of 0.2 l/s/m to be hazardous.to traffic. However, throughout the sequence used for estimatin g the number of overtopping waves, vehicles continued.to pass across the barrier in both directions, despite the large amounts of water both on the road and in the air. (At one time a learner motorcyclist on a 5Occ moped was seen to cross!). It was noted that several of the vehicles were hit ,by the spray from overtopping waves. About two hours- after the start of filming a blue flashing light on a police car can be seen on the far side of the barrier, which was then closed to fLu-ther traffic.
From the video it was clear,that most of the overtopping discharge was in the form of spray rather than green water. This fact would reduce hazard levels to some extent,! as it seems reasonable to assume that discharge in this form is less dangerous than green water discharge. It is, however, difficult to predict with any degree of certainty whether the .overtopping discharge on a particular structure will be in the form of spray or not. The possibility of overtopping being in the form of spray does not therefore justify the upward revision of overtopping limits.
R&D Project Record W5/006/5 48

This video footage, combined with knowledge of the site, gave a valuable data set from which likely discharges could be estimated using the methods presented in this report. For this procedure to be used the minimum requirements are a knowledge of the inshore wave conditions and water level and the design of the structure. In this case depth limited waves were assumed and water level was estimated from tide tables. The wave period was estimated from the video footage. Secondly, although video footage for a number of sites was investigated, it became clear that often such material is inadequate. If this procedure is to be used successfully then several minutes worth of video from a fixed location is required to give an adequate estimate of both Nwo, the number of overtopping waves, and the incident wave period.
8.4 Mean discharges
Whilst maximum individual volumes are recommended for use in specifying limits for safety of personnel and vehicles, mean discharge is more appropriate in other areas of interest. These include the integrity of the seawall itself, where damage tends to be progressive rather than resulting from a single severe event. For this reason the current limits (Figure 8.1) are recommended. It may have been appropriate to examine damage to building in terms of maximum volume. Unfortunately no data is available. The current limits are therefore retained.
8.5 Specification of tolerable overtopping
Data concerning overtopping limits in terms of, individual volumes is available from a variety of sources. Although various values have been proposed for safe overtopping limits, most of this variation can be attributed to differences in the structure under consideration. Most results indicate that tolerable discharges can be higher when water strikes an individual on the lower legs than on the upper body. Overtopping is also more dangerous when in the form of a concentrated jet rather than spray. The authors consider that the most dangerous mode of water striking a pedestrian could occur on any structural type. Franc0 et al’s (1994) data indicate that, when this occurs, a volume of as little as O.O5m’/m can cause an individual to fall over. Prototype measurements indicated an almost identical figure of 0.04 m”/m. This figure was therefore recommended for inclusion in the manual. A limit of 0.06 m3/m was adopted as the limit for vehicles.
Any situation in which the limits given above are exceeded is likely to be potentially hazardous to pedestrians and vehicles. These limits imply that many situations in which even a single green water overtopping event occurs are potentially hazardous. In these cases safety can only be assured when no overtopping takes place. Because of the random nature of waves it is difficult to specify a situation in which overtopping events are completely eliminated. A probabilistic approach is therefore required. The probability of an individual wave overtopping is given by N,,/N,. The probability that no waves will overtop during a sequence of N, waves is therefore :-
P(no overtopping) = (1 -NoJNw)NW (8.3)
and the probability that there will be at least one overtopping event during the sequence is given by :-
P(overtopping) = I- (l-N,w/N,V)N”
R&D Project Record W5/006/5
(8.4)
49
The acceptable.risk of an overtopping event occurring may depend on the use of. the structure in question. ‘It is therefore recommended that when analysis of individual overtopping volumes indicates that very small numbers of overtopping events create unsafe conditions the structure should be.optimised by limiting the probability of an overtopping event taking place. to an acceptable level. When overtopping.events do-occur, discharges must be limited to the values given above.
R&D Project Record W5/006/5 50
References
Allsop, N.W.H., Besley, P., and Madurini, L., Overtopping.Performance of Vertical and Composite Breakwaters, Seawalls and Low.. Reflection Alternatives, Paper -4.6 in Final Proceedings of MCS Project, published by University of Hanover, 1995.
Allsop, N.W.H., McKenna, J.E., Vicinanza, D., and Whittaker, T.J.T., New Design Methods for Wave Impact Loadings on Vertical Breakwaters and Seawalls, Proceedings of 25th ICCE, Orlando, published by ASCE, ‘1996.
Banyard, L., and Herbert, D.M., The Effect of-Wave Angle on the Overtopping of Seawalls, HR Wallingford, Report SR 396,: 1995.
BesIey P., Allsop, N.W.H, Colombo, D., and Madurini L:,a Overtopping Performance of Vertical Walls and Low Reflection Alternatives : presented to 3rd MCS Workshop, Emmeloord, 1994.
Results of Wave Flume Tests, Paper :.
Besley, P., Reeves, M.K., and Allsop, H.,.Single Layer Armour Unit Research Club, Random Wave Physical Model Tests : Overtopping and Refletition Performance, HR Wallingford, Report IT 384, 1996.
Bradbury, A.P., Allsop, N.W.H. and Stephens,.R.V., Hydraulic Performance.of Breakwater Crown Walls, HR Wallingford, Report SR 146, 1988.
de Waal, J.P., Wave Overtopping of Vertical Coastal Structures : Influence of wave Breaking and Wind, Paper presented to 2”d MCS Workshop, Milan, 1994.
de Waal; J.P., and van der Meer, J.W., Wave Run-up and Overtopping on Coastal Structures, Proceedings 23’d ICCE, Venice,,published by ASCE, 1992.
Endoh, ,K., and Takahashi, S., Numerically Modelling Personnel Danger on Promenade Breakwater due to Overtopping Waves, Proc. International Conference on Coastal Engineering, Kobe, Japan, 1994.
Franco,:C., Wave Overtopping and Loads on Caisson Breakwaters under Three Dimensional Sea States, DelfttHydraulics, complete reference unobtainable to date; 1996.
France;L.. Comments to paper 4. Coastline Structures and Breakwaters, 19-20 March 1998, ICE London, Published by Thomas Telford.
France, .L., Overtopping of Vertical Faced Breakwaters : Results of Model Tests. and Admissible Overtopping Rates, Paper presented to lSt MCS Workshop, Milan, 1993;.
France, L., de Gerloni, M., and van der Meer, J.W., Wave Overtopping at Vertical and Composite Breakwaters, Proceedings 24*h,ICCE, Kobe, published by ASCE, .1994.
Goda, Y., Random Seas and Design of Maritime Structures, University of Tokyo, 1985.
Herbert, D.M., Wave Overtopping.of Vertical Walls, HR Wallingford; Report SR 3 16, 1993.
R&D Project Record W5/006/5 51
Herbert, D.M., The Overtopping of Seawalls, A Comparison between Prototype and Physical Model Data, HR Wallingford, Report TR22, 1996.
Herbert, D.M and Reeves, M K., Report EX 2433: HR Wallingford Ltd, 199 1.
Lowe, J P., Report EX 2310, HR Wallingford Ltd, 1991.
Madurini, L., Laboratory notes, unpublished, HR Wallingford
Owen , M.W., Design of Seawalls Allowing for Wave Overtopping, HR Wallingford, Report EX 924, 1980.
Owen, M.W.: Overtopping of Sea Defences, Paper presented to International Conference on the Hydraulic Modelling of Civil Engineering Structures, Coventry, 1992.
Owen, M.W., and Steele, A.A.J., Effectiveness of Recurved Wave Return Walls, HR Wallingford, Report SR 26 1, 199 1.
Simm J.D., (Editor), Manual on the use of rock in coastal and shoreline engineering, CIRIA special publication 83, CUR Report 154, 199 1.
Smith, G.M., Seijffert, J.W.W., and van der Meer, J.W., Erosion and Overtopping of a Grass Dike : Large Scale Model Tests, Proc. International Conference on Coastal Engineering, Kobe, Japan, 1994.
van der Meer, J.W., and de Waal, J.P., Summary of Wave Overtopping at Dykes, Technical Note, Delft Hydraulics, 1992.
van der Meer, J.W., and Janssen, J.P.F.M., Wave Run-Up and Wave Overtopping at Dikes, in Wave Forces on Inclined and Vertical Wall Structures, ASCE, 1995.
R&D Project Record W5/006/5 52

Figures,
R&D Project Record W5/006/5

lC2- .‘ -. I I
Simple seawalls (No berm) Normal wave attack
10’
L
.,’
r
10: ’ 1. .\ i.
I O-05 o-15 o-25
R,
Figtire 2.1 Owen (1980),relationship for impermeable simple slopes
R&D Project Record WSlOQ6/5

i
Figure 2.2 Wave return wall
J
R&D Project Record W5/006/5
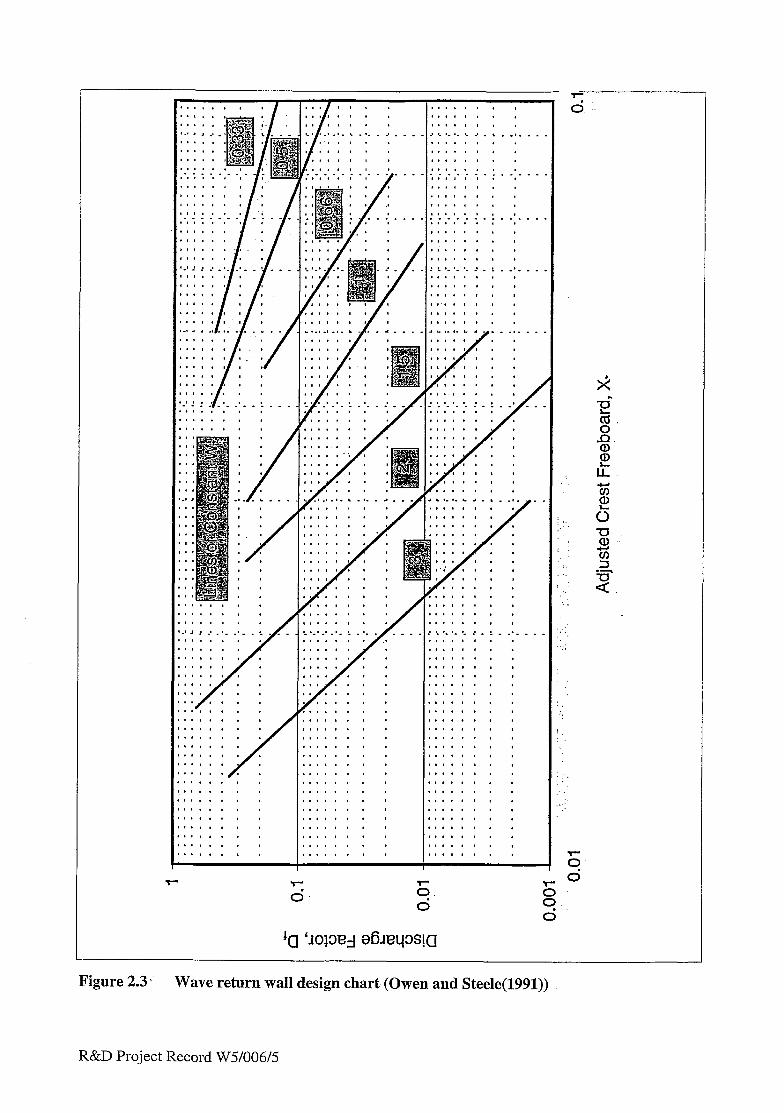
!.
: ~.’ ‘.:
:.
: ._:
5 l-- 6 g
d 4a ‘JO~TSJ afGey3qa
Figure 2.3 I Wave return wall design chart-(Owen and Steele(1991))
R&D Project Record W5/006/5

1 ci'- i
\ \
\
5
\
\
-l- 3
- Model tests
___ Goda
Figure 2.4 Goda’s (1985) graphical design method
R&D Project Record W5/006/5
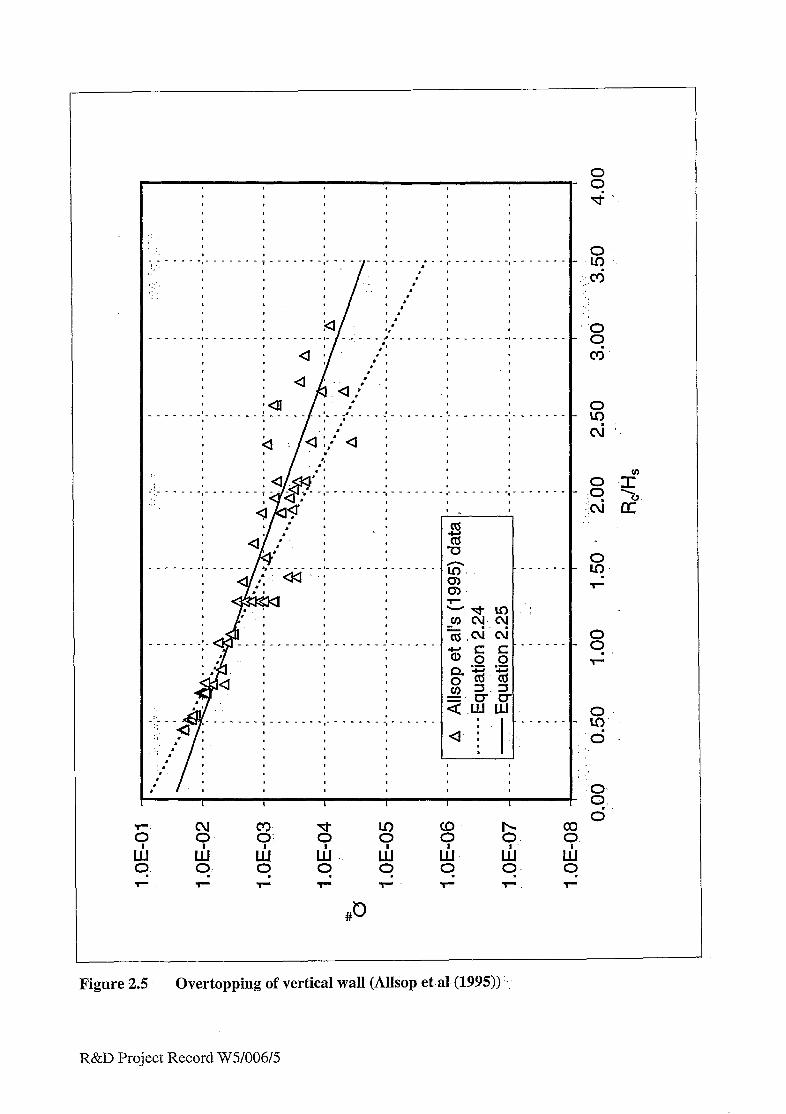
-- *. ’ , ’ 22
--‘- FT.0 ---A _-_-__-’ _--_--_ J --_--_. +-’ L _
t:; _
,* ’ 000 *- ‘ai f i
c&g 3
2 g-g- aww ‘---‘-‘i------‘i‘-‘----,------. I -I
Figure 2.5 Overtopping of vertical wall (AllSop et-al.(1995)) . .
R&D Project Record W5/006/5
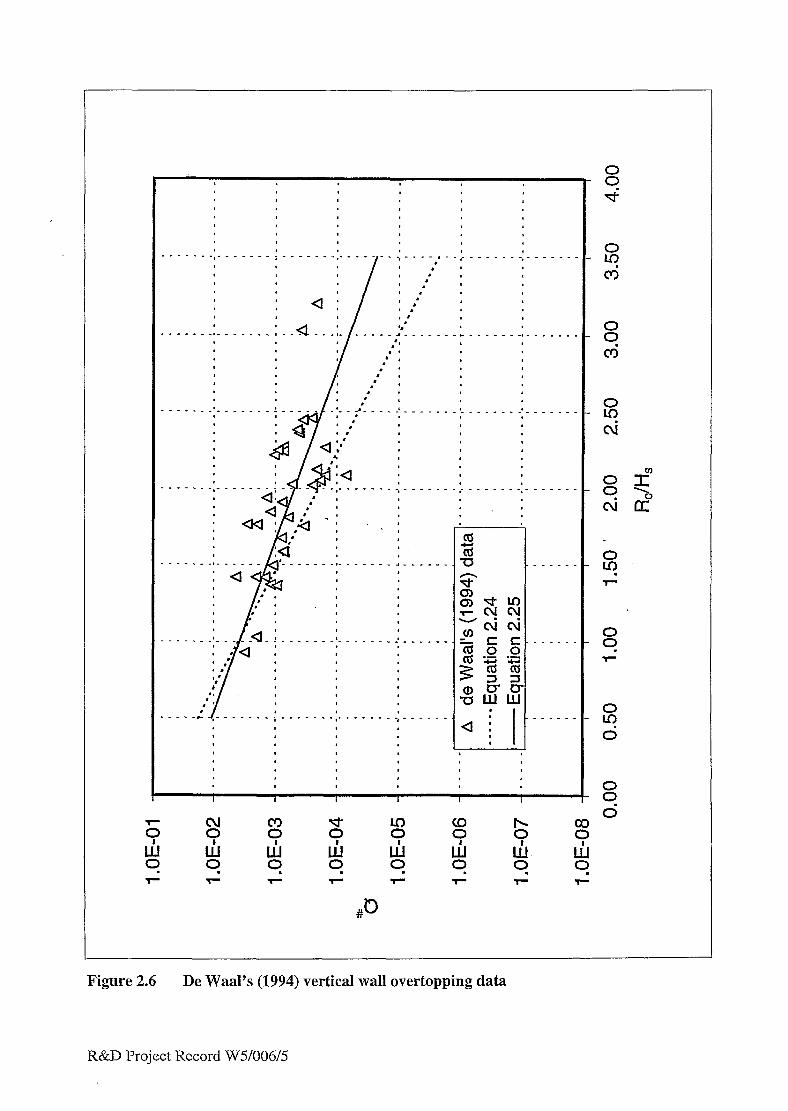
__ --‘-‘l-------i---‘ _ - - ,_ - - - - - - -, i/! 4 ; . I
.
a’ .
.
,* .
‘. - - .,_
I ‘, .
I 8
- - - - - -0 -
Figure 2.6 De Waal’s (1994) vertical wall overtopping data
R&D Project Record W5/006/5

‘:
c 1
I 3
i(D 6.
k 0
c9 0
c? 0
E! 0
T : 0
: :
Figure 2.7 Vertical wall-under impacting wave attack (Allsop et al (19951
J
R&D Project Record W5/006/5

Figure 2.8 ‘Composite structure
R&D Project Record W5/006/5
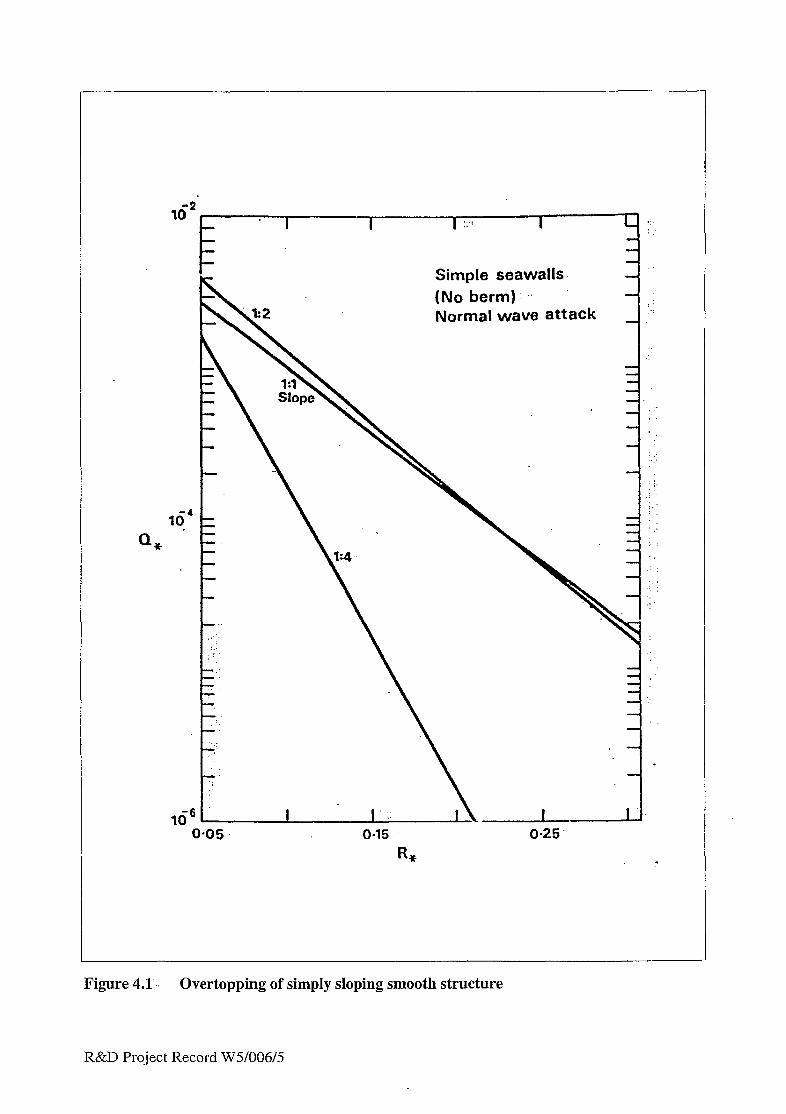
10’ Q* -
- : -. -7. ? . . -. ‘. -I
T &, ‘I
I - ,.I _. ;* I 0.05 o-15 o-25
R*
SimpIe seawalls IAl, La--\ .I \lUU UG11111
Normal wave attack !.I
.:
?- \\ 1
z \ j .:.
-.
Figure 4.1.. Overtopping of simply sloping smooth structure
R&D Project Record W5/006/5
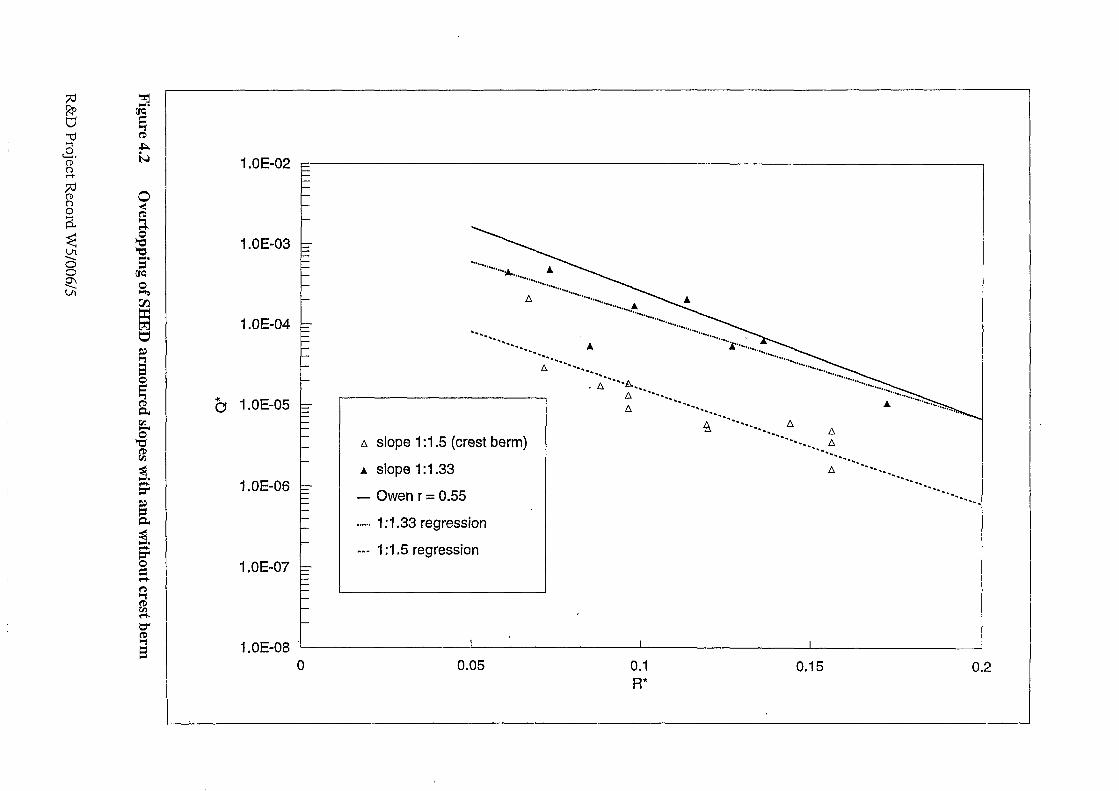
1 .OE-07
b
A slope 1 :I .5 (crest berm)
A slope 1 :I .33
- Owen r = 0.55
. . . . . . 1 :1.33 regression
--- 1 :I .5 regression
l.OE-08 ” I I
i.OE-02 t L
l.OE-03 F
i.OE-04 r
l.OE-06 F
0.05 0.1 R*
0.15

1
I.qE-02 t
L
-J.OE-03 = :
l.OE-04 =
if-j l.OE-05 z-
1 .OE-06 .,
,f
1 .OE-07
“’ 1
0 slope 1 :I .5
I slope 1 :I .5
a slope 1:2
A slope I:2
- Owen r’= 0.55
...... 1 :I .5 regression
--- I:2 regr~+&
l.OE-08 I I I 1 0 0.05 0.1 0.15 0.2
R*
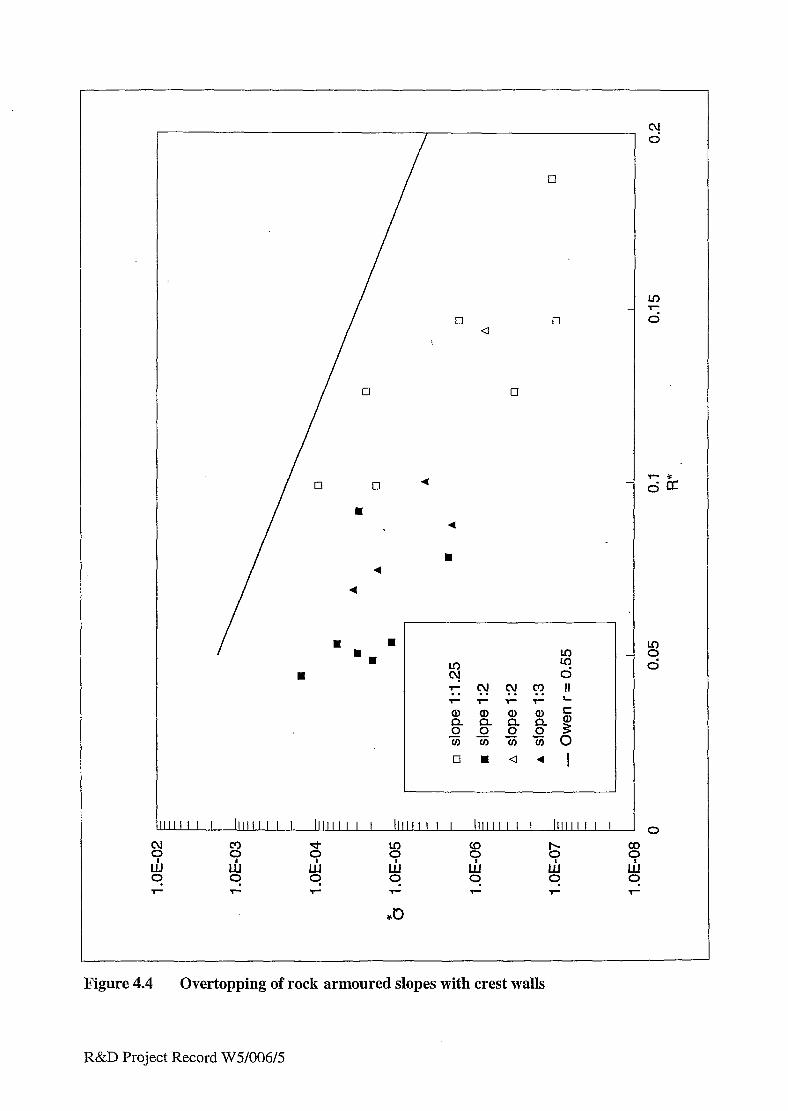
0 a
cl
cl
4
n
1111II I 111111I I I llllllI I I llllllI I I llllllI I I llllllI I I
Figure 4.4 Overtopping of rock armoured slopes with crest walls
R&D Project Record W5/006/5

#’ #’
/ I’
I’ I’
I’. I’
,’ a
,- ,’
I’ I’
I’ #’ /
Figure 4.5 Overtopping of Accropode armoured slopes
R&D Project Record W5/006/5 -,

r
L
1 Figure 4.6 Effect of slope roughness on overtopping
III1 I I I 111/11 I I I llll/ll I I llllII I I I llllllI I I l1llII I I I
R&D Project Record W5/006/5

Figure 4.7. Vertical seawall at Colwyn Bay
R&D Project Record W5/006/5

:
I
: : : :
I
0 l-
Y
s
Figure 4.8 Overtopping of vertical seawall at Colwyn Bay
R&D Project Record W5/006/5
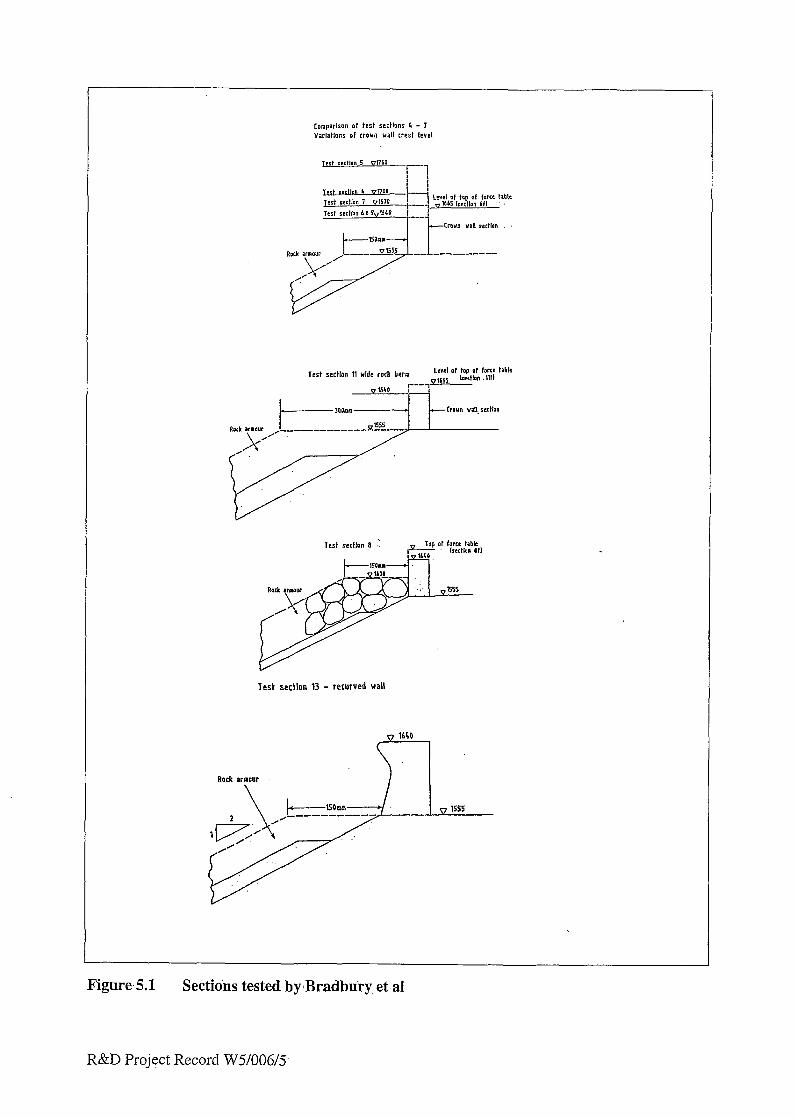
Test section 13 - recurved wall
Figure.5.1 Sectihs tested by,Bradbury. et.al
R&D Project Record W5/006/5
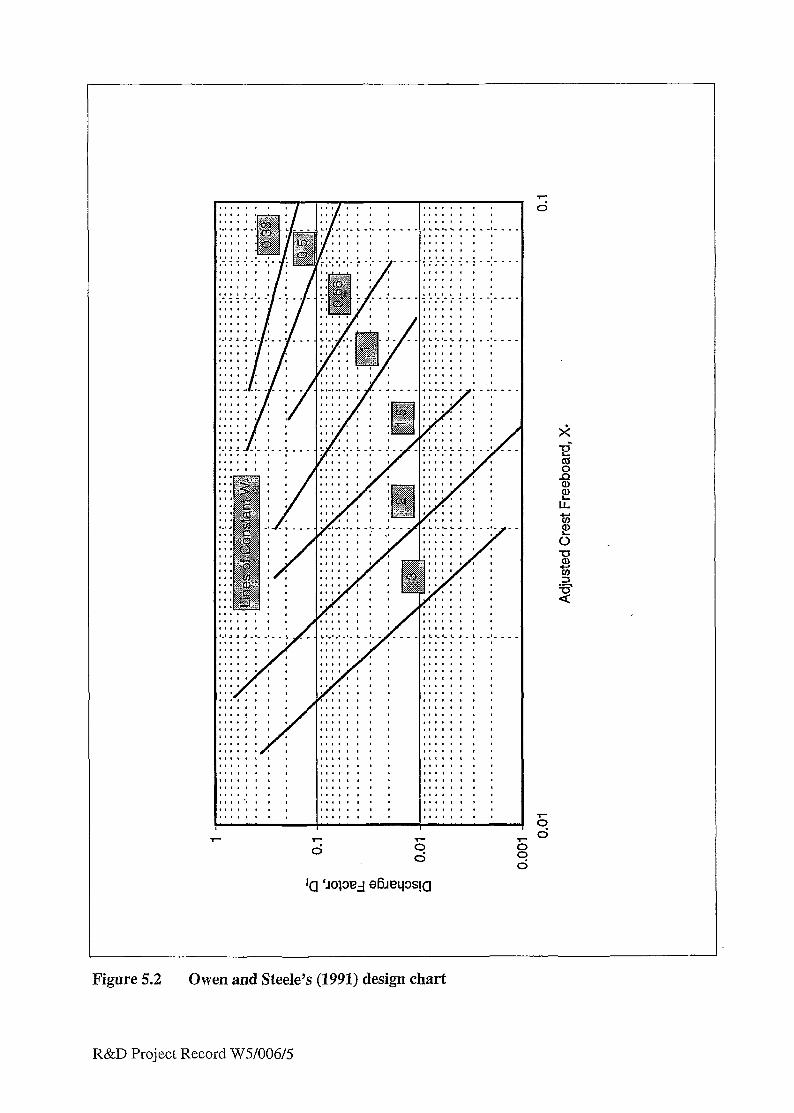
Figure 5.2 Owen and Steele’s (1991) design chart
R&D Project Record W5/006/5
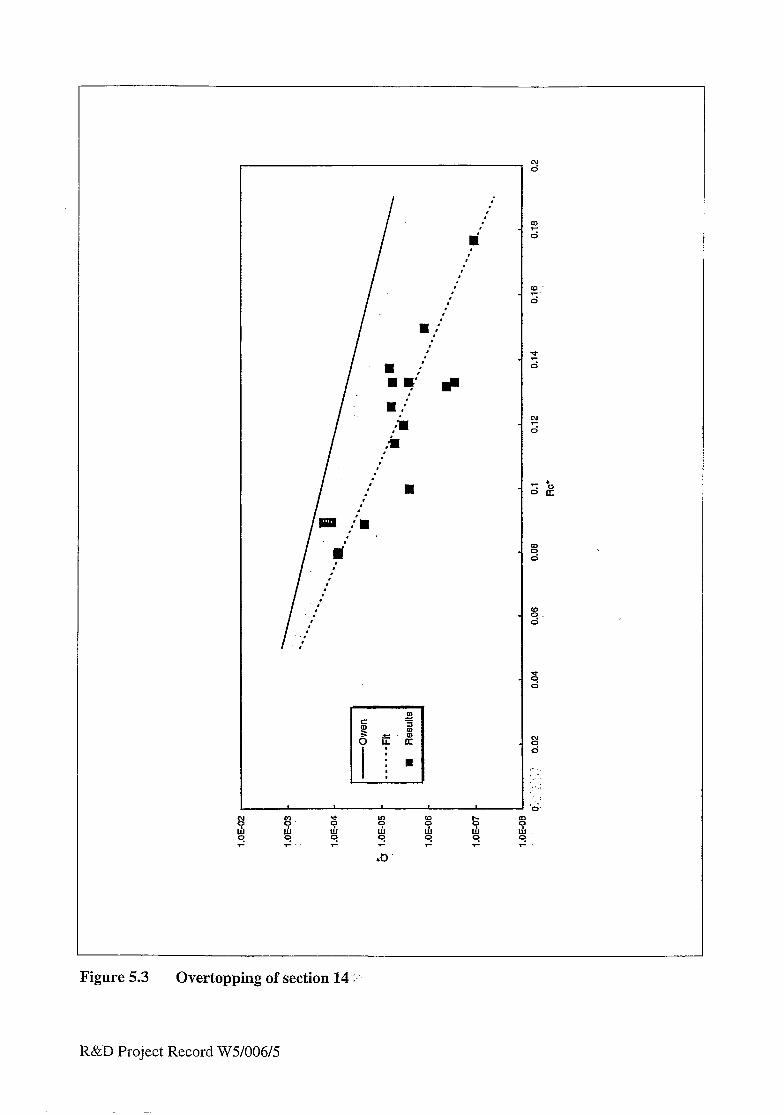
a- , , , , c , , , ,
a- , , , , c , , ,
Figure 5.3 Overtopping of section 14 :
R&D Project Record W5/006/5

1
, i+
, ;o” sn
I . 0
, +
0’ /I/-//-.I
-%,’ + +
, + ;’ I , 4;
, , ,
, , ,
I , , , ’
f
JOl3Oj E’6JDL/X!a
J
3gure 5.4 Discharge factors of recurved wail on rock- armoured slope x.
R&D Project Record W5/006/5
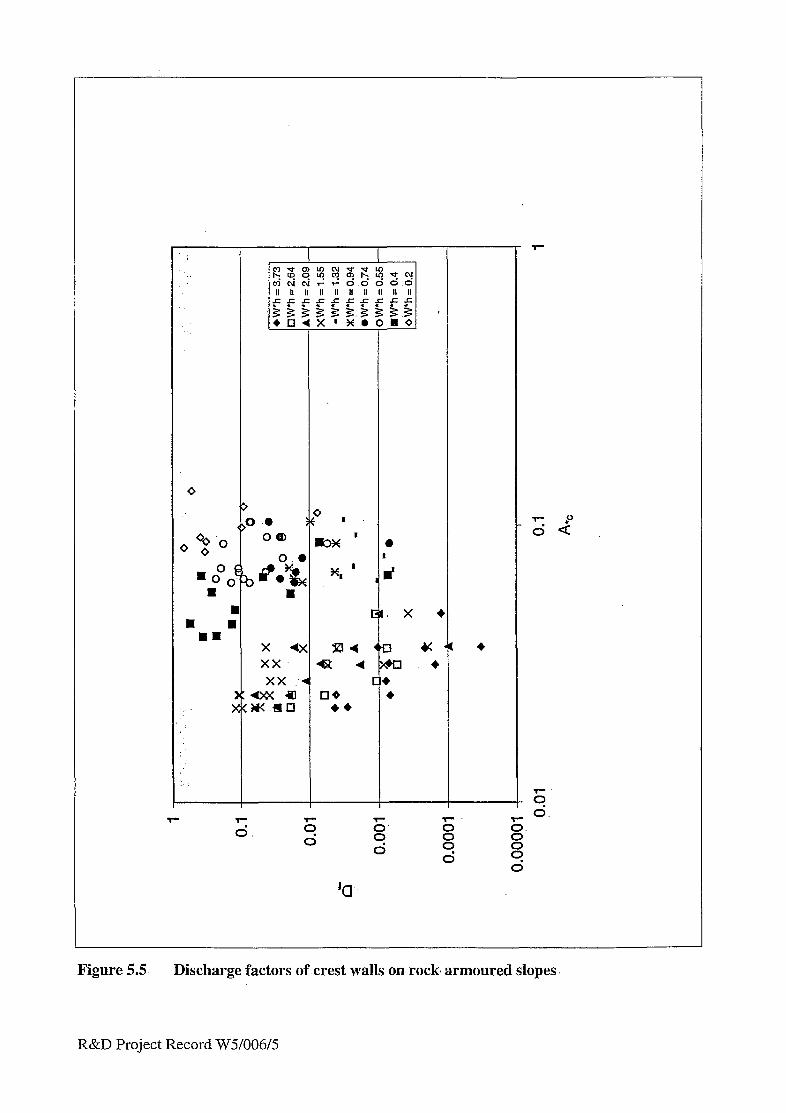
F.
8
0 d
Figure 5.5 Discharge factors of crest walls on rock. armoured slopes
R&D Project Record W5/006/5
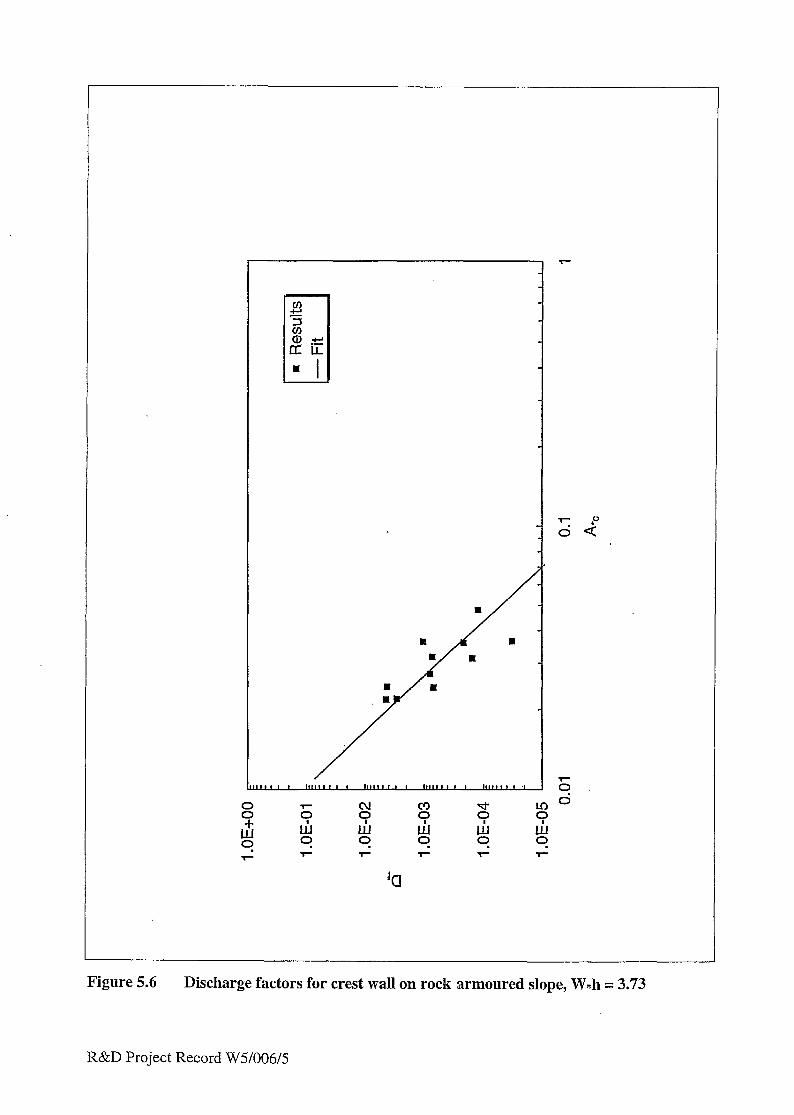
9 E! .
Figure 5.6 Discharge factors for crest wall on rock armoured slope, W*h = 3.73
R&D Project Record W5/006/5

Figure 5.7 Discharge factors for crest wall on rock armoured slope; W*h = 2.64
R&D Project Record W5/006/5 :

Figure 5.8 Discharge factors for crest wall on rock armoured slope, W*h = 2.09
R&D Project Record W5/006/5

8 + ‘. Ei .
Figure 5.9 Discharge factors ;for crest wall. on rock. armoured slope,- W*h = 1.55
R&D Project Record W5/006/5

s
Figure 5.10 Discharge factors for crest wall on rock armoured slope; W+h = 1.32
R&D Project Record W5/006/5

l.OE+OO
l.OE-01 ,' '.
l.OE-02 .d :
i.OE-03
l.OE-04
1 ._ .:. ,: :

Figure 5.12 Discharge factors for crest wall on rock- armoured slope, Wlh = 0.74
R&D Project Record W5/006/5

x Lh’ 9
Figure 5.13 Discharge factorsfor crest wall on rock armoured slope, WA = 0.55
R&D’Project Record W5/006/5

1.0E-1-00
l.OE-01
l.OE-02
l.OE-03
l.OE-04
l.OE-05 0.01 0.1 1
A*,

I
_.
Figure 5.15 ,. Discharge factorsfor crest wall on rock- armoured slope, W&= 0.20
R&D Project Record W5/006/5

Figure 5.16 Discharge factors for crest walls on rock .armoured slopes, selected values of Wzh
R&D Project Record W5/006/5

mm q n m q
I q
4a
444 4 4 4 44
44 4 4 43
44 4
a-444 4
44u 4
n 0 .
n P .rn cl n m% 0‘
Figure 5.17 Effect of recurved wall on discharge factors
R&D Project Record W5/006/5
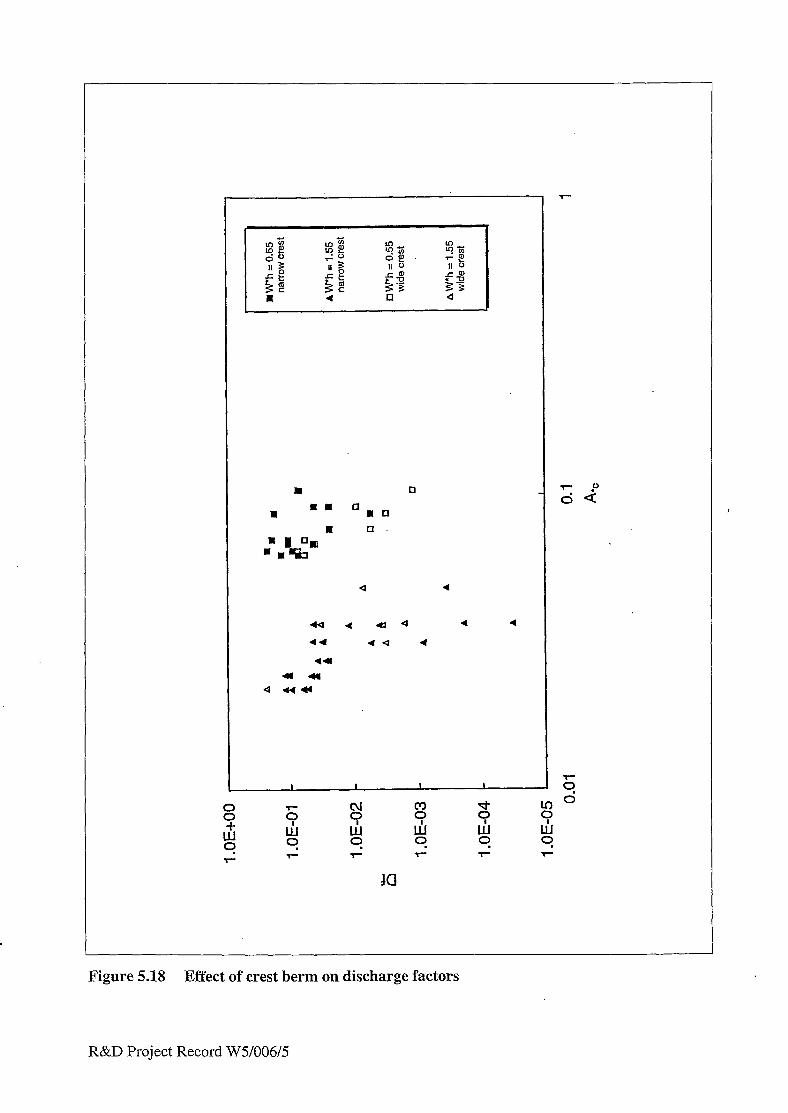
a 4
44 4 a Q 4 4
44 *a 4
44l
au
a 4444
I I I I
Figure 5.18 Effect of crest berm on discharge factors
R&D Project Record WSfOO615
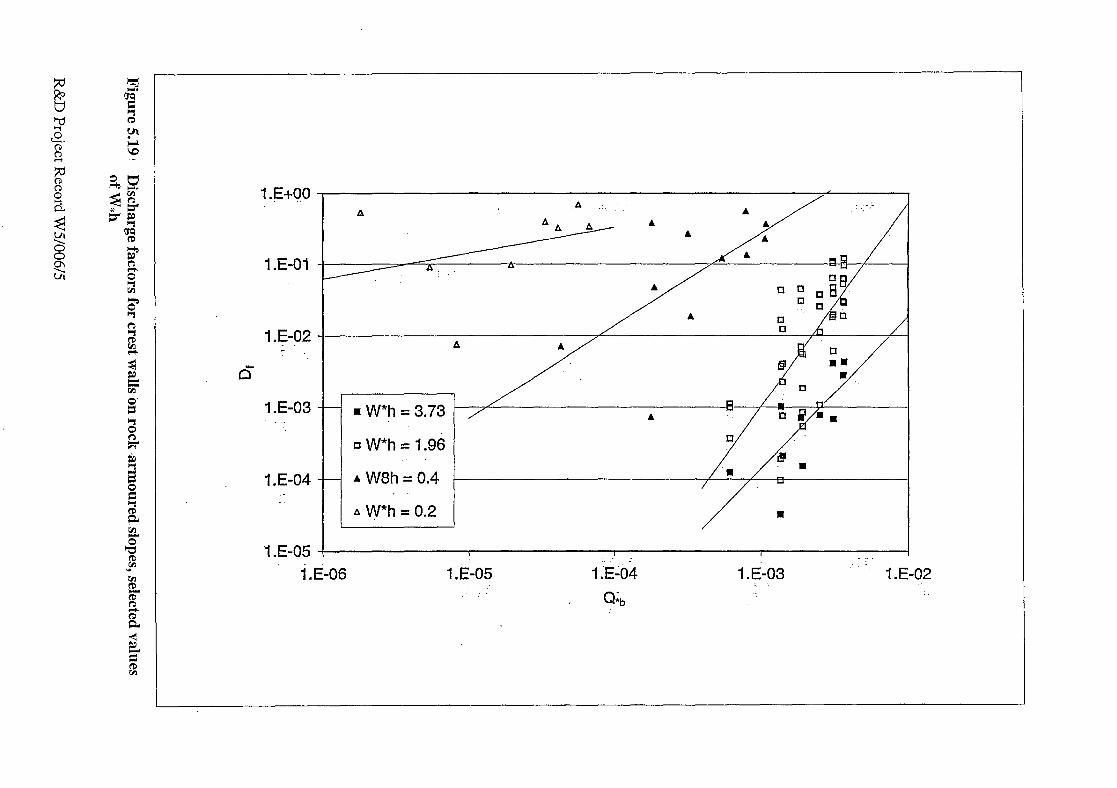
l.E-$O
l.E-01
p-02
i.E-03
l.E-04
l.E-05 1.
A A _.,‘,
A
i:
SE-06 l.E-05 l.E-02

Figure 5.20 Design chart
R&D Project Record W5/006/5
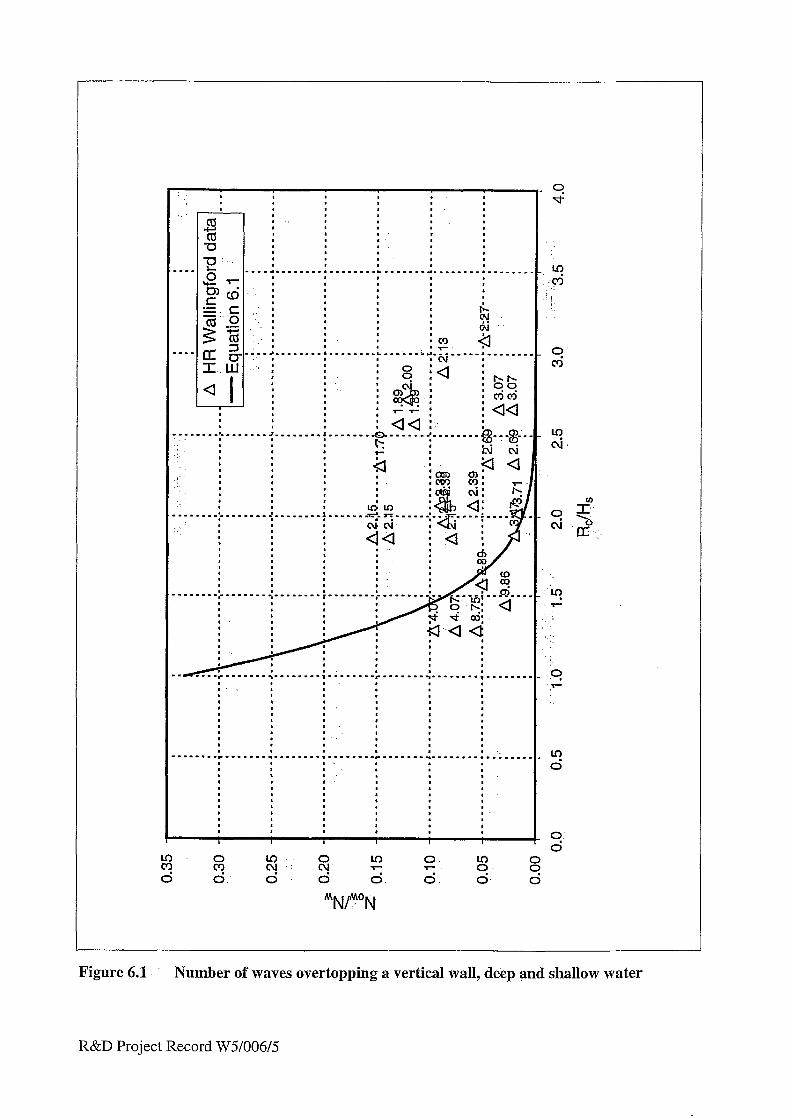
:. : : : . , l .
: :
. ‘ :
,
l
:
I .
.
I . : :
.
: : . . . - - . . . . . . . . . . . : . . . . . . . . . . . . . - . . . : . . . . . . . - . . . . - . . - . . . . - - . .
:
1 ,
:
. .
. . . , I *
I
, :
: :
,
.
:
.
. .
: :
.
.
I I I I 1 I
9 .?-
u-l d
Figure 6.1. Number of waves overtopping a vertical wall, deep and shallow water
R&D Project Record W5/006/5

I . a . I I “! I CD- : ; I ,
: :
: :
‘.I
: :
: :
: :
. .
: :
. I
. .
. I
: :
. .
s ‘z= - 4
/ E. I
: :
I .
. 0
I I
:: . *
. I ::. . ,I, s .a. I.. :
0 Y- d
MNIMoN
Figure 6.2 Number of waves overtopping a vertica1 walI, impacting waves only
R&D Project Record W5/006/5

Figure 6.3. Number of- waves overtopping simple armoured slopes
/
/
/’ ‘.
/
a
; ,’ .4
/
/
/
a a-’
a’
a aa’ -4
R&D Project Record W5/006/5

<
a
a a
/
Qa 4
8 aa
. . . ; : . . . . .
‘. . . . . : \ : . . . .
Figure 6.4 Number of waves overtopping sloped structures, all structural types
R&D Project Record W5/006/5
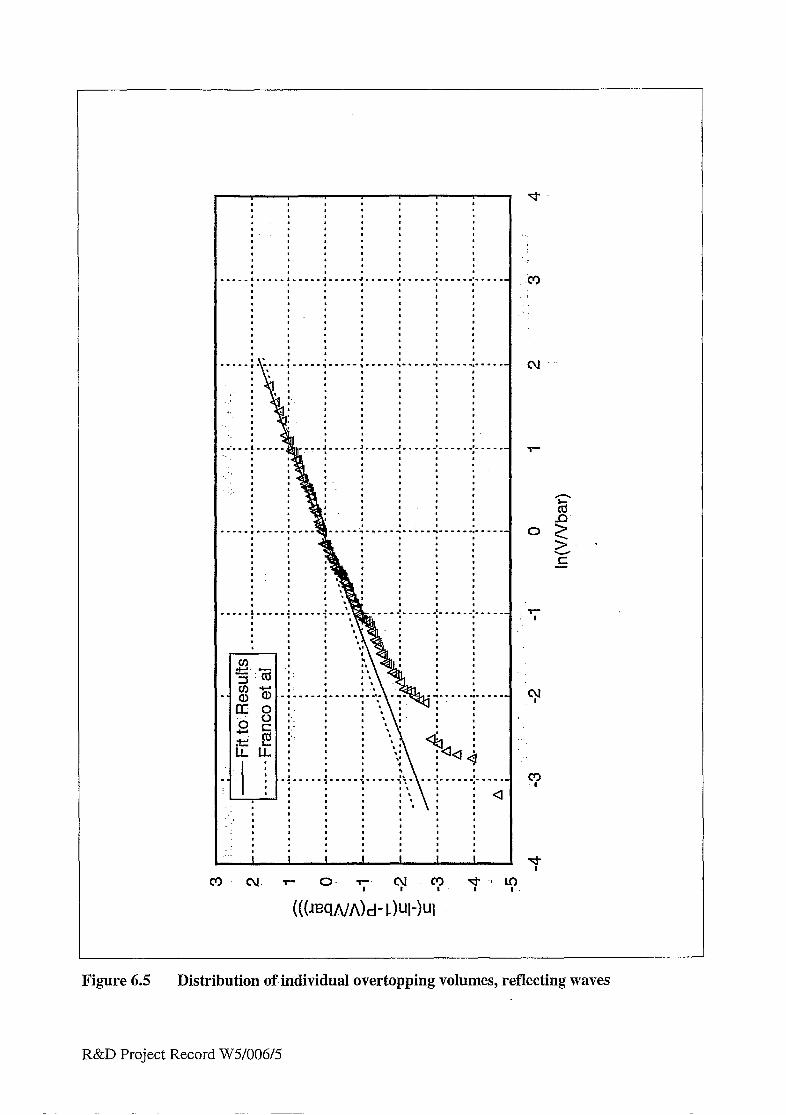
: ’
... ,
.’ I
. :
__
__
. . < 3
c- cd
OS L - E
T- : I
Figure 6.5 Distribution of.individual overtopping volumes, reflecting waves
R&D Project Record W5/006/5
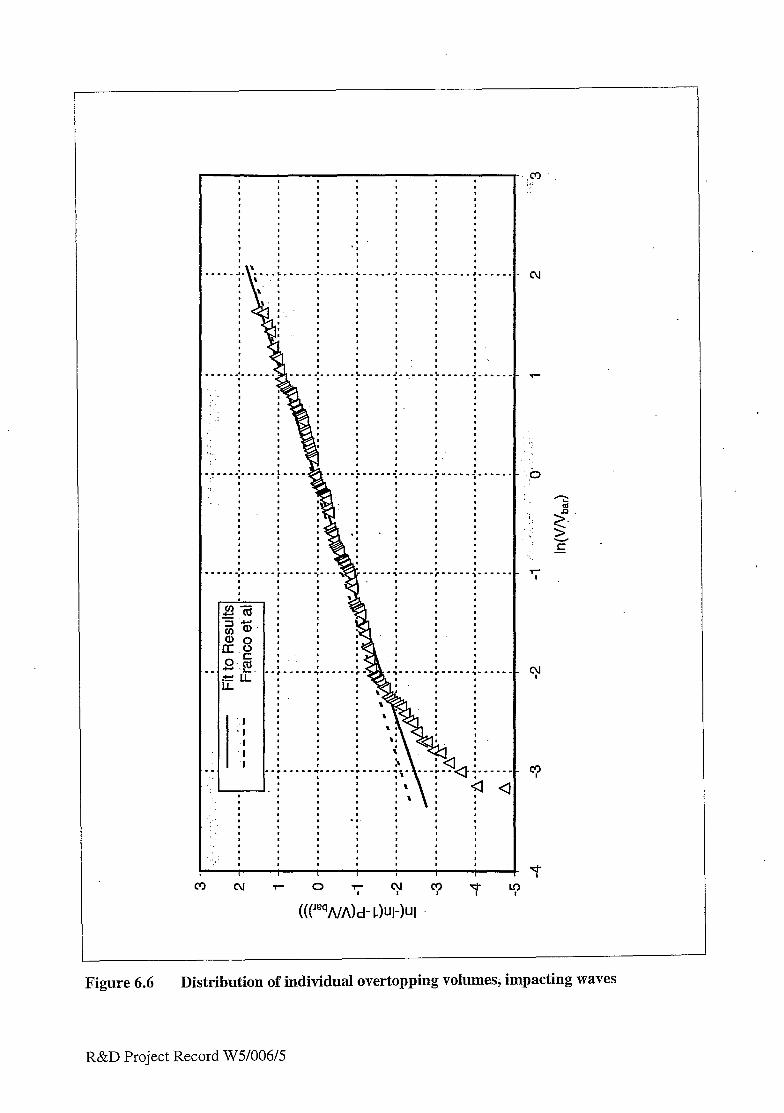
I :’ I
‘. ’
- . . I
‘. :
, . :
,
, , I I 1 ,
m cu T-- 0 ‘; cy c? p yl
(((‘“q/VA)d- ChJl-)Ul
Figure 6.6 Distribution of individual overtopping volumes, impacting waves
R&D Project Record W5/006/5
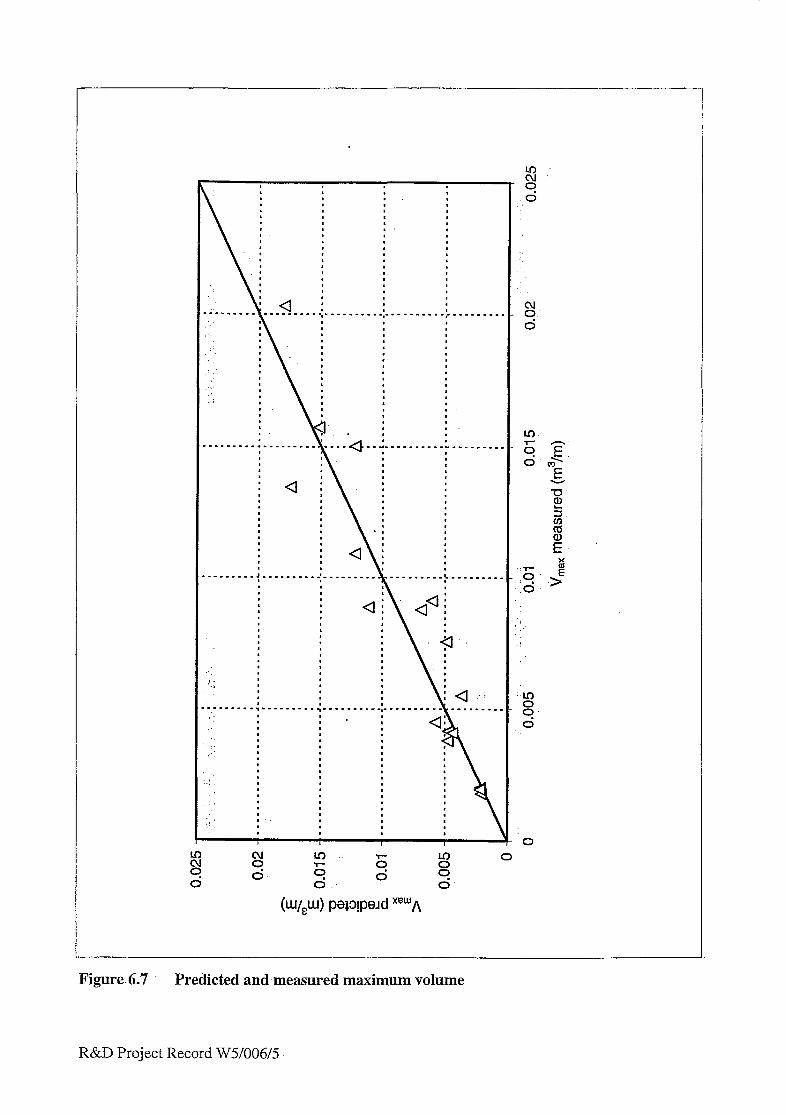
:
a
. . . . . . . . . . . . . . . . . . . . . . . . . . . . . . . . . . . . . ..t. ai aa!
’ \I +
. ,
. . . . . . .
: .1 . \’ :< # -
. . . . . . . . . . . . . . . . . . ~ . . . . . . . . . . . . . . . . . . . . . . . I
,. - 8.. d
.i
.’
‘0” 9 0
Figure. 6.7 Predicted and measured maximum volume
R&D Project Record W5/006/5

100
IO
1
0.1
0.01
I ,
m m . . . . . . . . . .
.A’
,?/ .’
A. A, HRData . . . .:,:‘,.. .,,. 0. /- .,*-..L.............,.-..................,-----..-... I - Predicted Hs = d.7m
r
l -.- - Predicted Hs = 1.5m ” q Franc0 et &s’data (Hs = 3m to 5m) - Franc0 et al’s fit
i i .-. ,.
; I o.oo~oj. :.’ ;. “’ omo.ol~ .; :’ .‘.. .. :
: ._ ,: . o,ooi : “’ ,b.o.l ,‘.‘. ‘. ” o.l
: : Q (m3/s/ni)
I

l
.
.
.
. .
. l
.
l
. . . . . . . . . . - . . . . . . . . . - . . . . . . . . . . . . . . . l . . . . . . . . - - . . a
.
.
:
I
.
I
.
I
. - . . . . . . - . . . ; . e e . .
I :
a
..* . . . . . . . . .
Qk .
\
I . :a
. . . .
& a
. . . _ . . . . _ . . . . _ . . _ . .
. .
.
.
. . . . --... z 8 d
Figure 6.9 : Relationship between mean discharge and peak-event (impacting waves)
R&D Project Record W5/006/5 :
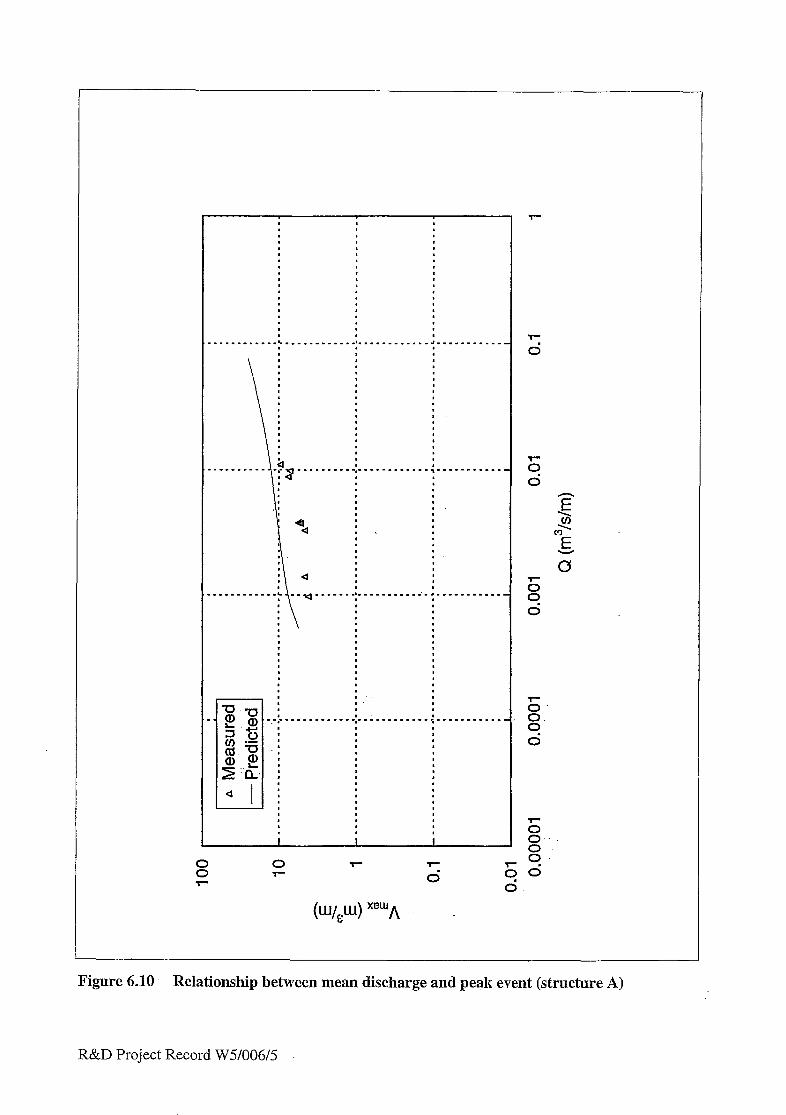
I
, , .
. - - . . - - - . . - .C. . . . . - . . . . . . I . . . . . . . . . . . . , . . . . . . - . . . . .
:
1’
. a . .
Ggure 6.10. Relationship between mean discharge and peak event (structure A)
R&D Project Record W5/006/5
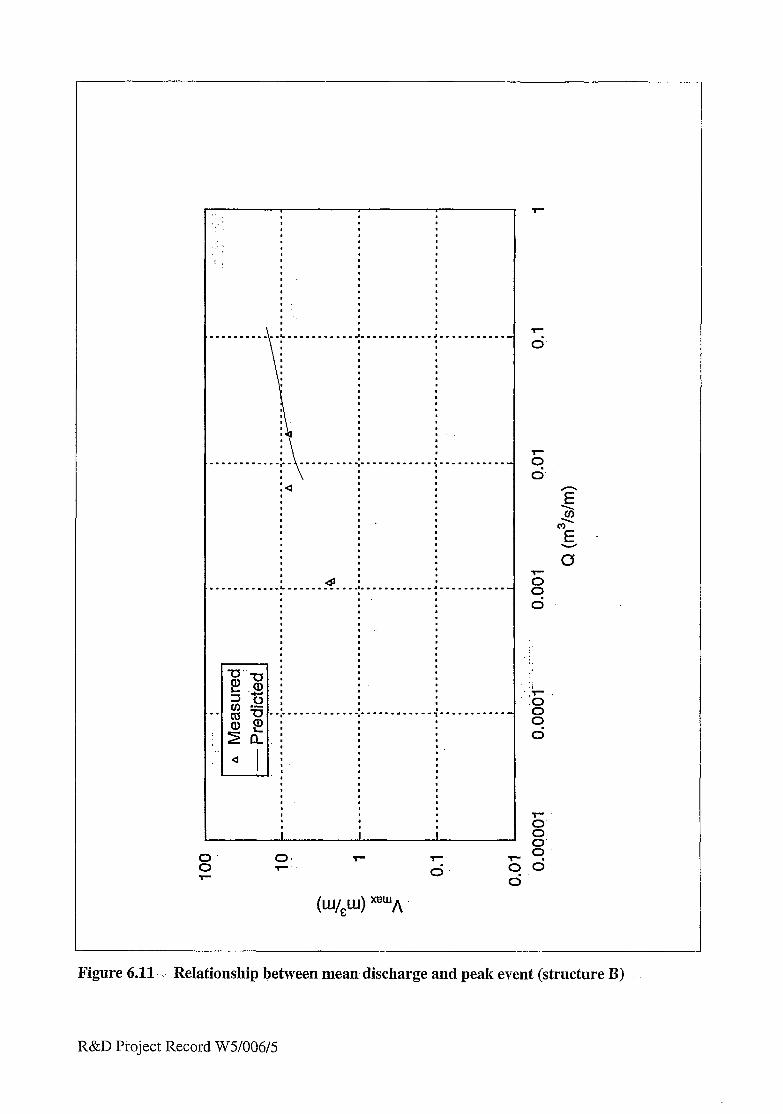
. l
.
.
,
:
.
.
- - * : . -
.
,
.
* . - . - . - . e
Ggure 6.11’ . . Relationship between mean discharge and peak event (structure B)
R&D Project Record W5/006/5

4
4 *
4
44
n
n
n
a-.
3.
4
a
a
a.
T- d ‘E;
d
4
a
3 a
Figure 7.1 Effect of crest width on overtopping, Lowe (1991)
R&D Project Record W5/006/5-
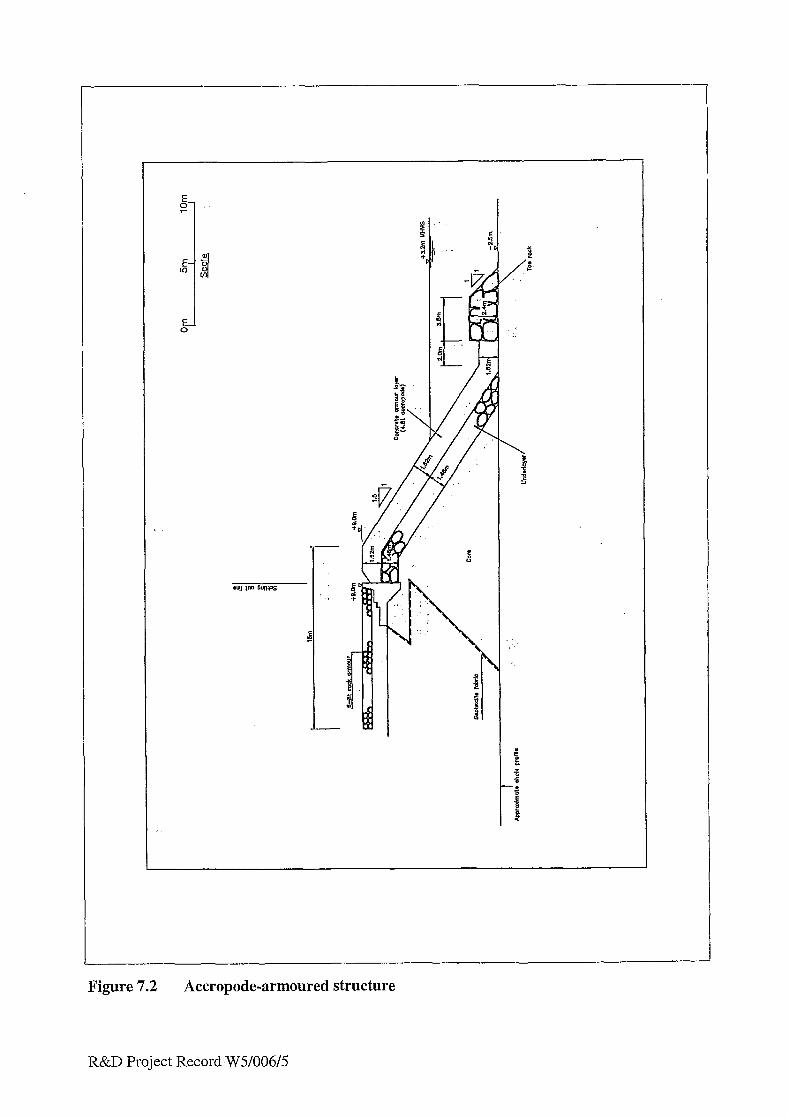
Figure 7.2 Accropode-armoured structure
R&D Project Record W5/006/5
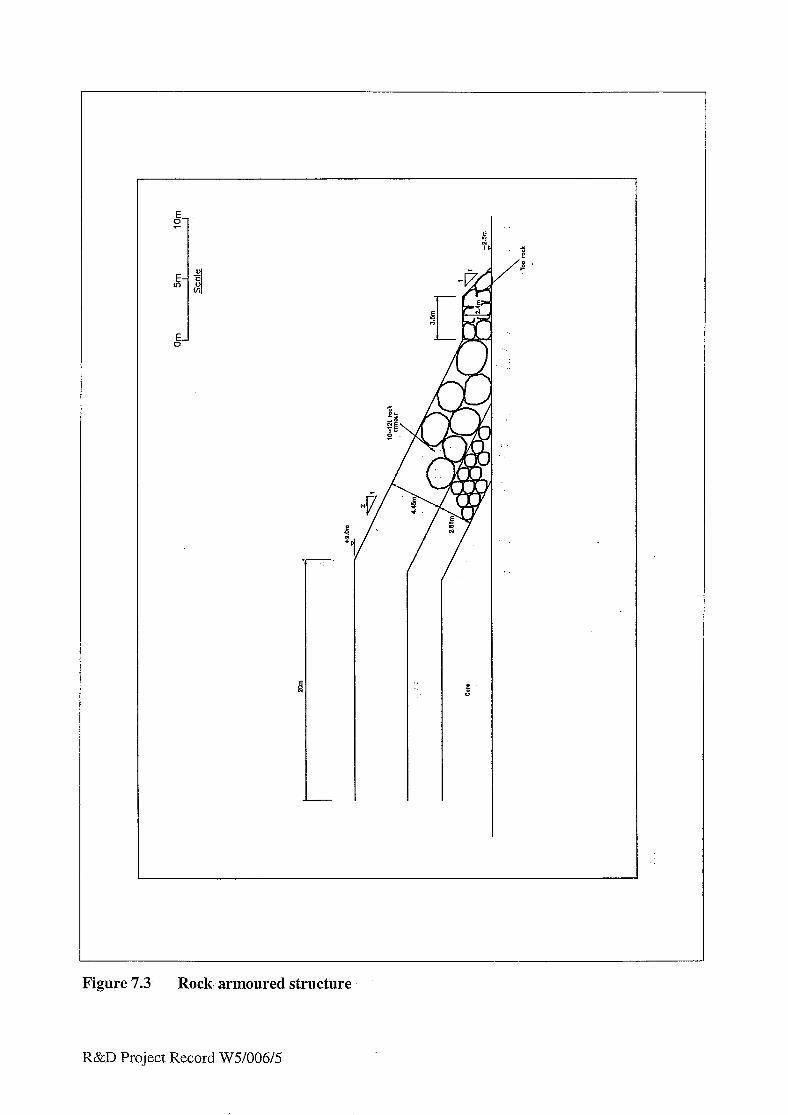
Figure 7.3. Rock. armoured structure
R&D Project Record W5/006/5

;‘4
I
4 ’
Figure 7.4 Overtopping..without crest berm (Aixropode.armoured structure)
R&D Project Record W5/006/5
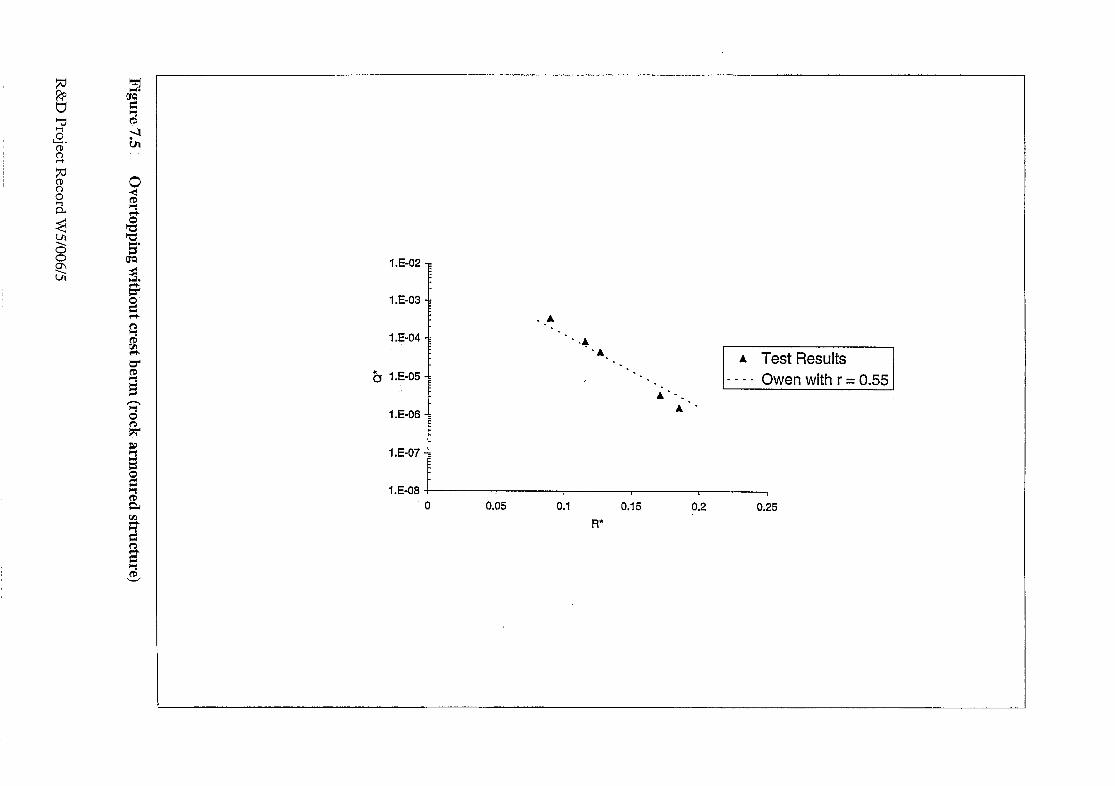
i.E-02
7
l.E-03 I
I.
l.E-04 i
-. -4
‘A * . A Test Results
* . -. . - _ _ . . Owen with r = 0.55
A * . -. A -
i.E-08 1 I 0 0.05 0.1 0.15 0.2 0.25
Fl*

cl l
d
Figure 7.6 Effect of crest width on overtopping (Adcropode- armoured structure)
R&D Project Record W5/006/5
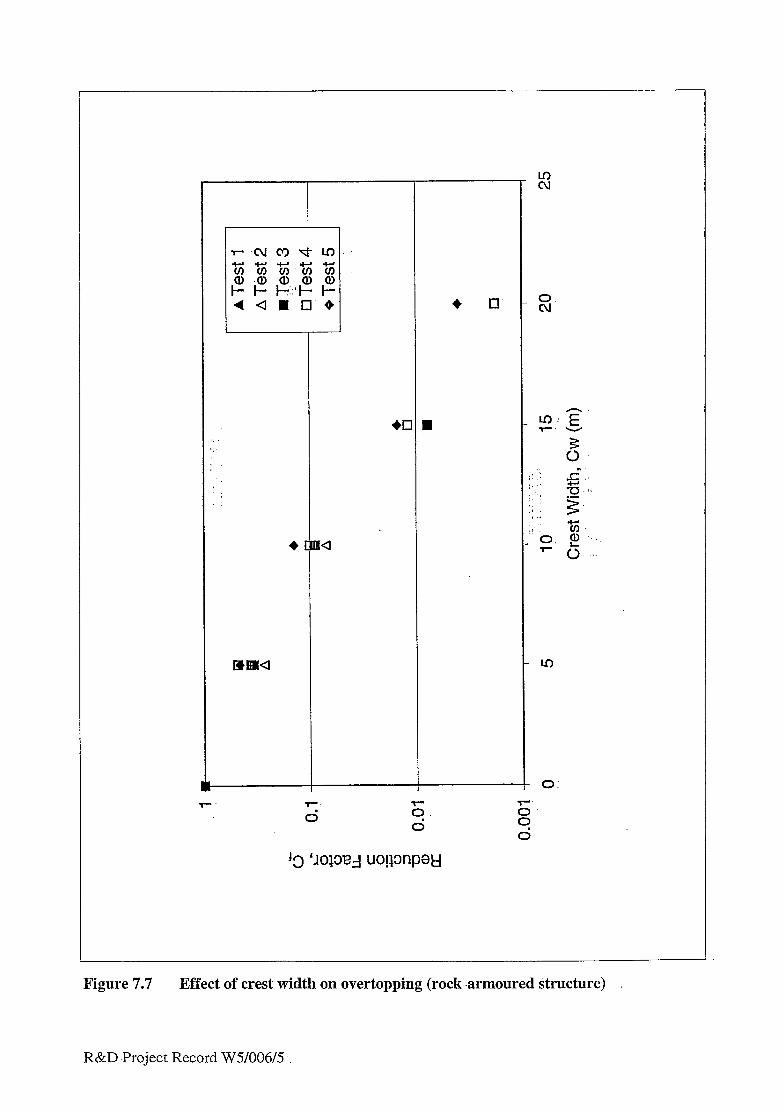
T- . . d z d
0:
8: d
Figure 7.7 Effect of crest width on overtopping.(rock -armoured structure)
R&D Project Record W5/006/5

0.001 ‘4’ ‘, ,’ :“: _’ ‘, ,..’ -* : . ,. 3’ ,j. I-, l.4 .:,:’ ,‘. 5 ,,:
0 .“” 6 ‘\
Cw/H, :a

,000
100
10
1
Figure 8.1 .’ Tolerable.mean discharges
R&D Project Record W5/006/5

Tables
R&D Project Record W5/006/5
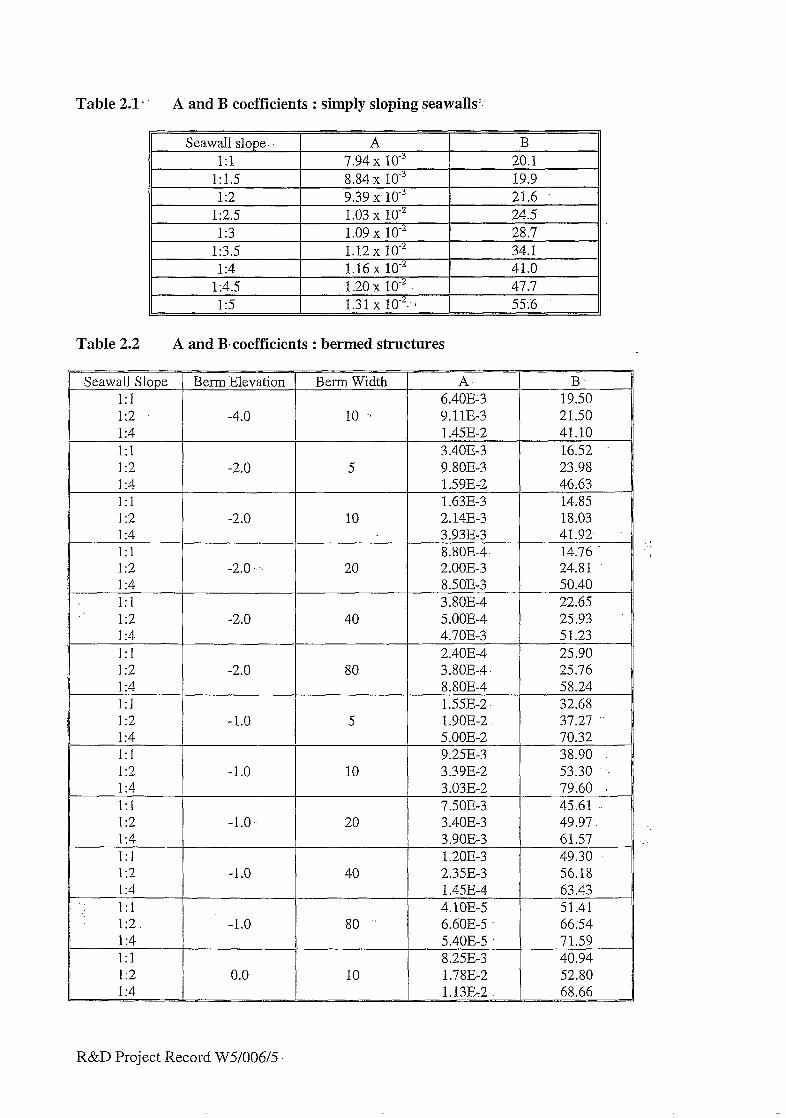
Table 2.1.. A and B coefficients : simply sloping seawalls:-
Seawall slope 1:l
A B 7.94 x 10‘” 20.1 I
1:1.5 8.84 x lo-’ 19.9 1:2 9.39 x-.lo-3 21.6
1.0 r , n9 __ 3 n-2 24.5 i:3 1.09 x lo-’ 28.7
1:x5 1.12x 1P 34.1
II 1 x.3 I 1.u.J ;c IV
II 1:4 1.16 x lo-’ 41.0 lr4.S I 1.20x 10.' 47.7 I
II I _-- _ ̂- -
1:s 1.3 1 x 1 u2- .
Table 2.2 A and B-coefficients : bermed structures
!
55%
Seawall Slope Berm Elevation 1:l I:2 -4.0 1:4 I:1 I :2 I:4 1:I
j--j-& I:1
1:2 -2.0 114 I:1 I :2 -2.0 I:4 I:1 1:2 I -1.0 1:4 I:1 I:2 -1.0 1:4
TJJ---T
I:1
TG&-+-+ 111 1:2 0.0 1:4
Berm Width ( A
I 6.40E~3 10 ‘3 9.11E-3
1.59E-2 1.63E-3
10 2.14E-3 3.93E-3 8.8OE-4
20 2.00E-3 8SOE-3 3.80Ei4
40 5.OOE-4 4.70E-3 2.40E-4
80 3.80E-4 8.80E-4 1.55E-2
I 3.39E-2 3.03E-2 7.50E-3
20 3.40E-3 I
1 3.9OE-3 1.20E-3 2.35E-3 1.45E-4
I l.l3E:2.
B 19.50 21.50 41.10 16.52 23.98 46.63 14.85 18.03 41.92, 14.76 - 24.81 50.40 22.65 25.93 51.23 25.90 25.76 58.24 32.68 37.27 70.32 38.90 53.30 ‘.. 79.60 .
45.61 49.97 61.57 49.30 56.18 63.43 51.41 66;54 71.59 40.94 52.80 68.66
R&D Project Record W5/006/5

Table 2.3 Roughness coefficients
Type of seawall Smooth concrete or asphalt
Smooth concrete blocks with little or no vertical drainage
Stone blocks, pitched or mortared Stepped
Turf One layer of rock armour on
impermeable base One layer of rock armour on
permeable base Two layers of.rock armour
Rouohness coefficient. r 1.0
1.0
0.95. 0.95
0.9-l .o
R&D Project Record W5/006/5

Table 4.1 Wave overtopping studies at HR Wallingford and other European Laboratorie3
Wave overtopping studies at HR Wallingford and other European Laboratories
Structure Title f-----:---___.~ Date .. Additwidetails----‘--- ‘L-------- .-___I-
t Smooth sloping 101 Wave overtopping EX 924 Sept 1979: Plain, bermed
- +-----
. ---
102.. 1 Mar 1985 Crown wall, with wind duct/hood ~--_ -.
103 ---+----.--.-----
Feb 1990 ‘Steps, recurve walls, berms !
-104. ___- April 1992
- -+pp Recurve wall, crest berm
I 105 I July 1996 recurve wall v
1 106 Breakwater crown walls SRT Mar 1988 Plain, wave return walls
107 Recurve wave return walls SRI Feb 1991 .&.st berm, recurve walls 108 3-d wave attack SR 396 !
I Nov 1994 Berm, recu(ve !
109: Aug 1994 Plain
! Rock7 201 Mar 1985 ‘Crown wall, with wind duct/hood --
f 202
__-__L _ _ June 1985 Plain
I
203 April 1987 Plain : I --
204 I Jan 1988 crown wall, crest berm _ I
205 ._--__
206
208 Rock armour detached mound protecting sea wall
209. June 1991 Crest berm
210 --
Concave comer 1
211 I act 1991 Berm and wave return wall
212. -___
act 1991 Crest berm - f
213 I June 1992 Plain t
214 1 Sept 1993 Vertically composite -
215 I Nov 1993 Composite slope -
216 ! t Sept 1995 Vertically composite i t
217 .-
Jan 1996 Crown wall I -
218 .. ! act 1995 Recurve wall
219 Breakwater crown walls SR 146 1 Mar 1988 Plain, wave return & recutve walls
FE0 July 1993 Various structure ! ---_._
221 July 1993 Various structures I
.--- 1 July 1993 Various structures I
R&D Project Record W5/006/5

Table 4.1 (continued)
Structure
Concrete units. 301
302
--~--- 303 ---.
304
305 .--__
306
307
bate Additional design details --- _------ _--_. ,
fetrapods / Antifers, crest berm, - _____ -
t----““““. Aug 1985 Antifers ..__-_-- I
Mar 1989 Seabees . I ----.-- -
Dee 1989 Cubes
-------_ Accropode / rock armour
I ! Dee 1991 T-blocks _- -
Dec.1991 Wavewalker I Efficient armour units _------
308
309
310
July 1992 Dolos
- ..___- ____-- Ott 1992 New revetment block
bet 1993 Accropods, various structures and crown walls -
k
t 311 I June 1994 Antifers -.I___- ___- 312
313
314
315 -
316 --
bet 1994 SmDs, ! i -___ Jan 1996 Accropodes, Dolosse, crown wall I ! April 1996 Antifer y-
Feb 1993 Cobs / Sheds _
Antifers
--.._
-.
-- -________- 317 July 1993 Conctrete --- f
318 July 1993 (Antifers !
-- 319 I July 1993 Cubes, Doles,-Blocks, Cobs ~-.-
320 -! July 1993 ietrapodes -~~
Vertical walls.
321
322
401. I
402’
t July 1993 Antifers I I July 1993 Antifers
I ____----- -f- July 1990 Stepped / colonnade
I bet 1990 __________-_-_---.-
403
404
405
May 1991 Vertical, berm and recurve 1 ! July 1996 stepped at base -
Feb 1993 Vertical wall ---.._-_
406 /------- Sept 1994 Vertical wall with and without wave screens 4
407
408
____--__ ___ Beach 501
Nov 1994 3-d wave attack
Vertcal walls behind submerged rubble berms
Sept 1994 promenade 0.5m crown wall
R&D Project Record W5/006/5

Table 4.2 Type and scale of. overtopping measurements undertaken during previous studies
Type and scale of overtopping measurements undertaken during previous studies
R&D Project Record W5/006/5

Table 4.2 (continued)
R&D Project Record W5/006/5
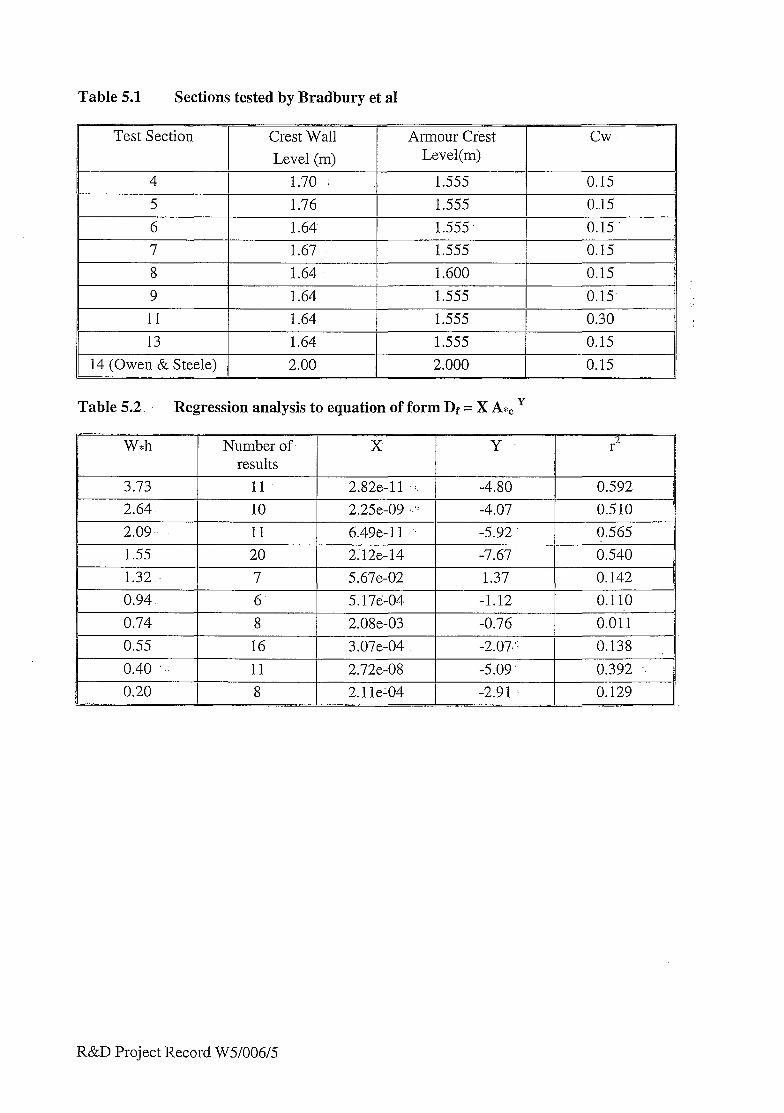
Table 5.1 Sections tested by Bradbury et al
Test Section
4
5
6
7
8
Crest Wall Level (m)
1.70 :.
1.76
1.64.
1.67
1.64.
Armour Crest Level(m)
1.555
1.555
1.555
1.555
1.600
cw
0.15
0..15
0.15
0.15 j
I 0.15
1.555 0.15
11 1.64 I 1.555 0.30
1.555 14 (Owen & Steele)
Table 5.2 Regression analysis to equation of form Df = X A*, ’
R&D Project Record W5/006/5
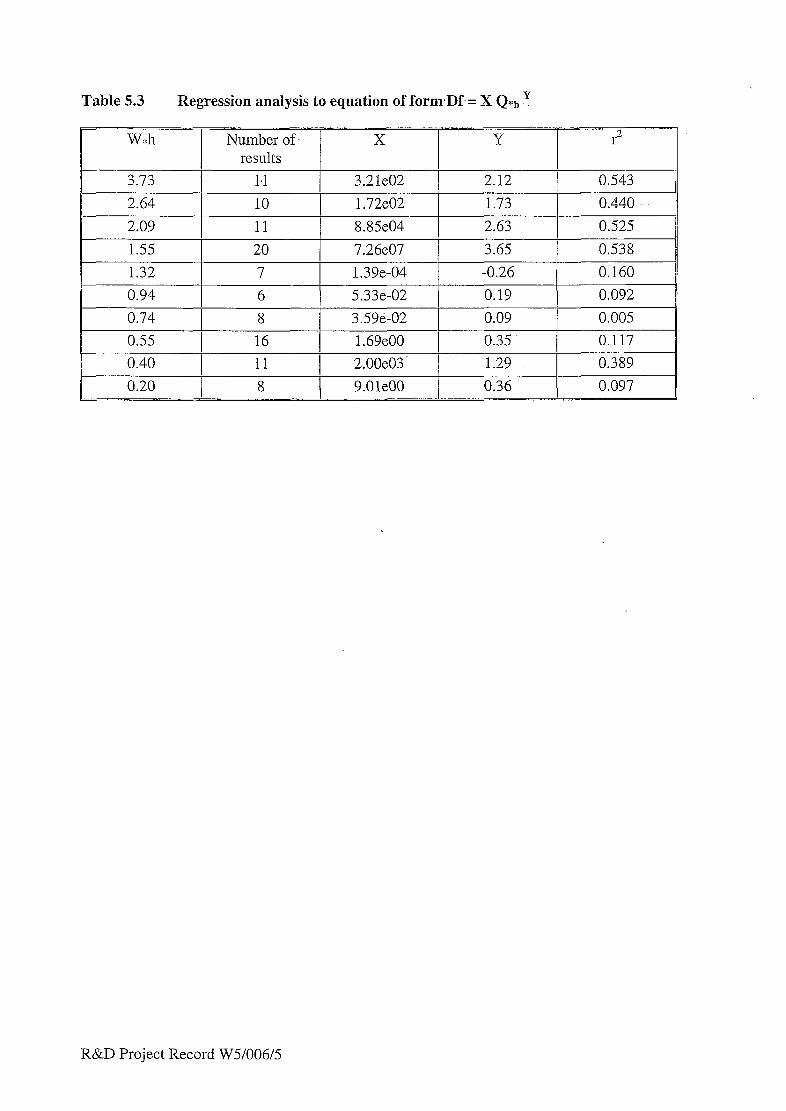
Table 5.3 Regression analysis to equation of form,Df.= X Q-b y
16 I 1.69eOO I
I 2.00e03' 1
I 9.01eOO (
R&D Project Record W5/006/5

Table .7.1 Herbert & Reeves (1991) overtopping results
Table 7.2 Lowe (1991) overtopping results
Test code SWL (rock size) (mCD:
Test 1
(2St)
Test 2
(2St)
Test 3
(W
‘Test 3
c-w
4 3.2 1
4 3.6 8
3.25
4
-
3.2
20 0.012 1 0.00015 ’ 0 ‘. 53.1 I 1.00
3.2 1 5. 4.6 1 0.087
5.7 6.3 3.5.. I 0.066 8 0.99 0.019 f 11 0.41 0.0077 I
- ) 20 1 0.044 1 0.00083 ]
5_-
6
T mo 1 Cw 1 Qw 1 Cf :.j.: (s) (m) (I/s/m)
0 30 1.00 5 10 ‘. 0.33 i
5.7 6.3 9.4..- 0.31
8 2.9 0.10 11 0.71 0.024 20 0.14 0.0047 !
5.g8 tg3q-q 8 17 0.34 1
11 8.2. 0.16 ], ,. 20 2.4 0.048 0 82 1.00
6’;
lm4 0.017 ;
.6.08 1.2. 0.015 i 8 0.64:. 0.0078 ’
11 0.22. 0.0027
R&D Project Record W5/006/5
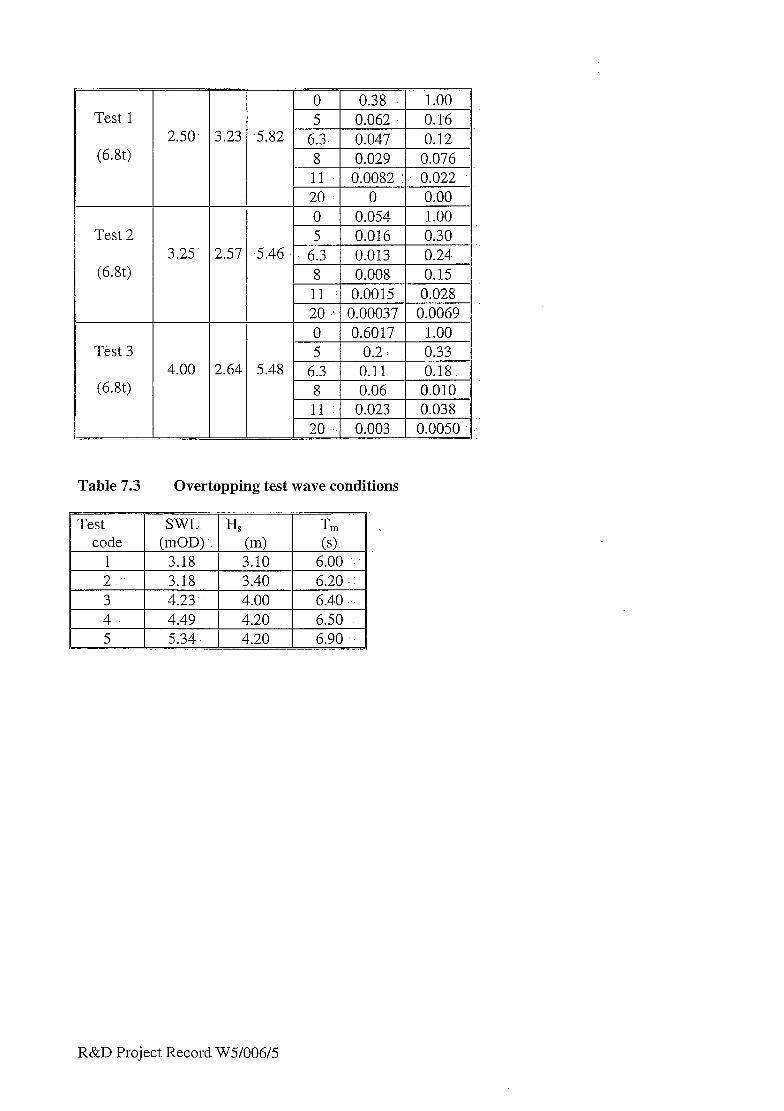
Test 1
(6.8t)
Test 2
(6.8t)
T&t 3
(6.8t)
Table 7.3
2.50.
3.25.
4.00.
2.57
2.64
Overtopping test wave conditions
K T,, Cm> (s). 3.10 6.3) -: 3.40 6.20 : 4.00 6.40 .’ ! 4.20 6.50 1 4.20 6.90 1. 1
R&D Project Record W5/006/5
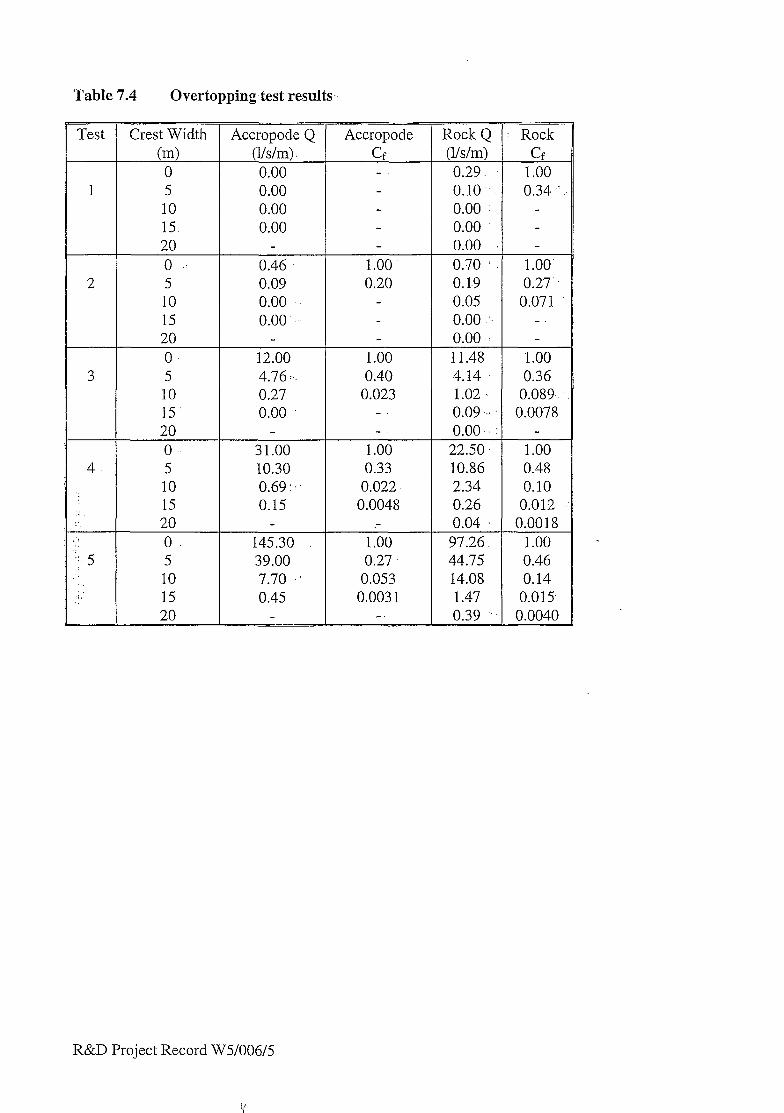
Table 7.4 Overtopping test results
Test Crest Width Cm> 0 5 10 15 20
3 5 10 15 20 O-
4 5 10 :. 15 .:
:. 20 .! I. 0. f j 5 5
10 15
Accropode Q (l/s/m). 0.00 0.00 0.00 0.00
0.46 0.09 0.00 0.00 ”
12.00 4.76 :.. 0.27 0.00
31.00 10.30 0.69 :. 0.15
145.30 39.00 7.70 .‘I 0.45
Accropode Cf
1.00 0.20
1.00 0.40
0.023 -
1 .oo 0.33
0.022 0.0048
1.00 0.27
0.053 0.003 1
-.
Rock Q : Rock (l/s/m) Cf 0.29 1 .oo 0.10 0.34 0.00 : - 0.00 - 0.00 - 0.70 1 .oo 0.1-g 0.27.. 0.05 0.071 0.00 .: - 0.00 : - 11.48 1.00 4.14 0.36 1.02 0.089,. 0.09 .” 0.0078 0.00 : -
22.50 1 .oo 10.86 0.48 2.34 0.10 0.26 0.012 0.04 0.0018
97.26 1 .oo 44.75 0.46
72
14.08 0.14 1.47 0.015. 0.39 0.0040
R&D Project Record W5/006/5.
:/ Y