overview - physicsanupeople.physics.anu.edu.au/~bdb112/alanthesis.doc · web view3ds: 3ds...
TRANSCRIPT
Chapter 1
IntroductionModern engineering practice is making increased use of
computers throughout the design, analysis, planning and management of engineering projects. At each stage the use of appropriate visualisation techniques can significantly increase the effectiveness of the computational tools employed. The purpose of this thesis is to study the application of an advanced visualisation technique, known as virtual reality (VR), to an engineering design project: the visualisation of CAD data of the H-1NF Heliac at the Plasma Research Laboratory, ANU.
Virtual reality combines the use of stereoscopic, three dimensional computer graphics with interactivity to allow the viewer to explore and experience multi-dimensional datasets in a way that is not possible with traditional monitor screens and paper. The practical use of virtual reality has, however, been restricted by prohibitively high costs. The goal of the WEDGE project is to develop a low-cost virtual reality visualisation system that sacrifices some of the interactivity and computational power of existing high-end systems, but which is adequate for many applications in science and industry. The WEDGE prototype, having only been opened in April this year, is the first of its kind in the world and requires further development which is the motivation for this project. The development of the WEDGE does not require the development of any significantly new technologies but mainly involves developing new software applications on a case by case basis. It is hoped that this case study approach will lead to an iterative improvement in both the hardware and software infrastructure of the WEDGE.
This thesis deals with implementation of a visualisation system for the Computer Aided Design (CAD) data of a fusion
reactor structure called the H-1NF Heliac. The motivation for this is to help plasma research scientists better understand the engineering design of H-1NF and to eventually be able to design new diagnostic equipment and site it within the crowded H-1NF environment. The aim of the visualisation interface is to interactively position the viewers in the virtual model and navigate through it. From a user-oriented point of view, the program requirements are; first and foremost, to enable the CAD data from the technical drawings library comprising the H-1NF Heliac to be visualised in the WEDGE’s virtual environment and allow multiple files to be viewed simultaneously as subsystems, combinations, or the “complete” drawing; second, the user needs to have the images rendered stereoscopically on the special WEDGE hardware; thirdly, it is important to ensure that the model is viewed at sufficiently high frame rates to facilitate interactivity; fourthly, it is necessary to provide a user interface that allows the models to be manipulated and viewed in a manner suitable for scientific research. It is important to allow the model to be modified. If necessary in order to reduce its complexity or correct errors in model geometry, and to be written back to disk after possible modification.
Engineering computing environments are typically distributed over several hardware platforms running a variety of software tools. Many of these software tools have proprietary data structures to represent their engineering data in order to give them a competitive commercial advantage as well as to optimise their data storage and manipulation for the particular application. Proprietary data structures, unfortunately, complicate data sharing by making it difficult to save model data from one software tool to another. As part of this project a means of moving the model data from the proprietary data structures of AutoCAD to the WEDGE with minimal loss of information was also investigated.
1.1 Outline of this thesisChapter 2 of this thesis gives the background to the WEDGE,
an overview of the current virtual reality technology, and what the WEDGE is designed for. A brief description of the actual hardware configuration is also given.
In Chapter 3, some observations on rendering CAD data in the WEDGE are given. This includes an overview of the graphics “rendering” process which converts a geometric model into an image displayed on the screen. Followed by an explanation of the
file formats used by typical CAD and computer graphics software applications, and the relevant issues and decisions made in choosing the “Wavefront Object” file format for this project. It finally discusses an overall process which can be used to render CAD data in the WEDGE.
The design of the computer graphics program “wedge.exe”, which is the main product of this thesis, is discussed in broad terms in Chapter 4 along with the relevant high level design issues that were faced. The actual implementation of “wedge.exe” on the WEDGE hardware is described in Chapter 5, dealing with lower level intricacies. The hardware and software platform, as well as the limitations, reliability, robustness, portability and maintainability are discussed here.
Results and testing are given in Chapter 6, which explains the conditions of testing and the actual result obtained. The conclusions and possibilities for future work are given in Chapter 7.

Chapter 2
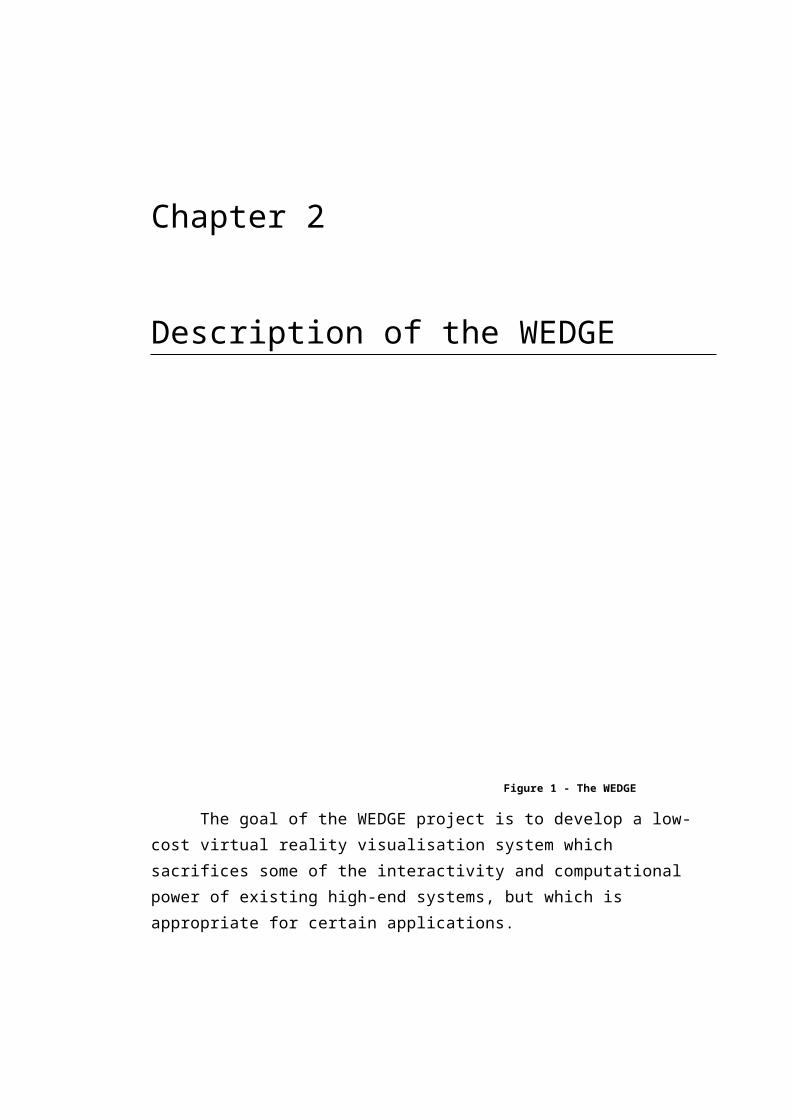
Description of the WEDGE
The goal of the WEDGE project is to develop a low-cost virtual reality visualisation system which sacrifices some of the interactivity and computational power of existing high-end systems, but which is appropriate for certain applications.
For reference, some types of existing virtual reality environments commercially available are:HMD: Head Mounted Displays (HMD) are basically large
goggles which are strapped to the head. They are the
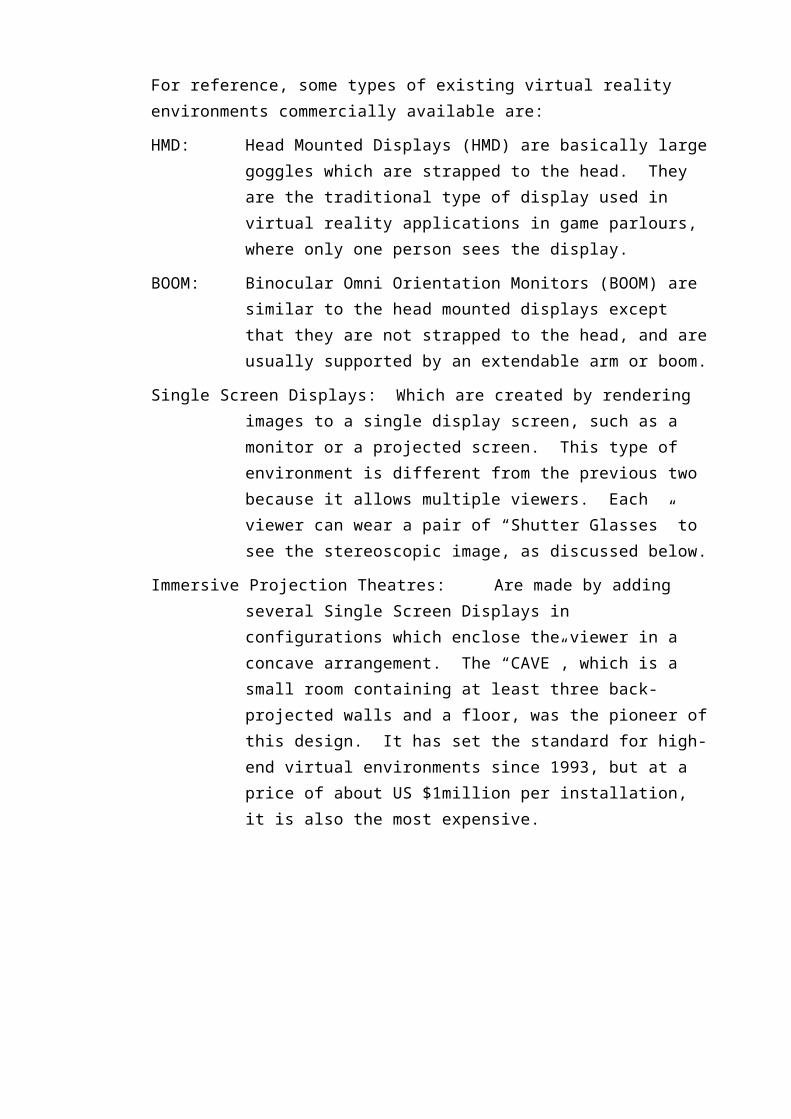
Figure 1 - The WEDGE
traditional type of display used in virtual reality applications in game parlours, where only one person sees the display.
BOOM: Binocular Omni Orientation Monitors (BOOM) are similar to the head mounted displays except that they are not strapped to the head, and are usually supported by an extendable arm or boom.
Single Screen Displays: Which are created by rendering images to a single display screen, such as a monitor or a projected screen. This type of environment is different from the previous two because it allows multiple viewers. Each viewer can wear a pair of “Shutter Glasses” to see the stereoscopic image, as discussed below.
Immersive Projection Theatres: Are made by adding several Single Screen Displays in configurations which enclose the viewer in a concave arrangement. The “CAVE”, which is a small room containing at least three back-projected walls and a floor, was the pioneer of this design. It has set the standard for high-end virtual environments since 1993, but at a price of about US $1million per installation, it is also the most expensive.
The Immersive Projection Theatre environment was adopted in the WEDGE’s design because of its intended use as a research tool, which is generally a collaborative process requiring several people analysing data at once. It is similar in spirit to the CAVE, the main difference being that the WEDGE only has two screens and the viewers are oriented towards the vertex between the two
screens.
It is the first Immersive Projection Theatre in the world to have been driven by PC’s. Overall the WEDGE costs less than a tenth of the price of a CAVE and it is hoped that this will lead to a significant penetration of this technology in Australia. The slower computational speed of the WEDGE means that it will not be able to display “complex”1 images as fast as a CAVE, but for simple images will be able to perform just as well.1 ‘Complexity’ meaning, the number of polygons comprising the model.
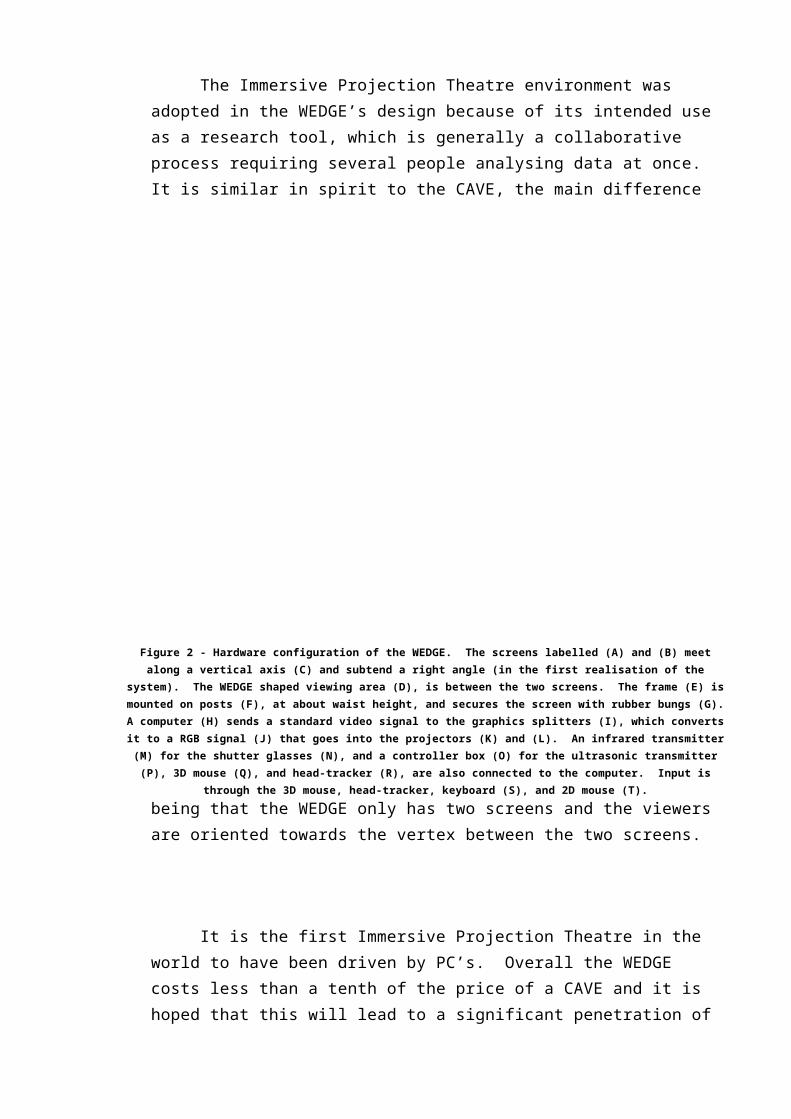
Figure 2 - Hardware configuration of the WEDGE. The screens labelled (A) and (B) meet along a vertical axis (C) and subtend a right angle (in the first realisation of the system). The WEDGE
shaped viewing area (D), is between the two screens. The frame (E) is mounted on posts (F), at about waist height, and secures the screen with rubber bungs (G). A computer (H) sends a
standard video signal to the graphics splitters (I), which converts it to a RGB signal (J) that goes into the projectors (K) and (L). An infrared transmitter (M) for the shutter glasses (N), and a
controller box (O) for the ultrasonic transmitter (P), 3D mouse (Q), and head-tracker (R), are also connected to the computer. Input is through the 3D mouse, head-tracker, keyboard (S), and 2D
mouse (T).
The WEDGE does not require the development of any significant new technologies and uses commercially available components. It is specifically “designed for obsolescence” so that when better technology becomes available the most expensive parts (the computer and projectors) can be easily re-cycled. The system has the following main components:Computer: This is the workhorse of the system. The ANU WEDGE
has a dual 300MHz Intel-based processor running Windows NT, and also has specialised graphics capabilities particularly suitable for running high quality computer graphics software written in OpenGL2.
Screens: The two screens are what set the WEDGE apart from other virtual reality environments. The orientation of the viewer towards the vertex of the screens appears to give a greater sense of “immersion” in the virtual environment, then a single screen.
Projectors: There are two projectors, one for each screen, both with high resolution and refresh rate capabilities.
Shutter glasses: These are used to multiplex the left-eye and right-eye images in time. These are interlaced on every second frame projected to the screen so, for example, the right-eye shuts closed when the left-eye’s image is being displayed.
Infrared transmitters: The shutter glasses are synchronised with the projectors via an infrared signal from transmitters attached to the frame.
Graphics splitters: These convert the standard “video out” signal from the computer, into the “Red, Green, Blue” (RGB) signal needed by the projectors for each of their separate coloured lenses.
Input devices: Input to the system is currently possible through a standard keyboard and mouse, and also through a three dimensional mouse and “head-tracker”3 which are controlled by an ultra-sonic transmitter located above the WEDGE.
More details of the WEDGE can be found in Appendix D.
2The graphics cards have special hardware acceleration specifically designed for OpenGL’s drawing primitives. For details on OpenGL, refer to Appendix C.3A device used to track the position and direction of the viewer’s head, in order to calculate the correct stereoscopic image that is visible from that viewpoint.
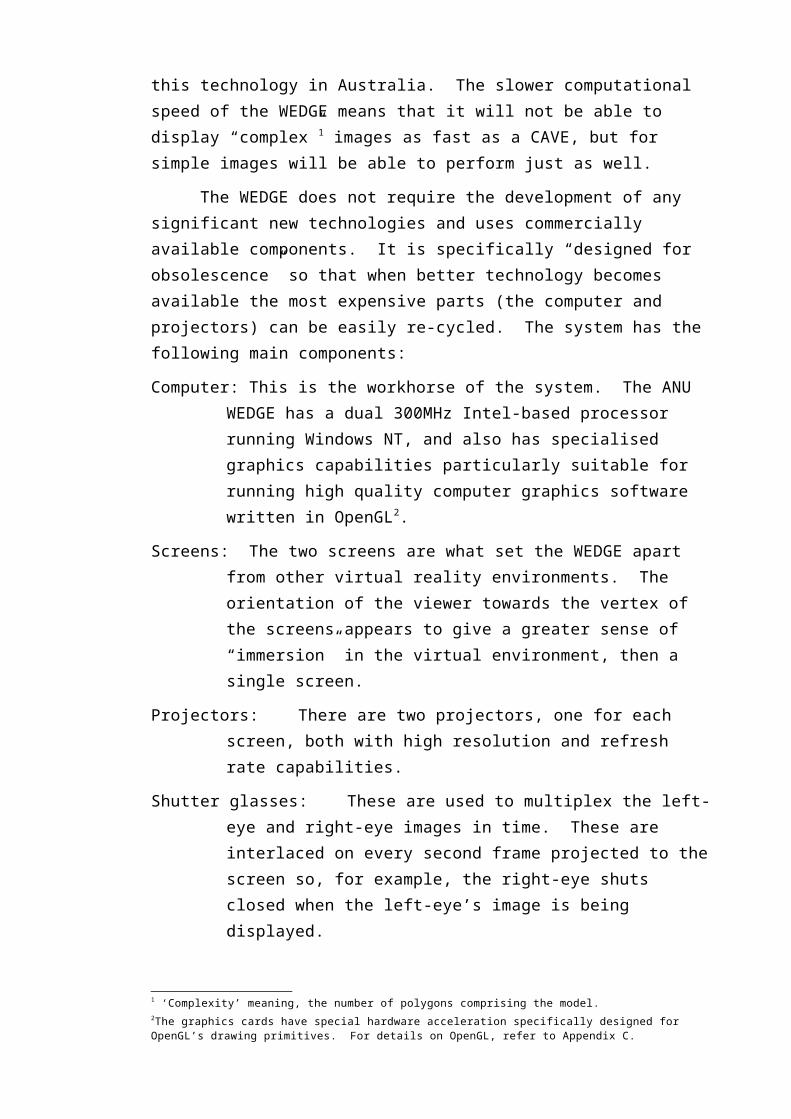
Figure 3 - The H-1NF Heliac
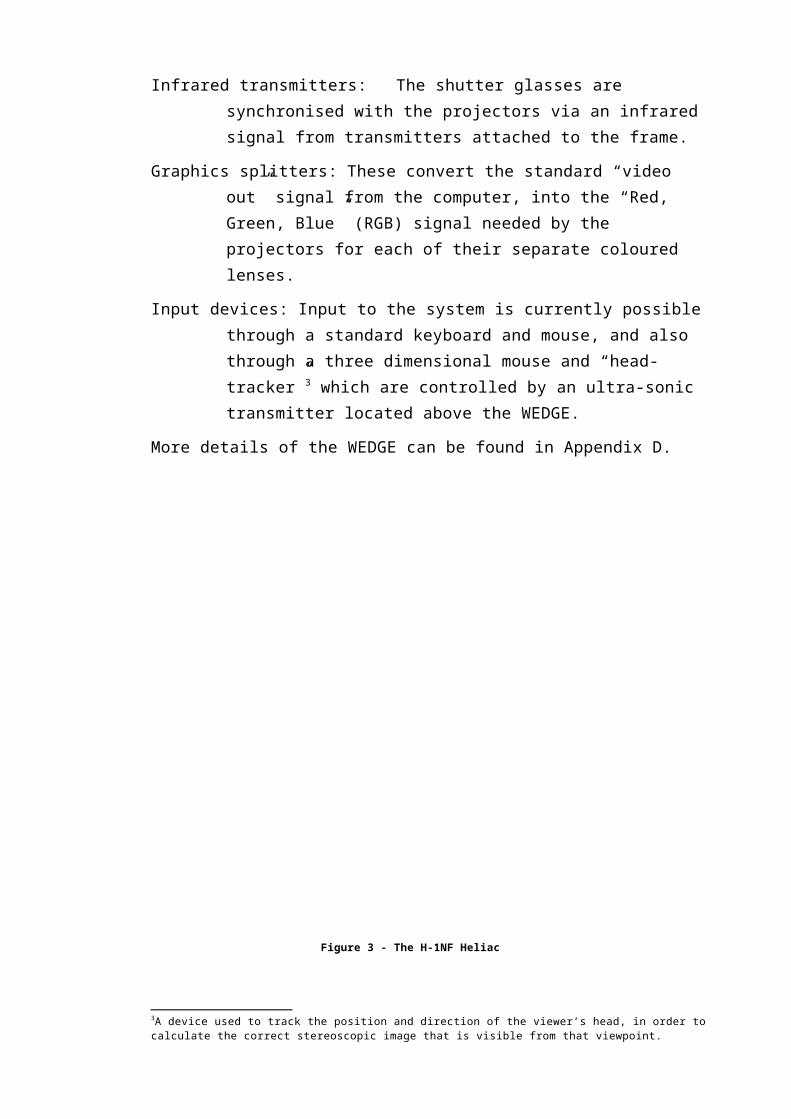
Figure 4 - Top view of the H-1NF Heliac
Chapter 3
Observations on rendering CAD data in the WEDGE
File format standards, and their underlying data structures, are continually evolving to support technological advancements. Typically, CAD software packages save their model data into proprietary file formats but allow backward compatibility with previous versions of the software and the exchange of data with other packages. They often employ file export functions to save data in suitable “exchange file formats” 4. AutoCAD’s Data eXchange Format (DXF) is an example of this.
Accessing the data in the exchange file format and then using it to render useful images may appear at first to be a trivial matter, but it is often complicated by the incompatibilities between different modelling representations (which are explained in further detail below), and the intricacies of converting data between file formats.
The first section of this chapter will briefly explain the rendering process works, and how a three dimensional model is used to create an image. The second section looks at the file formats used by Computer Graphics (CG) programs to render model data, with emphasis on the structures that are inhabited by the data. Thirdly, representative methods used by CAD systems to represent their model data are given, which are often very different from the file formats used by computer graphics systems. Lastly, the fourth section outlines a generic template which has been developed to move model data from CAD systems through an intermediate computer graphics file format to the WEDGE, where the full cycle is completed by rendering the model as a
4Refer to Appendix C.

stereoscopic image using the software developed specifically for this task.
3.1 How is geometric model data rendered?
Rendering is the process of creating images from models. The most common types of models for which computer graphics is used are: organisational and quantitative models, which are not relevant to this project; and geometric models, which are collections of spatial layout information, the “geometry”, and often also include the interconnections between the components, the “topology”. Engineering and architectural structures, and in particular, the H-1NF Heliac model, are all good examples of Geometric models.
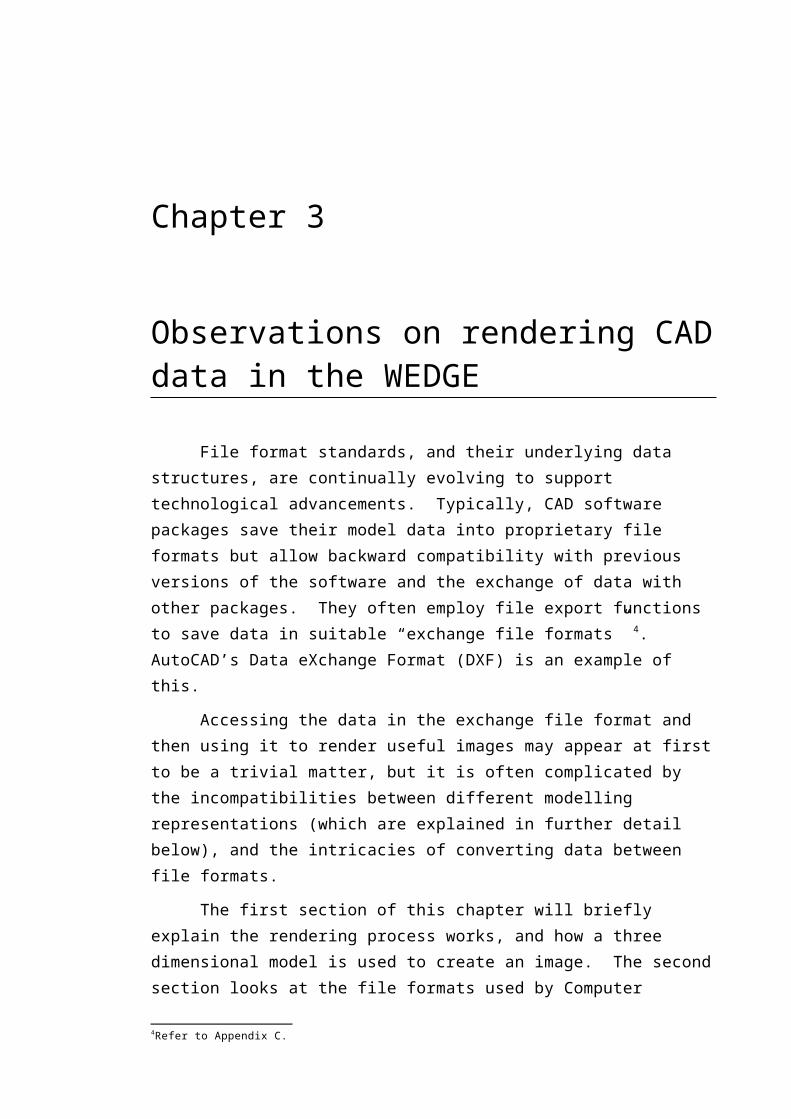
Images are created from geometric model data using software that has three components: the first is the “application program”, usually written in a high level programming language such as C++, which creates, stores into, and retrieves from the second component; the “application model”, which represents the data or objects to be pictured on the screen. The application program also handles user input. It produces images by sending to the third component, a “graphics system” such as OpenGL, commands that contain both a geometric description of ‘what’ is to be displayed, and attributes relating to ‘how’ they should appear. The graphics system is responsible for actually producing the image from the instructions given to it, as well for passing user input back up to the application program. This is shown in the diagram below:
Figure 5 - Graphics system framework
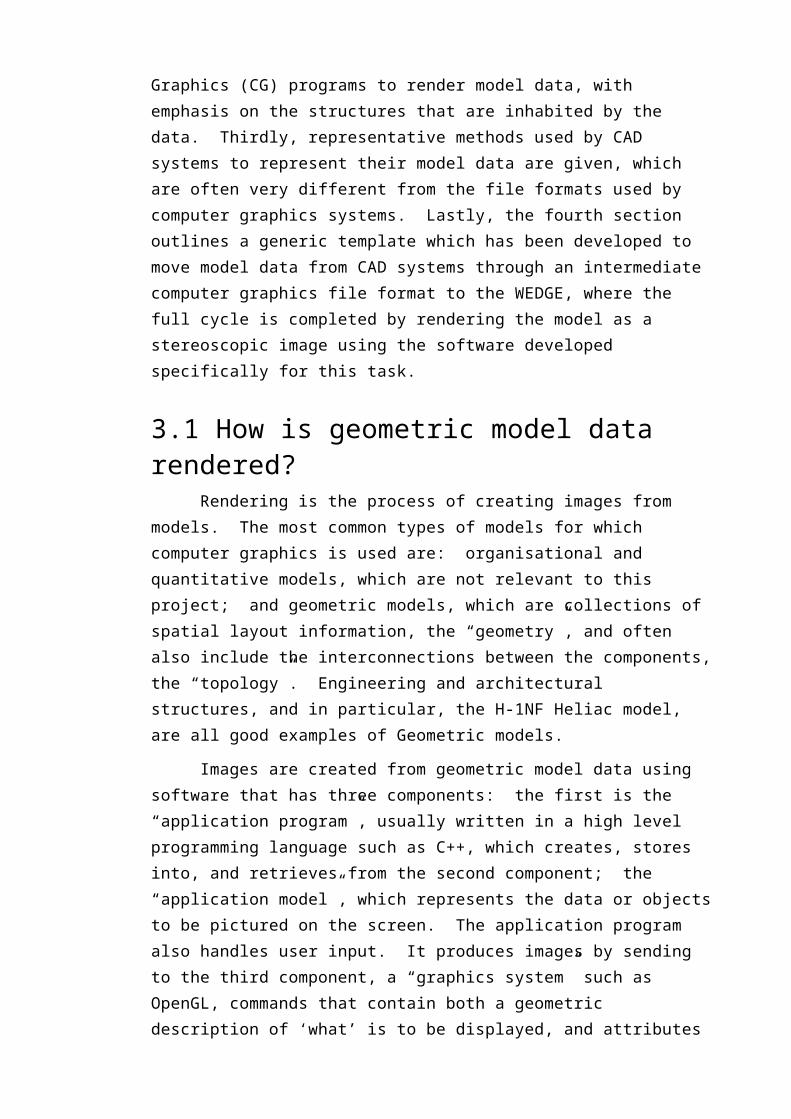
The graphics system creates an image through a conceptual, rendering pipeline, as shown in the diagram below:
The first stage consists of reading in the data from the data structures followed by applying modelling transformations (which position the model), and viewing transformations (which position the view point). These operations deal with vertex geometry in the model space and are independent of the display device. The next stage, the back end of the pipeline, takes the transformed primitives and determines pixel values in a process known as “rasterisation”. This process itself consists of three parts: visible-surface determination (determining which portions of a primitive are actually visible from the view point), scan conversion (determining the pixels covered by a primitives image), and shading (determining which colour to assign to each covered pixel).
This rendering process can be used in two different modes: wireframe rendering mode, which is the fastest but least realistic form of display whereby whereby the lines are drawn in temporal order, that is, the order in which the program encounters them in the data structures; and secondly, shaded rendering mode, which is more realistic but significantly increases the computational complexity because the spatial ordering becomes important and portions of objects that are hidden (because they are obscured by portions of “closer” objects), must not be displayed, in a process known as “hidden surface removal”.
3.2 Computer Graphics file formatsComputer Graphics file formats are generally “open”5 formats
because they need to be portable to different hardware and software platforms. Many computer graphics file formats, such as JPEG, GIF and BMP, contain “bitmap” data which are essentially two
5A format which is not encrypted and is open to public viewing, and may or may not be proprietary.
Figure 6 - The rendering pipeline
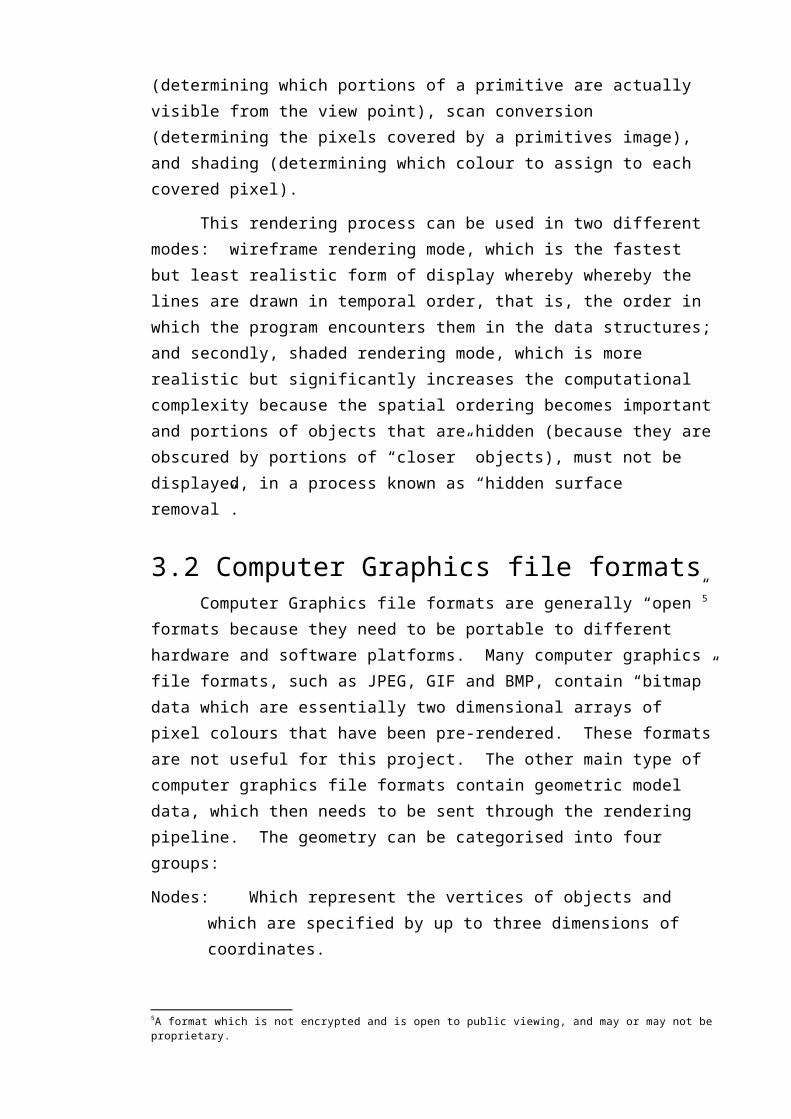
dimensional arrays of pixel colours that have been pre-rendered. These formats are not useful for this project. The other main type of computer graphics file formats contain geometric model data, which then needs to be sent through the rendering pipeline. The geometry can be categorised into four groups:Nodes: Which represent the vertices of objects and which are
specified by up to three dimensions of coordinates.Lines: Which are connections between two nodes forming a
straight line. By “connecting the dots” a wireframe model is generated. The number of nodes in a straight line is at most two.
Polygons: The next order up in the hierarchy is a polygon, which is created by several connected lines all lying on the same plane. At least three lines are needed to construct a polygon. These geometric elements can have the area contained within them shaded in, and, in three dimensions, can generate a “shell” representation of solid models as described below.
Solids:Visually, solids look similar to polygonal models except that, essentially, the polygon shell is “filled up”. There are two main ways under which solids are modelled. In the first method, the solid can be formed by firstly specifying a polygon shell representation of the model and then specifying how the edges of the polygons intersect to form joints and edges between surfaces, which are possible curved. This may include the use of “free-form” geometric entities, such as NURBS6, which allow for curved surfaces. (Notice however that a polygon model can have polygons anywhere, whereas the solid model needs to have each edge accounted for to form a “watertight” boundary of the model which can then be used for volume analysis.) This method is called Boundary Representation (B-Rep) Solid Modelling, which is typically stored in a complicated object-oriented structure7
in computer graphics file formats. Another approach is Constructive Solid Geometry (CSG), where simple primitives such as a sphere or cylinder are combined by means of “regularised boolean set operators” that are included directly in the representation.
Three representative file formats which have been investigated in depth are:3DS: 3DS (3DStudio) files are binary files developed specifically
for the software package 3DStudio MAX, which is an open file format. It recognises polygonal geometric elements but not solids. Solids exported from AutoCAD into this format have to be converted into a polygonal representation through triangulation8;
OBJ: The OBJ (Object) file format is an ASCII file developed by “Wavefront”, which recognises polygonal modelling data. It
6Non-Uniform Rational B-Splines, which are a more accurate representation of a geometric surface since a curved surface appears as a continuous, smooth surface, not as a series of facets.7See the “ACIS” file format in Appendix C.8 “Triangulaion” is a process for decomposing a surface into a mesh of triangles whose verticies are shared.
Figure 7 - Geometric components
is explained in greater detail below;POLY: Polygonal files are developed by “SideEffects” and are also in
ASCII. They are similar to the OBJ files but are slightly more powerful.
Refer to Appendix C for further details on these file formats.
3.3 CAD dataComputer Aided Design data structures reflect the
functionality of their respective software packages, which are usually designed for technical draftspeople and for engineers designing real world “solid models”. They are generally oriented towards representing complex model data, using the boundary representation technique, as opposed to computer graphics file formats which generally contain non-software-specific, geometry primitives suitable for rasterisation into pixels. Their data structures can be further complicated because the input to most CAD systems is through a two dimensional user interface (the monitor), whereas solid models require three dimensions to be fully specified.
The AutoCAD software package is one of the most widely used CAD systems. It utilises all of the above mentioned geometrical elements in its data structures, but its own proprietary DWG (DraWinG) file format, which is used to store this information, is only used internally. Its most common exchange file format is the DXF file format which, despite supposedly being an open format, encrypts its solid modelling information9 due to a licensing arrangement with the owner of the solid modelling toolkit it uses, “Spatial Technologies”. For more information see Rudolf [RUDO90].
Other exchange file formats commonly used in industry are IGES10 (Initial Graphics Exchange Standard) and more recently Step11 (Standard for the Exchange of Product Model Data). The exchange formats exported by the CAD system used by the H-1NF Heliac team are:DXF: Which is an ASCII file developed by “AutoDesk”, the creators
of AutoCAD. It recognise all the geometry elements mentioned above but is not an open format;
3DS: As discussed in the previous section. It is the one of the few file formats which overlaps between the CAD and computer
9Refer to the DXF file format in Appendix C.10See [SMIT88].11See [INTL94].
graphics classification;SAT: The SAT is an ASCII file format which is widely used in a Solid
Modelling Toolkit called “ACIS”, developed by “Spatial Technologies”. This format is an object-oriented language suitable to be parsed by a recursive programming language12. It is used by most CAD software packages to represent their solid modelling data.
See Appendix C for further details on these file formats.
3.4 Template for rendering CAD data in the WEDGE
One of the initial steps in this project was to determine how to access the H-1NF Heliac’s CAD data. This data has been created by the AutoCAD software package & includes both polygonal & solid modelling data. Ideally the H-1NF Heliac model data would be rendered using a combination of solid modelling and polygonal techniques which mirror the data, but this requires sophisticated software13 which is beyond the scope of this project. For the purpose of rendering this data in the WEDGE in its present configuration, polygonal modelling is able to be used for the entire model. This means that the solid model elements need to be “triangulated”, converting them into a triangle polygon mesh forming a shell of the model, which AutoCAD then stores in a suitable computer graphics file format.
AutoCAD’s DXF file format is not suitable for this approach because, although it does recognise polygons (as “3DFace” entities), none of the model data can be exported this way. Instead, AutoCAD exports the model as solids (“3DSolid” entities), which are encrypted. These encrypted entities can be decrypted and reveal that they are actually in the SAT file format14, which would then need to be rendered using an appropriate solid modelling technique.
Alternatively, 3rd-party converter software or an AutoCAD plug-in program could be purchased which exports the model data as polygons into a suitable computer graphics file format. Even so, there may be limitations on the entities that either the 3rd-party software, or the computer graphics file format which it is exporting to, can handle.
12See the LISP programming language in Appendix C13See Chapter 7.14Refer to SAT file format in Appendix C.

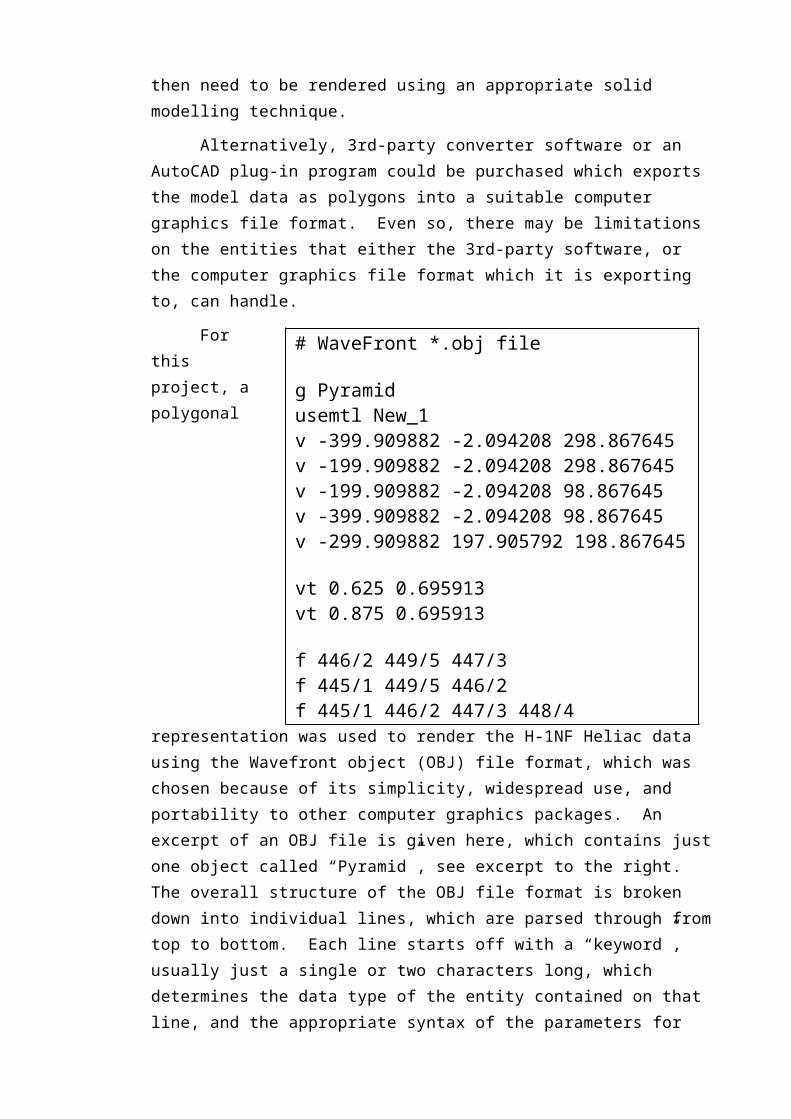
For this project, a polygonal representation was used to render the H-1NF Heliac data using the Wavefront object (OBJ) file format, which was chosen because of its simplicity, widespread use, and portability to other computer graphics packages. An excerpt of an OBJ file is given here, which contains just one object called “Pyramid”, see excerpt to the right. The overall structure of the OBJ file format is broken down into individual lines, which are parsed through from top to bottom. Each line starts off with a “keyword”, usually just a single or two characters long, which determines the data type of the entity contained on that line, and the appropriate syntax of the parameters for the entities. For example, a line starting with the letter “v” indicates that a vertex will be specified on this line and to expect three floating point numbers following. As shown in the excerpt, the only entities which are used out of the OBJ file’s full repertoire, are: the group (g), vertex (v), vertex texture (vt) flag, and face (f) entities. Each group entity precludes a selection of possibly some vertex and vertex texture entities followed by some face entities which represent an object within the file. Each new group entity makes a new object. Refer to Appendix C for further details.
The problem of converting the proprietary AutoCAD data into the necessary OBJ file format, was overcome using a 3rd-party converter program called “Cinema4D” which takes a 3DStudio (3DS) file, as exported from AutoCAD, and converts it to the OBJ format. The 3DS format was chosen because it is one of the few formats recognised by both CAD and computer graphics software.
AutoCAD’s internal DWG format uses solid modelling to represent the model data, which must be converted into a polygonal representation since the OBJ file format only recognises polygonal model data. Triangulation is the basis of the conversion
# WaveFront *.obj file
g Pyramidusemtl New_1v -399.909882 -2.094208 298.867645v -199.909882 -2.094208 298.867645v -199.909882 -2.094208 98.867645v -399.909882 -2.094208 98.867645v -299.909882 197.905792 198.867645
vt 0.625 0.695913vt 0.875 0.695913
f 446/2 449/5 447/3f 445/1 449/5 446/2f 445/1 446/2 447/3 448/4
between the two file formats. This means that curved surfaces on solids are converted into discrete facets, and a curved line is converted into a series of straight line approximations. The triangulation of solid entities in AutoCAD is not a simple process, and for complicated geometries, such as the H-1NF Heliac, the approximation is generated as best possible by the particular algorithm employed. In some situations this has introduced errors into the model, which can be fixed by using improved triangulation techniques, which are outside the scope of this thesis. A solution to correct these triangulation errors has been developed in the program “wedge.exe”, will be addressed later in Chapter 4.
Control over the mesh coarseness is possible through AutoCAD “Performance Preferences” through the Arc and circle smoothness parameter. A higher value gives a more detailed image but of coarse is more computationally expensive. Figure 8 - Mesh size control
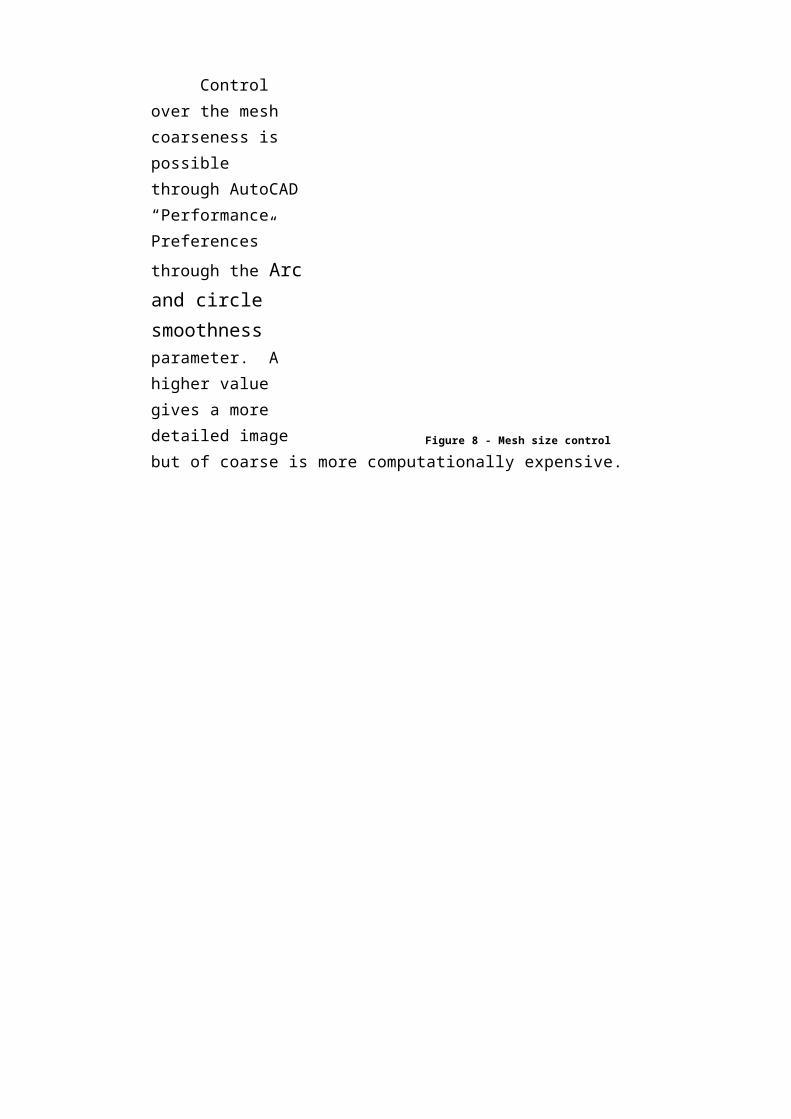
Other tuning parameters are also possible in AutoCAD’s “3DS export” function which has various controls as shown in the image below. The most important tuning parameter is the Welding selection box, which simplifies the geometry and improves rendering time by welding congruent or nearby vertices into a single vertex. The Threshold distance specifies a distance in the WCS15 coordinates of the AutoCAD drawing. If the distance between two vertices is less than or equal to this value, the vertices are welded into a single vertex. Drawings containing more than 65,535 vertices cannot be converted. If necessary, the geometry can be simplified using the Welding option. The Derive 3DStudio Objects From, and AutoCAD Blocks selection boxes specify how to group AutoCAD objects into 3D Studio objects. The Smoothing selection box enables “smooth shading”16.
15The World Coordinate System (WCS), is the main reference frame of the 3D model space in AutoCAD.16Smooth shading is used to “smooth out” the faceted appearance of polygonal model surfaces to make them resemble an averaged surface smoothness which usually corresponds to the exact shape that is trying to be modelled. It is done by calculating each vertex’s normal on each polygon by averaging the normals of adjacent polygons. If the angle between two adjacent face normals is greater than the threshold angle then the face normals are not smoothed.
Figure 9 - AutoCAD's “3DS export” dialogue box
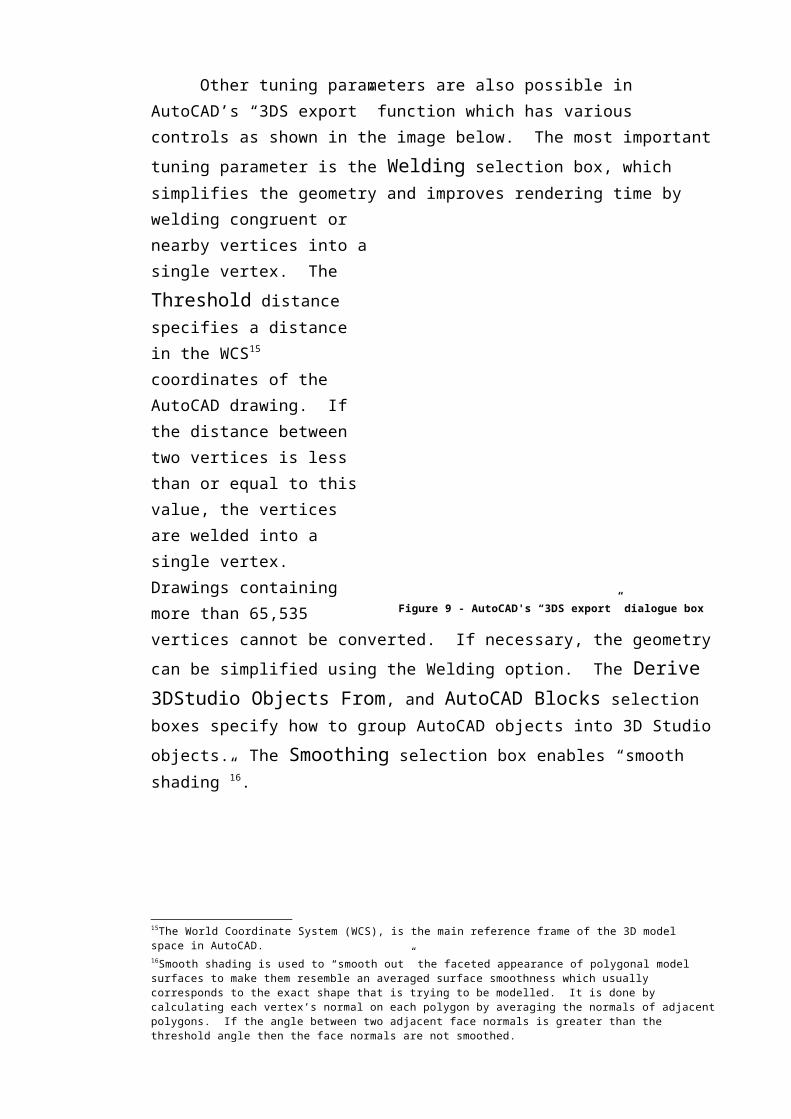
To summarise, the process for rendering CAD files on the WEDGE takes about ten minutes from beginning to end, taking marginally longer during the conversion and downloading steps for larger files, and involves the following four steps:
1. Export a 3DS file from AutoCAD. This is where the solid objects are triangulated into a discrete, triangle mesh. Control over the coarseness of triangulation is possible here.
2. Import the 3DS into Cinema4D and then export it as an OBJ file.3. Repeat steps (1) and (2) to obtain a complete “library” of OBJ
files comprising the model.4. Run my program “wedge.exe” which reads in OBJ files and
renders them in the WEDGE. This program is the main product of my thesis.
Figure 10 - Template for rendering CAD files on
the WEDGE
Chapter 4
High-level program design : wedge.exe
The aim of this project is to develop a computer graphics program to visualise CAD data from the H-1NF Heliac. The final step (4) of the procedure, as outlined in the previous chapter “template for rendering CAD data on the WEDGE”, is performed by “wedge.exe” whose design is discussed in this chapter.
From a programming point of view, that is, as seen from the application program wedge.exe, the starting point is the data in the OBJ file which is the result of the conversion process. The functionality of the overall program design can be explained through a typical sequence of events which might be to firstly load an OBJ file, which is then stored in memory in the relevant data structures; which are then used in the rendering process17 which displays the data onto the screen along with other user-interface “tools” such as menus and dialogue boxes; Thirdly, the program state might be changed through interaction with the user-interface to allow the model to be viewed in either a dot, wireframe, or solid model representation, all in either monoscopic or stereoscopic vision; Fourthly, the model might be manipulated to position the user’s viewpoint into the desired location, or to allow modification by object selection and deletion. And finally, the current model might be saved to disk in the OBJ file format, after having specified the output file name.
These steps almost exactly correspond to the five main design components of the wedge.exe program, which are: file input/output, geometry rendering, acceleration techniques, user-interface, and file modification. Each of these is discussed in a 17As described in Chapter 3.
separate section in this chapter. The overall layout of the program is shown in the diagram overpage:
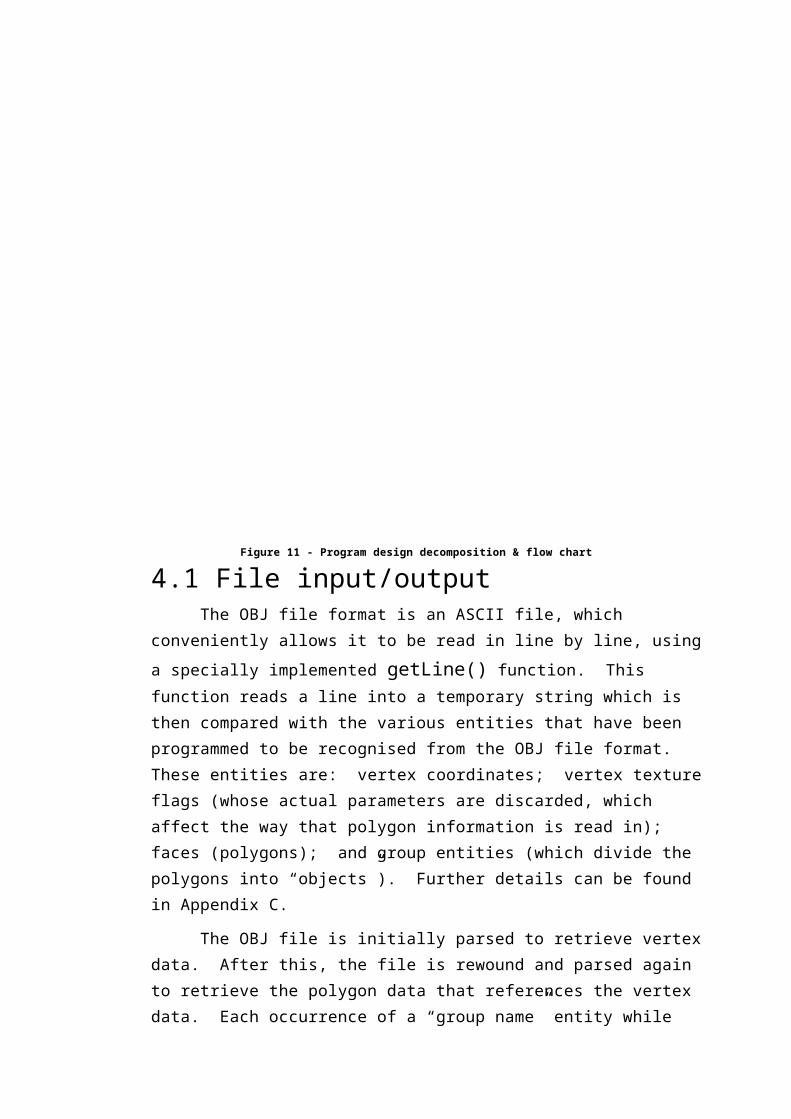
4.1 File input/outputThe OBJ file format is an ASCII file, which conveniently allows
it to be read in line by line, using a specially implemented getLine() function. This function reads a line into a temporary string which is then compared with the various entities that have been programmed to be recognised from the OBJ file format. These entities are: vertex coordinates; vertex texture flags (whose actual parameters are discarded, which affect the way that polygon information is read in); faces (polygons); and group entities (which divide the polygons into “objects”). Further details can be found in Appendix C.
The OBJ file is initially parsed to retrieve vertex data. After this, the file is rewound and parsed again to retrieve the polygon data that references the vertex data. Each occurrence of a “group name” entity while parsing for polygons, signifies that subsequent
Figure 11 - Program design decomposition & flow chart
polygons need to be stored in a new “object” structure. If a vertex texture entity is encountered between the group name & the polygons, then a flag is set which affects the way the polygon data is read in.
Linked list data structures are used initially to store the data during the file parsing process, which are then transferred to fixed length arrays once the file has been successfully read in. This is because arrays allow faster data retrieval than linked lists, because only a single array reference is needed to locate the desired information as opposed to linked lists which must be sequentially traversed.
The entry point to the file I/O component is through the two main procedures importObj() and exportObj().
4.2 Geometry renderingThis is the main part of the program. The two main modes of operation for the program, which can be toggled through either the menu or keyboard, are:Mono Mode (2D): There is a speed advantage for viewing
monoscopically since only one image needs to be rendered for each screen instead of two for stereoscopic mode. This mode is designed to be used if the user wishes to get the model quickly into the position before toggling into stereoscopic mode18.
Stereo mode (3D): A separate image is rendered for each eye19
so that four images need to be calculated - one for each screen, for each eye.
Furthermore, three “model modes” are available, which correspond to node, line and polygon geometry elements. The three modes are:Dots: Renders a point at each vertex location with lighting
disabled. It is useful for visualising the model with the least amount of detail.
Wireframe: Renders a wireframe model by essentially connecting-the-dots, also with lighting disabled. It is useful for viewing the complete structure of the model because it
18The reason for this is that the manipulations performed on the model to get it “where you want it”, generally involve rotations and translations which are computationally expensive and can give a low frame rate - which is not visually pleasing.19Refer to Section Appendix E.
does not remove hidden lines at the rear of the model. It is the fastest rendering model with this hardware configuration, and should be very useful for engineering applications.
Shaded solid: Renders a fully shaded, solid shell model with hidden surfaces removed and lighting enabled20.
Apart from providing a degree of control over the rendering speed, they allow some flexibility over the way in which the model is displayed, which may be more suitable for certain types of models. Furthermore, there are four other modes that can be toggled, that have an effect on the way the model is rendered, they are: “Anti-aliasing”, which smooths jagged edges of lines and polygons; “Fog”, which is used to create a realistic atmospheric effect by dimming far away objects; “Back-face culling” which, when switched on, disables the rendering of the back-facing facets of polygons which allows the viewer to pass through objects and still view the scene; and enabling the “Front clipping-plane” which cuts a section through the model, removing all parts of the model in front of the clipping-plane’s surface.
The rendering code can be split up into two main parts: geometry creation, which deals with making the actual drawing primitive calls that render the geometry; and secondly, geometry rendering, which is concerned with rendering the geometry created in step (1), in this case, onto the special two-screen hardware configuration of the WEDGE. These two parts will be desribed in more detail below:
20The type of shading used is Gouraud shaing which is the quickest type that will aslo allow smooth shading. Note that lighting has to be disabled for rendering dots or wireframe, but must be enabled for solids to calculate colour.
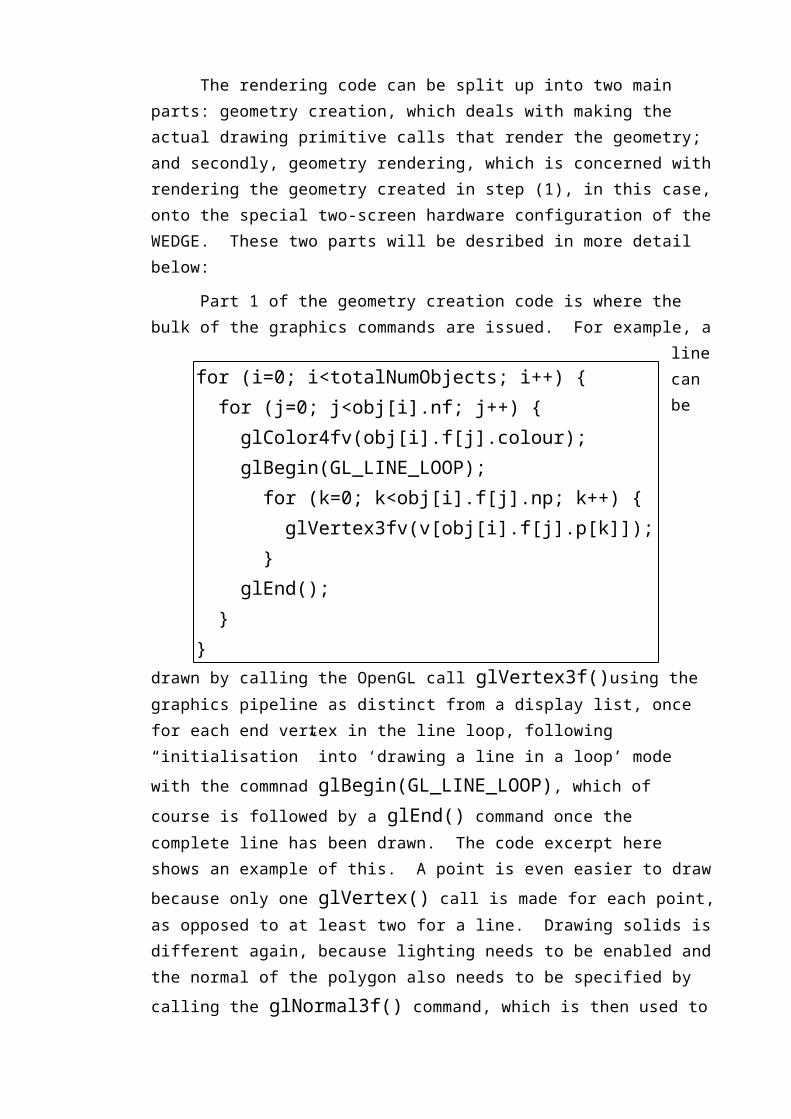
Part 1 of the geometry creation code is where the bulk of the graphics commands are issued. For example, a line can be drawn by calling the OpenGL call glVertex3f()using the graphics
pipeline as distinct from a display list, once for each end vertex in the line loop, following “initialisation” into ‘drawing a line in a loop’ mode with the commnad glBegin(GL_LINE_LOOP), which of course is followed by a glEnd() command once the complete line has been drawn. The code excerpt here shows an example of this. A point is even easier to draw because only one glVertex() call is made for each point, as opposed to at least two for a line. Drawing solids is different again, because lighting needs to be enabled and the normal of the polygon also needs to be specified by calling the glNormal3f() command, which is then used to calculate the colour reflected from light sources off the surface. Light sources are initialised on program initialisation in the viewerInit() procedure. For further details on rendering graphics primitives, refer toAppendix C.
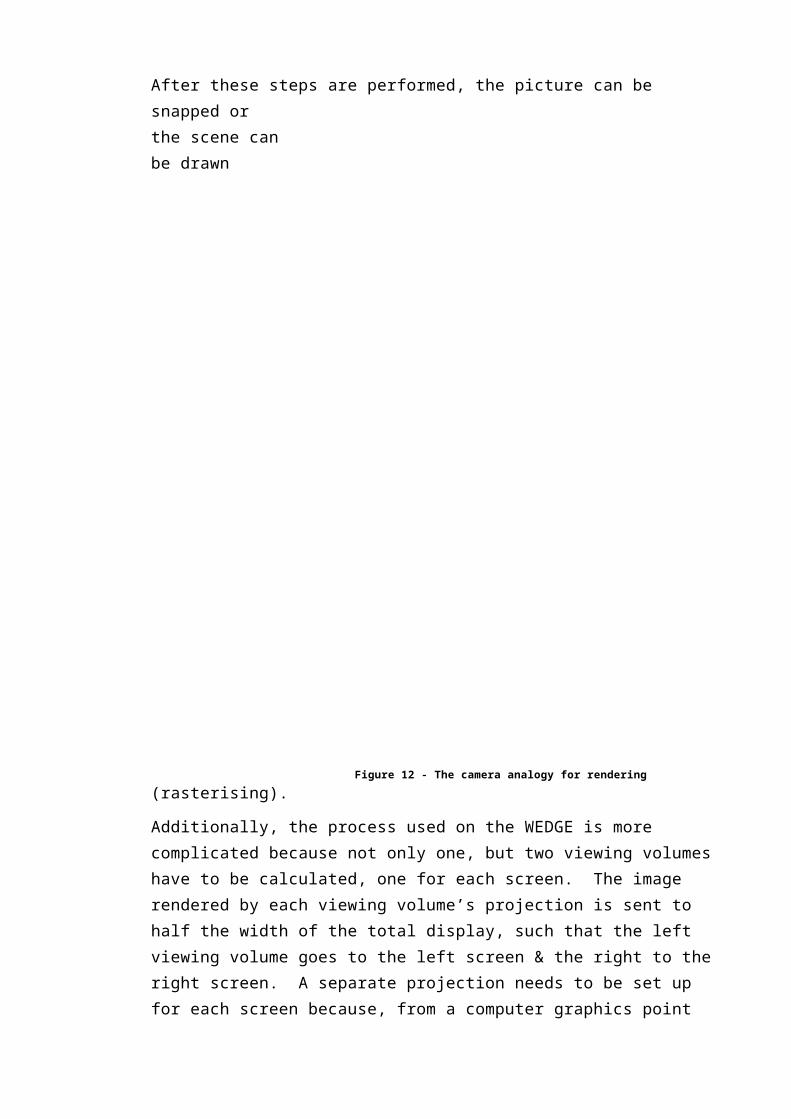
Part 2 of the geometry rendering code sets up the appropriate graphics projections to render the geometry created in Part 1. This process is analogous to taking a photograph with a camera. As shown in the figure overpage, the steps with a camera (or in parenthesis, for a computer) might be the following:1. Set up your tripod and point the camera at the scene (establish
a viewing transformation).2. Arrange the scene to be photographed into the desired
composition (perform a modeling transformation).3. Choose a camera lens or adjust the zoom (establish a projection
transformation), which defines the viewing volume21.
21The viewing volume for all perspective projections are a truncated square pyramid shape.
for (i=0; i<totalNumObjects; i++) { for (j=0; j<obj[i].nf; j++) { glColor4fv(obj[i].f[j].colour); glBegin(GL_LINE_LOOP); for (k=0; k<obj[i].f[j].np; k++) { glVertex3fv(v[obj[i].f[j].p[k]]); } glEnd(); }}

4. Determine how large you want the final photograph to be, for example, you might want it enlarged (establish a viewport transformation).
After these steps are performed, the picture can be snapped or the scene can be drawn (rasterising).
Additionally, the process used on the WEDGE is more complicated because not only one, but two viewing volumes have to be calculated, one for each screen. The image rendered by each viewing volume’s projection is sent to half the width of the total display, such that the left viewing volume goes to the left screen & the right to the right screen. A separate projection needs to be set up for each screen because, from a computer graphics point of view, each screen is a separate ‘window’ into the virtual three
Figure 12 - The camera analogy for rendering
dimensional space which gets ‘painted’ (through the projectors) onto the screen. This is different from using a single projected window, folded at 90° in the middle and wrapped to the screens, and involves considerably more complex code. The algorithm to implement this, (which is explained below), is modelled from a program written by Drew Whitehouse22. I have implemented my code in essentially the same way except that modifications have been made which remove redundant procedure calls pertinent to the use of C++ instead of standard C.
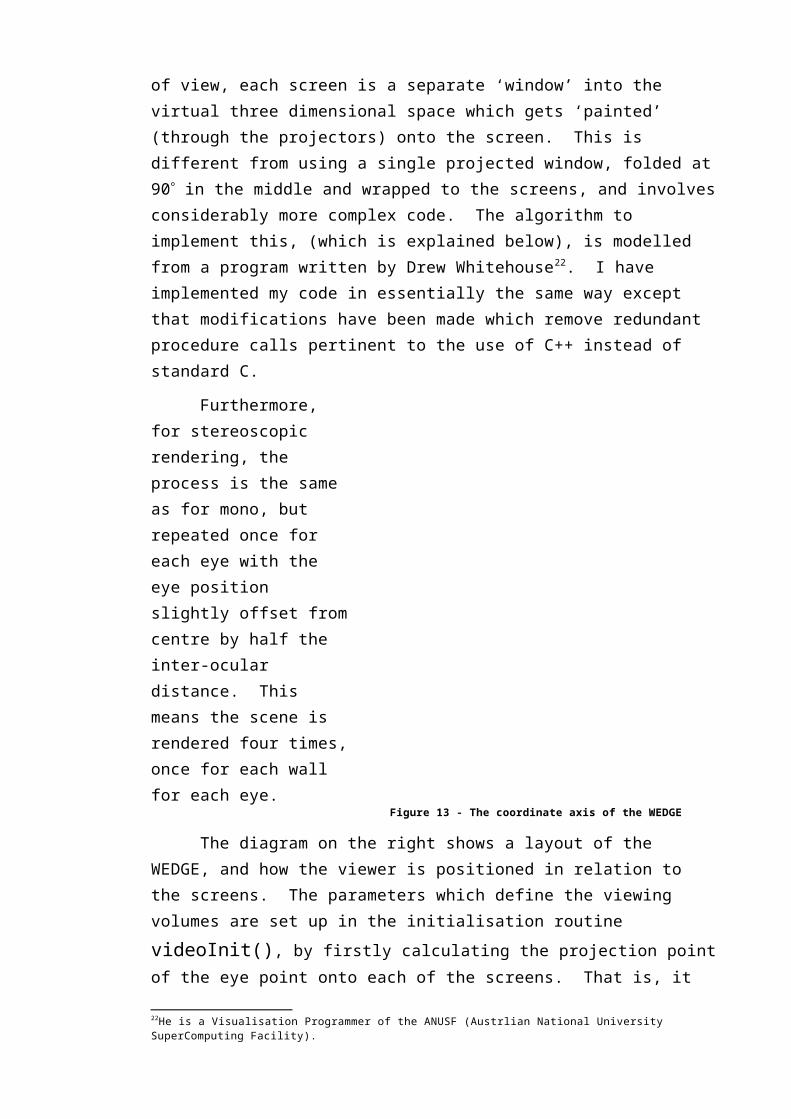
Furthermore, for stereoscopic rendering, the process is the same as for mono, but repeated once for each eye with the eye position slightly offset from centre by half the inter-ocular distance. This means the scene is rendered four times, once for each wall for each eye.
The diagram on the right shows a layout of the WEDGE, and how the viewer is positioned in relation to the screens. The parameters which define the viewing volumes are set up in the initialisation routine videoInit(), by firstly calculating the projection point of the eye point onto each of the screens. That is, it determines the vector from the eye position to a point on the screen such that it forms a normal with the screen’s surface, as follows:The vector from the eye to the center of each wall is given by
tmp eyePos E centre W (1)where “eyePos” is an array of positions for the eye, indexed by E, for the stereoscopic offset positions of the viewpoints when in 22He is a Visualisation Programmer of the ANUSF (Austrlian National University SuperComputing Facility).
Figure 13 - The coordinate axis of the WEDGE
stereoscopic mode, and for the central position viewpoint when in monoscopicmode. “centre” is the wall centre array, one for each of the two walls referenced by the index W. Given that dot product of two vectors is defined as
dot A B A B A B A B A B, cos 1 1 2 2 3 3 (2)
which is an indication of how much the vector A is going in the same direction as B, zero if they are perpendicular and the angle between them is 90°, and A B if they are parallel. Using (1) and (2), the projection point for each wall is
p W centre W dot tmp up W up W dot tmp right W right W , , (3)
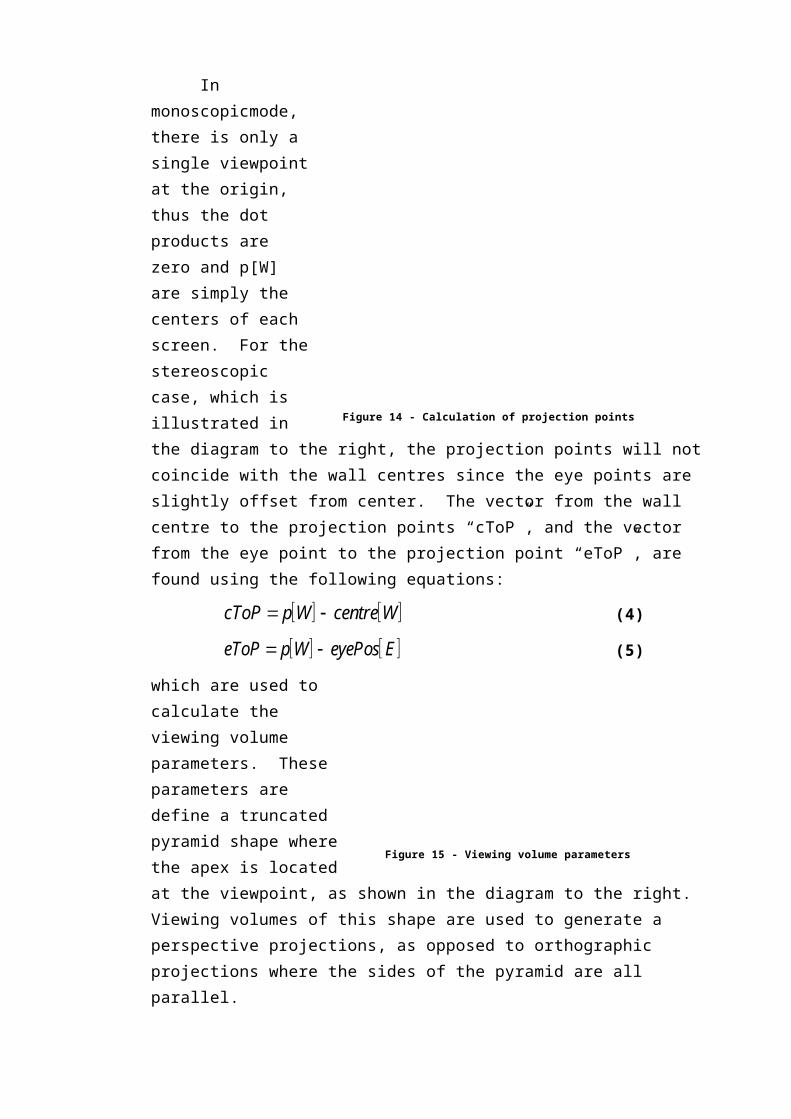
In monoscopicmode, there is only a single viewpoint at the origin, thus the dot products are zero and p[W] are simply the centers of each screen. For the stereoscopic case, which is illustrated in the diagram to the right, the projection points will not coincide with the wall centres since the eye points are slightly offset from center. The vector from the wall centre to the projection points “cToP”, and the vector from the eye point to the projection point “eToP”, are found using the following equations:
cToP p W centre W (4) eToP p W eyePos E (5)
Figure 14 - Calculation of projection points
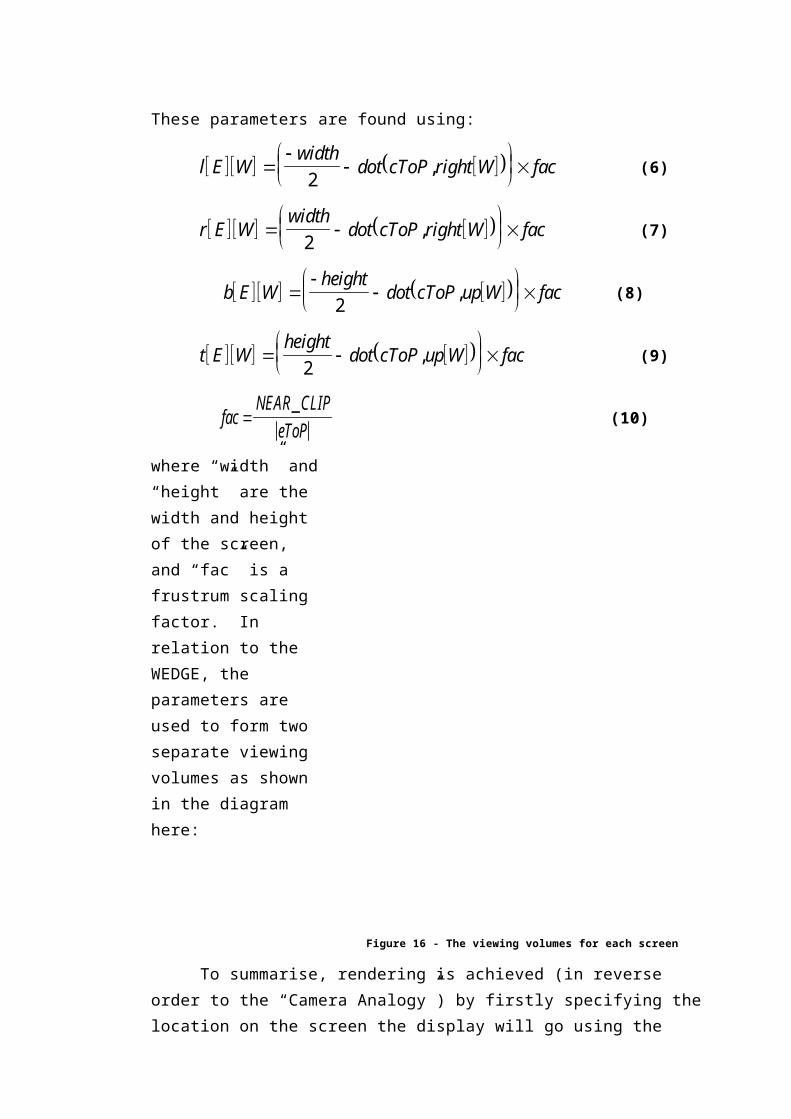
which are used to calculate the viewing volume parameters. These parameters are define a truncated pyramid shape where the apex is located at the viewpoint, as shown in the diagram to the right. Viewing volumes of this shape are used to generate a perspective projections, as opposed to orthographic projections where the sides of the pyramid are all parallel.
These parameters are found using:
l E Wwidth
dot cToP right W fac
2, (6)
r E Wwidth
dot cToP right W fac
2, (7)
b E Wheight
dot cToP up W fac
2, (8)
t E Wheight
dot cToP up W fac
2, (9)
facNEAR CLIP
eToP
_ (10)
Figure 15 - Viewing volume parameters
where “width” and “height” are the width and height of the screen, and “fac” is a frustrum scaling factor. In relation to the WEDGE, the parameters are used to form two separate viewing volumes as shown in the diagram here:
To summarise, rendering is achieved (in reverse order to the “Camera Analogy”) by firstly specifying the location on the screen the display will go using the OpenGL command glViewport(), followed by using the values from equations (6), (7), (8) and (9) in the perspective projection command glFrustum(l,r,b,t,NEAR,FAR) which sets up the viewing volume, and finally, specifying the modelview matrix through the OpenGL call gluLookAt(eyePos,p,up) which points the frustrum into the screen with the apex at “eyePos”, looking at projection point “p” on the screen with the up direction given by “up”.
4.3 Acceleration techniquesInteractivity is achieved by making the program run at a
speed no slower than ten frames per second, which is explained below. The program speed is dependent on two factors: the software and the hardware. The only significant way to achieve acceleration through hardware is buying better, more expensive equipment, which is outside the scope of this thesis. Various
Figure 16 - The viewing volumes for each screen
techniques were employed in the software layers to allow faster rendering, the most important of which is through using the three different model modes. Rendering solids would be preferable23 but is slower than using wireframe and so the user has some control over render speed this way. The relevant issues to do with program speed are given in the following table.
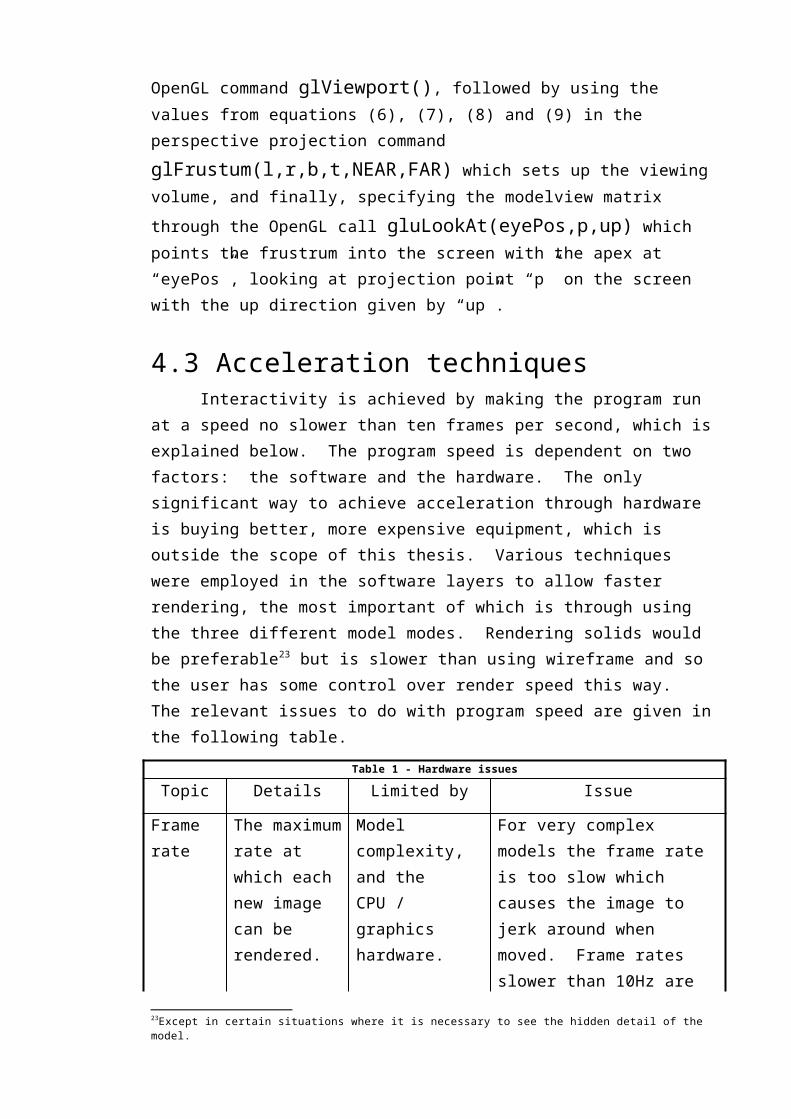
Table 1 - Hardware issuesTopic Details Limited by Issue
Frame rate
The maximum rate at which each new image can be rendered.
Model complexity, and the CPU / graphics hardware.
For very complex models the frame rate is too slow which causes the image to jerk around when moved. Frame rates slower than 10Hz are generally felt to be undesirable but this varies for each user24.
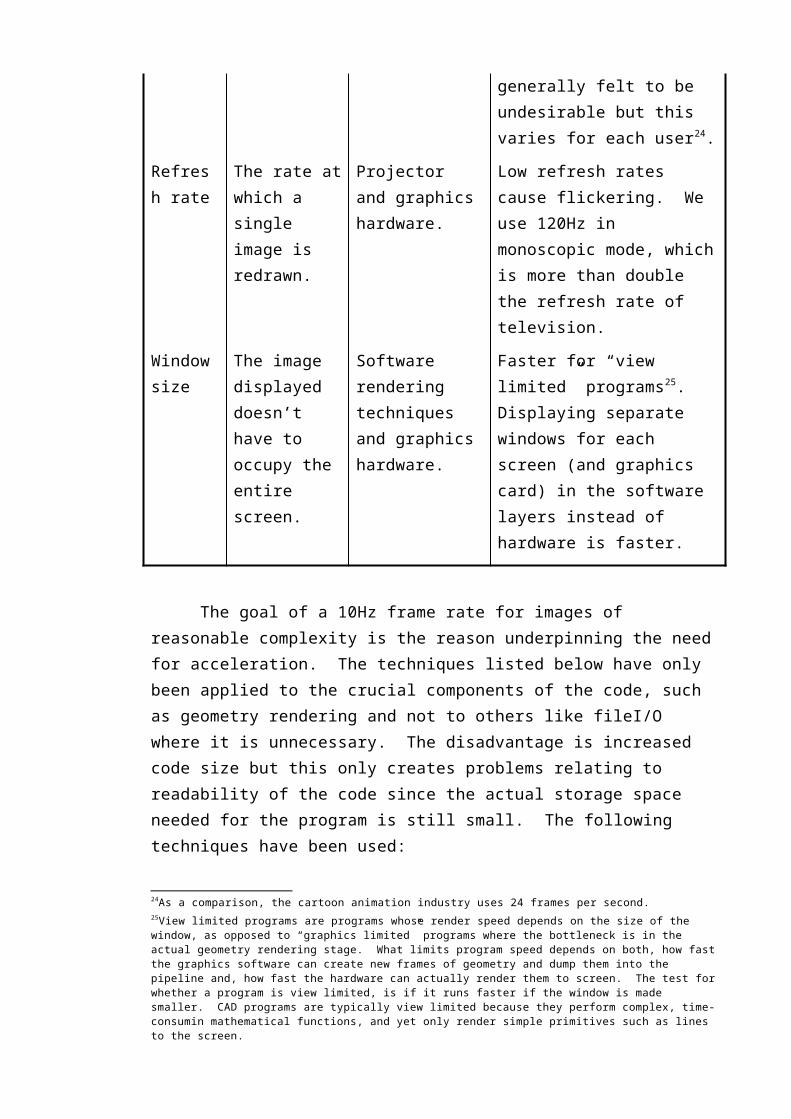
Refresh rate
The rate at which a single image is redrawn.
Projector and graphics hardware.
Low refresh rates cause flickering. We use 120Hz in monoscopic mode, which is more than double the refresh rate of television.
Window size
The image displayed doesn’t have to occupy the entire screen.
Software rendering techniques and graphics hardware.
Faster for “view limited” programs25. Displaying separate windows for each screen (and graphics card) in the software layers instead of hardware is faster.
The goal of a 10Hz frame rate for images of reasonable complexity is the reason underpinning the need for acceleration. The techniques listed below have only been applied to the crucial components of the code, such as geometry rendering and not to others like fileI/O where it is unnecessary. The disadvantage is 23Except in certain situations where it is necessary to see the hidden detail of the model.24As a comparison, the cartoon animation industry uses 24 frames per second.25View limited programs are programs whose render speed depends on the size of the window, as opposed to “graphics limited” programs where the bottleneck is in the actual geometry rendering stage. What limits program speed depends on both, how fast the graphics software can create new frames of geometry and dump them into the pipeline and, how fast the hardware can actually render them to screen. The test for whether a program is view limited, is if it runs faster if the window is made smaller. CAD programs are typically view limited because they perform complex, time-consumin mathematical functions, and yet only render simple primitives such as lines to the screen.
increased code size but this only creates problems relating to readability of the code since the actual storage space needed for the program is still small. The following techniques have been used:Code streamlining: Removing unnecessary code fragments and
using efficient programming techniques. For example, using arrays instead of linked lists26.
“Inlining” procedures calls: Which avoids the computational overhead associated with making a procedure call, by inserting the actual procedure in the body of the program.
Removing “IF” statements: Removing multiple IF statements and replacing them with two separate sections of code which are essentially identical except for the section of code pertinent to the branch of the IF statement. This has been used in the two similar, yet crucial rendering procedures drawMonoWalls() and drawStereoWalls(), which are different by only a single IF statement.
Remove display lists: Removing “display lists”27 which supposedly speed up rendering but were found to actually be slower on this hardware. Refer to Chapter 6.
Back-face culling:Disabling the rendering of the back-facing facets of polygons, which has a variable effect depending on how many polygons have their back facets facing the viewer, such as inside objects.
Front clipping-plane: Enabling a fifth clipping plane to the existing four which form the viewing volume. All geometry which is in front of the plane, in the region Z>0, is not rendered, which facilitates a cut-away view of the interior of the model.
Complexity reduction: Involves reducing the number of polygons in the model, achieved firstly through the tuning parameters in the 3DS export function as discussed in Chapter 3. And secondly through the “file modification” component of the wedge.exe program, which is explained further on.
26Refer to Chapter 5.27See OpenGL in Appendix C.
The “portability mode”, developed to allow the program to be run on other hardware platforms with a single screen view, can also be used to accelerate the rendering speed since it cuts out a large portion of the computational overhead associated with rendering the model on the special WEDGE hardware. It is discussed in detail in Chapter 5.
A “frames per second” (fps) counter allows the rendering speed to be monitored, which, when enabled is displayed in a small box at the bottom left of the screen.
4.4 User interfaceThe User Interface (U/I) has been an exciting aspect of this
project. The U/I implements several functions: manipulating the model through translation, rotation and scaling, via the mouse; accepting typed user input in the program console, via the keyboard; and, thirdly, changing the program state and toggling program options, via keyboard shortcut-keys and the menu. A decomposition of the U/I from a hardware point of view reveals a different structure which is more closely related to code design. See Appendix B for further details. It also shows that a lot of the functionality available through the menu is also available through equivalent shortcut-keys via the keyboard. Furthermore, the graphics library called “glut” (GL Utility Library), extends the input facilities provided by OpenGL and is used extensively as an adjunct to OpenGL in the code.
At the highest level, the top-level design of the user interface consists or ‘registering’ the functions which will be called in the event of an input. For
example, to register a pop-up menu which is activated with the right mouse button, the following code can be used:To register a mouse button, and mouse motion handler, the commands glutMouseFunc() and glutMotionFunc() are used respectively. The keyboard’s input is handled with glutKeyboardFunc(). Each of these registered procedures is called a “call-back” function. Once all the call-back functions have been specified, the program is started by entering the main “event-
glutCreateMenu(myMenu);glutAddMenuEntry("hello",printf(“hello\n”);glutAddMenuEntry("Quit", exit(0));glutAttachMenu(GLUT_RIGHT_BUTTON);

driven” loop with the command glutMainLoop(), and any input is directed to the appropriate call-back function.
A major part of the U/I is the manipulation of the model via the mouse. There are seven possible transformations: translation in the “X”, “Y” and “Z” directions; rotation around the “X”, “Y” and “Z” axis; and scaling about the origin. To help the user manipulate the model an elaborated set of “cross-hairs” can be toggled on, which displays a wireframe grid in the X-Z plane and also a coloured coordinate axis to help the viewer orient themself. Furthermore, if “debug mode” is enabled, a small viewport at the bottom left of the screen appears, showing a miniature of the image rendered on the screens, overlayed on a wireframe model of the WEDGE’s screens, which allows the viewer to see exactly where the model is, in the immersive space.
Two types of mouse input actions are recognised by the program: “button presses”, which are initiated by GLUT_DOWN and GLUT_UP; and mouse “motion”, which occurs when a button is held down while the mouse is moved. Once a button press is registered, the name of the button is then distinguished by GLUT_LEFT_BUTTON, GLUT_MIDDLE_BUTTON, and GLUT_RIGHT_BUTTON. The right button is reserved solely for menu control. Mouse motion by itself controls the model translation and scaling, whereas if a “modifier key”, such as the <CTRL> key, is held down when the mouse action is registered, the resulting action is different: holding down the <CTRL> key, GLUT_ACTIVE_CTRL, while moving the mouse, allows model rotation; whereas holding down the <SHIFT> key, GLUT_ACTIVE_SHIFT, while picking an object with the left mouse button, initiates object selection. If, while the model is being rotated, the button is released, the model continues to spin at a rotational speed proportional to the speed of the mouse motion. Considerable effort goes into implementing this trivial function, which allows the model to be spun around and facilitates overall viewing. The mouse controls are summarised in the table below:
Table 2 - Mouse controls
Modifier key
Left button Middle button
Right button
None X and Y translation
Z translation and scaling
Reserved solely
<CTRL> X and Y rotation
Z rotation for
<SHIFT> Select object unused menu control
The U/I design in general has been informed by the professional 3D animation package called “Houdini”. All the model manipulation functionality is accessed through the single procedure call agvViewTransform(). This facilitates program modularity and maintainability of the code. It is implemented with the following code fragment, where the calling sequence order of each of the commands is important:
It firstly translates the model to the desired location using the
glTranslatef() command, then rotates using glRotatef(), and finally scales it with glScalef(). The rotation is “additive”, which means that the first axis to be rotated around will correspond to the viewer’s reference frame, whereas the second and third axis to be rotated around will be relative to the rotated reference frame. In effect, this places an “importance”28 on the order of rotation, whereby the first axis of rotation is the most important, and the last is the least important. For this reason the rotation is done around the Z, X and Y axis, in that order, which is a subjective choice based on consulting with other computer graphics software users.
Some design issues were raised by the construction of this part of the U/I, firstly, since the rotation system is designed to be additive so that there is no “memory” of the order of the rotations made. The effect of this is that rotating the model left-right while it is upright, is in the opposite direction to when it is upside-down, which is not consistent. This style may be preferred though, since it can be thought of as “grabbing hold of one side of the model, and then rotating around the origin”. The “memory” rotation method can be implemented using a rotation matrix and successively multiplying the contribution of each new rotation to it, but it is not certain if this would be any more desirable for the user29. A second issue is that the mouse only has two buttons available out of the three, where the 3rd button is used for menu control and cannot be used for anything else once it has been assigned to a menu. Ideally all three buttons could be used for the 28”Importance” meaning, how important it is in helping the viewer manipulate the model to the desired orientation.29Refer to Chapter 7.
glTranslatef(transX,transY,transZ);
glRotatef(aZ);
glRotatef(aX);
glRotatef(aY);
glScalef(scale);
three dimensions of transformation if the menu was implemented in a different way, for example, through using the windowing system to implement a “menu bar” at the top of the screen instead.
4.5 File modificationThe program was given the ability to modify the model data
for two reasons: firstly, to correct errors introduced while exporting data from AutoCAD to the 3DS file format, which occurs as a result of the triangulation process. This is a major problem common to all file formats requiring triangulation and is the source of a lot of research30; and secondly, to reduce the model complexity (number of polygons) by deleting superfluous polygons which do not aid in the visualisation of the overall model. For example, the model of the Torroidal Field Coil (Tfcnew.obj) contains many small, curved surfaces located below relatively large cylinders which makes them barely visible. Yet because of their curved shape, these elements have been triangulated into a disproportionately large number of polygons for their size. As such they can be deleted without affecting the model significantly and will decrease the model complexity, thus increasing rendering speed.
The user is able to modify the model and write the changes directly to file. Selection mode functionality is accessed by holding down the <SHIFT> key and picking an item of interest on the screen with the mouse, which then highlights it and marks it as selected. The design allows selection to be made on a “per polygon” basis, that is, the polygons of the model can be selected in either dot, wireframe or solid mode but the operations only apply to polygons. This is because the polygon is the rudimentary building block of the model and also because removing components of larger element, such as a line from a polygon, will corrupt the geometry. Once a polygon selection set is made, various commands can be performed, which are:Delete objects: Deletes all selected polygons leaving a void in
their place. For example, to delete unnecessary polygons which increases render speed.
Reverse normal direction: Reverses the normal of the polygon. For example, to correct the normal direction of certain polygons that have been created in the triangulation process facing the wrong way.
30See [MIDT93].
Clear selection: Clears all the currently selected objects and resets the colour.
Another method of file modification is accomplished using Cinema4D to directly modify the 3DS file, rather than the wedge.exe program to modify the OBJ file. Cinema4D can be used to delete individual objects, which typically correspond to layers in AutoCAD, which depends on the 3DS export parameters that were chosen in the conversion process. The modified 3DS file can then be exported to an OBJ file.
Chapter 5
Implementation of wedge.exeThere were various limitations and subsequent deviations
from the original design that were encountered while implementing the wedge.exe program and installing it on the WEDGE. T his chapter discusses how the wedge.exe program was actually implemented, the implementation issues that were faced, and also the reliability, robustness, portability and maintainability aspects which will affect the future work on this project. These iterations in the original design are discussed below.
5.1 Hardware and software resourcesThe WEDGE’s hardware environment is a PC with enhanced
graphics capabilities, see the section Appendix D for further details. The software resources available at the beginning of this project included a networked, cross-development platform between the HPC (High Performance Computing) laboratory at Department of Computer Science, and the Vizlab (Visualisation Laboratory) at the ANU Supercomputing Facility, on SGI workstations running UNIX and a PC running Windows NT, respectively. Existing software, even commercial 3rd party software, was not available to render CAD data in The WEDGE and so it had to be written from scratch31.
An important implementation issue is choosing the programming language and graphics library. The possibilities here were limited firstly by the choice of a suitable graphics library32 because their suitability is constrained by the computer’s hardware. Accordingly, the OpenGL graphics library was selected 31This is because of the specific nature of the hardware. Note that the algorithm used to render on the two separate screens was obtained from Drew Whitehouse.32Computer Graphics capabilities are enabled through application programs, usually with a standard programming langauge such as C++, which makes function calls to the underlying graphics utility library. Refer to Chapter 3.
for the following reasons: the suitability of OpenGL to the graphics card hardware used in the WEDGE computer33; the portability of OpenGL onto almost all platforms; the general acceptance of OpenGL as the standard for graphics software; its reputation of being powerful and efficient; and lastly, because the computer graphics course taught at the ANU (which I completed in semester one 1998), uses OpenGL.
Secondly, the standard ANSI C programming language was selected in favour of C++ as the language to implement the “application program” with, for the following reasons: C is a simpler programming language, which is at the cost of programming power, such as dynamic data structure allocation; almost all of the existing computer graphics software is written in C not C++, which makes it is easier to convert existing programs to run on the WEDGE; it is a personal programming language preference; and lastly, this is how it is taught in the computer graphics course and also in the book “OpenGL Programming Guide” which is the standard reference, see [ADDI97]. Refer to Appendix C for more information on C and OpenGL.
5.2 Coding conventionsThe coding style in the implementation uses the followed guidelines: The variable and type definition names use concatenated words with the first word in all lower case and every subsequent word with first letter capitalised, for example drawStereoWalls; Constant definitions are all in capitals, for example NWALLS; In-line comments are used throughout as well as more detailed explanations at the beginning of each procedure and file; Two space indenting between levels, and; the layout of each file is separated into sections with an asterisk divider between, such as:
/***************************************************************//********************* DISPLAY FUNCTIONS *********************//***************************************************************/
5.3 Data structuresThe data structures used by the program to contain the
model information are divided into two categories: “linked lists”, which are used for storing data while parsing through the file; and “fixed length arrays”, which are used for storing the data which has been temporarily read into the linked lists, once the file has been
33Certain graphics cards are specifically designed to take over the some of the rendering tasks of “compatible” graphics libraries, which are normally done in the software layers.
successfully read in and the amount of data is to be stored is known.
There are three main reasons for having the two separate data structures: the number of entities in the input file is unknown, so the use of a linked list allows the data structure to grow dynamically at run-time while parsing through the file; secondly, since the H-1NF Heliac files are huge34, it saves memory space; thirdly, the linked list structure lends itself well to file modification, in particular, to the deletion of polygons once a file is modified whereby a deleted polygon is skipped by passing the pointer around it.
34The H-1NF Heliac model has files consisting of several hundred thousand polygons.
typedef struct { vec3 v; struct vType *next;} vType;
typedef struct { GLint np; GLint p[MAX_POINTS]; GLboolean sel; vec3 n; vec4 colour; struct faceType *next;} faceType;
typedef struct { char name[256]; GLint nf; faceType *f; struct objectType *next;} objectType;
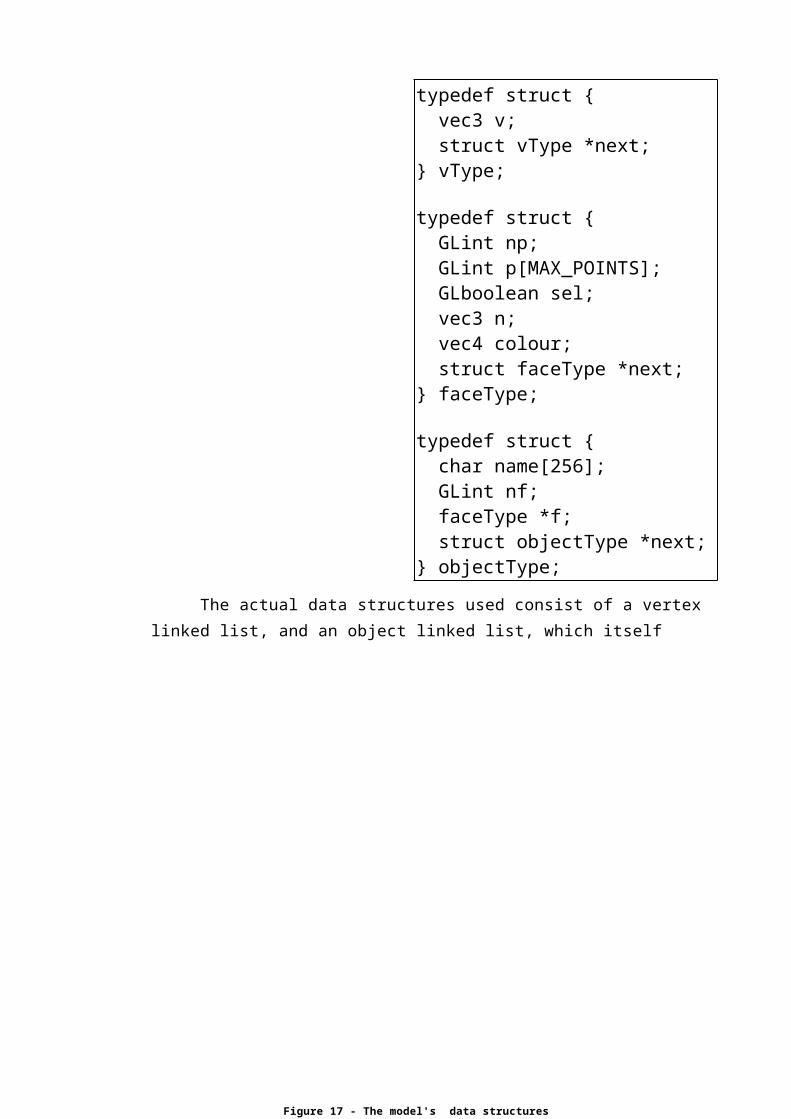
The actual data structures used consist of a vertex linked list, and an object linked list, which itself contains a link to a polygon linked list, as shown in the code fragment to the right:
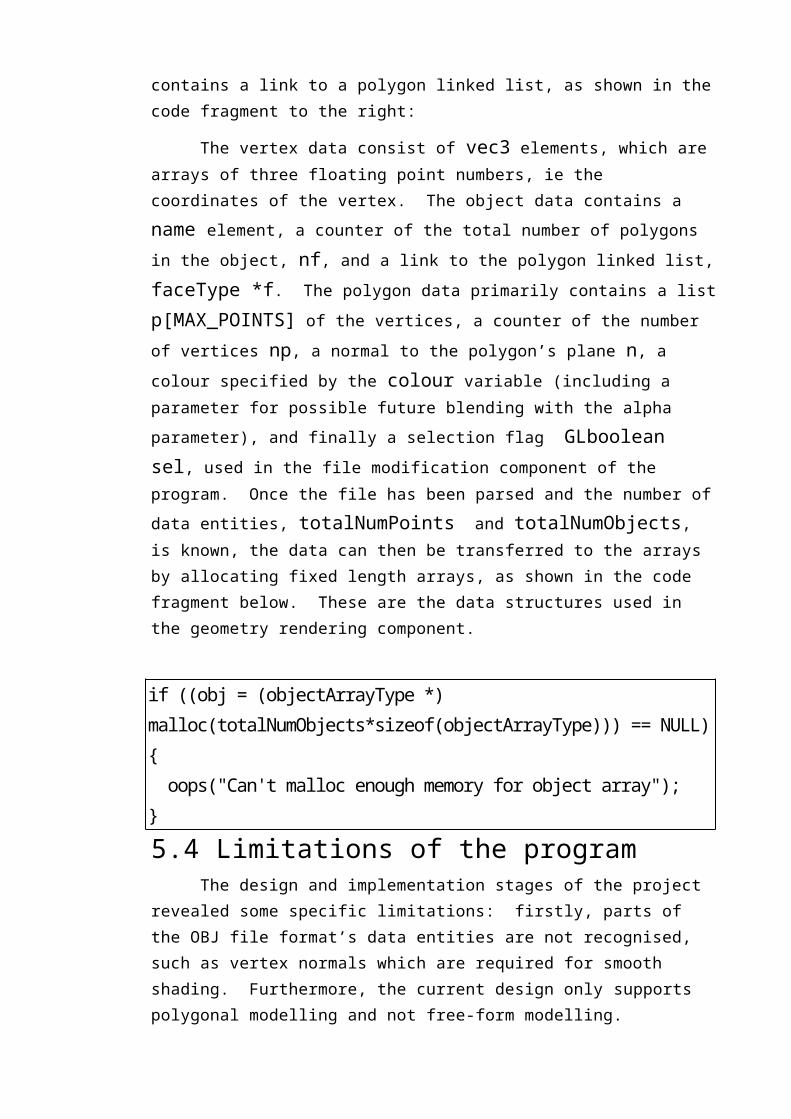
The vertex data consist of vec3 elements, which are arrays of three floating point numbers, ie the coordinates of the vertex. The object data contains a name element, a counter of the total number of polygons in the object, nf, and a link to the polygon linked list, faceType *f. The polygon data primarily contains a list p[MAX_POINTS] of the vertices, a counter of the number of vertices np, a normal to the polygon’s plane n, a colour specified by the colour variable (including a parameter for possible future blending with the alpha parameter), and finally a selection flag GLboolean sel, used in the file modification component of the program. Once the file has been parsed and the number of data entities, totalNumPoints and totalNumObjects, is known, the data can then be transferred to the arrays by allocating fixed length arrays, as shown in the code fragment below. These are the data structures used in the geometry rendering component.
Figure 17 - The model's data structures
if ((obj = (objectArrayType *) malloc(totalNumObjects*sizeof(objectArrayType))) == NULL) { oops("Can't malloc enough memory for object array");}

5.4 Limitations of the programThe design and implementation stages of the project
revealed some specific limitations: firstly, parts of the OBJ file format’s data entities are not recognised, such as vertex normals which are required for smooth shading. Furthermore, the current design only supports polygonal modelling and not free-form modelling. Polygonal geometry uses points, lines and faces to define objects while free-form geometry uses curves and surfaces such as NURBS (Non-Uniform Rational B-Splines). A better approach is given in Chapter 7.
Secondly, the data structures used to store the polygons are only capable of triangles and squares, ie polygons either three or four vertices. This is easily upgradable but is sufficient for the H-1NF Heliac files used; thirdly, AutoCAD drawings containing more than 65,535 vertices cannot be converted using the “3DS export” function, in which case the geometry complexity must be reduced using Auto-Welding. This is not a problem for the H-1NF Heliac since the largest individual file (3shellg.3ds), only contains about 20,000 vertices.
Fourthly, the user-interface is designed so that the person viewing the model, who is standing in the WEDGE’s immersive space, is not in control, which is left to the person seated at the computer. This is not desirable since, ideally, the viewer should be in control. This will require the future interfacing with the 3D mouse and head-tracker.
5.5 Reliability and robustnessThe program has been made robust and reliable wherever
possible to avoid the possibility of malfunction. In the event of an error occurring at any level (apart from the computer hanging), an appropriate message is printed to standard output (stdout), after which the program frees all the used memory and exits. There are several levels of protection, starting with the most serious: in worst case scenario, the program can never “hang” the computer because the operating system, Windows NT, is specifically designed for robustness whereby the faulty program can be quit by “killing” the process in Window’s “task manager”;
On the next level, all memory allocation calls within the program are checked for successful execution before continuing, which would otherwise not be detected and cause an invalid
memory cell to be addressed during program run-time. This type of error might occur either due to a memory allocation failure, or if all the memory has been used by other applications; similarly, all “file open” operations are checked for successful completion before continuing. If a file cannot be found a special defaultFilePath is checked, as a backup, to see if the file is located there instead. File errors might occur due to a disk “read/write error”.
Fourthly, the file parsing function has been made as robust as possible to allow for errors in the file data, in which case the data is ignored and the parser skips to the next line. The parsing function also allows for different kinds of entity data in the file than are expected, for example, due to different types of data written by different software packages. In the event that there is a serious file integrity error, such as a polygon referencing a non-existent vertex, then the program prints a message and quits. It would be advantageous if, in future work, instead of quitting it continued to aid in the debug process.
On program initialisation protection is ensured by checking the command line input to make sure that it is in the correct format. For example, if the file extension “.obj” is not present after the file name, it is appended. Also, if the number of arguments is incorrect then a usage message is printed to stdout, and the program exits since it needs correct input to continue. Similarly, on program exit, all the memory used in linked lists and arrays is freed.
Lastly, in debug mode (which the user can toggle during run-time), the program displays useful program information to the screen, such as the program speed in frames per second, and prints the file data to stdout in the event that a file is imported.
5.6 Portability and maintainabilityThe programming languages used to implement wedge.exe,
C and OpenGL, are portable and can be compiled on most other platforms such as UNIX and SGI workstations, by making minor modifications to the makefile and the included header files. The program is designed specifically to run on the WEDGE’s hardware, which is fairly unique, and has therefore been implemented with a “portability mode” which allows it to be run on other platforms. This mode is invoked by either using the command line option “wedge -p”, or by toggling through the menu. The main difference from the normal mode of operation, is that it displays a single

screen at the standard XVGA resolution (1024 by 768). This resolution allows the program to be run on both SGI’s running UNIX, and on the single screen equivalent of the WEDGE called the EDGE35. This form of executable will run on any Windows95 or NT platform, even without hardware acceleration, provided all the appropriate dynamic link libraries (DLL’s) are present.
Currently the program is not portable at all, although it can be with some modifications36. It has been designed to be maintainable by making it modular so that the functionality of one section can be changed without re-writing the whole program. For example, to change what the program actually draws only the drawScene() procedure needs to be changed. Similarly, the U/I functionality is implemented through a single procedure call agvViewTransform(), and so only the relevant sections in the program agv.c need to be modified to make changes. The constant definitions are all included in the header files for easy access and can be modified to change, for example, the number of walls NWALLS comprising the WEDGE. All the variable types used reference the OpenGL variable types such as Glfloat instead of simply float, which will allow the program to work on other platforms with different architectures and hence with different memory sized floats.
5.7 Low level designA detailed description of the program is given in Appendix A.
It contains a description of each of the files used in the program, and a decomposition of the program on a procedure by procedure basis.
35The EDGE uses a PC running WindowsNT and a single projected screen, which is used by the Plasma Research Laboratory (PRL) for demonstrations in the foyer to the H-1NF Heliac.36Refer to section Chapter 7.
Chapter 6
Results and TestingThe result of this project is that an application program which
facilitates the visualisation of CAD data sets was written. Details of program results and testing are given below:
The process for testing that the model data had been modelled correctly was conducted through the following steps: Firstly, the model was verified visually, which showed that the models which wedge.exe generated matched the AutoCAD data in appearance; Secondly, using the grid (which is to scale in meters), the dimensions of the model were verified. The cylindrical radius of the Polloidal Field Coil (Pfc.obj), which is 1m, was used for this test, which confirmed the model is drawn to scale.
The program was tested for portability on both the EDGE computer at the H-1NF Heliac laboratory, and on a SGI workstation at the HPC laboratory at the Department of Computer Science. Testing showed that the program was fully functional on both of these systems, except for a minor graphics card, hardware incompatibility on the EDGE computer, which caused the anti-aliasing mode to be enabled at all times.
The most important tuning parameter, relating to the “3DS export” conversion process from the AutoCAD data, is the Welding option, which was able to simplify the geometry and improve rendering time by welding nearby vertices into a single vertex. Using the Derive 3DStudio Objects From the “AutoCAD layers” option, was the most appropriate since the objects were already grouped into logical layers in the AutoCAD files. At highest level of detail (with no welding used to simplify the geometry), the “complete” 37 H-1NF Heliac model as represented in the OBJ file 37The model used only represents about half of all the existing AutoCAD drawings, but from a visualisation point of view, it contains ample detail and can be considered a complete model.
“all.obj”, consists of 45,418 vertices, 86,638 polygons and 67 objects. This file is a combination of the files given in the table below.
Table 3 - Files comprising the complete model
File Descriptionbase.obj The base of the main shell structure.shell.obj The main component of the entire structure, a
cylindrical shell.lid.obj The lid, similar to the base but on the top.css.obj The central support structure (CSS), used for
structural support.cssbase.obj
The base of the CSS.
cssouter.obj
The outer part of the CSS.
csstop.obj The top of the CSS.ivfc.obj The inner vertical field coil, used to compress the
plasma along with the,ovfc.obj outer vertical field coil.pfc.obj The polloidal field coil, contains the plasma in a ring
shape.tfc.obj The torroidal field coils, propels the plasma around the
ring.plasma.obj
The actual plasma, in a helical shape.
By loading this file repeatedly, being appended to itself, the maximum upper limit for the file size that the wedge.exe program is capable of handling was found, which is 265,340 vertices, 545,155 polygons, and 365 objects, at which point the frame rate was 0.06fps which was unbearably sluggish to manipulate.
The effect of varying the welding threshold value, in terms of render speed for the wireframe model of lid.obj, is shown in the table below:
Table 4 - Effect of the welding threshold value on speed
File Vertices Polygons
Objects
Threshold (m)
Render speed (fps)
lid_1.obj
7482 15746 4 0.001 4.26
lid_2.obj
2402 5186 4 0.01 10.14
lid_3.obj
1293 3008 4 0.02 14.82
lid_4.obj
771 1748 4 0.04 21.87
lid_5.obj
357 760 4 0.1 32.18
The model with the lowest threshold value, lid_1.obj, gave the best image detail as expected, but was also the slowest. Whereas the model with the highest value, lid_5.obj, with only 357 polygons, rendered very fast but had very bad detail. It did convey the overall shape though and may be suitable depending on the level of detail required. This illustrates a trade-off between complexity reduction and the level of detail whereby the welding threshold value has to be chosen just large enough to join the superfluous vertices together, such as the surfaces of the shell wall which is 15mm thick, into a single surface. This shows why it is necessary to “tune” the threshold parameter, since the optimum value will vary depending on both the requirements and on the actual geometry shape.
The effectiveness of directly modifying files using Cinema4D is shown in the following table, which used the file “Tfcnew.3ds”:
Table 5 - Effect of direct 3DS file modification
Filename Vertices Polygons
Objects
Wireframe speed (fps)
Solid speed (fps)
tfcnew.obj
9726 12672 39 5.32 2.91
tfc_1.obj 3816 6912 38 8 5.35tfc_2.obj 3240 6048 2 9 5.5
This approach involved removing objects in certain “layers” that were deemed to be inconsequential for the overall visualisation. It proved to be better than the welding approach since the parts of the model that remain are still at a high level of detail, thus it is a better solution to complexity reduction. The other alternative, using the object selection within the wedge.exe program was also tested and worked successfully. It was a much slower process though and seems better suited for the problem of reversing the polygon normals.
The rendering speeds for different model and viewing modes, and the effectiveness of the acceleration techniques were measured. It was found that in general, the program has good response with 10-15,000 polygon images, whereas more complex images of up to around 50,000 polygons can be viewed as wireframe, and stills of up to several 100,000 polygons also work
well. Surprisingly, rendering wireframe is the fastest, followed by dots, then solid models. Using the test file “all.obj”, specific results were obtained, given in the tables overpage. Speeds were obtained for all three model modes, with various toggle options enabled separately, as indicated by the “on” marker. Using the “portability mode” with no toggle options enabled, results were also obtained:
Table 6 - Rendering speeds under different “normal” testing situations
Case #
Model mode
Stereoscopic mode
Debug
mode
Anti-aliasin
g
Fog Front clip-
plane38
Speed
(fps)
1 dot - - - - - 0.532 wireframe - - - - - 0.893 solid - - - - - 0.454 dot on - - - - 0.275 wireframe on - - - - 0.376 solid on - - - - 0.237 dot - on - - - 0.338 wireframe - on - - - 0.479 solid - on - - - 0.28
10 dot - - on - - 0.1611 wireframe - - on - - 0.8512 solid - - on - - 0.4513 dot - - - on - 0.4914 wireframe - - - on - 0.7915 solid - - - on - 0.4416 dot - - - - on 0.6017 wireframe - - - - on 0.93
38With the clipping plane in the initialisation position such that clips all geometry in the region Z > 0.
18 solid - - - - on 0.52
Table 7 - Rendering speeds under the single screen “portable” testing situation
Case #
Model mode
Stereoscopic mode
Debug mode
Anti-aliasin
g
Fog Front clip-
plane
Speed (fps)
19 dot - - - - - 0.8920 wireframe - - - - - 1.0321 solid - - - - - 0.75
These readings were used to produce a table of “scaling factors” which give the rendering speed of the different program modes, as specified by the toggle options. For example, the effect of enabling anti-aliasing while in the Case 1 scenario (0.53fps), is to scale the rendering speed by 30.19% to give the scenario in Case 10 (0.16fps), ie a 70% reduction in rendering speed. The scaling factors are given in the table overpage:
Table 8 - Effects of toggle functions on rendering speed
Model mode
Toggle function Scaling factor
dot Portability mode 167.92%dot Stereoscopic mode 50.94%dot Debug mode 62.26%dot Anti-aliasing 30.19%dot Fog 92.45%dot Clip-plane 113.21%
wireframe Portability mode 115.73%wireframe Stereoscopic mode 41.57%wireframe Debug mode 52.81%wireframe Anti-aliasing 95.51%wireframe Fog 88.76%wireframe Clip-plane 104.49%
solid Portability mode 166.67%solid Stereoscopic mode 60.00%solid Debug mode 62.22%solid Anti-aliasing 100.00%solid Fog 97.78%solid Clip-plane 115.56%
The results from this table show that on average between the three different model modes: enabling portability mode increases the rendering speed by 50%; enabling stereoscopic mode decreases speed by 50%; enabling debug mode decreases speed by 41%; enabling fog decreases speed by 8% and; clipping the front half of the model increases speed by 10.67%. The effect of enabling anti-aliasing can not be averaged because the effect on both wireframe and solid models is negligible whereas on the dot model it decreases speed by 70%.
The effect of anti-aliasing and fog in general was small for solids compared to the other model modes. This indicates that there exists some kind of hardware acceleration built into the graphics cards specifically for solids rendering acceleration, which should be taken advantage of in future work.
Furthermore, the scaling factors are approximately additive so that a combination of effects will simply multiply their values. For example, in normal operation mode using a wireframe model, a speed of 0.49fps is achieved with both the debug mode and the clipping plane enabled, which is 55% of the value without any toggle options enabled (0.89fps - Case 2). This corresponds to the product of the debug and clip-plane scaling factors for wireframe from the table above, which is 52.81% x 104.49% = 55.18%.
All the previous examples have the model located in the “reset” position such that, if clipping is disabled, the image occupies almost a complete screen width and height. The rendering speed depends on how big the object appears on the screen, ie how many pixels have to be drawn. The effect was measured by shifting the model fully out of the screen so that no part was visible, which gave the following effects: for Case 2, at 0.89fps, the speed increased by 449.44% to 4.00fps; for Case 20, at 1.03fps, the speed increased by 776.70% to 8.00fps. Likewise, the effect of both back-face culling and the clipping plane, which have varying effects, can be explained: if back-face culling is enabled whilst inside an object, then the object will be invisible and so the effect will be large because the back facets of polygons face inwards. A similar situation applies to the clipping plane, where the speed increases when a larger portion of the model is “clipped out of view”.
The effect of removing the display lists from an early version of the code was not analysed quantitatively since the frame per second counter had not been installed at that stage. The qualitative effect of removing them, was to produce a speed increase of about 200%, which was measured visually. It should be noted that this speed increase is only applicable to the WEDGE hardware because it has such a fast CPU.
From an aesthetic point of view, the effectiveness of The WEDGE depends largely on the actual image being displayed, that is, the quality, size and type of image, and also where in the visual field it is displayed. It was found that it is capable of aesthetically pleasing images which are in some cases very striking, as is the case with the molecule model shown in the picture to the right, “bucky.poly”:
Informal testing, made by myself and the other visualisation programmers at the Vizlab39 relating to the overall performance of the WEDGE from an aesthetic point of view, has revealed the following observations: Most significantly, the images of objects which are near the screen’s surface (in 3D) are easier to see stereoscopically, because the viewer’s eyes have to focus on screen’s surface regardless of the angle of stereoscopic parallax (amount of “cross-eyedness”). Thus, the mind finds it easier to believe that the image is at a “screen’s distance” from the eye since it also corresponds to the distance that the focussing muscles in the eye suggest; Secondly, close-up images are more striking but are harder to see in three dimensions, especially for inexperienced users. This is because of the increased stereoscopic parallax for close-up images, which makes the two separate left and right eye images diverge. Furthermore, far-away images are less striking and look less three-dimensional, but are easier to see, 39 Stewart Ramsden and Drew Whitehouse.
Figure 18 - Bucky Ball
which is consistent with; thirdly, that objects which extend from near the viewpoint to far-away, look good because they emphasise depth in the image.
Fourthly, a subtle problem called “ghosting” exists, which is due to long phosphor persistence40. This problem is common to all virtual environments and manifests itself as green shadows similar to a television broadcast images when reception is poor. This detracts from the quality of the image and is a minor annoyance to some viewers. However, NEC is currently demonstrating some short persistence green phosphor projectors which may solve this problem.
Fifthly, the most striking images come from the vertex region of the screens where the image “looks best” because the viewers eyesight is directed at the vertex, thus giving the largest field of view of both screens and hence, the most immersivity. Sixthly, rotating objects give a good three-dimensional feel because of the effect of motion parallax which emphasises depth in the image, which is important for; sixthly, a number of viewers41 that are never actually able to see three-dimensional images properly. This is because some viewers find it naturally hard to train their eyes to disobey what their mind tells them is otherwise a flat image on a screen. This can be overcome by simple training with images such as bucky.poly, located at the screen’s surface, where the stereoscopic parallax is small.
40By using an oscilloscope and photodiode, it was shown that the persistence of green phosphor from the projectors combined with the inadequacy of the shutter mechanism in the shutter glass technology, account for the ghosting effect. See [GARD98].41Approximately 20 guest visitors have participated in informal feedback on the qualitative features of the program.
Figure 19 - The plasma passing through the TFC's
Chapter 7
Conclusions and future workI have found that visualising the H-1NF Heliac’s CAD data in
the WEDGE using the OBJ file format in the program “wedge.exe” is an effective initial solution to the problem of moving CAD data into a virtual environment with a minimal loss of information.
The WEDGE hardware configuration was found to be a particularly suitable tool for analysis of the interior of concave models, such as the H-1NF Heliac, because the use of two screens in the “wedge” shape allows the user to turn their head in the immersive space and see different parts of the model which remain visible because of the encompassing size of the screens.
One of the major findings of this thesis has been that polygonal model representations of CAD data, such as the OBJ file format, are particularly suitable for representing the H-1NF Heliac because they are simple. There can be some minor errors introduced using this approach, which result from the triangulation process in the conversion between formats. These errors are intrinsic to the triangulation process and can only be overcome using a very fine mesh size, but this increases the complexity of the polygonal model thus reducing rendering speed. This problem can be overcome by avoiding the triangulation process altogether by using solid model, instead of polygonal model, representations. Using the solid model representations method is expected to allow better quality (although not necessarily faster42) rendering because of the smooth appearance of surfaces, but will also require the development of software that is significantly more complicated than that developed in this thesis and as such is outside the scope of a year long project.
42Refer to Chapter 6.
Frame rates well above the desired goal of ten frames per second were achieved when viewing single files of the model. However, results would indicate that the aim of achieving a rendering speed of at least ten frames per second for the complete Heliac model is not possible with the current incarnation of the program wedge.exe and the current hardware.
The most suitable models for visualisation in the WEDGE are ones which make the most effective use of the least amount of complexity, that is, models that display a lot of information with the least amount of polygons. Results from the file modification and complexity reduction components showed that it is possible to increase the rendering speed most significantly by using AutoCAD’s “welding” export option which joins nearby vertices that are superfluous, and direct modification of the source file using the converter program “Cinema4D”. Using direct file modification techniques, via the software package Cinema4D, rendering speeds of around 5 frames per second were achieved for moderate complexity files containing around 5000 polygons. The object selection and deletion component of the wedge.exe program, also turned out to be a valuable tool for correcting errors in the triangulation during file conversion.
The wedge.exe program written should provide a good basis for designing and writing future programs of this nature. The following enhancements are suggested, which are: Most importantly, to implement the solid modelling of the CAD data instead of polygonal modelling, or if not, then to purchase a 3rd-party converter program or an AutoCAD plug-in program which exports the model data directly to a polygonal format rather than going through the intermediate Cinema4D step; Secondly, enhancing the user-interface by allowing the viewer to be in control, which is possible through incorporating software which utilises the 3D mouse and head-tracker; Thirdly, development of rendering acceleration through the following techniques:Real-time view frustrum culling: Only the objects which lie in the
viewing frustrum43 are called in the glutDisplayFunc() routine. This avoids rendering unseen objects which lie behind and outside the field of view. The effect is enabled by four additional clipping planes around each viewing volume and is the predominant acceleration technique when a large portion of the model lies behind the viewer.
43Refer to section Appendix C
Rendering a separate window for each screen: The WEDGE’s graphics hardware comprises of 2 separate graphics cards (one for each monitor and projector screen). Initially the program’s output was sent as one single window spanning the full two screens. A significant speed advantage (about 4x) can be gained by rendering to two separate windows, one for each screen44.
Fourthly, writing an ASCII initialisation file to store the default settings that are used when program initialises, that are currently located in the program code’s header files, and; lastly, implementing file input/output functionality with the POLY file format and consequently, a conversion utility between the OBJ and POLY file formats.
As well, I have some recommendations for the WEDGE in general: Firstly, the software package AutoCAD should be purchased in order to view and manipulate the CAD data of the H-1NF Heliac directly on the WEDGE, rather than at the Plasma Research Laboratory where the data is currently located, which should allow faster data acquisition; Secondly, to write a user manual for the entire WEDGE system, which will be helpful for future work; Thirdly, to develop a process, possibly through the use of some “add-on” procedures, which converts an existing computer graphics program to run on the WEDGE, and lastly; To further develop the WEDGE hardware to allow the angle between the two screens to be varied to give different immersive effects. Screen angles larger than 90° would be useful for giving less immersive, panoramic views whereas angles less than 90 ° might be used to increase the already large field of view, thus increasing the effectiveness of the WEDGE.
The steps followed in this work are typical of many. Experience has shown that aspects of the work which might have been expected to be trivial have cost much effort, which has implications for the design of future applications. Overall, the project has been both exciting and informative and has shown promising indications that virtual environments are indeed suitable for engineering applications.
44This is because there are overheads associated with splitting up a windows display into 2 halves and sending each half off to it’s own graphics card.
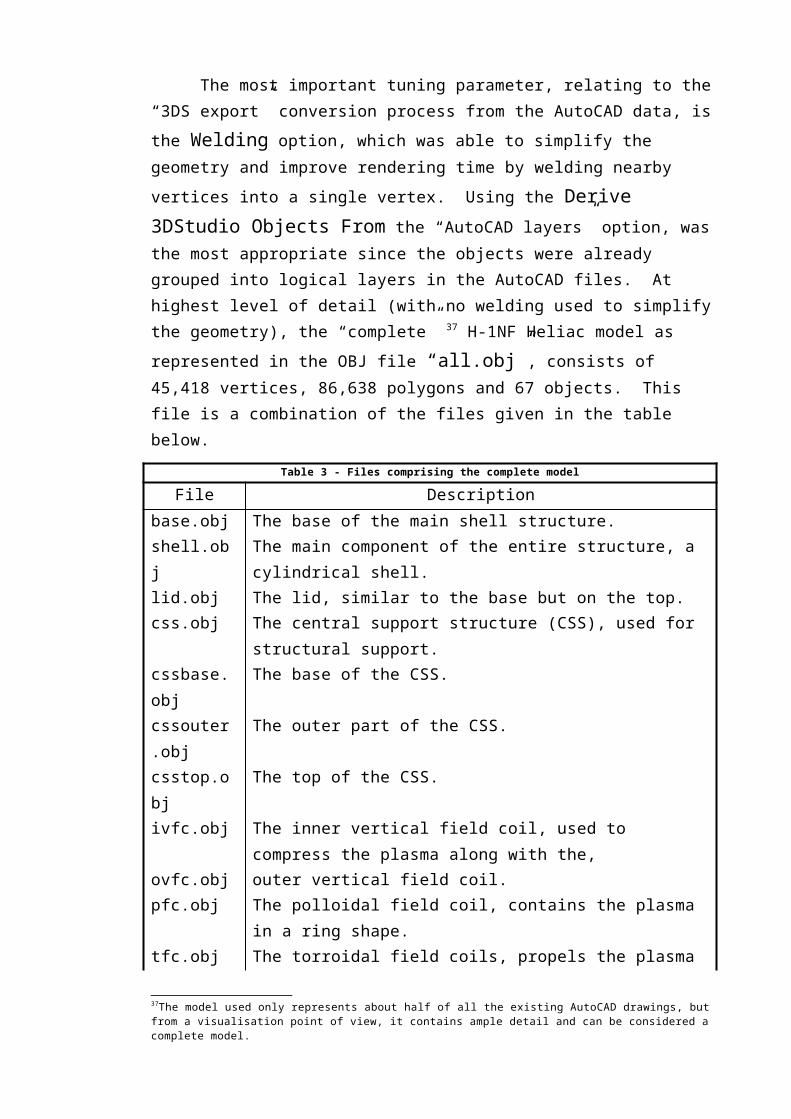
Appendix A
Low level program design : wedge.exeThe program consists of eight files:1. wedge.c2. wedge.h3. fileio.c4. fileio.h5. agv.c6. agv.h7. utils.c8. utils.h
A.1 wedge.cThis file comprises the main part of the program, it contains
the code for geometry rendering, acceleration techniques, file modification menu system initialisation. The main()procedure is in this file which is the entry point. Procedures in the other files are all accessed from this file.Initialisation
viewerInit() - Initialises material and lighting parameters. Set up the background clear-colour, enables smooth shading, depth buffering and vector normalisation.videoInit() - Called each time the stereoscopic mode is toggled. Initialise the viewing window size, position and graphics rendering quality. Switches to the appropriate stereoscopic mode, RGB colour, double buffering to remove flickering images and depth buffering for hidden surface removal. It
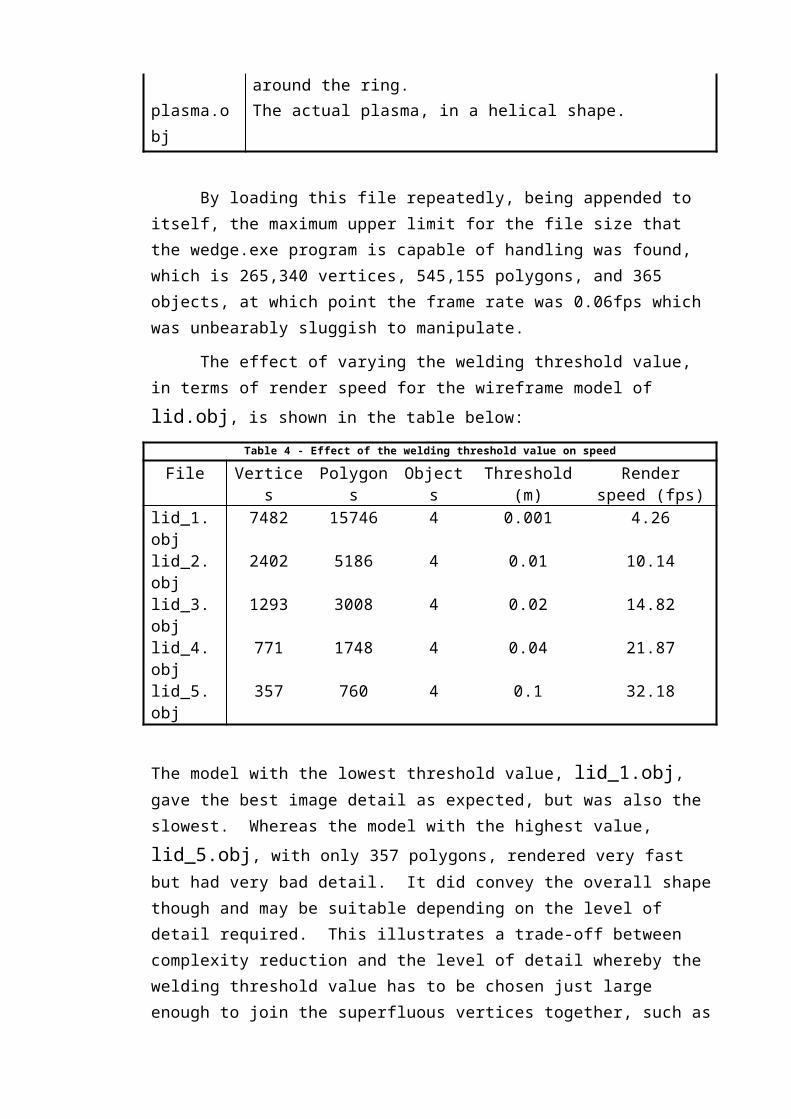
calculates the viewport and projection matrices for both 2D and 3D modes using eyePos and the pre-defined EYE_SEPERATION constant.message() - Is a procedure which prints out a usage message if the command line user input is incorrect.
Misc. geometry creation
drawCrosshairs() - Draws a grid in the X-Z plane as well as a coloured set of Cartesian coordinates. Used to help the user orient themself with the axis and user-interface.drawDebugWindow() - When debug mode is toggled on, draws a miniature 2D corner view of the WEDGE setup which helps the user see exactly where the model is in space. Also draws points on the walls where the projection point from the eye position falls perpendicularly onto the wall.drawSky() - Draws a blue hemi-sphere as a GLUquadricObj with a clip plane glClipPlane(GL_CLIP_PLANE0,(0.0,1.0,0.0,0.0)) cutting it in half, and with a white specular lightsource reflecting off it, which makes it look like a sky background.
Model data geometry creation
displayPoints() - Draws the model data as points, ie only the vertices.displayLines() - Draws the model as a wireframe, ie connect the dots.displaySolids() - Draws a fully shaded solid model by drawing filled polygons for the faces, and specifying a normal for each polygon which is necessary to calculate lighting effects.
Selection mode geometry creation
Same as above, but specifies a “name” by for each point so it can be picked by the mouse when in selection mode:for (i=0; i<totalNumObjects; i++) { glPushName(i);
Geometry rendering
This is where all the geometry is actually rendered.viewerDisplay() - Is the procedure registered as the display callback and so calls draw...Walls() for either stereoscopic or monoscopicdepending on which mode it is in. Once the geometry is rendered the screen buffers are flushed and swapped to actually display the image to screen.drawScene() - Appropriate light sources and background are switched on and their colour set. The model is then moved to the position that the user has manipulated it to by calling agvViewTransform(), from agv.c . Cross-
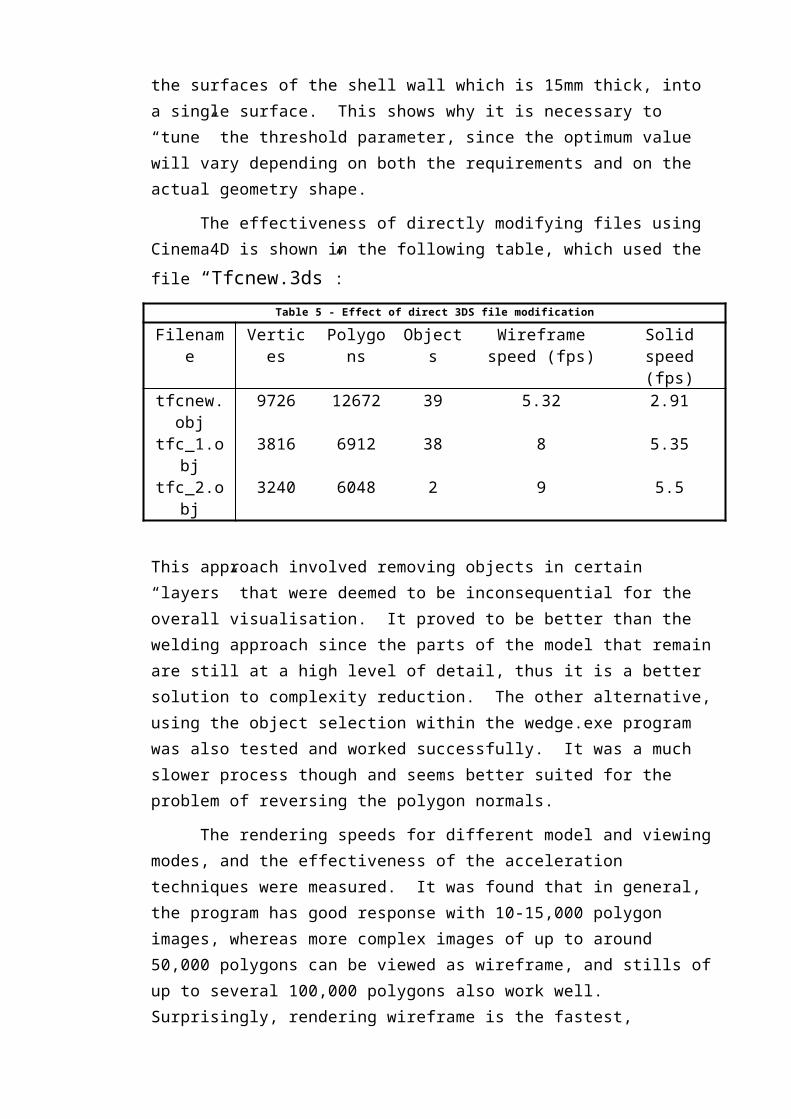
hairs if enabled are drawn next. Commands that come before the agvViewTransform are not rotated, hence the lights stay in the same position whereas the cross-hairs move with the model. The relevant object geometry generation procedure is then called, such as displaySolids(), is called depending on which mode it’s in.drawMonoWalls() - This is the core of the whole rendering process. It renders the scene on the walls. For each wall it applies a different viewport, ie the ;left wall goes on the left side whereas the right screen goes on the right. It then sets up the projection and modelview matrices, which in this case give a perspective projection, different for each wall, which was calculated in videoInit(). If debug mode is on then the projection point on each wall is drawn. Finally, drawScene() is called.drawStereoWalls() - The same as above except that two separate images are rendered, one for each slightly offset from center by half the eye separation.
Object selection
Enables the file modification component. Items can be “picked” by holding down the <SHIFT> key and clicking the left mouse button over it. The mouse handling for this is in agv.c . Once the action is initiated, the program enters “select” mode glRenderMode(GL_SELECT) and any geometry drawn is not shown but is compared with the screen location where the mouse button was pressed to see if there is a “hit”, hits = glRenderMode(GL_RENDER). If there are no hits, nothing happens, if there are several hits then they are sorted depth-wise using the sorting utility qsort() to determine which is closest item, hence which is selected. The selected item then has it’s flag set and is colour changed to blue:if (obj[hit[0].obj].f[hit[0].poly].sel==GL_FALSE) obj[hit[0].obj].f[hit[0].poly].sel = GL_TRUE;.
Menu initialisation
Handles the user input through mouse menu actions. Most of the actions possible through the menu are also possible through the keyboard, in which case the shortcut key is closed in brackets in the menu.
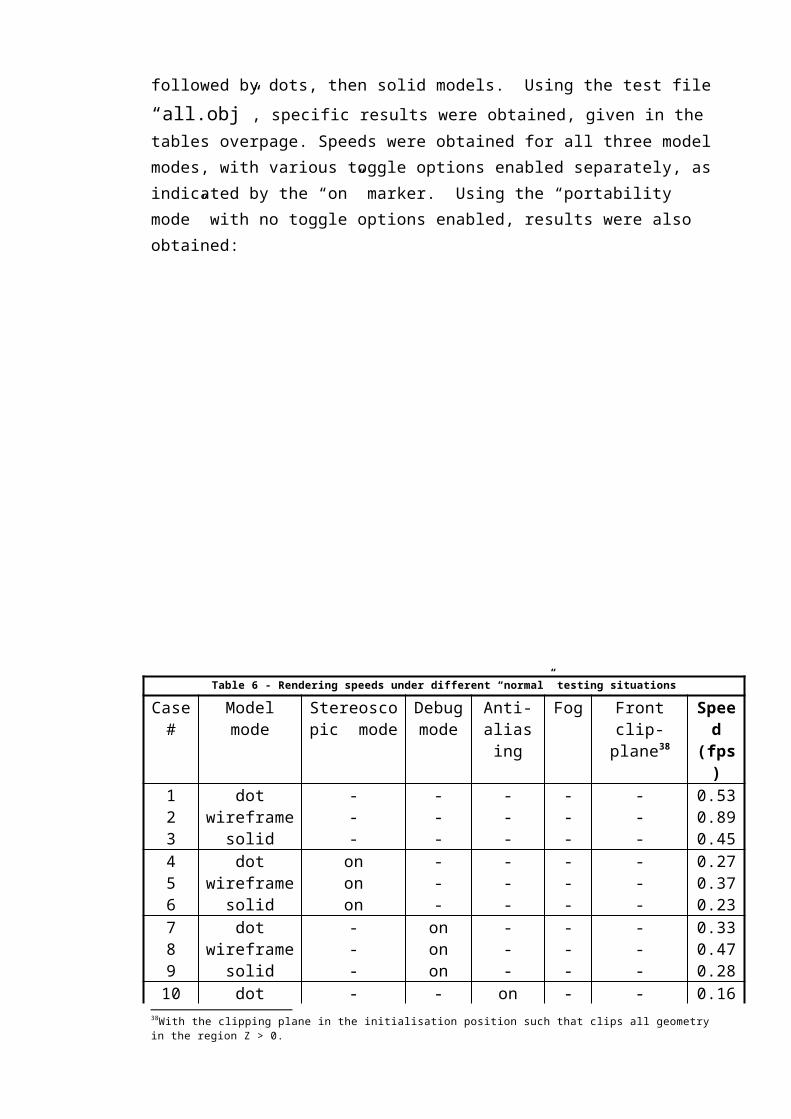
Sets up the main menu:menuInit() - Initialise the menu callback functions, attach submenus to the main menu and attach the right mouse button to activate the menu.
Sets up sub-menus:fileioHandleMenu() - OBJ file import and export commands. Once one of these commands is selected the program expects user input through the console and so the user has to switch from the program to the DOS console by typing <ALT>-<TAB> once. The file name is then specified and clicking on the program window returns to it. Alternatively, the user can iconify the window through the main menu command.renderHandleMenu() - Select the type of rendering: dots, wireframe or solid. Also allows automated rotation around all the axis.backgroundHandleMenu() - Change the background colour.light0ColHandleMenu() - Change Light0’s colour between RGB and white.light1ColHandleMenu() - Same for Light1.lightingHandleMenu() - Attach separate light sub-menus plus can toggle lighting specularity.selHandleMenu() - Selection mode options: delete items, reverse polygon normals or clear currently selected items.toggleHandleMenu() - Options that can be toggled on and off: debug mode, stereoscopic mode, render cross-hairs (grid), anti-aliasing which makes lines brighter, and enable fog.viewerHandleMenu() - The main menu, other sub-menus are attached to it as well as the glutIconifyWindow() command.
Restart main window
restartVideoMode() - Once the stereoscopic mode is toggled the program essentially has to be restarted again because all the functions rely on the a video mode being set initially. The only part which doesn’t have to be restarted is reading in the model data.
Main procedure
This is the main procedure of the whole program. It calls all the initialisation functions, then starts up the program with default settings, it then creates the pop-up menu,

registers the other callback functions and finally enters the main idle loop.
Call initialisation procedures and start up the program:Call videoInit()Call viewerInit()agvInit() - Initialise the user-interface, from agv. cCall menuInit()importObj() - Import an OBJ file to start the program with, from fileio.c
Sets up callback functions:glutDisplayFunc(viewerDisplay) - Registers the display callback which is called every time there is something new to be drawn to the screen.glutIdleFunc(agvHandleIdle) - Registers the idle function which is called continuously once the mainloop is entered., from agv.cglutMouseFunc(agvHandleMouse) - Handles mouse button actions and also modifiers like the <SHIFT> key, which might be pressed at the same time, from agv.cglutMotionFunc(agvHandleMotion) - Handles mouse motion when the mouse is moved while the button is pressed, from agv.cglutKeyboardFunc(agvHandleKeyboard) - Handles keyboard actions, from agv.c
Enter glutMainLoop() - which is only stopped when the program is exited.
A.2 wedge.hContains the constant definitions, prototypes and a type definition hitType for object selection, used in wedge.c .
A.3 fileio.cThis file implements the fileI/O functionality, in particular, the interface with the OBJ file format. The user can specify the name of the file to be viewed as a command-line-parameter, or can import the file once the program is started. Files are loaded from either of two locations:· Firstly, a sub-directory “..\data” to the executables directory
is searched.
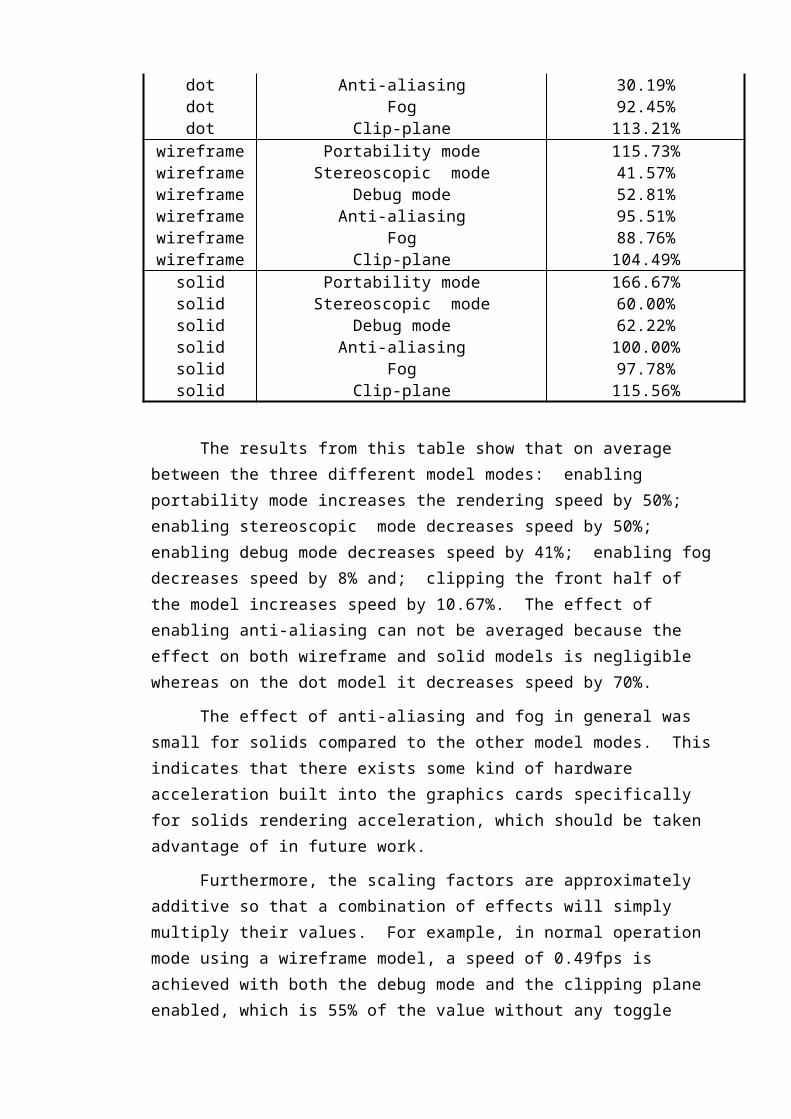
· Secondly, an absolute directory path is searched which points to a directory where some OBJ files are known to be located, such as “C:\WEDGE Demos\.”, which is specified in fileio.c .
The data is then read into appropriate data structures by parsing through the file according to the file format’s structure .
The output file name is input by the user from stdin. The model’s object grouping structure (as represented in the file data), is changed when written to file to make the file more readable - in effect “cleaning-up” the file. Conversion between the two file formats is possible by importing from one format and exporting to the other. Note that when a file is imported it is overlayed so that it’s own coordinate axis is centred on the existing axis (wherever it may currently be due to the user’s manipulation). This is necessary when viewing files from the Heliac library because they all share a common axis system.Initialisation
Set up global variablesInitialise data structures
Print info procedures
Prints out the file information, the number of verticies, polygons, and objects, to standard output stdout.
Transfer array data
createArrays() - Transfers the data from the linked lists to the fixed length arrays. If a file is being imported (appended) then freeArrays() is called.freeArrays() - Called once a new file is appended to an existing file. It clears the existing array data for use with the newly loaded data.
Import OBJ file
Parse through the OBJ file and store all the data into the appropriate data structures used to generate the geometry in WEDGE.c
Export OBJ file
Export the model to an OBJ file. the name of the export file is requested from the user from sdtin.
FreeAllArrays
Clears all the memory used by the program, including the linked lists, fixed length arrays, and temporary pointer variables.
A.4 fileio.hContains the constant definitions, prototypes, and type definition used in fileio.c . It contains the important typedefs for the linked lists vTypeobjectType
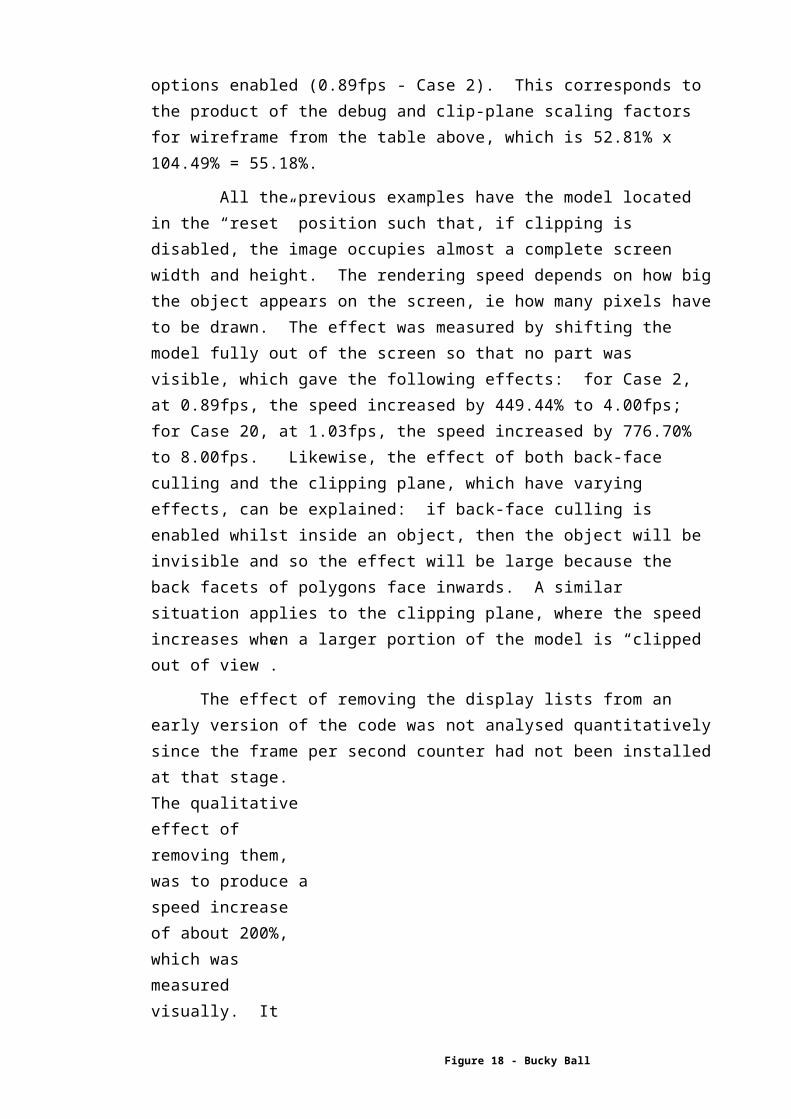
faceType, and also contains the typedefs of the fixed length arrays vArrayTypeobjectArrayType
faceArrayType.
A.5 agv.cThis file is an AGV (A Graphics Viewer) which implements the user interface. Once the viewers parameters are initialised then only the agvViewTransform() procedure has to be called to implement a viewing transformation.Initialisation
Set up global variablesSpecify initial speed, position and directionInitialise rotation matrices
Keyboard handler function
Set up keyboard handling function for the flight control keysSpecify certain flight control key callbacksIf a key is pressed then modify the global variables (speed, direction)Form a rotation matrix to rotate the aeroplane to the specified direction
View transformation
Calculate the viewing transformation of the scenario from current position, direction and speed. Uses the gluLookAt() procedure.
Reset co-ordinates
Resets plane speed, position and direction
Idle function
Set up idle function which is always running. modifies position
A.6 agv.hContains the constant definitions, prototypes, and type definitions used in agv.c .
A.7 utils.cThis file contains utility functions used by other parts of the program, such as tedious matrix and vector multiplication.vector structure
Defines a 3D vector structure vec3, as an array of 3 Glfloats. Similarly for 4D structs.
matrix Defines a 3x3 matrix.
structureidentity matrix
Defines an identity matrix with the values already allocated.
assign3 Stores one 3D vector into another.assign4 Stores one 4D vector into another.negate3 Changes the sign of each element in the 3D
vector.negate4 Changes the sign of each element in the 4D
vector.assignMat3 Stores a 3x3 matrix into another.assignMat3 Stores a 4x4 matrix into another.vecAdd3 Adds two 3D vectors.vecSub3 Subtracts a 3D vector from another.vecDiv3 Divides a 3D vector by a scalar.vecMul3 Multiplies a 3D vector by a scalar.matVecMul3 Multiplies a 3x3 matrix by a 3D vector.matVecMul4 Multiplies a 4x4 matrix by a 4D vector.matMul3 Multiplies a 3x3 matrix by another.matMul4 Multiplies a 4x4 matrix by another.dotProd3 Gives the dot product of a 3D vector.vecLength3 Gives the magnitude of a 3D vector.normalize3 Normalises a 3D vector.nCrossProd3 Finds the cross-product of a 3D vector with
another, then normalises the result.printVec3 Prints a 3D vector to stdout.showMessage
Displays a message on the screen using glutStrokeCharacter().
A.8 utils.hContains the constant definitions, typedefs, external variables, prototypes of all the utility functions for utils.c .
Appendix B
User interface controls Gives a complete listing of all the user-interface functionality.
B.1 Keyboard controlsTable 9 - Functionality of Keyboard input
Key Descriptionq Toggle dot model modew Toggle wireframe model modee Toggle solid model mode1 Toggle rotation around X-axis2 Toggle rotation around Y-axis3 Toggle rotation around Z-axis- Decrease rotation speed+ Increase rotation speedr Reset coordinatesd Toggle debug modes Toggle stereo modec Toggle cross-hairsa Toggle anti-aliasingg Toggle fogf Display fps counterh Toggle clipping planei Iconify the window
<ESC>
Quit program
B.2 Mouse controlsTable 10 - Functionality of mouse input
Modifier key
Left button Middle button Right button
None X and Y translation
Z translation and scaling
Reserved solely
<CTRL> X and Y rotation
Z rotation for

<SHIFT> Select object unused menu control
B.3 Menu layoutThe pop-up menu functionality is given below:
1 Main menu1.1 FileI/O menu
1.1.1 ImportObj1.1.2 ExportObj1.1.3 Clear all model data
1.2 Render-options menu1.2.1 Toggle dots mode (q)1.2.2 Toggle wireframe mode (w)1.2.3 Toggle solid mode (e)1.2.4 Toggle rotate around X-axis (1)1.2.5 Toggle rotate around Y-axis (2)1.2.6 Toggle rotate around Z-axis (3)1.2.7 Decrease rotation speed (-)1.2.8 Increase rotation speed (+)1.2.9 Reset coordinates (r)
1.3 Lighting menu1.3.1 Background
1.3.1.1Choice : Red, Green, Blue, White, Black or “Sky”.
1.3.2 Toggle specularity 1.3.3 Toggle light 0
1.3.3.1Choice : Red, Green, Blue, “Steel” or White1.3.4 Toggle light 1
1.3.4.1Choice : Red, Green, Blue, “Steel” or White1.4 Selection-mode menu
1.4.1 Delete1.4.2 Reverse1.4.3 Clear selection1.4.4 Selection box size
1.5 Toggle-options menu1.5.1 Toggle debug mode1.5.2 Toggle portability mode1.5.3 Toggle stereo mode1.5.4 Toggle fps counter1.5.5 Toggle cross-hairs1.5.6 Toggle anti-aliasing mode1.5.7 Toggle fog mode1.5.8 Toggle front clipping plane1.5.9 Toggle back face culling
1.6 Iconify window (i)1.7 Quit (esc)
Appendix C
Relevant file formats and programming languages
Mentioned here are other file formats and programming languages either referred to in the body, or which are generally relevant to this topic and may be of use in future work.
Table 11 - Relevant file formats
Format name
Details
DXF DXF is an ASCII file format. It is mentioned here because of it possible use for obtaining solid modelling data through the following approach:· Start off with a release 13 or release 14
version of DXF file.· Decrypt the solid modelling components by
“binary XOR’ing” the file with the number 95. Yes...
· This will provide a new file which is in the SAT format.
· The rest of the details for using the SAT file format to retrieve solid modelling information is given below.
· “ACIS” SAT
This is the format created for the solid modelling toolkit called “ACIS”, by Spatial Technologies. It is an object-oriented format which models solids with the Boundary-Representation technique, which lends itself well to being parsed by a recursive programming language such as LISP. The actual method for rendering solids from this type is very complicated & is well beyond the scope of this project. For further information refer to [SPAT98].
VRML An alternative approach to modelling the data, which uses higher level programming primitives than OpenGL but is not as powerful.

· It is an ISO standard, supported by many 3D CAD systems.
· It has good basic navigational facilities, which are the property of viewer software, not the standard. A good feature is the touchsensor facilities for interfacing 2D pointing devices to 3D.
· It allows hierarchal structures.· It contains a few simple solids, but is not true
CSG.· It relies on polygonal representation of
arbitrary surfaces (no parameterized curved surfaces), but enhancements for minimizing facet artefacts - implicit smooth shading, extrusions and varying level of detail
· variety of VRML editors exist
The relevant programming languages which might be used for future development of solid modelling are given below,
Table X : Relevant programming languagesLanguage DetailsLISP and AutoLISP
AutoLisp is based on the common LISP language, widely used in artificial intelligence applications. As a subset of the LISP language, AutoLisp derives the majority of its functions directly from the LISP language itself. LISP excels at working with lists, which is exactly the type of information used in AutoCad. LISP is among the easiest of all programming languages to learn. AutoLisp programs are written in any text editor such as DOS EDIT or in Windows NOTE PAD. For further information see [METR98].
Scheme Is an algorithmic language also suitable for parsing through SAT files. Refer to [CLIN98].
Optimiser Is an optimised version of OpenGL which incorporates many acceleration techniques that makes it run faster.
C.1 Wavefront Object (OBJ) file formatOBJ files define the geometry and other properties for objects
in Wavefront's Advanced Visualizer. OBJ files can also be used to transfer geometric data back and forth between the Advanced Visualizer and other applications. OBJ files are in the ASCII format. The OBJ file format supports both polygonal objects and free-form
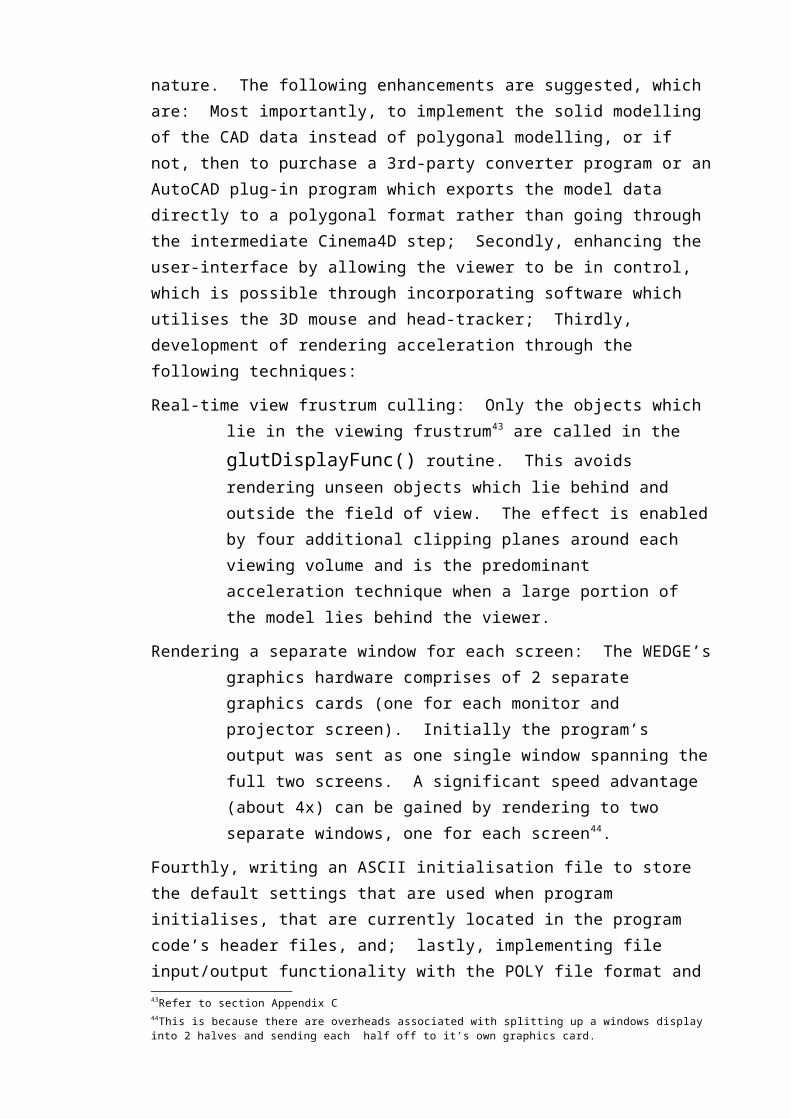
objects. Polygonal geometry uses points, lines, and faces to define objects, while free-form geometry uses curves and surfaces.
Table X : Data recognised in the OBJ fileStructure
typeData type Syntax
Vertex data Geometric vertices “v” v x y z wVertex data Texture vertices “vt” vt u v wElements Face “f” f v1/vt1 v2/vt2 v3/vt3Grouping Group name “g” g group_name
Geometric vertex: Specifies a geometric vertex and its x y z coordinates. These are floating point numbers that define the position of the vertex in three dimensions. w is not required for non-rational curves and surfaces, the default is 1.0. Vertex reference numbers are incremented continuously as the entities are encountered throughout the file.
Texture vertex: Specifies a texture vertex and its coordinates. We are not concerned with any of it’s argument.
Face: Polygonal geometry statement. Specifies a face element and its vertex reference numbers. You can optionally include the texture vertex. The reference numbers for the vertices and texture vertices are separated by slashes (/), there is no space between the number and the slash. A minimum of three vertices are required. Face elements use surface normals for shading. If vertices are ordered counterclockwise around the face the normal will point toward the viewer. If the vertex ordering is clockwise, it will point away from the viewer.
Group name: Specifies the group name for the face elements that follow it.
Shown here is an excerpt of a file which has been modified to give a representative sample of the entities provided by the OBJ file format. This excerpt contains segments from the objects which
# WaveFront *.obj file# (generated by Cinema4D)
g Cylinderv 250.841064 201.64209 245.292603v 250.841064 401.64209 245.292603v 263.782013 201.64209 246.996307
f 1 3 4 2f 3 5 6 4f 5 7 8 6
g Cylinder Cap_1v 250.841064 201.64209 245.292603v 263.782013 201.64209 246.996307v 275.841064 201.64209 251.991333
f 73 50 49f 73 51 50
g Cylinder Cap_2v 250.841064 401.64209 245.292603v 263.782013 401.64209 246.996307v 275.841064 401.64209 251.991333
f 74 75 98f 75 76 98f 76 77 98
g Pyramidusemtl New_1v -399.909882 -2.094208 298.867645v -199.909882 -2.094208 298.867645v -199.909882 -2.094208 98.867645v -399.909882 -2.094208 98.867645v -299.909882 197.905792 198.867645
vt 0.625 0.695913vt 0.875 0.695913
f 446/2 449/5 447/3f 445/1 449/5 446/2f 445/1 446/2 447/3 448/4
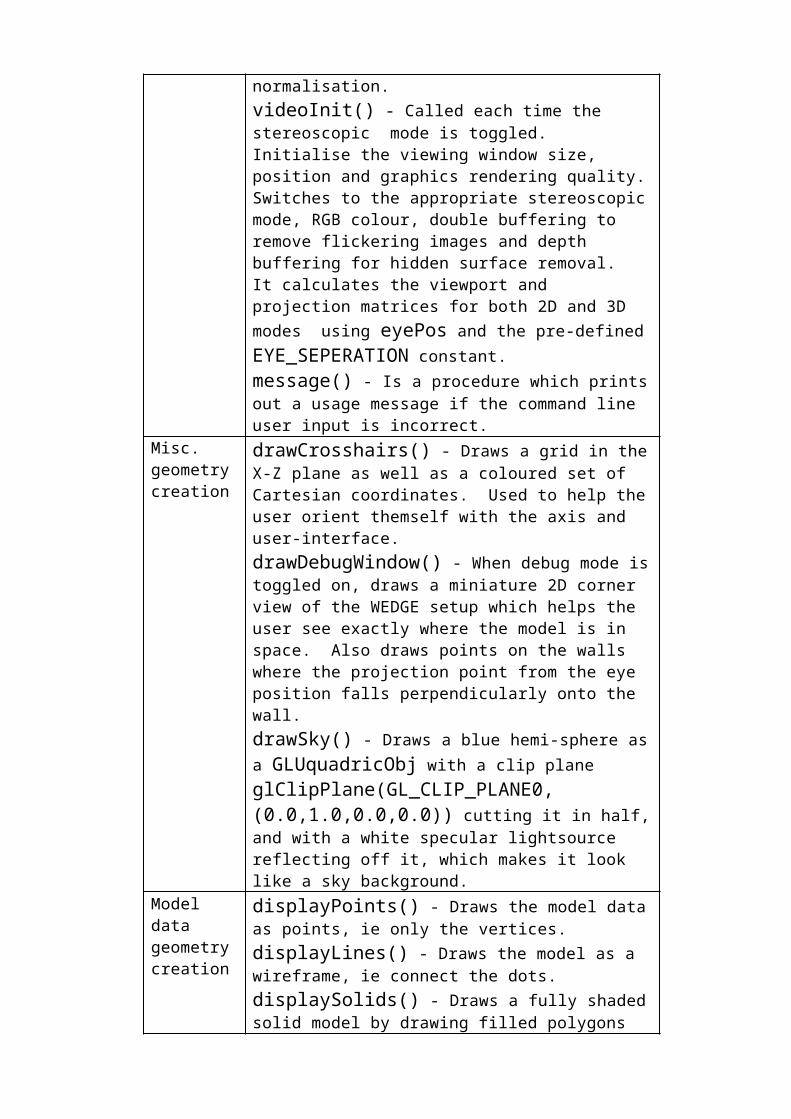
model a cylinder and a textured pyramid. Note that the “usemtl_New_1” entity (which specifies the type of material to be used for the object “Pyramid”) is ignored. The “vt” entities are only used to specify the format of the readLine() function used on the following “f” entities, their actual parameters are ignored.
C.2 OpenGLRendering in computer graphics programs is generally done
by registering a “display callback function” which is continuously called in an idle loop once the program is started.
OpenGL commands use the prefix gl and initial capital letters for each word making up the command name, such as glClearColor().
OpenGL is a state machine. You put it into various states (or modes) that then remain in effect until you change them. The current colour is a state variable, you can set the current colour to white, red, or any other colour, and thereafter every object is drawn with that colour until you set the current colour to something else. The current colour is only one of many state variables that OpenGL maintains.
Drawing on a computer screen is different from drawing on paper in that the paper starts out white, and all you have to do is draw the picture. On a computer, the memory holding the picture is usually filled with the last picture you drew, so you typically need to clear it to some background colour before you start to draw the new scene.The following routines are used to register callback commands that are invoked upon user input:· glutReshapeFunc() indicates what action should be taken when
the window is resized.· glutKeyboardFunc() and glutMouseFunc() allow you to link a
keyboard key or a mouse button with a routine that's invoked when the key or mouse button is pressed or released.
· glutMotionFunc() registers a routine to call back when the mouse is moved while a mouse button is also pressed.
For all OpenGL applications, you need to include the gl.h header file in every file. Almost all OpenGL applications use GLU, the OpenGL Utility Library, which requires inclusion of the glu.h header file & . So almost every OpenGL source file begins with #include<GL/gl.h>, #include<GL/glu.h>
The following explains why display lists are supposed to be better, from “OpenGL Programming Guide”, [ADDI97]:“To optimize performance, an OpenGL display list is a cache of commands rather than a dynamic database. In other words, once a
display list is created, it can't be modified. If a display list were modifiable, performance could be reduced by the overhead required to search through the display list and perform memory management. As portions of a modifiable display list were changed, memory allocation and deallocation might lead to memory fragmentation.”
Appendix D
Hardware description and specifications
D.1 Computational engineRendering is done on an “Intergraph TDZ2000” Intel based
PC with enhanced graphics capabilities. Two graphics cards are used, one for each screen. The cards allow specialised hardware rendering acceleration which is particularly suited to OpenGL. High resolution images are enabled on the graphics cards so that the full display is 2560 x 1024 pixels (1280 x 1024 each screen). A large amount of system RAM is used because it is necessary for the Windows NT operating system used. The system specifications are given below:· CPU - dual PII 300MHz· RAM - 256MB· 2 x Graphics Card - Realizm2 (1600 x 1200 pixels each)· 2 x Monitor - 21in generic multisync monitor· Hard disk - 2GB Ultra-Wide SCSI· 32x speed CD-ROM· Network Interface Card - Ethernet
D.2 ScreenThe screen frame is made of aluminium which is non-ferrous
and so does not interfere with electromagnetic equipment. It is formed by two 1.5m square, rear projection screens oriented at 90 degrees to each other. The structure is raised off the ground a
height of 1m and rises to 2.5m which locates the viewers eye point at roughly the middle (for average 180cm tall person).
The actual screen material is made of plastic, made by the Sydney based company “Screen Technics”. It comes in one part which is heat joined at the corner seem which is visually pleasing. The material becomes fairly rigid under tension especially the corner seem where it is important that it be straight and yet flexible should the screen angle need to be changed. Tensioning is achieved by a series of grommet holes around the edge and at the back of the corner seem, through which a light duty string has been looped. Issues involved with the screen are:· Lightness and rigidity of screen and frame structure.· Easily demountable and transportable.· Reflectance of light off one screen from the other near the
vertex region.· Stable base.· That it be appropriately sized to give adequate fov to a standing
viewer.· Raised off the ground so that the user’s peripheral vision falls on
the ground which avoids motion-sickness?· Overall, that it looks neat and visually pleasing.
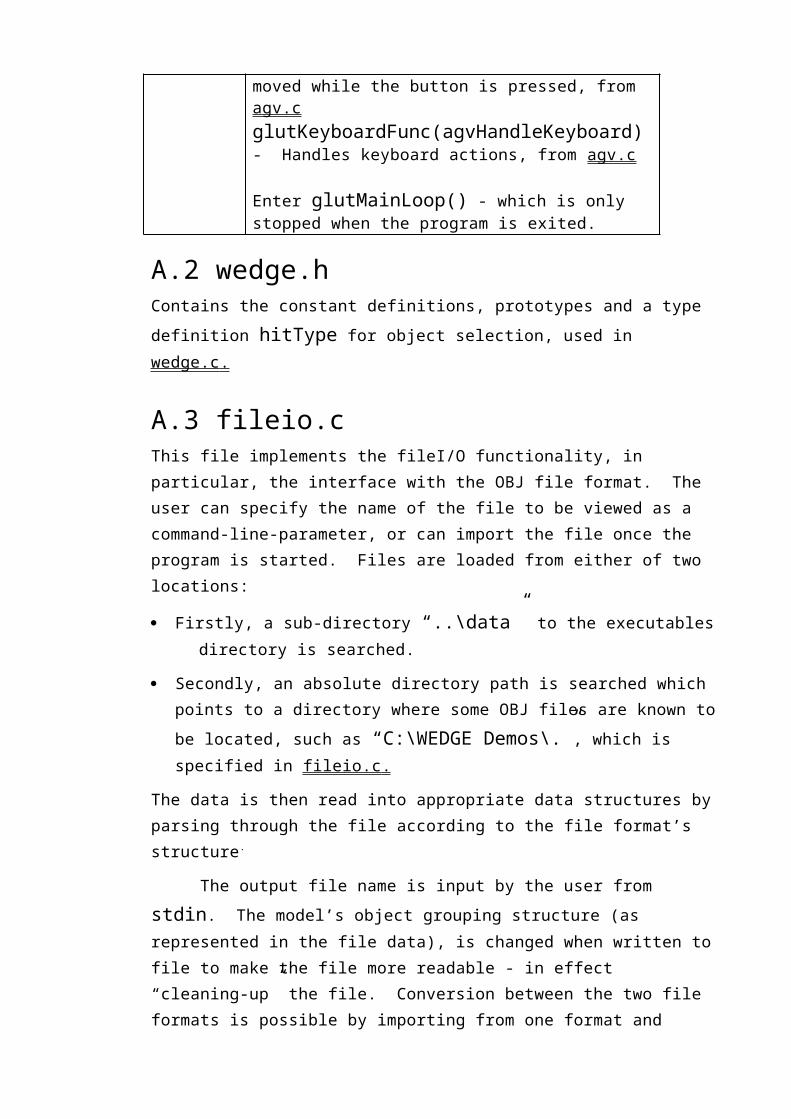
D.3 ProjectorsTwo projectors are used. They are mounted on trolley frames which have wheels and which also have adjustable bolts for levelling the projectors and adjusting height when put into the permanent
position.
The specifications are:· NEC MultiSync XG-750G 3-lens projector· Weight 65 Kg each· The WEDGE currently uses 120Hz but they are capable of
160Hz.· lumensIssues involved with the projectors are:· They are difficult to transport due to their weight and size.· Where to house the equipment, since projectors have to be
positioned roughly 3m back from the screen to give the projected 1.5m square region and so the entire setup requires a lot of floor space.
· Projectors are mounted on solid bases so they don’t move.· Greater brightness, in lumens, and higher refresh rates are
desirable but increase their price.

· Edge matching of the projected displays at the corner seam of the screens is important to create a continuous display as viewed from inside The WEDGE.
· Projectors require frequent re-tuning to maintain alignment of the displayed screen with the physical screen corners and to minimise other distortions. This can be easily done by an audio-visual technician.
D.4 Shutter glassesThe are several shutter glasses used which are all
commercially available, the most expensive are the CrystalEyes $A1,000, and the cheapest are V-Rex which are $US30. They are synchronised with the projector’s stereoscopic images via three IR transmitters around the frame. Although they are not very heavy or cumbersome they do tend to darken the image due to shutting out half of the light from each cycle. The range of the glasses is well beyond the WEDGE’s immersive area in a direct line of sight with the IR transmitters. Specifications are:· CrystalEyes Shutter Glasses.· Interleaved at 60Hz for each eye.
D.5 Infra-red transmittersUsed to synchronise the refresh rate of the shutter glasses
with the projectors. Specifications are:· CrystalEyes IR Transmitter
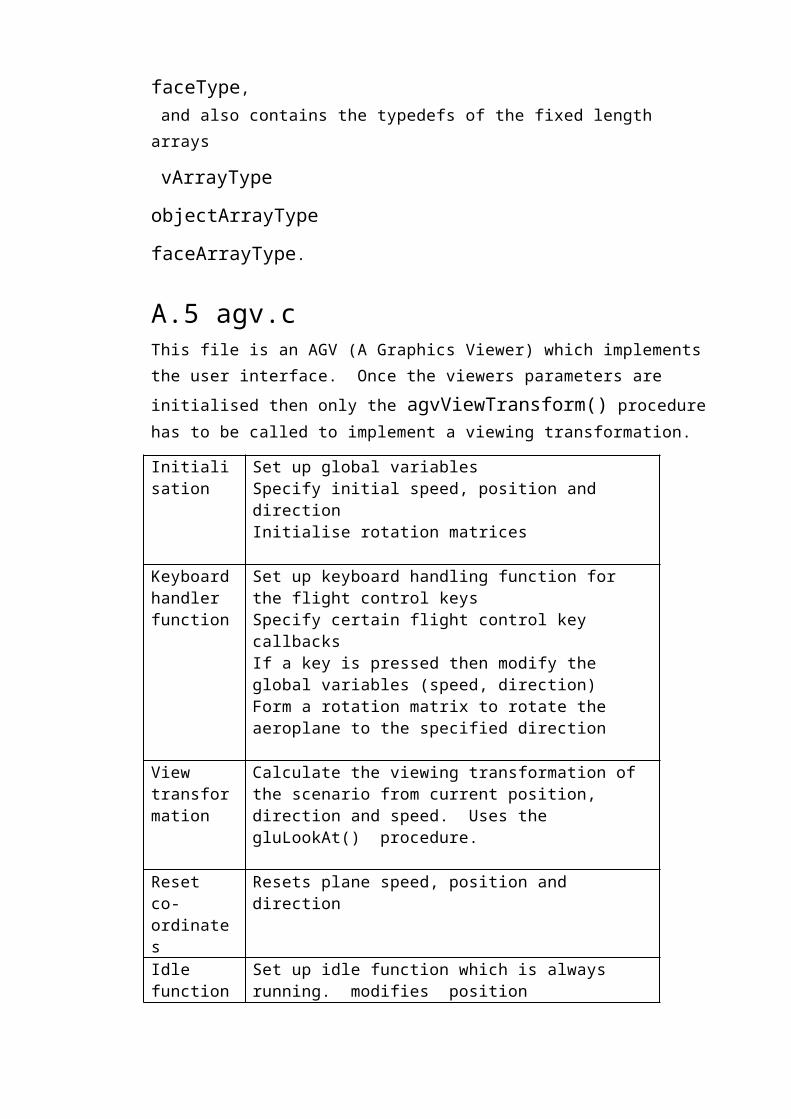
· Variable interleaving frequency (up to ????).
D.6 Graphics splitters
Splits the signal up into the red, green and blue components which are necessary for each of the three lenses of the projectors. Two Quest VGS2 graphics splitters are used which convert a HD15 to a BNC cable.
D.7 Input devicesInput is currently via the keyboard, a standard 2D desktop
mouse, a Logitech 3D mouse and a head-tracker. Both the 3D mouse and head-tracker were purchased together in a package by “Logitech”. They both use the same ultra-sonic transmitter which is located above the centre of The WEDGE and have ultra-sonic detectors. The transmitter has a conical range of about 5ft extending downwards. The controller box for the transmitter, the
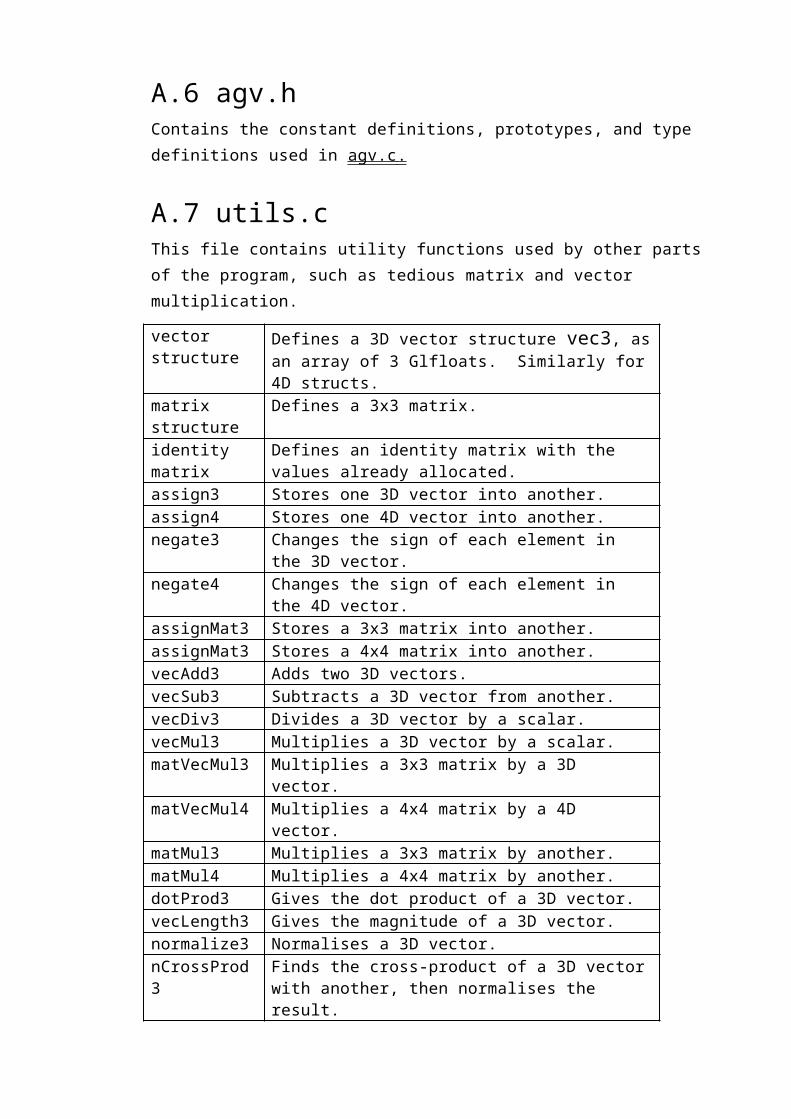
3D mouse and the head-tracker is located external to the computer and is mounted on the screens frame. Specifications are:· Keyboard - Normal computer operation plus some controls
during my programs run-time.· Standard 2D desktop mouse - Used for input in normal
programs such as windows. Used exclusively by my program.· 3D mouse - The mouse allows six degrees of freedom, three
translation, three rotation, and has three buttons. It is suggested that the tilt rotation (around Z-axis) be disabled because it does not increase the functionality and only tends to confuse the user.
· Head-tracker - The head-tracking device is attached to the top of a baseball cap which is obviously worn on top of the head. It is used to track both the viewer’s head’s position and orientation. More than one head-tracked viewer is possible through development in the software layers45, and also if hardware refresh rates permit.
D.8
Cabling and other componentsCabling is necessary to make the following connections:· RS-232 cable - Connects computer to Logitech controller box.· RGB co-axial cables - From graphics splitters to projectors.· Twisted pair - Connects computer to the network.
45Multiple head-tracking is enabled in the software layers by equally time-multiplexing the images displayed between the total number of viewers.

Appendix E
Stereoscopic renderingThe illusion of 3D stereoscopic images is created in computer
graphics software by rendering two separate, two dimensional images which correspond to the slightly offset perspective projections of each eye. The user, by wearing a pair of LCD shutter glasses which multiplex in time the two images.
Stereoscopic parallax is the among of convergence of the eyes which indicates to the brain the effective distance of an object from the eyes. By interleaving the left and right eye images fast enough the brain is fooled into believing that the object is at a distance other than where the image is actually being displayed which is the monitor or projector screen surface. Motion parallax occurs when the viewpoint move and the brain “interpolates the images between the two endpoints, thus creating a mental 3D map of the model.
A stereoscopic image is seen by looking at a point in space where the object is perceived to be rather than looking at the screen surface. In other words, if the object is right in front of you, you need to look at that point cross-eyed. Some viewers have claimed that after a while of looking cross-eyed at the image they can feel the onset of motion-sickness, which indicates a possible endurance limit for viewing the WEDGE.
The 3D effect can be achieved with just a single monitor or projected screen. By adding other screens in configurations which surround the viewer, the feelings of enclosure, “immersiveness” and hence of 3D realism are increased. The quality of the 3D effect achieved is dependent on 4 main factors:1. The orientation, size and number of viewing screens, and where
the viewpoint is located in relation to the screens, which
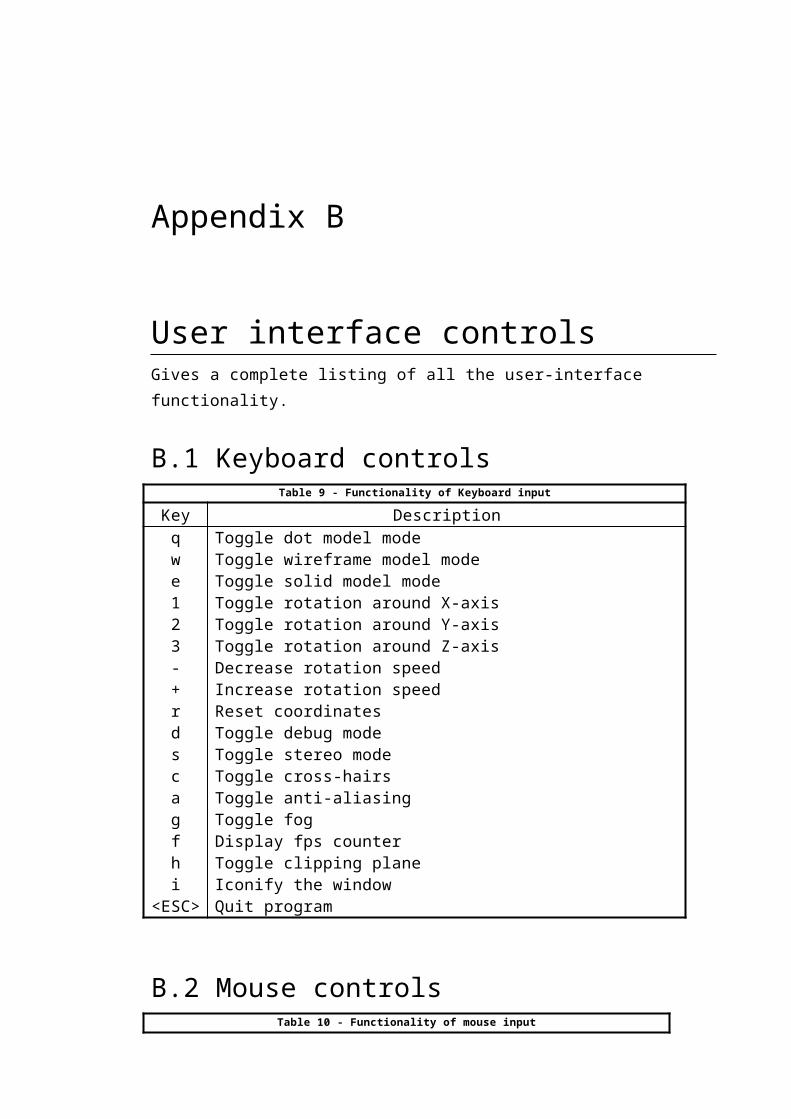
affects the “immersiveness”.2. The resolution of the display.3. The type of image being displayed, such as colour, depth, and
size, which can have various physiological effects4. The speed of the computational engine that renders the scene,
which affects the speed at which a single image “frame” can be redrawn, which in turn, is dependent on the image complexity.
An Immersive Projection System, such as the WEDGE or CAVE, is ideally suited to the collaborative nature of most of the science and computing faculties where it is common for research to be undertaken in pairs or groups. Each person can wear a pair of shutter glasses and can therefore see the 3D scene. Only one user will see the correct 3D perspective projection however, which is calculated for that person’s viewpoint. The others will see a distorted view unless they make an effort to follow the first one’s movements. This limits the ability for users to collaborate actively with other user, but a way around this is to time multiplex each persons view which is generally limited by the display rate of projector technology and hence the cost.
The WEDGE’s two screen configuration achieves an immersive effect by increasing the viewer’s field-of-view (fov). With the viewpoint located at the outer corner there is a 90 degree fov which is made by a line of sight from the viewer’s eyes to the outer side edges of the screens. This is comparable to an approximate 30 degree fov for standard 15 inch desktop monitors. As the user moves inside the WEDGE space towards the vertex the fov increases and so increases the immersiveness, which is the main reason underpinning the use of two screens.
Informal testing, has shown that the depth cues in the images displayed by wedge.exe, which is the key factor making virtual environments particularly suitable for visualisation, are created by: most significantly, stereoscopic and motion parallax; Secondly, depth in the actual geometry, such as objects extending from near the viewpoint to far away; Using two screens instead of just one, which increases the immersiveness of the scene, which is relevant to, lastly; using two screens in a right angle configuration such that the viewers attention is directed towards the vertex where the slope of the screens recedes away from the viewpoint and aids in the comprehension of three-dimensional images because the apparent stereoscopic distance, as perceived by the
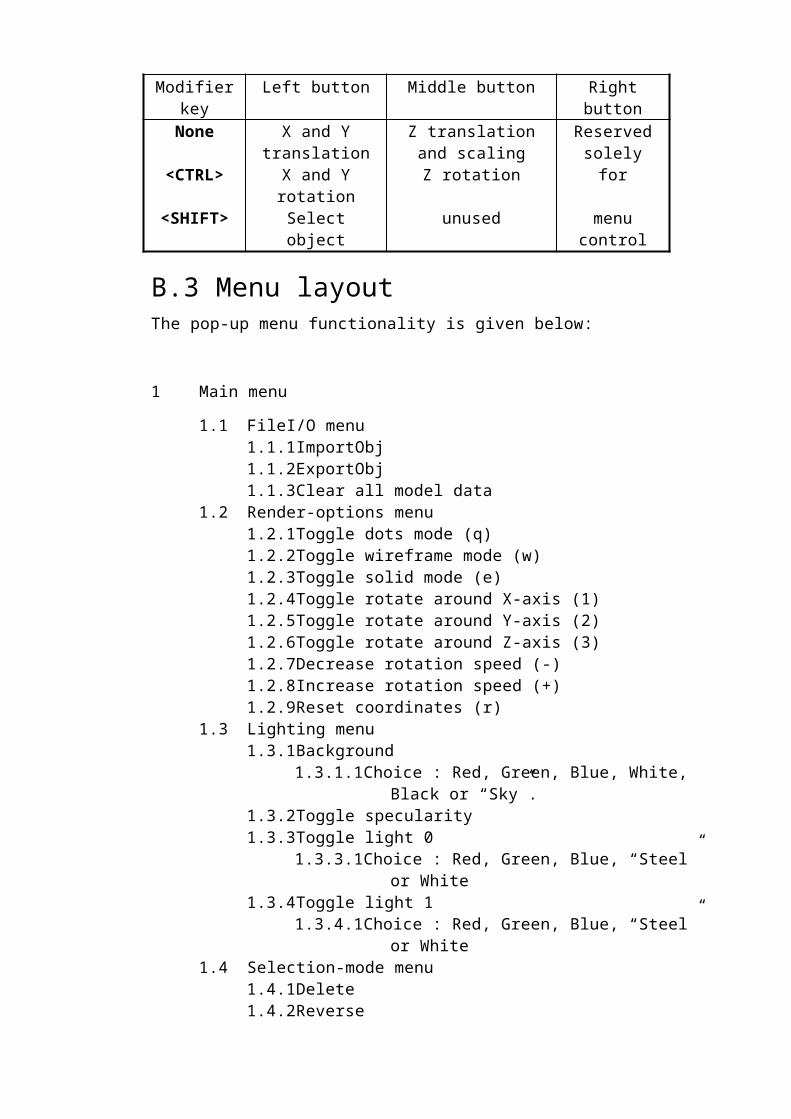
brain, corresponds more closely to the distance judged by the eye’s focussing mechanism.
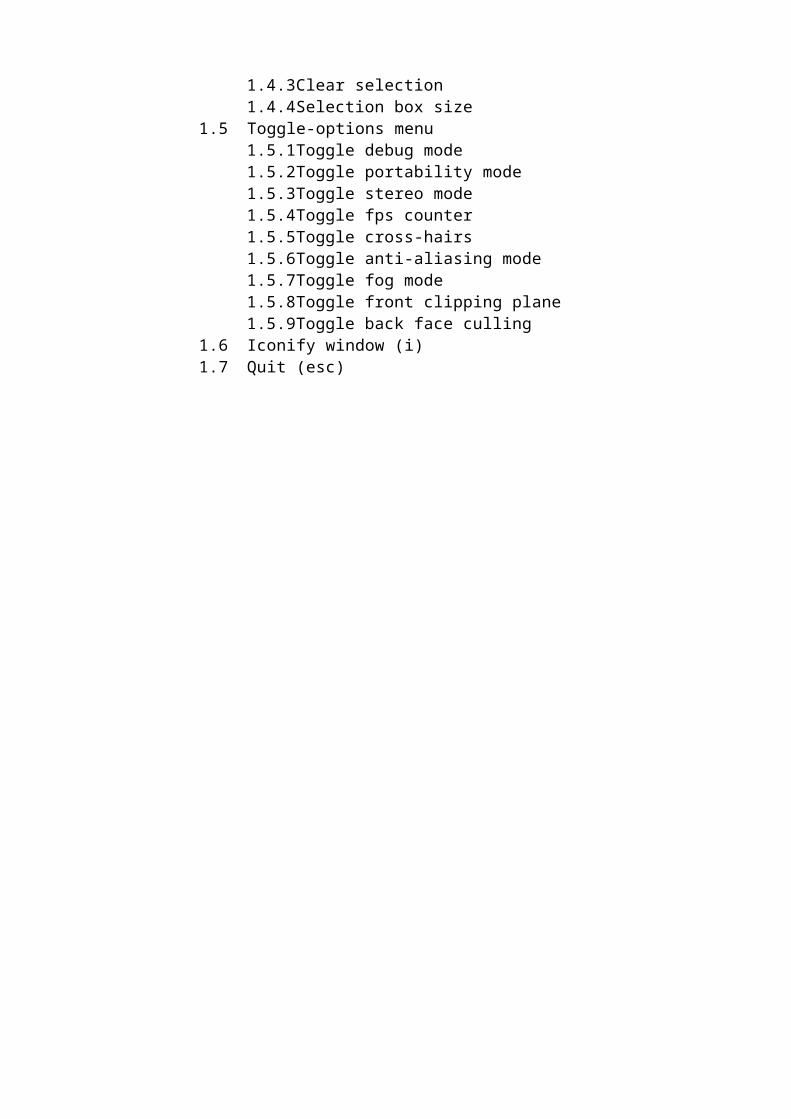
Appendix F
Program codeThe details of the program “wedge.exe” and it’s source code files are given below:(On the WEDGE)· Source files: F:\people\alan\develop\heliac\*.c *.h· DevStudio46 compiler: C:\Program Files\DevStudio\SharedIDE\bin\
msdev.exe· DevStudio workspace file: C:\Program Files\DevStudio\
MyProjects\VR\vr.dsw· Executable file: F:\people\alan\develop\wedge.exe
F.1 InstallationTo install the program follow these instructions:· Make sure all hardware connections are made and properly
configured (and the computer is on).· If viewing stereoscopic images switch on shutter glasses.· Check that the files required to be viewed are either in the
executable’s directory or in a subdirectory called “.\data”.· To compile a new version of the program, start Microsoft
Developer Studio and load the workspace file as indicated above, then “build all”, or;
· From within the filemanager, double click on an existing “wedge.exe” icon, then follow the instructions in the message screen in the program console.
46Microsoft Visual C++ Developer Studio

A DISKETTE IS INCLUDED IN THE BACK COVER WHICH CONTAINS ALL THE SOURCE CODE AND AN EXECUTABLE.
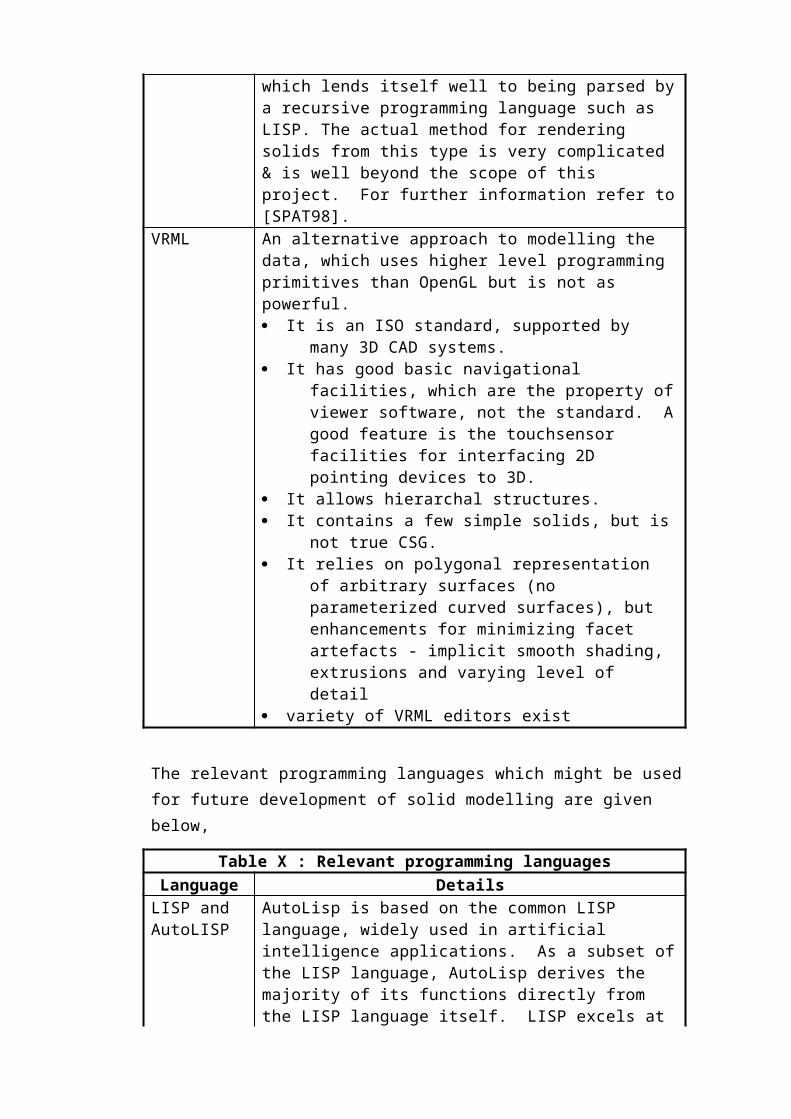
Appendix G
Bibliography[3DST97] “Object Files”, http://www.dcs.ed.ac.uk/~mxr/gfx/3d-
hi.html, 1990.[ADDI97] Addison-Wesly Publishing Company, “OpenGL
Programming Guide”, 1997.[ARTH97] Arthur. K, Preston. T, Taylor. R, Brooks. F, Whitton.
M, Wright. V, “Designing and Building the PIT: a Head-Tracked Stereo Workspace for Two Users”, 1997.
[AUTO93] AutoDesk Inc, “AutoCAD Customisation Guide - R13”, 1993.
[CLIN98] Clinger. W, “Revised report on the slgorithmic language scheme”, 1998.
[INTL94] Int’l Standards Organisation, “Industrial Automation Systems: Product Data Representation and Exchange - Part1”, 1994.
[GARD98] Gardner. H, Boswell. R, “Effective Virtual Environments - Experiences with a Low Cost Immersive System”, 1998.
[GARD97] Gardner. H, Boswell. R, “Visualisation System for Multi-dimensional Data”, 1997.
[METR98] MetroCAD USA, “AutoLISP tutorial & free programs”, 1998.
[MIDT93] Midtbo. T, “Spatial Modelling by Delaunay Networks of Two and Three Dimensions”, 1993.
[OBJE97] “Object Files”, http://www.dcs.ed.ac.uk/~mxr/gfx/3d-hi.html, 1990.
[RUDO90] Rudolf. D, “DXF: Can you get there from here?”, 1990.
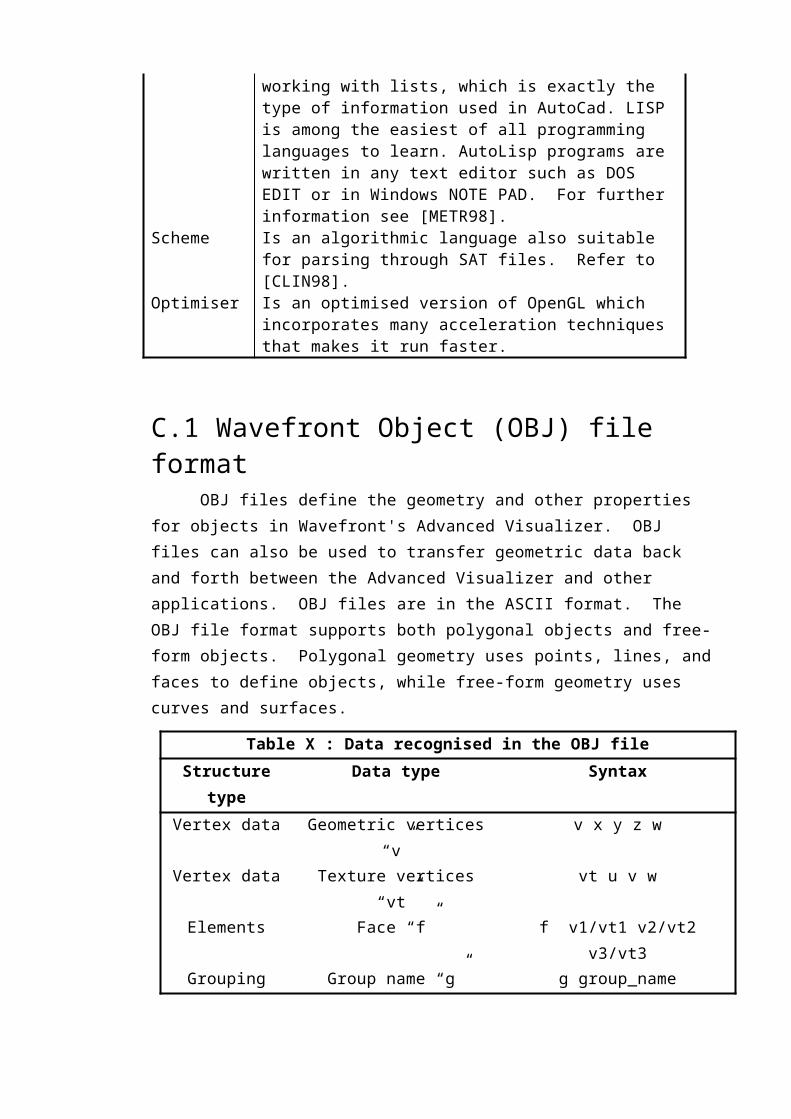
[SILI96] Silicon Graphics, “IRIS Universe”, Issue 36, Summer, 1996.
[SILI96] Silicon Graphics, “IRIS Universe”, Issue 37, Fall, 1996.
[SMIT88] Smith. B, “Initial Graphics Exchange Specification”, 1988.
[SPAT98] “SAT File Format”, http://www.spatial.com/support/publications/satfile.htm, 1998.
[SPOO97] Spooner. D, Hardwick. M, “Using Views for Product Data Exchange”, 1997.

Table of Contents
1. INTRODUCTION 1.1 OUTLINE OF THIS THESIS
2. DESCRIPTION OF THE WEDGE
3. OBSERVATIONS ON RENDERING CAD DATA IN THE WEDGE 3.1 HOW IS GEOMETRIC MODEL DATA RENDERED?3.2 COMPUTER GRAPHICS FILE FORMATS
3.3 CAD DATA
3.4 TEMPLATE FOR RENDERING CAD DATA IN THE WEDGE
4. HIGH-LEVEL PROGRAM DESIGN : WEDGE.EXE 4.1 FILE INPUT/OUTPUT
4.2 GEOMETRY RENDERING
4.3 ACCELERATION TECHNIQUES
4.4 USER INTERFACE
4.5 FILE MODIFICATION
5. IMPLEMENTATION OF WEDGE.EXE 5.1 HARDWARE AND SOFTWARE RESOURCES
5.2 CODING CONVENTIONS
5.3 DATA STRUCTURES
5.4 LIMITATIONS OF THE PROGRAM
5.5 RELIABILITY AND ROBUSTNESS
5.6 PORTABILITY AND MAINTAINABILITY
5.7 LOW LEVEL DESIGN
6. RESULTS AND TESTING
7. CONCLUSIONS AND FUTURE WORK
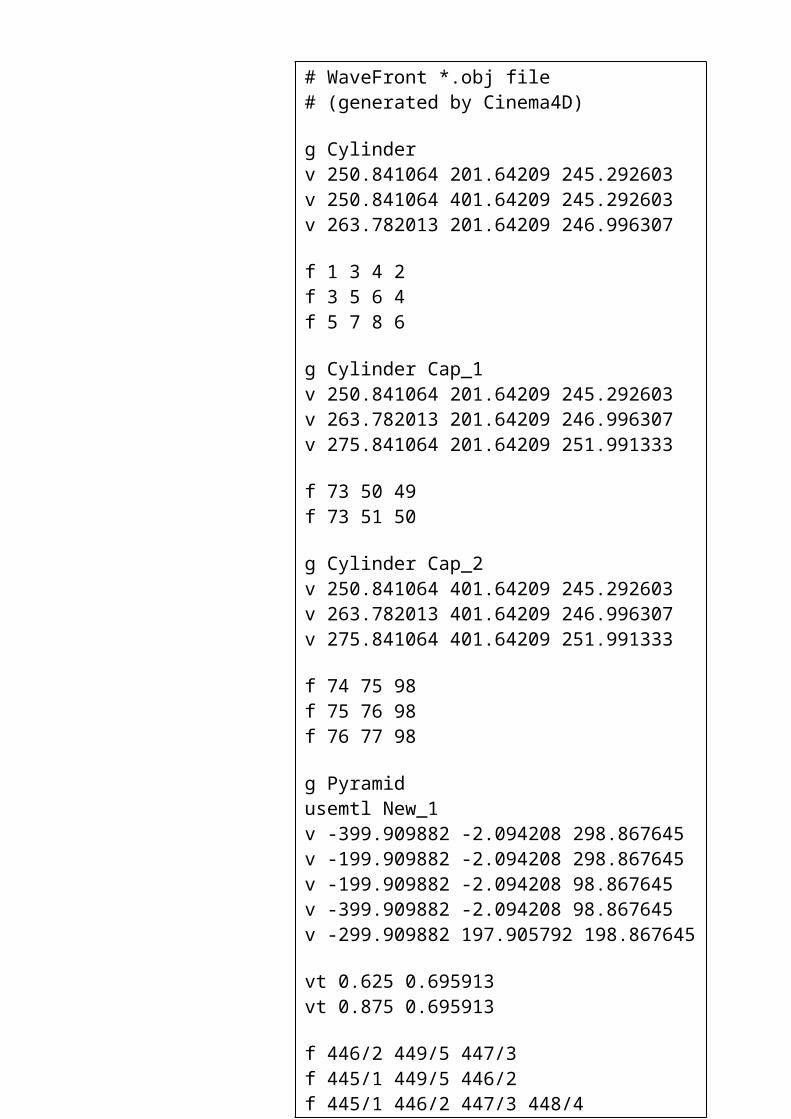
APPENDICES
A. LOW LEVEL PROGRAM DESIGN : WEDGE.EXE A.1 WEDGE.CA.2 WEDGE.HA.3 FILEIO.CA.4 FILEIO.HA.5 AGV.CA.6 AGV.HA.7 UTILS.CA.8 UTILS.H
B. USER INTERFACE CONTROLS B.1 KEYBOARD CONTROLS
B.2 MOUSE CONTROLS
B.3 MENU LAYOUT
C. RELEVANT FILE FORMATS AND PROGRAMMING LANGUAGES C.1 WAVEFRONT OBJECT (OBJ) FILE FORMAT
C.2 OPENGL
D. HARDWARE DESCRIPTION AND SPECIFICATIONS D.1 COMPUTATIONAL ENGINE
D.2 SCREEN
D.3 PROJECTORS
D.4 SHUTTER GLASSES
D.5 INFRA-RED TRANSMITTERS
D.6 GRAPHICS SPLITTERS
D.7 INPUT DEVICES
D.8 CABLING AND OTHER COMPONENTS
E. STEREOSCOPIC RENDERING
F. PROGRAM CODE F.1 INSTALLATION
G. BIBLIOGRAPHY
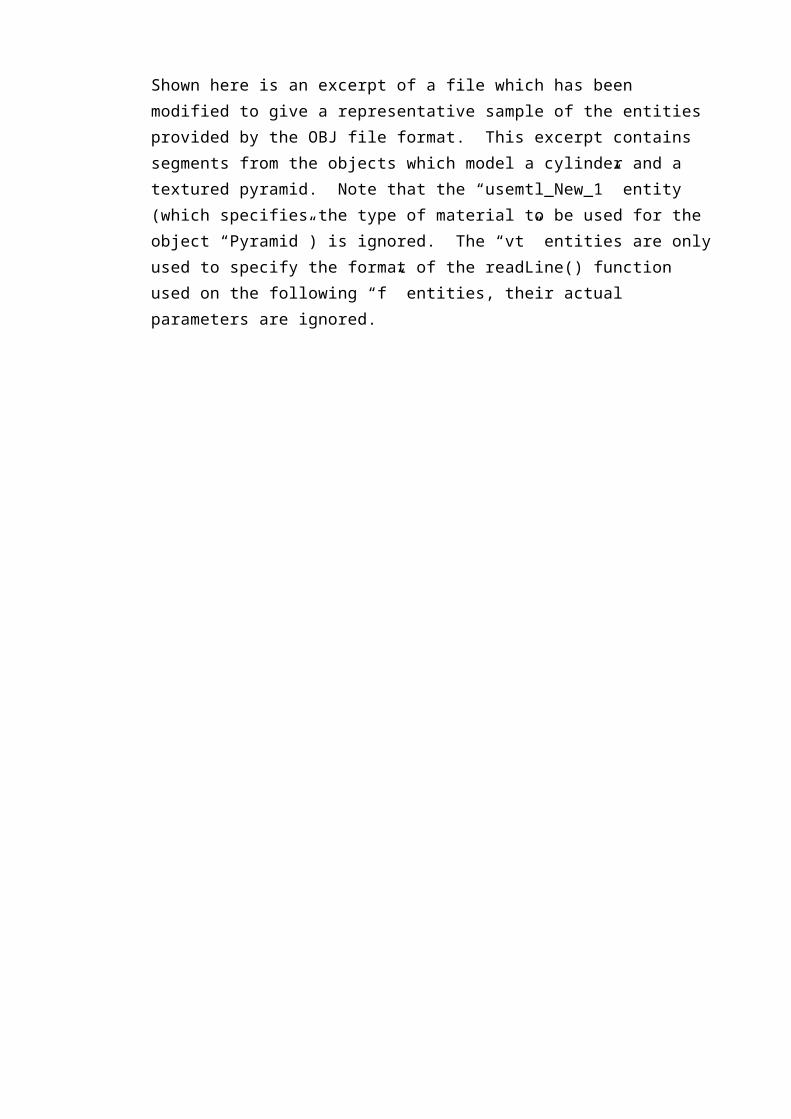
List of Figures
FIGURE 1 - THE WEDGE........................................................................................................................FIGURE 2 - HARDWARE CONFIGURATION OF THE WEDGE......................................................................FIGURE 3 - THE H-1NF HELIAC..............................................................................................................FIGURE 4 - TOP VIEW OF THE H-1NF HELIAC.........................................................................................FIGURE 5 - GRAPHICS SYSTEM FRAMEWORK............................................................................................FIGURE 6 - THE RENDERING PIPELINE......................................................................................................FIGURE 7 - GEOMETRIC COMPONENTS.....................................................................................................FIGURE 8 - MESH SIZE CONTROL.............................................................................................................FIGURE 9 - AUTOCAD'S “3DS EXPORT” DIALOGUE BOX.........................................................................FIGURE 10 - TEMPLATE FOR RENDERING CAD FILES ON THE WEDGE...................................................FIGURE 11 - PROGRAM DESIGN DECOMPOSITION & FLOW CHART............................................................FIGURE 12 - THE CAMERA ANALOGY FOR RENDERING............................................................................FIGURE 13 - THE COORDINATE AXIS OF THE WEDGE.............................................................................FIGURE 14 - CALCULATION OF PROJECTION POINTS.................................................................................FIGURE 15 - VIEWING VOLUME PARAMETERS..........................................................................................FIGURE 16 - THE VIEWING VOLUMES FOR EACH SCREEN.........................................................................FIGURE 17 - THE MODEL'S DATA STRUCTURES........................................................................................FIGURE 18 - BUCKY BALL.......................................................................................................................FIGURE 19 - THE PLASMA PASSING THROUGH THE TFC'S........................................................................

List of Tables
TABLE 1 - HARDWARE ISSUES.................................................................................................................TABLE 2 - MOUSE CONTROLS..................................................................................................................TABLE 3 - FILES COMPRISING THE COMPLETE MODEL.............................................................................TABLE 4 - EFFECT OF THE WELDING THRESHOLD VALUE ON SPEED.........................................................TABLE 5 - EFFECT OF DIRECT 3DS FILE MODIFICATION...........................................................................TABLE 6 - RENDERING SPEEDS UNDER DIFFERENT “NORMAL” TESTING SITUATIONS...............................TABLE 7 - RENDERING SPEEDS UNDER THE SINGLE SCREEN “PORTABLE” TESTING SITUATION.................TABLE 8 - EFFECTS OF TOGGLE FUNCTIONS ON RENDERING SPEED.........................................................TABLE 9 - FUNCTIONALITY OF KEYBOARD INPUT...................................................................................TABLE 10 - FUNCTIONALITY OF MOUSE INPUT........................................................................................TABLE 11 - RELEVANT FILE FORMATS......................................................................................................