overview - department of energy · web viewsteam generation scorecard questionsb-32 table c-1....
TRANSCRIPT

NOTICE: This document contains information of a preliminary nature and is not intended for release. It is subject to revision or correction and therefore does not represent a final report.
ORNL/TM-2017/73028
Oak Ridge National LaboratoryOfficial TM Cover: PEPEx Algorithm
Thomas WenningSachin NimbalkarKiran Thirumaran
3/2/2016

DOCUMENT AVAILABILITYReports produced after January 1, 1996, are generally available free via US Department of Energy (DOE) SciTech Connect.
Website http://www.osti.gov/scitech/
Reports produced before January 1, 1996, may be purchased by members of the public from the following source:
National Technical Information Service5285 Port Royal RoadSpringfield, VA 22161Telephone 703-605-6000 (1-800-553-6847)TDD 703-487-4639Fax 703-605-6900E-mail [email protected] http://www.ntis.gov/help/ordermethods.aspx
Reports are available to DOE employees, DOE contractors, Energy Technology Data Exchange representatives, and International Nuclear Information System representatives from the following source:
Office of Scientific and Technical InformationPO Box 62Oak Ridge, TN 37831Telephone 865-576-8401Fax 865-576-5728E-mail [email protected] http://www.osti.gov/contact.html
This report was prepared as an account of work sponsored by an agency of the United States Government. Neither the United States Government nor any agency thereof, nor any of their employees, makes any warranty, express or implied, or assumes any legal liability or responsibility for the accuracy, completeness, or usefulness of any information, apparatus, product, or process disclosed, or represents that its use would not infringe privately owned rights. Reference herein to any specific commercial product, process, or service by trade name, trademark, manufacturer, or otherwise, does not necessarily constitute or imply its endorsement, recommendation, or favoring by the United States Government or any agency thereof. The views and opinions of authors expressed herein do not necessarily state or reflect those of the United States Government or any agency thereof.

ORNL/TM-2017/73028
Energy and Transportation Science Division
PEPEx ALGORITHM
Thomas Wenning (Oak Ridge National Laboratory)Sachin Nimbalkar (Oak Ridge National Laboratory)Kiran Thirumaran (Oak Ridge National Laboratory)
Date Published: March 2, 2017
Prepared byOAK RIDGE NATIONAL LABORATORY
Oak Ridge, TN 37831-6283managed by
UT-BATTELLE, LLCfor the
US DEPARTMENT OF ENERGYunder contract DE-AC05-00OR22725

CONTENTS
LIST OF FIGURES...................................................................................................................................... ivLIST OF TABLES........................................................................................................................................ ivACRONYMS.................................................................................................................................................v1. OVERVIEW..........................................................................................................................................12. PEPEx Algorithm...................................................................................................................................1
2.1 INTRODUCTION.......................................................................................................................12.2 Step 1: Basic Information............................................................................................................12.3 Step 2: Energy and production.....................................................................................................2
2.3.1 Units of Measurement.....................................................................................................22.3.2 Facility’s Energy and Production Data...........................................................................22.3.3 Site to Source conversion (optional)...............................................................................2
2.4 Step 3: Energy Use Systems........................................................................................................22.5 Step 4: Energy Savings oppOrtunity............................................................................................3
3. Results....................................................................................................................................................33.1 Annual Energy Use......................................................................................................................33.2 Potential Annual Energy Savings................................................................................................43.3 Suggested Next Steps...................................................................................................................5
APPENDIX A. Energy Distribution by Industry.......................................................................................A-1APPENDIX B. PEPEx Scorecard Questions and Scores........................................................................B-14APPENDIX C. PEPEX Suggested Next Steps........................................................................................C-38
iii

LIST OF FIGURES
Figure 1.The Excel Worksheet Tabs categorized based on their function.....................................................1
LIST OF TABLES
Table 1. Ranges for PEPEx Scorecard Results..............................................................................................4Table 2. Potential Percent of Savings for each End Use................................................................................4Table A-1. Industry: All Manufacturing (NAICS 31-33)..........................................................................A-2Table A-2. Industry: Aluminum (NAICS 3313)........................................................................................A-3Table A-3. Industry: Cement (NAICS 327310).........................................................................................A-4Table A-4. Industry: Chemicals (NAICS 325)..........................................................................................A-4Table A-5. Industry: Computers and Electronics (NAICS 334, 335).......................................................A-5Table A-6. Industry: Food and Beverage (NAICS 311-312).....................................................................A-6Table A-7. Industry: Forest Products (NAICS 321, 322)..........................................................................A-6Table A-8. Industry: Foundries (NAICS 3315).........................................................................................A-7Table A-9. Industry: Glass (NAICS 3272, 327993)..................................................................................A-8Table A-10. Industry: Machinery (NAICS 333)........................................................................................A-9Table A-11. Industry: Fabricated Metals (NAICS 332)............................................................................A-9Table A-12. Industry: Petroleum Refining (NAICS 324110)..................................................................A-10Table A-13. Industry: Plastics (NAICS 326)...........................................................................................A-11Table A-14. Industry: Iron and Steel (NAICS 3311, 3312).....................................................................A-11Table A-15. Industry: Textiles (NAICS 313-316)...................................................................................A-12Table A-16. Industry: transportation Equipment (NAICS 336)..............................................................A-13Table B-1. Combined Heat and Power Scorecard Question....................................................................B-15Table B-2. Compressed Air Scorecard Questions...................................................................................B-18Table B-3. Process Cooling and Refrigeration Scorecard Questions......................................................B-22Table B-4. Process Heating Scorecard Questions....................................................................................B-27Table B-5. Pumps Scorecard Questions...................................................................................................B-30Table B-6. Steam Generation Scorecard Questions.................................................................................B-32Table C-1. Suggested Next Steps.............................................................................................................C-39
iv

ACRONYMS
PEP Plant Energy ProfilerPEPEx Plant Energy Profiler ExcelDOE Department of EnergyORNL Oak Ridge National LaboratoryMECS Manufacturing Energy Consumption SurveyEIA Energy Information Administration CHP Combined Heat and PowerHVAC Heating, Ventilation and Air-ConditioningkWh Kilowatt hourMMBTU Million BtuHRSG Heat Recovery Steam GeneratorFSAT Fan System Assessment ToolPSAT Pump System Assessment ToolCWSAT Chilled Water System Assessment ToolPHSAT Process Heating System Assessment Tool
v

1. OVERVIEW
This document outlines the underlying logic and computations performed by the Plant Energy Profiler Excel or PEPEx tool. The goal is to present the algorithm in plain text so that it can be reviewed and validated by subject matter experts, and for reference in any future design or upgrade efforts.
2. PEPEX ALGORITHM
2.1 INTRODUCTION
The PEPEx tool consists of four data collection sheets (input sheets) which are used to estimate the amount of energy used to support the operation of a plant and potential energy savings opportunities. In the results sheet, the tool plots the current energy consumption (electric, natural gas, steam and other fuels) of the plant. The potential energy savings are also calculated based on user inputs. The sections below outline the data and scorecard values collected by PEPEx and how they are used for computation. Further, each step defined in this section corresponds to a input sheet that needs to be completed by the user.
Figure 1.The Excel Worksheet Tabs categorized based on their function.
2.2 STEP 1: BASIC INFORMATION
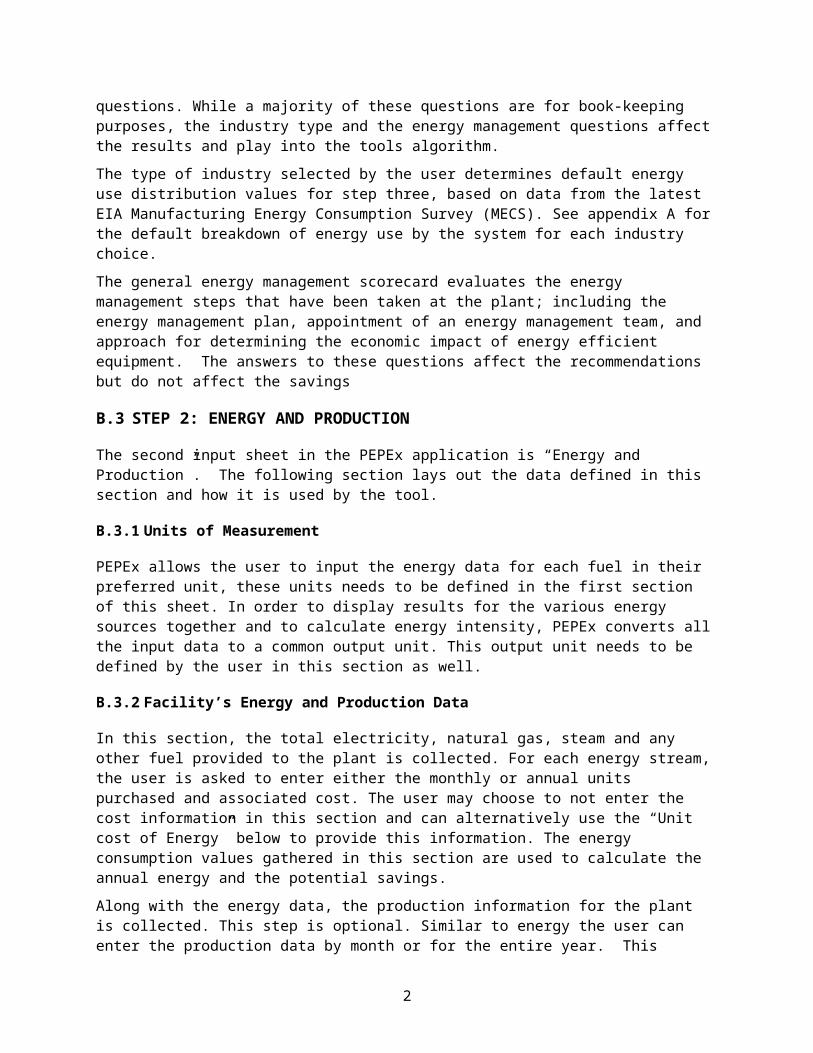
In the basic info sheet, PEPEx asks for plants contact information, plants' operating schedule and some general energy management questions. While a majority of these questions are for book-keeping purposes, the industry type and the energy management questions affect the results and play into the tools algorithm.
The type of industry selected by the user determines default energy use distribution values for step three, based on data from the latest EIA Manufacturing Energy Consumption Survey (MECS). See appendix A for the default breakdown of energy use by the system for each industry choice.
The general energy management scorecard evaluates the energy management steps that have been taken at the plant; including the energy management plan, appointment of an energy management team, and approach for determining the economic impact of energy efficient equipment. The answers to these questions affect the recommendations but do not affect the savings
1

2.3 STEP 2: ENERGY AND PRODUCTION
The second input sheet in the PEPEx application is “Energy and Production”. The following section lays out the data defined in this section and how it is used by the tool.
2.3.1 Units of Measurement
PEPEx allows the user to input the energy data for each fuel in their preferred unit, these units needs to be defined in the first section of this sheet. In order to display results for the various energy sources together and to calculate energy intensity, PEPEx converts all the input data to a common output unit. This output unit needs to be defined by the user in this section as well.
2.3.2 Facility’s Energy and Production Data
In this section, the total electricity, natural gas, steam and any other fuel provided to the plant is collected. For each energy stream, the user is asked to enter either the monthly or annual units purchased and associated cost. The user may choose to not enter the cost information in this section and can alternatively use the “Unit cost of Energy” below to provide this information. The energy consumption values gathered in this section are used to calculate the annual energy and the potential savings.
Along with the energy data, the production information for the plant is collected. This step is optional. Similar to energy the user can enter the production data by month or for the entire year. This section is optional, but if complete, the information is used to calculate energy intensity and associated graphs.
2.3.3 Site to Source conversion (optional)
The user also has the option to input a source energy factor for each fuel used. Source Energy factor is used to calculate the source energy for each energy stream. Source energy incorporates all transmission, delivery and production losses associated with each energy stream.
The default source factor for each stream is provided, based on those used in Energy Star Portfolio Manager. The user may wish to make appropriate changes to this factor to account for losses associated with transmission, delivery, and production of each energy stream. PEPEx calculates all its results in terms of "site energy" unless explicitly stated.
2.4 STEP 3: ENERGY USE SYSTEMS
In this section, the percent of total annual energy use that each major system in the plant consumes is defined. Default values are set based on the industry selected in Step one: Basic Info, but the distribution profile can be edited by the user to provide a more custom view of the plant.
This section asks the user to select all of the energy use systems that are used in the plant and the associated primary and secondary fuel. The systems selected in this section determine which questions and scorecards will be needed in step four. The system choices that are shown in this step include:
Combined Heat and Power Compressed Air Electrochemical Processes Fans and Blowers Industrial Facilities (Lighting, HVAC, and Facility Support) Materials Handling Materials Processing Process Cooling and Refrigeration
2
Process heating Pumps Steam Generation Equipment
2.5 STEP 4: ENERGY SAVINGS OPPORTUNITY
This sheet is used to characterize the potential energy saving opportunities for the various major systems in the plant. For each system, the user is asked to rank the energy saving opportunity level based on whether or not an energy savings assessment has been done on the system and how much effort has been put into conserving energy for that system. Data collected in this section affects recommended next steps and the magnitude of potential savings identified in the results section. If the energy savings opportunity for a system is ranked as “high”, a recommendation to perform a detailed system assessment at the site is provided in the suggested next steps section.
The user also has the option to use a scorecard to determine energy savings potential associated with a system by choosing the scorecard option from the drop-down list.
The scorecards are available for the following systems,
Combined Heat and Power Scorecard Compressed Air Scorecard Process Cooling and Refrigeration Scorecard Process Heating Scorecard Pumps Scorecard Steam Generation Equipment Scorecard
For each system scorecard, the user may be asked questions about the components, hours of use, measurement and monitoring procedures, maintenance, etc. A full list of questions is shown in tables B.1 through B.6 of Appendix B.
The energy use systems questions are used to determine the level of opportunity to save energy. In each scorecard, the answer to each question is assigned a number value. The total for each scorecard is calculated and used to determine the energy savings opportunities for the system area. Refer to tables B.1 through B.6 in appendix B for the amount of points assigned to each answer. Section 3.2 provides a table that summarizes how the energy saving opportunity level for each system area is computed.
3. RESULTS
PEPEx computes potential annual energy savings and suggested next steps, based on the answers provided in the scorecards, supplied energy, and energy use distribution data.
3.1 ANNUAL ENERGY USE
The total annual electricity, fuel, steam and other fuel is calculated in the results section. The total cost of the electricity, fuel, steam and other fuel is also calculated. The total energy consumption is calculated by converting the energy uses entered in Step 1: Energy and Production into the same unit and summing the inputs.
3

3.2 POTENTIAL ANNUAL ENERGY SAVINGS
Potential energy savings is calculated based on the ranking given to energy use system and the industry selected in Step 1. Answers in Step 2: Energy Use Systems Scorecards and Step 3: Energy Savings Opportunities are assigned a number value. The total for each system is then calculated. Based on the total for the system, a ranking of high, medium, or low is assigned to the energy savings opportunity for that system. See tables B.1 through B.6 in Appendix B for the values assigned for each answer. The key for each system is shown below.
Table 1. Ranges for PEPEx Scorecard ResultsScorecard Minimum
Point ValueMaximum Point Value
Ranking
Compressed Air 0 40 HighCompressed Air 40 80 MediumCompressed Air 80 100 LowProcess Cooling and Refrigeration 0 40 HighProcess Cooling and Refrigeration 40 85 MediumProcess Cooling and Refrigeration 85 100 LowProcess Heating 0 25 HighProcess Heating 25 50 MediumProcess Heating 50 100 LowPumps 0 40 HighPumps 40 80 MediumPumps 80 100 LowCombined heat and power (cogeneration) 0 40 HighCombined heat and power (cogeneration) 40 80 MediumCombined heat and power (cogeneration) 80 100 LowSteam Generation Equipment 0 50 HighSteam Generation Equipment 50 80 MediumSteam Generation Equipment 80 100 Low
Each end use is assigned a ranking of high, medium, or low depending on the score. The ranking for each end use corresponds to a potential percentage of savings. Table 2 lists the percentage savings corresponding to each combination of end use and savings opportunity ranking. The potential percentage of savings is multiplied by the current energy use to determine the potential energy savings.
For example, consider a compressed air system that used 1,000 kWh of energy a year. If the opportunity to save energy in the system was ranked as high, the tool would estimate that the system could save 15% of their annual energy use corresponding to an annual savings of 150 kWh.
Table 2. Potential Percent of Savings for each End UseEnd Use High Savings
Opportunity (%)Medium Savings Opportunity (%)
Low Savings Opportunity (%)
Combined heat and power (cogeneration)
5 3 1
Compressed air 20 15 5
4

Electrochemical Processes 0 0 0
Fans and Blowers 10 10 10
Industrial Facilities (Lighting, HVAC and Facility Support)
15 15 15
Materials Handling 0 0 0
Materials Processing 0 0 0
Process cooling and refrigeration 15 10 5
Process heating:Aluminum and AluminaCementEAF SteelFoundriesGlass and Glass ProductsIntegrated Steel
40 25 10
Process heating:Chemicals and Allied ProductsFabricated Metal ProductsPetroleum Refining
25 15 7.5
Process heating (all others) 15 10 5
Pumps 15 10 10
Steam Generation Equipment 20 15 5
3.3 SUGGESTED NEXT STEPS
Suggested next steps are determined by the savings opportunity for the system. Each answer in the scorecards is assigned a number value. See tables B.1 through B.6 in Appendix B for the values assigned for each answer. The total from all the answers is calculated for each energy use system. Based on the total from the section, an energy savings opportunity ranking of high, medium, or low is assigned to the system. This ranking determines which recommendations will be shown in the suggested next steps section of the results. See Appendix C for the key that determines which recommendations will be shown given the ranking for the system.
Questions about the user’s current energy management practices are asked in the scorecards in steps 1 If the user states they are currently doing energy management practices that may show up as a recommendation, such as, measuring and monitoring their current energy use, then this suggestion would not show up in the recommendations section.
5

APPENDIX A. Energy Distribution by Industry
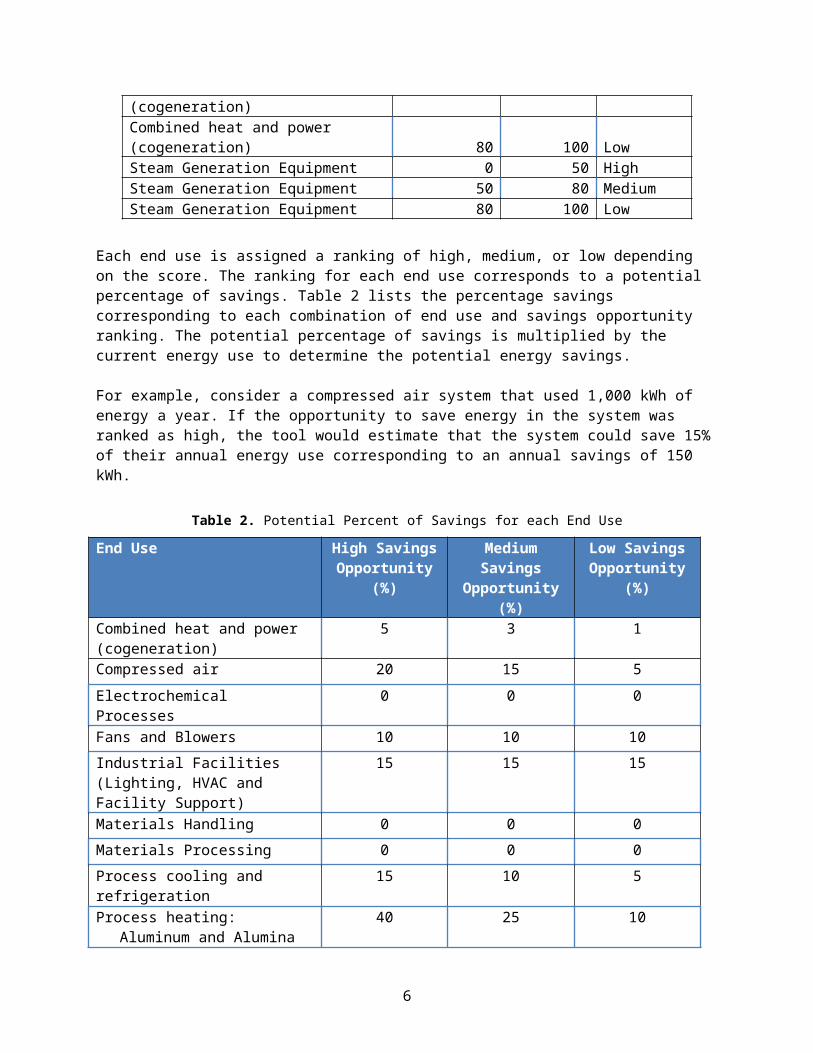
Table A-1. Industry: All Manufacturing (NAICS 31-33)End Use % Electricity
Usage% Steam Usage % Fuel Usage
Proc
ess U
ses
Conventional Boilers 3% 0% 17%
CHP/Cogeneration 0% 0% 32%
Other Electricity Generation 0% 0% 0%
Process Heating 11% 80% 42%
Process Cooling and Refrigeration 7% 0% 0%
Electro-Chemical Process 8% 0% 0%
Pumps 14% 7% 1%
Fans 8% 3% 1%
Compressed Air 9% 0% 0%
Materials Handling 7% 0% 0%
Materials Processing 13% 0% 0%
Other Machine Driven Systems 2% 1% 0%
Other Process Uses 1% 1% 2%
Non
proc
ess
Use
s Facility HVAC 9% 8% 4%
Facility Lighting 7% 0% 0%
Other Facility Support 2% 0% 0%
Onsite Transportation 0% 0% 1%
Other Nonprocess Uses 0% 0% 0%
100% 100% 100%
2

Table A-2. Industry: Aluminum (NAICS 3313)End Use % Electricity
Usage% Steam Usage % Fuel Usage
Conventional Boilers 0% 0% 3%
CHP/Cogeneration 0% 0% 12%
Other Electricity Generation 0% 0% 0%
Process Heating 5% 4% 76%
Process Cooling and Refrigeration 1% 0% 2%
Electro-Chemical Process 78% 0% 0%
Pumps 1% 59% 1%
Fans 2% 23% 0%
Compressed Air 2% 0% 0%
Materials Handling 6% 0% 0%
Materials Processing 2% 0% 0%
Other Machine Driven Systems 0% 9% 0%
Other Process Uses 0% 0% 1%
Facility HVAC 1% 6% 3%
Facility Lighting 2% 0% 0%
Other Facility Support 1% 0% 1%
Onsite Transportation 0% 0% 1%
Other Nonprocess Uses 0% 0% 0%
100% 100% 100%
3

Table A-3. Industry: Cement (NAICS 327310)End Use % Electricity
Usage% Steam Usage % Fuel Usage
Proc
ess U
ses
Conventional Boilers 0% 0% 0%
CHP/Cogeneration 0% 0% 11%
Other Electricity Generation 0% 0% 0%
Process Heating 9% 4% 88%
Process Cooling and Refrigeration 0% 0% 0%
Electro-Chemical Process 0% 0% 0%
Pumps 6% 59% 1%
Fans 11% 0%
Compressed Air 11% 0% 0%
Materials Handling 36% 0% 0%
Materials Processing 10% 0% 0%
Other Machine Driven Systems 1% 9% 0%
Other Process Uses 2% 0% 0%
Non
proc
ess
Use
s Facility HVAC 7% 6% 0%
Facility Lighting 4% 0% 0%
Other Facility Support 2% 0% 0%
Onsite Transportation 0% 0% 1%
Other Nonprocess Uses 0% 0% 0%
100% 100% 100%
Table A-4. Industry: Chemicals (NAICS 325)End Use % Electricity
Usage% Steam Usage % Fuel Usage
Conventional Boilers 4% 0% 25%
CHP/Cogeneration 0% 0% 44%
Other Electricity Generation 0% 0% 0%
Process Heating 5% 86% 22%
Process Cooling and Refrigeration 8% 0% 1%
Electro-Chemical Process 14% 0% 0%
Pumps 16% 7% 2%
Fans 7% 3% 1%
4

Compressed Air 17% 0% 0%
Materials Handling 1% 0% 0%
Materials Processing 14% 0% 0%
Other Machine Driven Systems 1% 1% 0%
Other Process Uses 1% 0% 2%
Facility HVAC 6% 4% 1%
Facility Lighting 4% 0% 0%
Other Facility Support 1% 0% 0%
Onsite Transportation 0% 0% 0%
Other Nonprocess Uses 0% 0% 0%
100% 100% 100%
Table A-5. Industry: Computers and Electronics (NAICS 334, 335)End Use % Electricity
Usage% Steam Usage % Fuel Usage
Conventional Boilers 1% 0% 31%
CHP/Cogeneration 0% 0% 0%
Other Electricity Generation 0% 0% 0%
Process Heating 15% 15% 31%
Process Cooling and Refrigeration 9% 0% 1%
Electro-Chemical Process 1% 0% 0%
Pumps 5% 1% 0%
Fans 3% 0% 0%
Compressed Air 4% 0% 0%
Materials Handling 2% 0% 0%
Materials Processing 7% 0% 0%
Other Machine Driven Systems 5% 0% 0%
Other Process Uses 6% 0% 2%
Facility HVAC 24% 84% 30%
Facility Lighting 12% 0% 0%
Other Facility Support 6% 0% 0%
Onsite Transportation 0% 0% 3%
Other Nonprocess Uses 1% 0% 1%
5

100% 100% 100%
Table A-6. Industry: Food and Beverage (NAICS 311-312)End Use % Electricity
Usage% Steam Usage % Fuel Usage
Conventional Boilers 2% 0% 48%
CHP/Cogeneration 0% 0% 18%
Other Electricity Generation 0% 0% 0%
Process Heating 6% 78% 25%
Process Cooling and Refrigeration 26% 0% 0%
Electro-Chemical Process 0% 0% 0%
Pumps 11% 3% 1%
Fans 5% 1% 0%
Compressed Air 5% 0% 0%
Materials Handling 4% 0% 0%
Materials Processing 17% 0% 0%
Other Machine Driven Systems 4% 1% 0%
Other Process Uses 1% 0% 2%
Facility HVAC 9% 16% 4%
Facility Lighting 7% 0% 0%
Other Facility Support 2% 0% 1%
Onsite Transportation 0% 0% 0%
Other Nonprocess Uses 0% 0% 0%
100% 100% 100%
Table A-7. Industry: Forest Products (NAICS 321, 322)End Use % Electricity
Usage% Steam Usage % Fuel Usage
Conventional Boilers 6% 0% 8%
CHP/Cogeneration 0% 0% 79%
Other Electricity Generation 0% 0% 0%
Process Heating 5% 85% 10%
Process Cooling and Refrigeration 2% 0% 0%
Electro-Chemical Process 1% 0% 0%
6

Pumps 24% 5% 1%
Fans 15% 2% 0%
Compressed Air 4% 0% 0%
Materials Handling 6% 0% 0%
Materials Processing 16% 0% 0%
Other Machine Driven Systems 11% 1% 0%
Other Process Uses 1% 0% 0%
Facility HVAC 5% 8% 1%
Facility Lighting 5% 0% 0%
Other Facility Support 1% 0% 0%
Onsite Transportation 0% 0% 1%
Other Nonprocess Uses 0% 0% 0%
100% 100% 100%
Table A-8. Industry: Foundries (NAICS 3315)End Use % Electricity
Usage% Steam Usage % Fuel Usage
Conventional Boilers 0% 0% 3%
CHP/Cogeneration 0% 0% 0%
Other Electricity Generation 0% 0% 0%
Process Heating 46% 4% 79%
Process Cooling and Refrigeration 2% 0% 0%
Electro-Chemical Process 4% 0% 0%
Pumps 3% 59% 1%
Fans 5% 23% 0%
Compressed Air 5% 0% 0%
Materials Handling 14% 0% 0%
Materials Processing 3% 0% 0%
Other Machine Driven Systems 0% 9% 0%
Other Process Uses 2% 0% 1%
Facility HVAC 9% 6% 13%
Facility Lighting 5% 0% 0%
Other Facility Support 2% 0% 1%
7

Onsite Transportation 0% 0% 1%
Other Nonprocess Uses 0% 0% 0%
100% 100% 100%
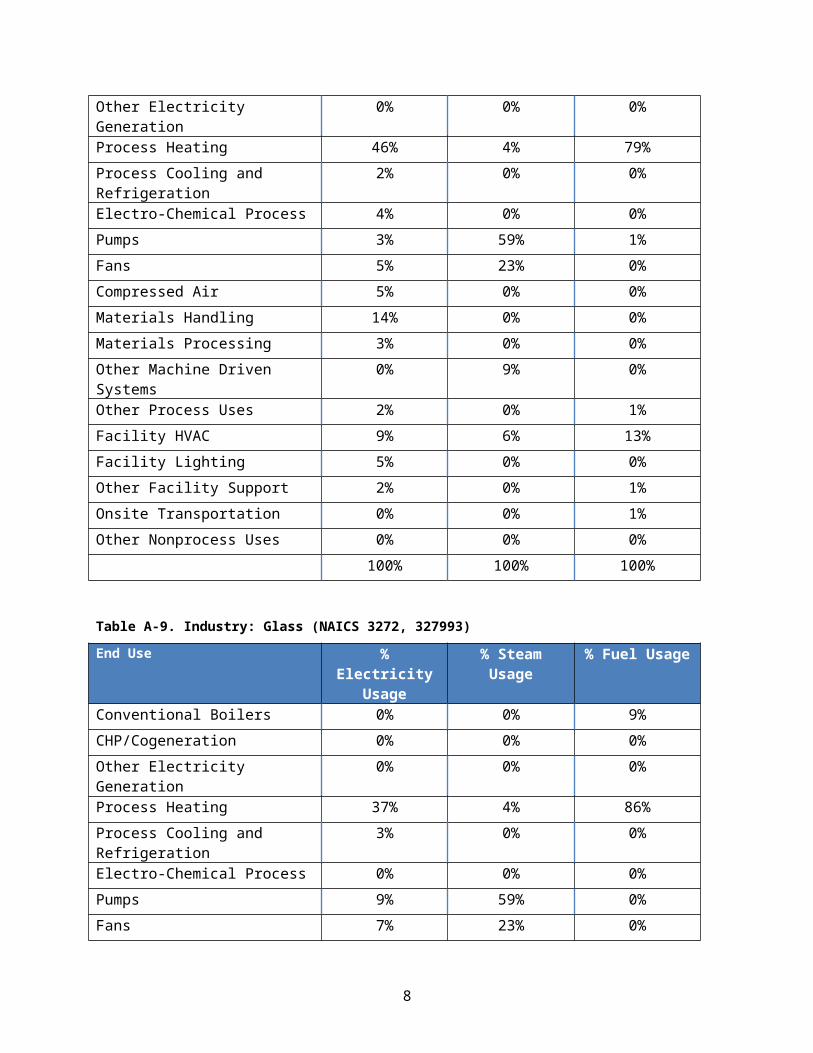
Table A-9. Industry: Glass (NAICS 3272, 327993)End Use % Electricity
Usage% Steam Usage % Fuel Usage
Conventional Boilers 0% 0% 9%
CHP/Cogeneration 0% 0% 0%
Other Electricity Generation 0% 0% 0%
Process Heating 37% 4% 86%
Process Cooling and Refrigeration 3% 0% 0%
Electro-Chemical Process 0% 0% 0%
Pumps 9% 59% 0%
Fans 7% 23% 0%
Compressed Air 7% 0% 0%
Materials Handling 4% 0% 0%
Materials Processing 15% 0% 0%
Other Machine Driven Systems 2% 9% 0%
Other Process Uses 5% 0% 0%
Facility HVAC 5% 6% 5%
Facility Lighting 6% 0% 0%
Other Facility Support 0% 0% 0%
Onsite Transportation 0% 0% 0%
Other Nonprocess Uses 0% 0% 0%
100% 100% 100%
8

Table A-10. Industry: Machinery (NAICS 333)End Use % Electricity
Usage% Steam Usage % Fuel Usage
Conventional Boilers 1% 0% 19%
CHP/Cogeneration 0% 0% 8%
Other Electricity Generation 0% 0% 0%
Process Heating 7% 35% 27%
Process Cooling and Refrigeration 3% 0% 0%
Electro-Chemical Process 0% 0% 0%
Pumps 9% 1% 0%
Fans 7% 0% 0%
Compressed Air 7% 0% 0%
Materials Handling 5% 0% 0%
Materials Processing 15% 0% 0%
Other Machine Driven Systems 2% 0% 0%
Other Process Uses 2% 0% 4%
Facility HVAC 23% 64% 36%
Facility Lighting 15% 0% 0%
Other Facility Support 3% 0% 2%
Onsite Transportation 1% 0% 1%
Other Nonprocess Uses 1% 0% 2%
100% 100% 100%
Table A-11. Industry: Fabricated Metals (NAICS 332)End Use % Electricity
Usage% Steam Usage % Fuel Usage
Conventional Boilers 1% 0% 15%
CHP/Cogeneration 0% 0% 2%
Other Electricity Generation 0% 0% 0%
Process Heating 20% 35% 65%
Process Cooling and Refrigeration 3% 0% 0%
Electro-Chemical Process 2% 0% 0%
Pumps 10% 1% 0%
Fans 7% 0% 0%
9

Compressed Air 8% 0% 0%
Materials Handling 6% 0% 0%
Materials Processing 17% 0% 0%
Other Machine Driven Systems 2% 0% 0%
Other Process Uses 3% 0% 0%
Facility HVAC 10% 64% 15%
Facility Lighting 10% 0% 0%
Other Facility Support 2% 0% 1%
Onsite Transportation 0% 0% 1%
Other Nonprocess Uses 0% 0% 0%
100% 100% 100%
Table A-12. Industry: Petroleum Refining (NAICS 324110)End Use % Electricity
Usage% Steam Usage % Fuel Usage
Conventional Boilers 1% 0% 15%
CHP/Cogeneration 0% 0% 16%
Other Electricity Generation 0% 0% 0%
Process Heating 3% 97% 65%
Process Cooling and Refrigeration 6% 0% 0%
Electro-Chemical Process 0% 0% 0%
Pumps 50% 1% 1%
Fans 8% 1% 0%
Compressed Air 13% 0% 0%
Materials Handling 2% 0% 0%
Materials Processing 9% 0% 0%
Other Machine Driven Systems 2% 0% 0%
Other Process Uses 0% 0% 2%
Facility HVAC 3% 1% 0%
Facility Lighting 2% 0% 0%
Other Facility Support 1% 0% 0%
Onsite Transportation 0% 0% 0%
Other Nonprocess Uses 0% 0% 0%
10
100% 100% 100%
Table A-13. Industry: Plastics (NAICS 326)End Use % Electricity
Usage% Steam Usage % Fuel Usage
Conventional Boilers 1% 0% 52%
CHP/Cogeneration 0% 0% 0%
Other Electricity Generation 0% 0% 0%
Process Heating 15% 59% 24%
Process Cooling and Refrigeration 9% 0% 0%
Electro-Chemical Process 0% 0% 0%
Pumps 13% 3% 1%
Fans 7% 1% 1%
Compressed Air 9% 0% 0%
Materials Handling 7% 0% 0%
Materials Processing 12% 0% 0%
Other Machine Driven Systems 3% 0% 0%
Other Process Uses 2% 0% 2%
Facility HVAC 11% 37% 18%
Facility Lighting 9% 0% 0%
Other Facility Support 3% 0% 1%
Onsite Transportation 1% 0% 1%
Other Nonprocess Uses 0% 0% 0%
100% 100% 100%
Table A-14. Industry: Iron and Steel (NAICS 3311, 3312)End Use % Electricity
Usage% Steam Usage % Fuel Usage
Conventional Boilers 0% 0% 10%
CHP/Cogeneration 0% 0% 14%
Other Electricity Generation 0% 0% 1%
Process Heating 41% 4% 70%
Process Cooling and Refrigeration 0% 0% 0%
Electro-Chemical Process 4% 0% 0%
11

Pumps 4% 59% 0%
Fans 7% 23% 0%
Compressed Air 7% 0% 0%
Materials Handling 22% 0% 0%
Materials Processing 6% 0% 0%
Other Machine Driven Systems 1% 9% 0%
Other Process Uses 0% 0% 2%
Facility HVAC 3% 6% 2%
Facility Lighting 4% 0% 0%
Other Facility Support 0% 0% 0%
Onsite Transportation 0% 0% 0%
Other Nonprocess Uses 0% 0% 0%
100% 100% 100%
Table A-15. Industry: Textiles (NAICS 313-316)End Use % Electricity
Usage% Steam Usage % Fuel Usage
Conventional Boilers 1% 0% 48%
CHP/Cogeneration 0% 0% 11%
Other Electricity Generation 0% 0% 0%
Process Heating 10% 77% 30%
Process Cooling and Refrigeration 12% 0% 0%
Electro-Chemical Process 0% 0% 0%
Pumps 10% 3% 1%
Fans 7% 1% 1%
Compressed Air 8% 0% 0%
Materials Handling 6% 0% 0%
Materials Processing 17% 0% 0%
Other Machine Driven Systems 2% 1% 0%
Other Process Uses 1% 0% 1%
Facility HVAC 14% 18% 7%
Facility Lighting 10% 0% 0%
12

Other Facility Support 2% 0% 0%
Onsite Transportation 0% 0% 1%
Other Nonprocess Uses 0% 0% 0%
100% 100% 100%
Table A-16. Industry: transportation Equipment (NAICS 336)End Use % Electricity
Usage% Steam Usage % Fuel Usage
Conventional Boilers 1% 0% 17%
CHP/Cogeneration 0% 0% 6%
Other Electricity Generation 0% 0% 0%
Process Heating 14% 0% 28%
Process Cooling and Refrigeration 6% 0% 1%
Electro-Chemical Process 1% 0% 0%
Pumps 8% 5% 1%
Fans 5% 2% 0%
Compressed Air 6% 0% 0%
Materials Handling 4% 0% 0%
Materials Processing 12% 0% 0%
Other Machine Driven Systems 2% 1% 0%
Other Process Uses 3% 70% 12%
Facility HVAC 19% 23% 32%
Facility Lighting 15% 0% 0%
Other Facility Support 4% 0% 1%
Onsite Transportation 1% 0% 1%
Other Nonprocess Uses 1% 0% 0%
100% 100% 100%
13

APPENDIX B. PEPEx Scorecard Questions and Scores
14

Table B-1. Combined Heat and Power Scorecard Question
Combined Heat and Power Scorecard QuestionsQuestion Number Question Answer Score
1Check which items are part of your CHP system:
"Supplementary Fired HRSG" AND"Condensing Steam Turbogenerator(s)" 12
2If you have a Gas Turbine or Diesel generator, is the exhaust gas used for:
"Direct heating (dryer, kiln or preheated furnace air)" OR "Steam Generation" 60
3Do you use the turbo-generator for peak load shaving? No 0
3Do you use the turbo-generator for peak load shaving? Yes 0
4If an HRSG is a part of the system, how many steam generation levels? 1 36
4If an HRSG is a part of the system, how many steam generation levels? 2 or more 60
5 What type of deaerator to you have? External 125 What type of deaerator to you have? Integral 18
6
If the HRSG has supplementary firing, does the HRSG run at maximum firing or maximum steam generation capacity all the time? No 0
6
If the HRSG has supplementary firing, does the HRSG run at maximum firing or maximum steam generation capacity all the time? Yes 60
7Are the Boilers used as the swing steam load production or the HRSG?
Boilers (HRSG base loaded) 60
7Are the Boilers used as the swing steam load production or the HRSG?
HRSG (Boilers base loaded) 0
8 Is your HRSG stack temperature: <=300 degrees F 60
8 Is your HRSG stack temperature:Between 300 - 400 degrees F 48
8 Is your HRSG stack temperature: >400 degrees F 24
9
If the HRSG is supplementary fired, what is the typical HRSG fired operating temperature?
1500 degrees F or greater 30
9
If the HRSG is supplementary fired, what is the typical HRSG fired operating temperature? 1400 degrees F 12
15

Combined Heat and Power Scorecard QuestionsQuestion Number Question Answer Score
9
If the HRSG is supplementary fired, what is the typical HRSG fired operating temperature? 1200 degrees F or less 0
10.1 On hot standby? No 2410.1 On hot standby? Yes 010.2 At minimum load? No 1210.2 At minimum load? Yes 0
11
If this is a condensing turbine, do you have to run the turbine for extended periods at low to minimum load to keep it on-line? No 6
11
If this is a condensing turbine, do you have to run the turbine for extended periods at low to minimum load to keep it on-line? Yes 0
12
If you have a condensing steam turbine as a part of your cogeneration unit, what is the average condensing pressure? <2 in Hg 18
12
If you have a condensing steam turbine as a part of your cogeneration unit, what is the average condensing pressure? Between 2 - 4 in Hg 12
12
If you have a condensing steam turbine as a part of your cogeneration unit, what is the average condensing pressure? >4 in Hg 6
13Do you use evaporative cooling on the GT inlet air temp? No 0
13Do you use evaporative cooling on the GT inlet air temp? Yes 24
13.1Is the energy for this cooling supplied by the HRSG? No 36
13.1Is the energy for this cooling supplied by the HRSG? Yes 0
14Do you have large seasonal variations in gas turbine inlet air temp? No 12
14Do you have large seasonal variations in gas turbine inlet air temp? Yes 0
15Do you sell excess steam or is there a potential customer for excess steam? No 0
16

Combined Heat and Power Scorecard QuestionsQuestion Number Question Answer Score
15Do you sell excess steam or is there a potential customer for excess steam? Yes 12
16Do you export power to the grid or external customers? No 0
16Do you export power to the grid or external customers? Yes 0
16.1If so, what fraction of the full imported power cost do you receive?
((12*[Answer])/100)
17
What is the average load factor (average/rated power production ratio) for the cogeneration unit?
((25*[Answer])/100)
18
What is the average net heat rate of the cogeneration unit (Net Btu's of the fuel/kWh of power produced)? 5,000 or less 120
18
What is the average net heat rate of the cogeneration unit (Net Btu's of the fuel/kWh of power produced)? 5,000 - 7,000 96
18
What is the average net heat rate of the cogeneration unit (Net Btu's of the fuel/kWh of power produced)? > 7,000 48
18
What is the average net heat rate of the cogeneration unit (Net Btu's of the fuel/kWh of power produced)? Don't know 24
19
What is the average cogeneration unit operating stream factor (on-line time as a fraction)?
case when (100/(100 -
[Answer]) > 100 then 100 else
(100/(100 -[Answer]) end
20 How many unplanned trips per year?
case when (6 * (7 - [Answer])) < 0 then
0 else (6 * (7 - [Answer])) end
21How often is the overall cogeneration efficiency monitored? Continuously 60
21How often is the overall cogeneration efficiency monitored? Monthly 30
21How often is the overall cogeneration efficiency monitored? Annually 12
22Do you have on-line dynamic load optimization? No 0
17

Combined Heat and Power Scorecard QuestionsQuestion Number Question Answer Score
22Do you have on-line dynamic load optimization? Yes 60
23 How do you control exhaust NOx levels? NULL 6023 How do you control exhaust NOx levels? Water injection 3623 How do you control exhaust NOx levels? Steam injection 3623 How do you control exhaust NOx levels? Low NOx burners 40
24Do you have a program for preventive maintenance of the CHP system? Routine lubrication 2
24Do you have a program for preventive maintenance of the CHP system? Borescope inspections 2
24Do you have a program for preventive maintenance of the CHP system?
Instrument calibrations 2
24Do you have a program for preventive maintenance of the CHP system?
Blade cleaning - peanut/almond shells 4
25Do you have a program for predictive maintenance? Lube oil sampling 6
25Do you have a program for predictive maintenance? Advanced diagnostics 6
25Do you have a program for predictive maintenance?
Instrument histograms 6
26Do you periodically re-certify cogen operators? No 0
26Do you periodically re-certify cogen operators? Yes 6
Table B-2. Compressed Air Scorecard QuestionsCompressed Air Scorecard Questions
Question Number Question Answer Score
1.1Have you developed a basic block diagram of the system? No 0
1.1Have you developed a basic block diagram of the system? Yes 200
1.2
Have you developed a pressure profile of your system to determine peak demand and dynamics of demand? No 0
1.2
Have you developed a pressure profile of your system to determine peak demand and dynamics of demand? Yes 100
18

Compressed Air Scorecard QuestionsQuestion Number Question Answer Score
1.3Have you estimated total compressed air flow during different shifts? No 0
1.3Have you estimated total compressed air flow during different shifts? Yes 100
1.4Have you measured pressure at various points in the system to determine pressure drop? No 0
1.4Have you measured pressure at various points in the system to determine pressure drop? Yes 100
1.5Have you measured compressed air temperature at various points in the supply system? No 0
1.5Have you measured compressed air temperature at various points in the supply system? Yes 200
1.6 Have you estimated leak load? No 01.6 Have you estimated leak load? Yes 100
2.1Do you meet or exceed compressor and dryer manufacturer's requirements for maintenance? No 0
2.1Do you meet or exceed compressor and dryer manufacturer's requirements for maintenance? Yes 100
2.2
Do you periodically check ventilation openings to the compressor room to make sure they are free of obstructions? No 0
2.2
Do you periodically check ventilation openings to the compressor room to make sure they are free of obstructions? Yes 200
2.3 Do you inspect condensate drains daily? No 02.3 Do you inspect condensate drains daily? Yes 100
2.4Do you periodically inspect and replace hoses that have become cracked or worn? No 0
2.4Do you periodically inspect and replace hoses that have become cracked or worn? Yes 100
2.5
Do you periodically inspect and replace end-use filters, check regulators, and lubricators to maintain functionality? No 0
2.5
Do you periodically inspect and replace end-use filters, check regulators, and lubricators to maintain functionality? Yes 200
3.1Have you adjusted your compressor controls in the last year? No 0
3.1Have you adjusted your compressor controls in the last year? Yes 100
19

Compressed Air Scorecard QuestionsQuestion Number Question Answer Score
3.2Have you developed a control strategy that allows you to efficiently match supply with demand? No 0
3.2Have you developed a control strategy that allows you to efficiently match supply with demand? Yes 300
3.3Do you monitor compressor operation to avoid rapid cycling of equipment? No 0
3.3Do you monitor compressor operation to avoid rapid cycling of equipment? Yes 100
4.1
Do you have a few high pressure applications that determine the operating pressure for your entire plant? No -100
4.1
Do you have a few high pressure applications that determine the operating pressure for your entire plant? Yes 0
4.2Have you investigated ways to serve high pressure applications at a lower pressure? No 0
4.2Have you investigated ways to serve high pressure applications at a lower pressure? Yes 100
5.1
Do you have a few end use applications requiring high quality air that determine the air quality for the entire plant? No 0
5.1
Do you have a few end use applications requiring high quality air that determine the air quality for the entire plant? Yes -100
5.2Have you investigated ways to serve these high air quality applications with point-of-use solutions? No 0
5.2Have you investigated ways to serve these high air quality applications with point-of-use solutions? Yes 100
6.1
Are you using any of the following to supply the intermittent, high volume applications? (Check all that apply)
Secondary Storage Receivers 100
6.1
Are you using any of the following to supply the intermittent, high volume applications? (Check all that apply)
Separate compressor, booster or amplifier 100
6.1
Are you using any of the following to supply the intermittent, high volume applications? (Check all that apply)
"Secondary Storage Receivers" OR"Separate compressor, booster or amplifier" 100
20

Compressed Air Scorecard QuestionsQuestion Number Question Answer Score
7.1
Have you analyzed your end-users to make sure they could not be more efficiently use alternative energy sources? No 0
7.1
Have you analyzed your end-users to make sure they could not be more efficiently use alternative energy sources? Yes 100
7.2Is compressed air being sent to abandoned equipment? No -300
7.2Is compressed air being sent to abandoned equipment? Yes -30
8.1Have you estimated the amount of leakage in your system? No 0
8.1Have you estimated the amount of leakage in your system? Yes 100
8.2
Do you have the equipment to detect leaks (e.g., ultrasonic leak detector) or do you outsource leak detection? No 0
8.2
Do you have the equipment to detect leaks (e.g., ultrasonic leak detector) or do you outsource leak detection? Yes 100
8.3Do you have an ongoing leak management program? No 0
8.3Do you have an ongoing leak management program? Yes 200
9.1Does your plant have a demand for space heating or hot water? No 0
9.1Does your plant have a demand for space heating or hot water? Yes 100
9.2Are you using heat recovery on your compressed air system? No 00
9.2Are you using heat recovery on your compressed air system? Yes 100
21

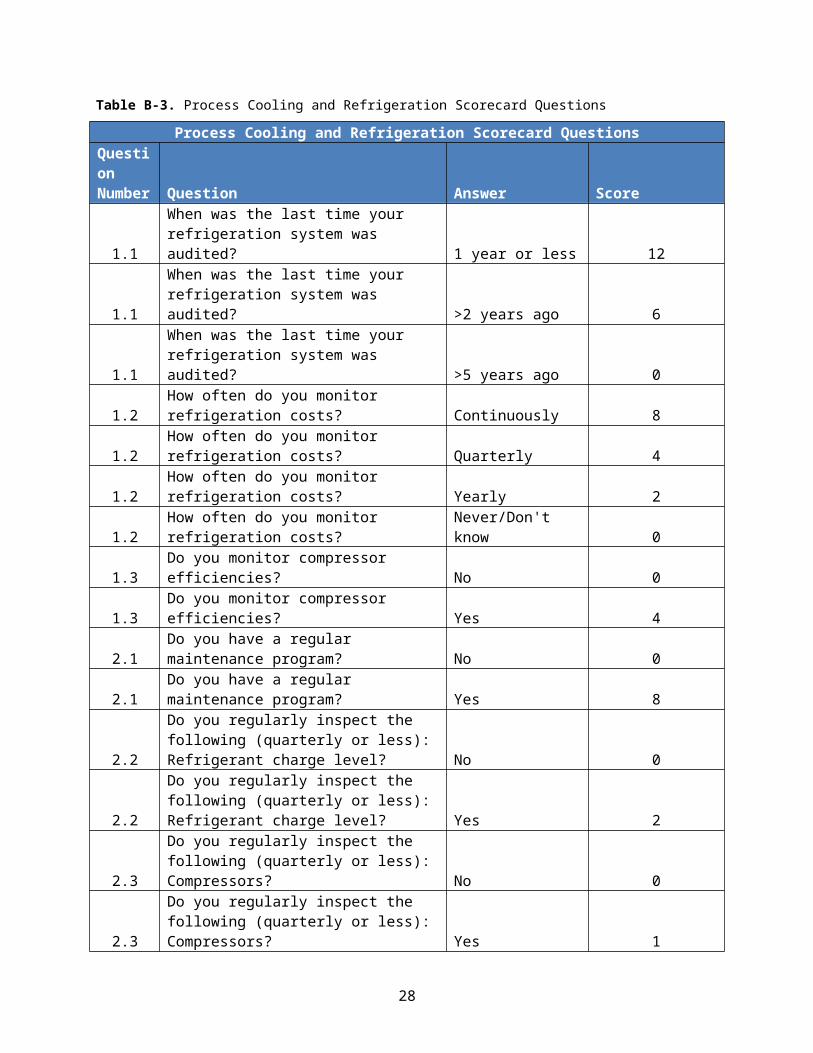
Table B-3. Process Cooling and Refrigeration Scorecard QuestionsProcess Cooling and Refrigeration Scorecard Questions
Question Number Question Answer Score
1.1When was the last time your refrigeration system was audited? 1 year or less 12
1.1When was the last time your refrigeration system was audited? >2 years ago 6
1.1When was the last time your refrigeration system was audited? >5 years ago 0
1.2How often do you monitor refrigeration costs? Continuously 8
1.2How often do you monitor refrigeration costs? Quarterly 4
1.2How often do you monitor refrigeration costs? Yearly 2
1.2How often do you monitor refrigeration costs? Never/Don't know 0
1.3 Do you monitor compressor efficiencies? No 01.3 Do you monitor compressor efficiencies? Yes 42.1 Do you have a regular maintenance program? No 02.1 Do you have a regular maintenance program? Yes 8
2.2Do you regularly inspect the following (quarterly or less): Refrigerant charge level? No 0
2.2Do you regularly inspect the following (quarterly or less): Refrigerant charge level? Yes 2
2.3Do you regularly inspect the following (quarterly or less): Compressors? No 0
2.3Do you regularly inspect the following (quarterly or less): Compressors? Yes 1
2.4
Do you regularly inspect the following (quarterly or less): Condensers and Evaporators (fouling)? No 0
2.4
Do you regularly inspect the following (quarterly or less): Condensers and Evaporators (fouling)? Yes 1
3.1What is the average refrigeration compressor load factor versus design (typical/estimated)? >= 100% 8
3.1What is the average refrigeration compressor load factor versus design (typical/estimated)? >50% 4
3.1What is the average refrigeration compressor load factor versus design (typical/estimated)? Don't know 0
3.2What % of operating time do you spend at less than 50% load? 30% or less 4
22

Process Cooling and Refrigeration Scorecard QuestionsQuestion Number Question Answer Score
3.2What % of operating time do you spend at less than 50% load? 60% or more 2
3.2What % of operating time do you spend at less than 50% load? Don't know 0
3.3What mechanism do you use to unload your compressors? Variable speed drives 8
3.3What mechanism do you use to unload your compressors?
Cylinder unloading (reciprocating) /Slide valves (screw) /Variable inlet guide vanes (centrifugal) 6
3.3What mechanism do you use to unload your compressors?
Automated Compressor on/off control 4
3.3What mechanism do you use to unload your compressors?
Manual Compressor on/off control 3
3.3What mechanism do you use to unload your compressors? Suction throttling 2
3.3What mechanism do you use to unload your compressors? Hot gas bypass 0
4.1Is your refrigeration compressor suction pressure typically:
At or near design pressure 5
4.1Is your refrigeration compressor suction pressure typically:
< design presure by more than 15% 2
4.1Is your refrigeration compressor suction pressure typically: Don't know 0
4.2
What is the typical temperature difference between evaporator refrigerant and process stream outlet? Within 5 °F of design 4
4.2
What is the typical temperature difference between evaporator refrigerant and process stream outlet? >5 °F of design 2
4.2What is the typical DT between evaporator refrigerant and process stream outlet? Don't know 0
4.3Is your refrigeration compressor discharge pressure typically:
At or near design pressure 4
4.3Is your refrigeration compressor discharge pressure typically:
> design presure by more than 10% 2
4.3Is your refrigeration compressor discharge pressure typically: Don't know 0
23

Process Cooling and Refrigeration Scorecard QuestionsQuestion Number Question Answer Score
4.4Do you have condenser performance problems?
Not at all 2
4.4
Do you have condenser performance problems?
Only periodically during summer months 1
4.4Do you have condenser performance problems?
Throughout summer months
1
4.4Do you have condenser performance problems?
Continuously 0
5.1How old is your refrigeration equipment (average)?
<10 years 2
5.1How old is your refrigeration equipment (average)?
10-20 years 1
5.1How old is your refrigeration equipment (average)?
>20 years 0
5.2
Have you ever performed a Pinch Analysis study to check if refrigeration loads have been minimized? No 0
5.2
Have you ever performed a Pinch Analysis study to check if refrigeration loads have been minimized? Yes 8
5.3 Backpressure (extraction) steam turbines ((11*[Answer])/100)
5.4 Variable speed electric motors ((5*[Answer])/100)
5.5 Electric motors w/o variable speed drives ((3*[Answer])/100)
5.6 Condensing steam turbines ((0*[Answer])/100)6.1 How are cooling tower fans controlled? Always on 0
6.1 How are cooling tower fans controlled?Manual on/off control 3
6.1 How are cooling tower fans controlled? Fan pitch control 5
6.1 How are cooling tower fans controlled?Automated on/off control 7
6.1 How are cooling tower fans controlled?Combination of above 4
6.2 How is blowdown controlled? Automatically 76.2 How is blowdown controlled? Manually 0
6.2 How is blowdown controlled?Combination of above 4
24

Process Cooling and Refrigeration Scorecard QuestionsQuestion Number Question Answer Score
7.1 Which parameters do you monitor regularly?
Ambient air temperature profiles for year 1
7.1 Which parameters do you monitor regularly?
Ambient air wet bulb temperature profile for year 1
7.1 Which parameters do you monitor regularly?Cooling tower blowdown cycles 1
7.1 Which parameters do you monitor regularly?Cooling water flow demand 1
7.1 Which parameters do you monitor regularly? Delta T across towers 1
7.1 Which parameters do you monitor regularly?Cycles of concentration 1
8.1Are overall cooling water flowrates above or below design? Above 0
8.1Are overall cooling water flowrates above or below design? Below 4
8.1Have you optimized water vs air cooling loads? No 0
8.1Have you optimized water vs air cooling loads? Yes 3
8.2Do you have uneven water distribution problems in cooling towers? No 7
8.2Do you have uneven water distribution problems in cooling towers? Yes 0
8.3How close are basin temperature approaches to wet bulb temp? Around 5°F 3
8.3How close are basin temperature approaches to wet bulb temp? > 5°F 0
8.4 Distribution piping fouling? No 18.4 Distribution piping fouling? Yes 08.5 Cooling water exchanger fouling problems? No 28.5 Cooling water exchanger fouling problems? Yes 08.6 Higher than design cooling loads? No 18.6 Higher than design cooling loads? Yes 0
8.7Do you monitor cooling water exchanger fouling rates and/or pressure drops? No 0
8.7Do you monitor cooling water exchanger fouling rates and/or pressure drops? Yes 7
8.8Do you have the following cooling water distribution problems in the process units? Capacity problems 2
25

Process Cooling and Refrigeration Scorecard QuestionsQuestion Number Question Answer Score
8.8Do you have the following cooling water distribution problems in the process units? Starving some users 2
8.9Do you have sludge or sediment problems in cooling tower basins? No 4
8.9Do you have sludge or sediment problems in cooling tower basins? Yes 0
9.1 Mechanical draft towers ((4*[Answer])/100)
9.1 If not, what is the primary reason:
Emergency on-line backup supply criteria 0
9.1 If not, what is the primary reason:
System capacity (high discharge pressures) 0
9.1 If not, what is the primary reason: Ease of operation 09.1 If not, what is the primary reason: N/A 0
9.11 What type of cooling tower fill is used? Splash Film 09.11 What type of cooling tower fill is used? Film Fill 1
9.12Do cooling tower fans have adjustable pitch blades? All 4
9.12Do cooling tower fans have adjustable pitch blades? Some 2
9.12Do cooling tower fans have adjustable pitch blades? None 0
9.13Do the cooling tower fans have adjustable speed drives? All 6
9.13Do the cooling tower fans have adjustable speed drives? Some 4
9.13Do the cooling tower fans have adjustable speed drives? None 0
9.2 Natural draft towers ((2*[Answer])/100)
9.3 Cooling ponds ((1*[Answer])/100)
9.4 Spray Ponds ((0*[Answer])/100)
9.5 Backpressure turbine drives ((5*[Answer])/100)
9.6 Variable speed drives ((3*[Answer])/100)
26

Process Cooling and Refrigeration Scorecard QuestionsQuestion Number Question Answer Score
9.7 Motor drives ((2*[Answer])/100)
9.8 Condensing turbine drives ((0*[Answer])/100)
9.9Are you running the minimum number of pumps? No 0
9.9Are you running the minimum number of pumps? Yes 3
10.1What is the general condition of cooling tower fill? Excellent 10
10.1What is the general condition of cooling tower fill? Adequate 5
10.1What is the general condition of cooling tower fill?
In need of replacement 0
Table B-4.Process Heating Scorecard QuestionsProcess Heating Scorecard Questions
Question Number Question Answer Score
1
Have you conducted a detail energy assessment for your heating equipment using tools such as Process Heating Survey and Assessment Tool (PHAST) to identify energy saving opportunities? No 0
1
Have you conducted a detail energy assessment for your heating equipment using tools such as Process Heating Survey and Assessment Tool (PHAST) to identify energy saving opportunities? Yes 150
2
Do you measure oxygen (O2) and Carbon Monoxide CO or combustible in flue gases and "tune" the burners periodically to maintain low values for O2 and combustibles in the furnace flue gases? No 0
2
Do you measure oxygen (O2) and Carbon Monoxide CO or combustible in flue gases and "tune" the burners periodically to maintain low values for O2 and combustibles in the furnace flue gases? Yes 100
3
Have you sealed openings in furnaces and repaired cracks, and damaged insulation in furnace walls, doors etc.? No 0
27

Process Heating Scorecard QuestionsQuestion Number Question Answer Score
3
Have you sealed openings in furnaces and repaired cracks, and damaged insulation in furnace walls, doors etc.? Yes 50
4
Do you regularly clean heat transfer surfaces to avoid build up of soot, scale or other material? No 0
4
Do you regularly clean heat transfer surfaces to avoid build up of soot, scale or other material? Yes 25
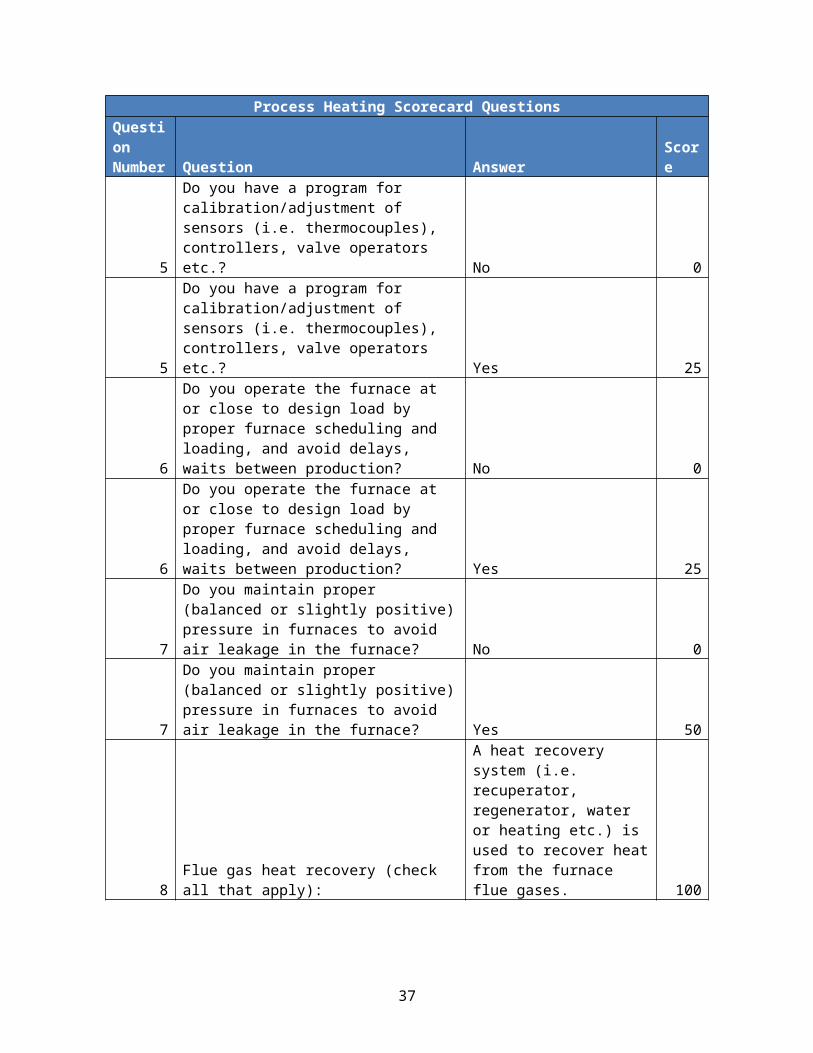
5
Do you have a program for calibration/adjustment of sensors (i.e. thermocouples), controllers, valve operators etc.? No 0
5
Do you have a program for calibration/adjustment of sensors (i.e. thermocouples), controllers, valve operators etc.? Yes 25
6
Do you operate the furnace at or close to design load by proper furnace scheduling and loading, and avoid delays, waits between production? No 0
6
Do you operate the furnace at or close to design load by proper furnace scheduling and loading, and avoid delays, waits between production? Yes 25
7
Do you maintain proper (balanced or slightly positive) pressure in furnaces to avoid air leakage in the furnace? No 0
7
Do you maintain proper (balanced or slightly positive) pressure in furnaces to avoid air leakage in the furnace? Yes 50
8 Flue gas heat recovery (check all that apply):
A heat recovery system (i.e. recuperator, regenerator, water or heating etc.) is used to recover heat from the furnace flue gases. 100
28

Process Heating Scorecard QuestionsQuestion Number Question Answer Score
8 Flue gas heat recovery (check all that apply):
"Heat of flue gases from the furnace or air preheater is used to heat charge material, fixtures etc." OR"Heat of flue gases from the furnace or air preheater is used for lower temperature processes such as steam generation, water heating or air heating for the plant or other application." 25
8 Flue gas heat recovery (check all that apply):
"A heat recovery system (i.e. recuperator, regenerator, water or heating etc.) is used to recover heat from the furnace flue gases." AND ("Heat of flue gases from the furnace or air preheater is used to heat charge material, fixtures etc." OR"Heat of flue gases from the furnace or air preheater is used for lower temperature processes such as steam generation, water heating or air heating for the plant or other application.") 67
9
Do you use design of fixtures, trays and other material handling system components with minimum weight and proper material? No 0
9
Do you use design of fixtures, trays and other material handling system components with minimum weight and proper material? Yes 50
10
Do you use proper insulation for (or minimize use of) water or air cooled parts such as rolls, load supports etc. used in furnaces? No 0
10
Do you use proper insulation for (or minimize use of) water or air cooled parts such as rolls, load supports etc. used in furnaces? Yes 50
11Are you using oxygen enriched air or oxy-fuel fired burners for high temperature processes? No 0
29

Process Heating Scorecard QuestionsQuestion Number Question Answer Score
11Are you using oxygen enriched air or oxy-fuel fired burners for high temperature processes? Yes 100
12
Are you using the most cost effective source of heat for processes where it is possible use alternate energy sources (i.e. steam vs. electricity vs. fuel firing) where applicable? No 0
12
Are you using the most cost effective source of heat for processes where it is possible use alternate energy sources (i.e. steam vs. electricity vs. fuel firing) where applicable? Yes 50
13
Do your heating equipment and other heated parts use cost effective type and thickness of insulation? No 0
13
Do your heating equipment and other heated parts use cost effective type and thickness of insulation? Yes 25
Table B-5. Pumps Scorecard QuestionsPumps Scorecard Questions
Question Number Question
Answer Score
1.1 Valve throttling or bypass flow regulation ([Answer] * 0)/1001.2 Turning pumps on and off to match needs ([Answer] * 35)/100
1.3Constant load - pump matched to meet need at pump best efficiency point ([Answer] * 50)/100
1.4 Adjustable speed drives ([Answer] * 45)/1001.5 Combination of above, other, or unknown ([Answer] * 20)/100
2.1 Are pump performance curves readily available?([Answer] * 3.75)/100
2.2Are the system head-capacity curves well understood (static and dynamic head components)?
([Answer] * 3.75)/100
2.3Are pumps tested at installation to compare performance with the manufacturer's curve?
([Answer] * 3.75)/100
2.4
Is motor power or current measured and pump efficiency estimated as a part of the installation test? ([Answer] * 2.5)/100
2.5
Are pumps periodically tested or performance measures trended to check for performance degradation? ([Answer] * 5)/100
30
Pumps Scorecard QuestionsQuestion Number Question
Answer Score
2.6
Do you evaluate the potential energy cost savings (compared to optimal commercially available equipment operating at the existing head and flow rates)? ([Answer] * 2.5)/100
2.7What percentage of your systems have permanently installed flow meters?
([Answer] * 3.75)/100
3.1
Do you purchase energy efficient or premium efficiency motors as a standard practice? (Applies to all motors, regardless of size) No 0
3.1
Do you purchase energy efficient or premium efficiency motors as a standard practice? (Applies to all motors, regardless of size) Yes 3.25
3.2Do you have a motor repair/replacement decision policy in place? (This question applies to all motors) No 0
3.2Do you have a motor repair/replacement decision policy in place? (This question applies to all motors) Yes 2.6
3.3
Do you include energy-efficiency guidelines in pump purchase specifications (e.g., minimum operating efficiency, specify precision castings, coated bowls, etc.)? No 0
3.3
Do you include energy-efficiency guidelines in pump purchase specifications (e.g., minimum operating efficiency, specify precision castings, coated bowls, etc.)? Yes 3.25
3.4
Are energy factors a primary consideration when repairing or replacing an existing pump that has failed? No 0
3.4
Are energy factors a primary consideration when repairing or replacing an existing pump that has failed? Yes 3.9
4.1Percentage of operators that could explain how to read and use a pump head-capacity curve: ([Answer] * 4.8)/100
4.2
Percentage of system engineers that could explain all standard pump performance curves: head, power, efficiency, and NPSHR: ([Answer] * 7.2)/100
31

Table B-6. Steam Generation Scorecard QuestionsSteam Generation Scorecard Questions
Question Number Question Answer Score
1.1Do you monitor your Fuel Cost To Generate Steam - in terms of ($) / (1000 lbs. of steam produced)? No 0
1.1Do you monitor your Fuel Cost To Generate Steam - in terms of ($) / (1000 lbs. of steam produced)? Yes 10
1.2How often do you calculate and trend your Fuel Cost To Generate Steam? at least quarterly 10
1.2How often do you calculate and trend your Fuel Cost To Generate Steam? at least annually 5
1.2How often do you calculate and trend your Fuel Cost To Generate Steam? less than annually 0
2.1
Do you Measure your Steam/Product Benchmark - in terms of (lbs. of steam needed) / (unit of product produced)? No 0
2.1
Do you Measure your Steam/Product Benchmark - in terms of (lbs. of steam needed) / (unit of product produced)? Yes 10
2.2
How often do you Measure and Trend your Steam/Product Benchmark - in terms of (lbs. of steam needed) / (unit of product produced)? at least quarterly 10
2.2
How often do you Measure and Trend your Steam/Product Benchmark - in terms of (lbs. of steam needed) / (unit of product produced)? at least annually 5
2.2
How often do you Measure and Trend your Steam/Product Benchmark - in terms of (lbs. of steam needed) / (unit of product produced)? less than annually 0
3.1Do you measure and record Critical Energy Parameters for your Steam System?
Steam Production Rate (to obtain total steam production) 10
3.1Do you measure and record Critical Energy Parameters for your Steam System?
Fuel Flow Rate (to obtain total fuel consumption) 6
3.1Do you measure and record Critical Energy Parameters for your Steam System? Feedwater Flow Rate 6
3.1Do you measure and record Critical Energy Parameters for your Steam System?
Makeup Water Flow Rate 4
3.1Do you measure and record Critical Energy Parameters for your Steam System? Blowdown Flow Rate 2
3.1Do you measure and record Critical Energy Parameters for your Steam System?
Chemical Input Flow Rate 2
3.2 How intensely do you meter your steam flows? by major user/equip 20
32

Steam Generation Scorecard QuestionsQuestion Number Question Answer Score
3.2 How intensely do you meter your steam flows? by process unit 103.2 How intensely do you meter your steam flows? by area or building 5
3.2 How intensely do you meter your steam flows?by plant as a whole (i.e., total boiler output) 2
3.2 How intensely do you meter your steam flows? not at all 0
4.1Does Your System Steam Trap Maintenance Program Include The Following Activities?
Proper Trap Selection For Application 10
4.1Does Your System Steam Trap Maintenance Program Include The Following Activities?
At Least Annual Testing Of All Traps 10
4.1Does Your System Steam Trap Maintenance Program Include The Following Activities?
Maintaining A Steam Trap Database 10
4.1Does Your System Steam Trap Maintenance Program Include The Following Activities?
Repairing/Replacing Defective Traps 10
5.1How often do you ensure that your Water Chemical Treatment System is functioning properly? at least daily 10
5.1How often do you ensure that your Water Chemical Treatment System is functioning properly? at least weekly 5
5.1How often do you ensure that your Water Chemical Treatment System is functioning properly? less than weekly 0
5.2How often do you NEED to clean Fireside or Waterside deposits in your Boiler? every 5-10 years 10
5.2How often do you NEED to clean Fireside or Waterside deposits in your Boiler? every 1-5 years 5
5.2How often do you NEED to clean Fireside or Waterside deposits in your Boiler? once/year or more 0
5.3
How often do you measure Conductivity (or Total Dissolved Solids [TDS]) in your Boiler and determine what your Steam and Mud Drum Blowdown Rate (or Top and Bottom Boiler Blowdown Rate) should be?
continuous, or at least once/shift 10
5.3
How often do you measure Conductivity (or Total Dissolved Solids [TDS]) in your Boiler and determine what your Steam and Mud Drum Blowdown Rate (or Top and Bottom Boiler Blowdown Rate) should be? once/day 5
5.3
How often do you measure Conductivity (or Total Dissolved Solids [TDS]) in your Boiler and determine what your Steam and Mud Drum Blowdown Rate (or Top and Bottom Boiler Blowdown Rate) should be? once/week or less 0
6.1
Is your Boiler Plant equipment and piping system insulation (refractory, piping, valves, flanges, vessels, etc.) maintained and in good condition? insulation excellent 10
33

Steam Generation Scorecard QuestionsQuestion Number Question Answer Score
6.1
Is your Boiler Plant equipment and piping system insulation (refractory, piping, valves, flanges, vessels, etc.) maintained and in good condition?
insulation good, but can be improved 7
6.1
Is your Boiler Plant equipment and piping system insulation (refractory, piping, valves, flanges, vessels, etc.) maintained and in good condition? insulation inadequate 0
6.2
Is your Steam Distribution, End Use, and Condensate Recovery equipment insulation (piping, valves, flanges, heat exchangers, etc.) maintained and in good condition? insulation excellent 20
6.2
Is your Steam Distribution, End Use, and Condensate Recovery equipment insulation (piping, valves, flanges, heat exchangers, etc.) maintained and in good condition?
insulation good, but can be improved 14
6.2
Is your Steam Distribution, End Use, and Condensate Recovery equipment insulation (piping, valves, flanges, heat exchangers, etc.) maintained and in good condition? insulation inadequate 0
7.1How would you characterize Steam Leaks in your Steam System? none 10
7.1How would you characterize Steam Leaks in your Steam System? minor 8
7.1How would you characterize Steam Leaks in your Steam System? moderate 3
7.1How would you characterize Steam Leaks in your Steam System? numerous 0
8.1How often do you detect noticeable Water Hammer in your Steam and Condensate Recovery System? less than once a month 10
8.1How often do you detect noticeable Water Hammer in your Steam and Condensate Recovery System? monthly or weekly 5
8.1How often do you detect noticeable Water Hammer in your Steam and Condensate Recovery System? daily or hourly 0
9.1
Boiler Plant Equipment - boiler, deaerator, feedwater tank, chemical treatment equipment, blowdown equipment, economizer, combustion air preheater, insulation, etc.? No 0
9.1
Boiler Plant Equipment - boiler, deaerator, feedwater tank, chemical treatment equipment, blowdown equipment, economizer, combustion air preheater, insulation, etc.? Yes 5
34

Steam Generation Scorecard QuestionsQuestion Number Question Answer Score
9.2
Distribution System Equipment - piping (including design), steam traps (types, sizes, locations), air vents, valves, pressure reducing stations, insulation, etc.? No 0
9.2
Distribution System Equipment - piping (including design), steam traps (types, sizes, locations), air vents, valves, pressure reducing stations, insulation, etc.? Yes 5
9.3
End Use System Equipment - turbines, piping (including design), heat exchangers, coils, jacketed kettles, steam traps (types, sizes, locations), air vents, vacuum breakers, pressure reducing valves, insulation, etc.? No 0
9.3
End Use System Equipment - turbines, piping (including design), heat exchangers, coils, jacketed kettles, steam traps (types, sizes, locations), air vents, vacuum breakers, pressure reducing valves, insulation, etc.? Yes 5
9.4
Recovery System Equipment - piping (including design), valves, fittings, flash tanks, condensate pumps, condensate meters, insulation, etc.? No 0
9.4
Recovery System Equipment - piping (including design), valves, fittings, flash tanks, condensate pumps, condensate meters, insulation, etc.? Yes 5
10.1
How often do you measure your overall Boiler Efficiency - [(heat absorbed to create steam) / (energy input from fuel)]? at least quarterly 10
10.1
How often do you measure your overall Boiler Efficiency - [(heat absorbed to create steam) / (energy input from fuel)]? at least annually 5
10.1
How often do you measure your overall Boiler Efficiency - [(heat absorbed to create steam) / (energy input from fuel)]? less than annually 0
10.2 Flue gas temperature? No 010.2 Flue gas temperature? Yes 510.3 Flue gas Oxygen content? No 010.3 Flue gas Oxygen content? Yes 510.4 Flue gas CO content? No 010.4 Flue gas CO content? Yes 5
10.5How do you control Excess Air in your Boiler to maximize Boiler Efficiency? automatically 10
35

Steam Generation Scorecard QuestionsQuestion Number Question Answer Score
10.5How do you control Excess Air in your Boiler to maximize Boiler Efficiency? manually 5
10.5How do you control Excess Air in your Boiler to maximize Boiler Efficiency? not at all 0
11.1Feedwater Economizer and/or Combustion Air Preheater No 0
11.1Feedwater Economizer and/or Combustion Air Preheater Yes 10
11.2 Blowdown Heat Recovery No 011.2 Blowdown Heat Recovery Yes 5
12.1
How often do you check the Quality of Steam that is output from your Boiler to the Distribution System, and ensure that you are generating Dry Steam? at least quarterly 10
12.1
How often do you check the Quality of Steam that is output from your Boiler to the Distribution System, and ensure that you are generating Dry Steam? at least annually 5
12.1
How often do you check the Quality of Steam that is output from your Boiler to the Distribution System, and ensure that you are generating Dry Steam? less than annually 0
13.1Do you have an operational automatic blowdown controller on your Boiler? No 0
13.1Do you have an operational automatic blowdown controller on your Boiler? Yes 10
13.2
What is the frequency of High Level Alarms (possibly indicating boiler undersized) or Low Level Alarms (possibly indicating boiler oversized) for your Boiler? less than 1/month 10
13.2
What is the frequency of High Level Alarms (possibly indicating boiler undersized) or Low Level Alarms (possibly indicating boiler oversized) for your Boiler? 1-5 per month 5
13.2
What is the frequency of High Level Alarms (possibly indicating boiler undersized) or Low Level Alarms (possibly indicating boiler oversized) for your Boiler? more than 5/month 0
13.3
How often do you experience steam pressure fluctuations of greater than 10% of your Boiler Operating Pressure? less than 1/month 5
13.3
How often do you experience steam pressure fluctuations of greater than 10% of your Boiler Operating Pressure? 1-5 per month 3
13.3
How often do you experience steam pressure fluctuations of greater than 10% of your Boiler Operating Pressure? more than 5/month 0
36

Steam Generation Scorecard QuestionsQuestion Number Question Answer Score
14.1How do you reduce steam pressure in your steam system?
Steam generated at required pressure or PRVs appropriately applied 10
14.1How do you reduce steam pressure in your steam system?
Backpressure turbines used in parallel with PRVs 10
14.1How do you reduce steam pressure in your steam system?
Boiler control used to reduce pressure 5
14.1How do you reduce steam pressure in your steam system?
Excess steam vented and/or used inefficiently 0
15.1How much of your available Condensate do you recover and utilize? greater than 80% 10
15.1How much of your available Condensate do you recover and utilize? 40% to 80% 6
15.1How much of your available Condensate do you recover and utilize? 20% to 40% 3
15.1How much of your available Condensate do you recover and utilize? less than 20% 0
16.1How much of your available Flash Steam do you recover and utilize?
greater than 80%, or flash steam unavailable 10
16.1How much of your available Flash Steam do you recover and utilize? 40% to 80% 6
16.1How much of your available Flash Steam do you recover and utilize? 20% to 40% 3
16.1How much of your available Flash Steam do you recover and utilize? less than 20% 0
37

APPENDIX C. PEPEX Suggested Next Steps
38
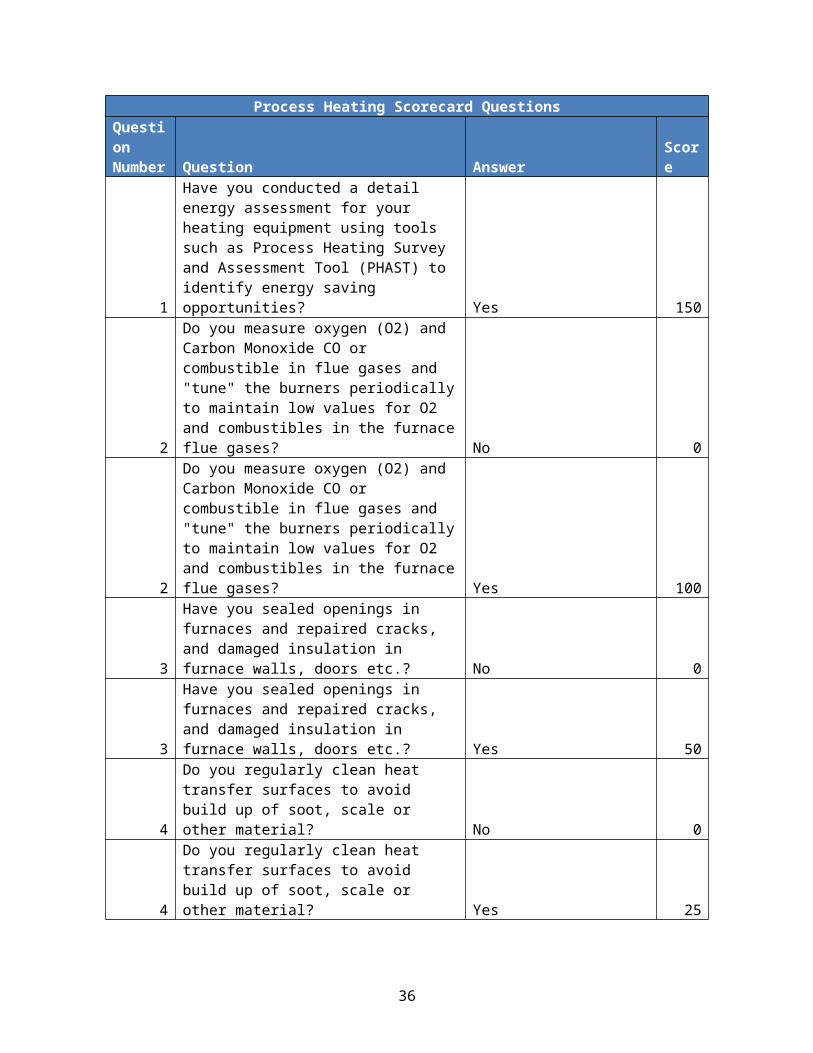
Table C-1. Suggested Next StepsCategory Recommendation Savings
OpportunityCombined heat and power (cogeneration)
Consider use of heat from diesel generator engine (cooling water and exhaust gases) for steam generation or in heating processes.
High
Combined heat and power (cogeneration)
Consider use of heat from gas turbine exhaust gases for steam generation or in heating processes
High
Combined heat and power (cogeneration)
Develop and implement a preventive and predictive maintenance program for the system
High
Combined heat and power (cogeneration)
Maximize use of HRSG to meet the plant steam requirements, minimize load on boilers outside the co-gen system
High
Combined heat and power (cogeneration)
Consider use of HRSG with a duct burner (if not used currently) for gas turbine based on-site power generation system
Medium
Combined heat and power (cogeneration)
Investigate possibility of selling excess steam or/and power if there is a potential customer close by
Medium
Combined heat and power (cogeneration)
Minimize flue gases temperature from HRSG by recovering heat from HRSG flue gases
Medium
Combined heat and power (cogeneration)
Use system optimization tools to minimize combined cost of steam and electric power for the plant
Medium
Combined heat and power (cogeneration)
Analyze economics of use of additional CHP capacity to reduce peak power demand for the plant
Low
Combined heat and power (cogeneration)
Consider evaporative cooling for turbine combustion air using HRSG exhaust gases or other source of waste heat
Low
Combined heat and power (cogeneration)
Consider use of turbine exhaust gases for process heating equipment (process heaters, furnaces etc.)
Low
Compressed air Eliminate inappropriate uses of compressed air HighCompressed air Implement air leak management program HighCompressed air Perform a detailed Compressed Air System
Assessment at your siteHigh
Compressed air Reduce compressor operating pressure with or without controls
High
Compressed air Use the DOE AirMaster+ software tool & other resources to identify and quantify energy saving opportunities
High
Compressed air Implement the recommendations of the Compressed Air System Assessment at your site
Medium
Compressed air Install and operate equipment (including storage) that matches shifting demands
Medium
Compressed air Install or upgrade system controls MediumCompressed air Use the DOE AirMaster+ software tool & other
resources to verify energy saving opportunitiesMedium
Compressed air Evaluate heat recovery with compressed air systems Low
39
Compressed air Monitor performance and document energy and cost savings on recently completed projects
Low
Compressed air Replace inefficient cooling and drying equipment LowCompressed air Install instrumentation to measure and trend
compressed air cost indicators (kW/100 cfm)Medium, Low
Fans and Blowers Evaluate and reduce "system effect" through better inlet and outlet designs and duct sizing
High
Fans and Blowers Improve O&M practices such as belt tightening, cleaning fans and changing filters regularly
High
Fans and Blowers Minimize leakage and perform tightness tests, if needed
High
Fans and Blowers Perform a detailed Fan and Blower System Assessment at your site
High
Fans and Blowers Replace dampers, variable inlet vanes with electronic variable speed drives for meeting variable loads
High
Fans and Blowers Use the DOE FSAT software tool & other resources to identify and quantify energy saving opportunities
High
Fans and Blowers Implement the recommendations of the Fans / Blowers System Assessment at your site
Medium
Fans and Blowers Reduce and control fan speed by using variable speed drives
Medium
Fans and Blowers Reduce fan oversizing by matching demand with proper fan type and size (for example: Use of axial fan with controllable pitch blades)
Medium
Fans and Blowers Replace standard V-belts with cogged V-belts MediumFans and Blowers Use the DOE FSAT software tool & other resources to
verify energy saving opportunitiesMedium
Fans and Blowers Evaluate use of a back-pressure turbine drive instead of an electric motor, if applicable
Low
Fans and Blowers Evaluate use of multiple smaller fans (operating close to their Best Efficiency Point) than one large fan
Low
Fans and Blowers Install instrumentation to measure and trend fan performance (efficiency) periodically
Low
Fans and Blowers Monitor performance and document energy and cost savings on recently completed projects
Low
Fans and Blowers Replace electric motor with premium efficiency model
Low
Fans and Blowers Replace fan / blower with more efficient model LowIndustrial Facilities: (Lighting, HVAC, and Facility Support)
Evaluate lighting upgrades that includes implementing group relamp & maintenance programs
High
Industrial Facilities: (Lighting, HVAC, and Facility Support)
Implement night setback and weekend/vacation temperature / ventilation controls
High
Industrial Facilities: Install occupancy sensors High
40

(Lighting, HVAC, and Facility Support)Industrial Facilities: (Lighting, HVAC, and Facility Support)
Perform a detailed Lighting & HVAC System Assessment at your site to identify and quantify energy saving opportunities
High
Industrial Facilities: (Lighting, HVAC, and Facility Support)
Shut-off steam / chilled water flows to air handlers that are not needed or are out of service
High
Industrial Facilities: (Lighting, HVAC, and Facility Support)
Implement lighting control systems and zone areas based on task lighting
Medium
Industrial Facilities: (Lighting, HVAC, and Facility Support)
Implement the recommendations of the Lighting and HVAC System Assessment at your site
Medium
Industrial Facilities: (Lighting, HVAC, and Facility Support)
Install dry-bulb and/or enthalpy economizers Medium
Industrial Facilities: (Lighting, HVAC, and Facility Support)
Optimize the operation of air handling units - start/stop
Medium
Industrial Facilities: (Lighting, HVAC, and Facility Support)
Rebalance the air-side system to reduce overall supply or meet changed zone demands
Medium
Industrial Facilities: (Lighting, HVAC, and Facility Support)
Evaluate incorporating daylighting, skylights, dimming, etc.
Low
Industrial Facilities: (Lighting, HVAC, and Facility Support)
Implement a central computerized Energy Management System
Low
Industrial Facilities: (Lighting, HVAC, and Facility Support)
Implement demand controlled ventilation (CO2 sensor-based)
Low
Industrial Facilities: (Lighting, HVAC, and Facility Support)
Install instrumentation to measure and trend efficiency (Watts per sq. ft) periodically
Low
Industrial Facilities: (Lighting, HVAC, and Facility Support)
Monitor performance and document energy and cost savings on recently completed projects
Low
Industrial Facilities: (Lighting, HVAC, and Facility Support)
Replace air conditioning unit or air handling unit with a properly sized higher efficiency unit
Low
Process cooling and refrigeration
Ensure proper refrigerant charge and eliminate non-condensable from the system
High
Process cooling and refrigeration
Evaluate use of variable speed drives on chilled water pumps, cooling tower fans, etc.
High
Process cooling and refrigeration
Float head pressure to minimum possible High
41

Process cooling and refrigeration
Implement chilled water temperature and condenser water temperature reset
High
Process cooling and refrigeration
Perform a detailed Refrigeration / Process Cooling System Assessment at your site
High
Process cooling and refrigeration
Use the DOE CWSAT software tool & other resources to identify and quantify energy saving opportunities
High
Process cooling and refrigeration
Eliminate fouling on heat exchanger tubes Medium
Process cooling and refrigeration
Evaluate use of an economizer in the system (cooling tower water vs. chilled water)
Medium
Process cooling and refrigeration
Implement a predictive maintenance program that correlates performance with fluid contaminants in the system
Medium
Process cooling and refrigeration
Implement the recommendations of the Refrigeration / Process Cooling System Assessment at your site
Medium
Process cooling and refrigeration
Incorporate optimized chiller sequencing and controls
Medium
Process cooling and refrigeration
Use the DOE CWSAT software tool & other resources to verify energy saving opportunities
Medium
Process cooling and refrigeration
Convert air-cooled chillers to water-cooled units Low
Process cooling and refrigeration
Evaluate chiller replacement (type, size) for a more efficient overall system or plant efficiency
Low
Process cooling and refrigeration
Evaluate heat recovery from chiller systems Low
Process cooling and refrigeration
Evaluate use of thermally driven (absorption, engine, steam-turbine driven) chiller systems to balance steam and electric demand
Low
Process cooling and refrigeration
Install instrumentation to measure and trend individual compressor and overall system performance (efficiency - kW/ton) periodically
Low
Process cooling and refrigeration
Monitor performance and document energy and cost savings on recently completed projects
Low
Process heating Conduct a detail energy assessment for your heating equipment using tools such as Process Heating Survey and Assessment Tool (PHAST) to identify energy saving opportunities.
High
Process heating Keep heat transfer surfaces clean by eliminating build up of soot, scale or other material.
High
Process heating Measure oxygen (O2) and Carbon Monoxide CO or combustible in flue gases and take actions to reduce O2 in flue gases while maintaining near zero value for CO or combustibles. In certain cases safety requirements may require to have high values of O2 in flue gases. Consult your equipment supplier before making any changes.
High
42

Process heating Operate the furnace at or close to design load by proper furnace scheduling and loading- avoid delays, waits, cooling between operations etc. as much a possible.
High
Process heating Reduce or eliminate openings in the furnace to reduce radiation heat losses. Repair cracks and damaged insulation in furnace walls, doors etc. Keep the door opening to minimum during operations.
High
Process heating Consider use of combustion air preheating by recovering heat from furnace flue gases. Evaluate use of recuperator, regenerators or regenerative burners.
Medium
Process heating Consider use of heat from furnace flue gases to heat charge material, fixtures etc.
Medium
Process heating Insulate water or air cooled parts used in the furnaces. Examples are: rolls, supports etc. used in furnaces.
Medium
Process heating Maintain proper (balanced or slightly positive) pressure in furnaces using proper control to avoid air leakage in the furnace.
Medium
Process heating Reduce weight of fixtures, trays and other material handling weight and use 'hot-return' as much as possible.
Medium
Process heating Consider use of alternate source of heat such as switching from steam heating to direct fired heating for processes where possible. Consider safety and process requirements before making changes.
Low
Process heating Consider use of heat from furnace flue gases in lower temperature processes, for steam generation, for water heating or air heating for the plant or other applications.
Low
Process heating Consider use of oxygen enriched air or oxy-fuel fired burners for high temperature processes.
Low
Process heating Design and build or rebuild furnaces and other heated components with adequate insulation to reduce wall heat losses
Low
Pumps Evaluate the use of adjustable speed drives on pumps that have variable flow and are being throttled
High
Pumps Explore the potential for using a fixed speed pump to supply base load and a smaller, properly sized fixed speed pump for trim
High
Pumps Perform a detailed Pumping System Assessment at your site
High
Pumps Turn pumps ON and OFF to match needs HighPumps Use the DOE PSAT software tool & other resources
to identify and quantify energy saving opportunitiesHigh
43

Pumps Identify the true pumping need (flow rate and head required) and ensure pumps are operating at their best efficiency point
Medium
Pumps Implement the recommendations of the Pumping System Assessment at your site
Medium
Pumps Use the DOE PSAT software tool & other resources to verify energy saving opportunities
Medium
Pumps Monitor performance and document energy and cost savings on recently completed projects
Low
Pumps Purchase premium efficiency motors and specify energy efficiency guidelines for new pump purchases and/or retrofits
Low
Pumps Install instrumentation to measure and trend pump performance (efficiency) periodically
Medium, Low
Steam Generation Equipment
Implement a BestPractices based leak management program
High
Steam Generation Equipment
Improve boiler efficiency by proper air/fuel control High
Steam Generation Equipment
Improve boiler efficiency by proper blowdown management
High
Steam Generation Equipment
Improve condensate recovery High
Steam Generation Equipment
Improve thermal insulation of the overall steam system
High
Steam Generation Equipment
Perform a detailed Steam Energy System Assessment at your site
High
Steam Generation Equipment
Use the DOE Steam BestPractices Tools to identify and quantify energy saving opportunities
High
Steam Generation Equipment
Implement the recommendations of the Steam Energy System Assessment at your site
Medium
Steam Generation Equipment
Improve boiler efficiency by proper air/fuel control, blowdown management, etc.
Medium
Steam Generation Equipment
Use the DOE Steam BestPractices Tools to re-verify energy saving opportunities & prioritize
Medium
Steam Generation Equipment
Evaluate the use of back pressure steam turbines in lieu of pressure reducing stations
Low
Steam Generation Equipment
Implement heat recovery opportunities viz. economizers, combustion air preheaters, etc.
Low
Steam Generation Equipment
Install instrumentation to measure and trend steam cost indicators ($/Mlb)
Low
Steam Generation Equipment
Monitor performance and document energy and cost savings on recently completed projects
Low
Steam Generation Equipment
Implement a BestPractices based steam trap maintenance program
High, Medium
Steam Generation Equipment
Install instrumentation to measure and trend steam cost indicators ($/Mlb)
Medium, Low
44

45