overview of ats trends in east and southeast asiaoverview of ats trends in east and southeast asia....
TRANSCRIPT

Overview of ATS trends in East and Southeast Asia
Presentation to Global SMART Programme Regional WorkshopShawn Kelley
Research AnalystGlobal SMART Programme
Phnom Penh, Cambodia24 July 2012

Structure
1. Overview of general drug trends in East and South-East Asia
2. ATS trends in East and South-East Asia
3. Key points

• Opium: resurgence of poppy cultivation
• Heroin: re-emerging threat
• Cannabis: use remains at high levels
• Inhalants/solvents: young users
• Cocaine: likely expansion of market in E/SE Asia
Source: DAINAP
General drug trends
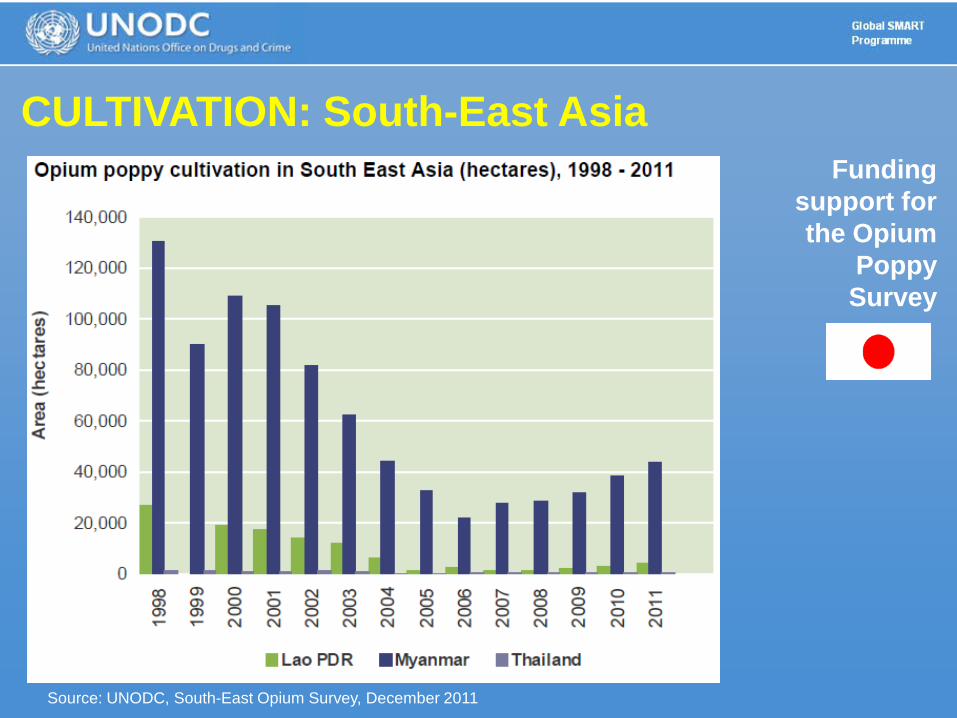
CULTIVATION: South-East AsiaFunding
support for the Opium
Poppy Survey
Source: UNODC, South-East Opium Survey, December 2011
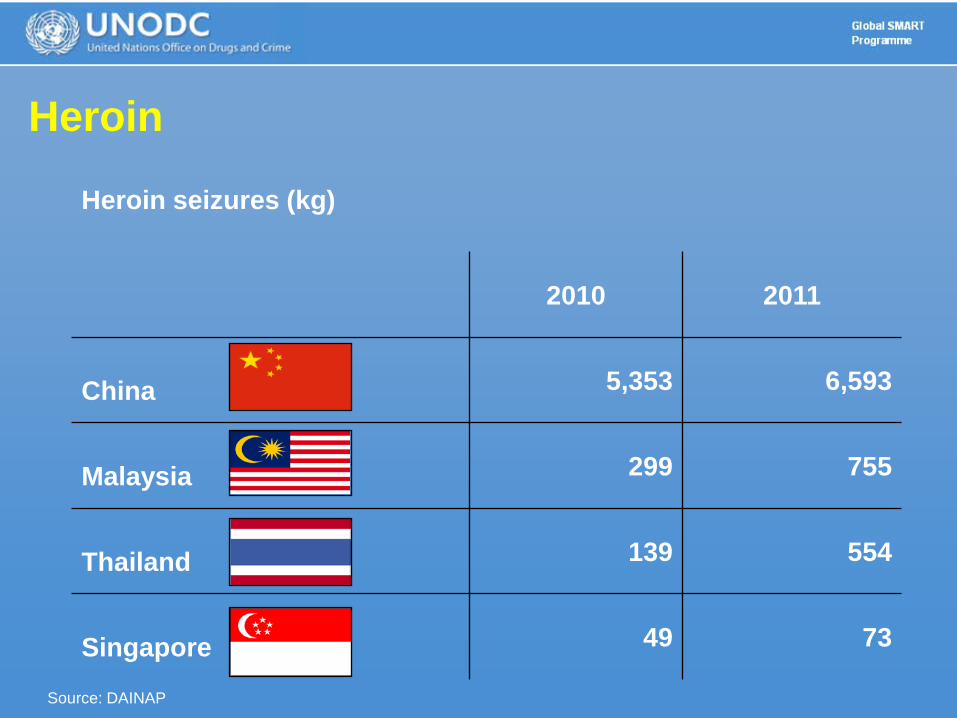
Heroin
Heroin seizures (kg)
2010 2011
China 5,353 6,593
Malaysia 299 755
Thailand 139 554
Singapore 49 73
Source: DAINAP

• 650 kg seized in HK in July 2012
• Destined for South-East Asia
• Links to Mexican and Colombian cartels
E / SE Asia cocaine market
Source (photo): Associated Press

Structure
1. Overview of general drug trends in East and South-East Asia
2. ATS trends in East and South-East Asia
3. Key points

1. ATS rank in top 3 drugs in region2. High levels of ATS manufacture3. Meth spillover from Myanmar4. Shift in precursor sourcing5. Injecting meth use6. Lack of ATS treatment services7. TOC activity – local, African, Iranian8. Emerging new synthetic substances
Key emerging ATS trends identified 2010
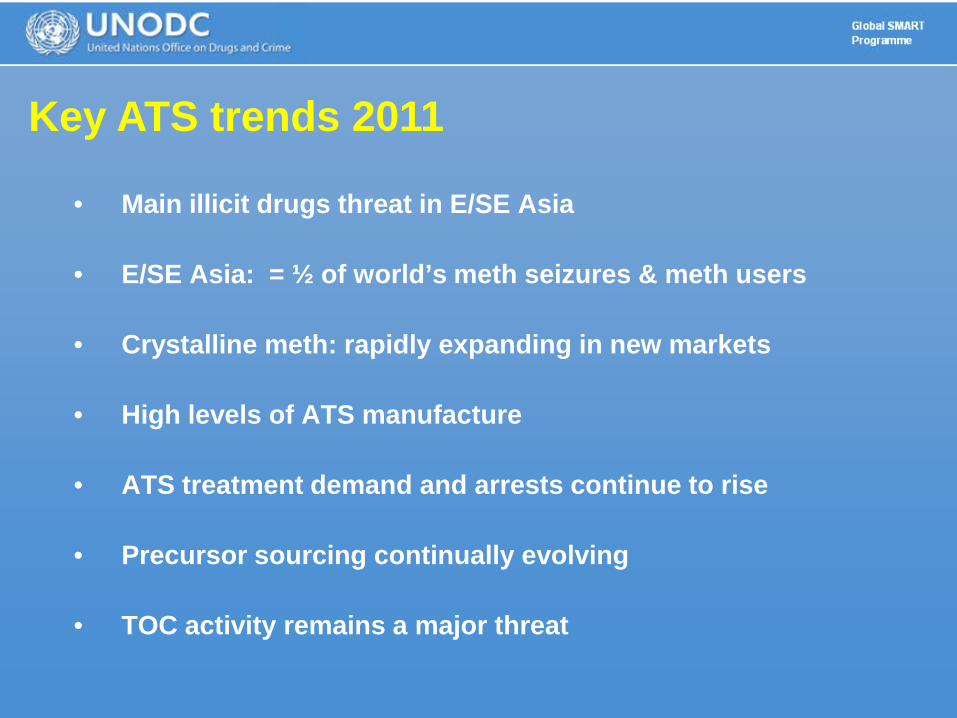
• Main illicit drugs threat in E/SE Asia
• E/SE Asia: = ½ of world’s meth seizures & meth users
• Crystalline meth: rapidly expanding in new markets
• High levels of ATS manufacture
• ATS treatment demand and arrests continue to rise
• Precursor sourcing continually evolving
• TOC activity remains a major threat
Key ATS trends 2011

Methamphetamine pill seizures (2006-2011)
* 2011 data are preliminary and likely to be revised upward
Source: DAINAP
• 2011: Total seizures 115 million• 2010: Total seizures 136 million
0
20,000,000
40,000,000
60,000,000
80,000,000
100,000,000
120,000,000
140,000,000
160,000,000
2006 2007 2008 2009 2010 2011*
Num
ber o
f pill
s sei
zed

• 2011: Total seizures 7.1 metric tons • 2010: 6.1 metric tons
* 2011 data are preliminary and likely to be revised upward
Source: DAINAP
Crystalline meth seizures (2006-2011)
0.00
1,000.00
2,000.00
3,000.00
4,000.00
5,000.00
6,000.00
7,000.00
8,000.00
9,000.00
2006 2007 2008 2009 2010 2011*
Seizu
res (
kg)

ASEAN + China (2004-2011**)
**For countries which provided disaggregated arrest data by drug type.
Methamphetamine-related arrests
Source: DAINAP
* 2011 data are preliminary and likely to be revised upward
0
50,000
100,000
150,000
200,000
250,000
300,000
350,000
2006 2007 2008 2009 2010 2011*
Num
ber o
f arr
ests

Ecstasy pill seizures (2006-2011)
0
1,000,000
2,000,000
3,000,000
4,000,000
5,000,000
6,000,000
7,000,000
2006 2007 2008 2009 2010 2011
Numb
er of
pills
seize
d
* 2011 data are preliminary and likely to be revised upward
• 2011: Total seizures 1.4 million pills
Source: DAINAP
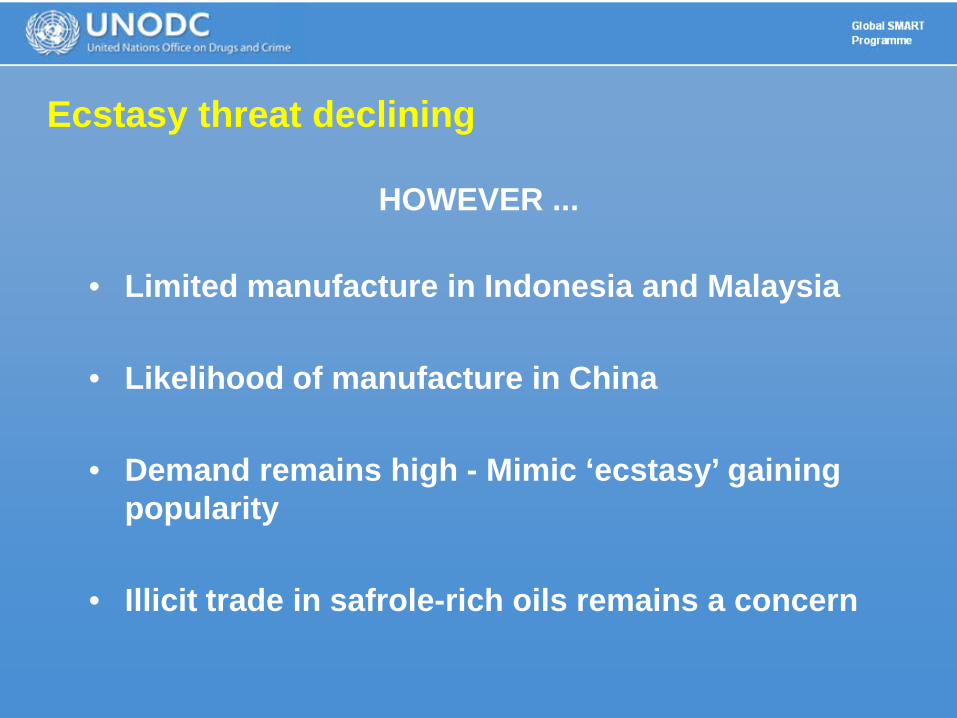
• Limited manufacture in Indonesia and Malaysia
• Likelihood of manufacture in China
• Demand remains high - Mimic ‘ecstasy’ gaining popularity
• Illicit trade in safrole-rich oils remains a concern
HOWEVER ...
Ecstasy threat declining
Structure
1. Overview of general drug trends in East and South-East Asia
2. ATS trends in East and South-East Asia
3. Key points

Methamphetamine pillsBRU CAM CHI IND LAO MAL MYA PHI SIN THA VIE
● 1 2 ●● 1 9 3 ● ● 1 2
Crystalline methamphetamineBRU CAM CHI IND LAO MAL MYA PHI SIN THA VIE
1 2 2 1 ● 3* ● 1 2 7 2
EcstasyBRU CAM CHI IND LAO MAL MYA PHI SIN THA VIE
● ● 3 5 ● 5 ● ● 8 9 2
…for the third consecutive year ?
Note: Numbers denote drugs of concern in ranking order. “1” refers to the top drug of concern as perceived by experts in respective countries. “” indicates no ranking reported.
= increasing trend = decreasing trend= stable trend = no trend reported
1. ATS rank in top 3 drug in the region
Source: DAINAP
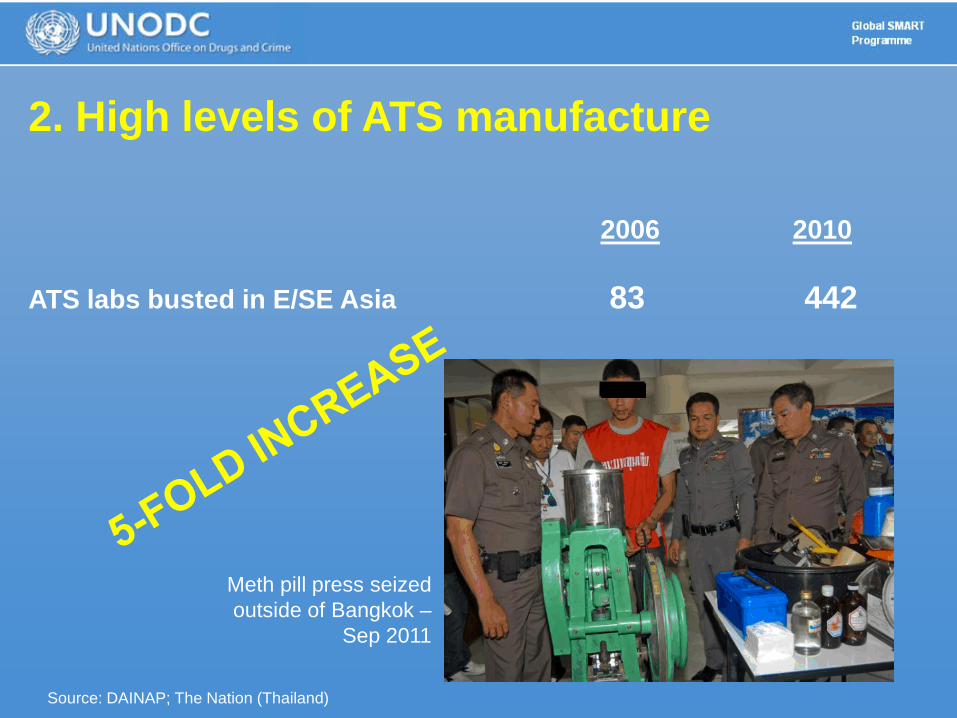
ATS labs busted in E/SE Asia 83 442
2006 2010
Meth pill press seized outside of Bangkok –
Sep 2011
2. High levels of ATS manufacture
Source: DAINAP; The Nation (Thailand)
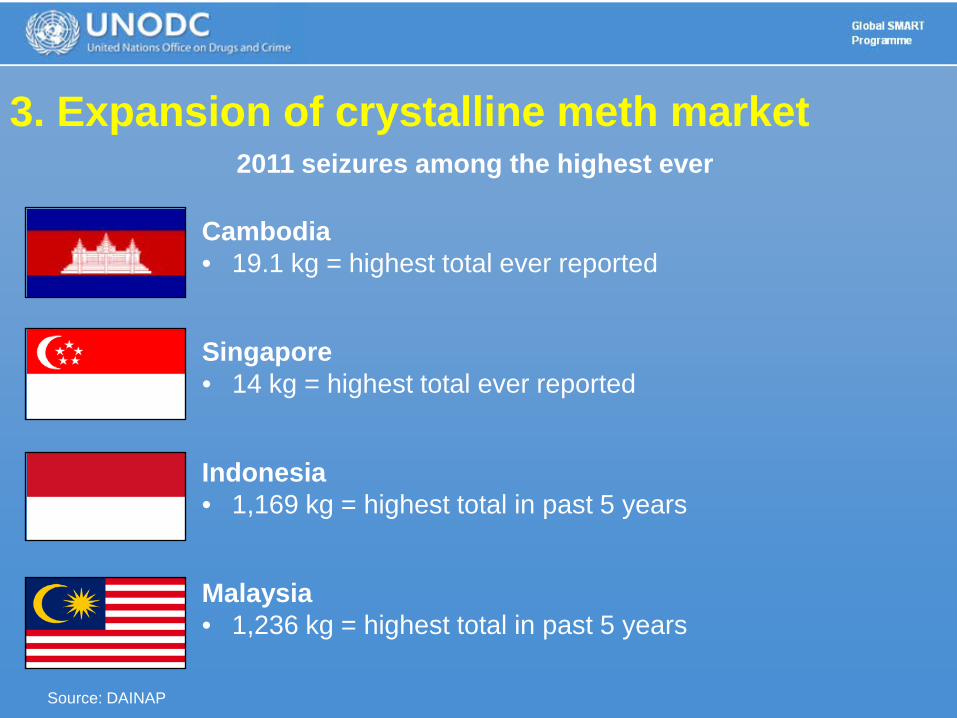
Source: DAINAP
Singapore• 14 kg = highest total ever reported
Indonesia• 1,169 kg = highest total in past 5 years
Malaysia • 1,236 kg = highest total in past 5 years
Cambodia• 19.1 kg = highest total ever reported
2011 seizures among the highest ever
3. Expansion of crystalline meth market

Source: DAINAP
Myanmar• 2012: largest ever bust – 73 kg + 274 kg of liquid meth
Thailand• 2011: seizures of 1.2 mt• Massive 5-year increase (47 kg seized in 2007)
China• 2011: nearly 4.5 mt seized
‘Golden Triangle’ region
3. Expansion of crystalline meth market

Source: DAINAP; ONCB Annual reports 2010 and previous years
Crystalline meth seizures in Thailand (2000 - 2011)
322.6 209.0
1,204.5
733.0
47.492.248.9
47.3
8.20.010.3552.9
0
200
400
600
800
1000
1200
1400
2000 2001 2002 2003 2004 2005 2006 2007 2008 2009 2010 2011
Amou
nt se
ized
(kg)
3. Expansion of crystalline meth in Thailand
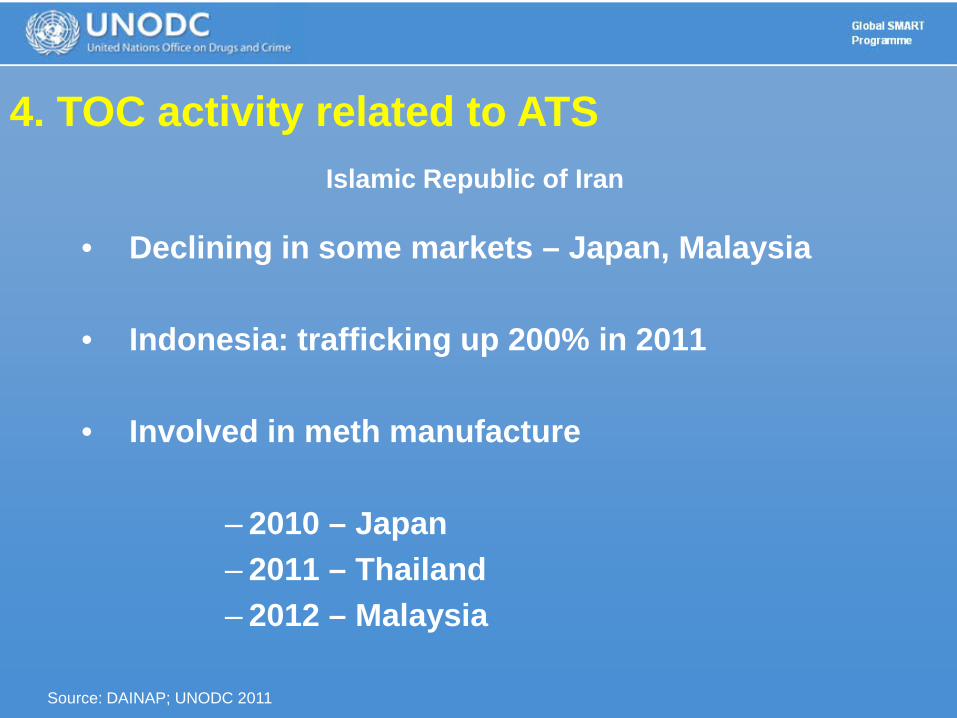
• Declining in some markets – Japan, Malaysia
• Indonesia: trafficking up 200% in 2011
• Involved in meth manufacture
– 2010 – Japan– 2011 – Thailand– 2012 – Malaysia
4. TOC activity related to ATSIslamic Republic of Iran
Source: DAINAP; UNODC 2011

• Active in SE Asia since 1980s
• Smuggled Golden Triangle heroin to Europe and USA
• WA males as drug couriers
• Mid-1990s: shifted to Afghan heroin
• Cocaine trafficking to E/SE Asia
• SE Asian nationals as couriers
• Region-wide networks
4. TOC activity related to ATSWest African Drug Syndicates
Source: Global SMART Programme, ADEC 2012
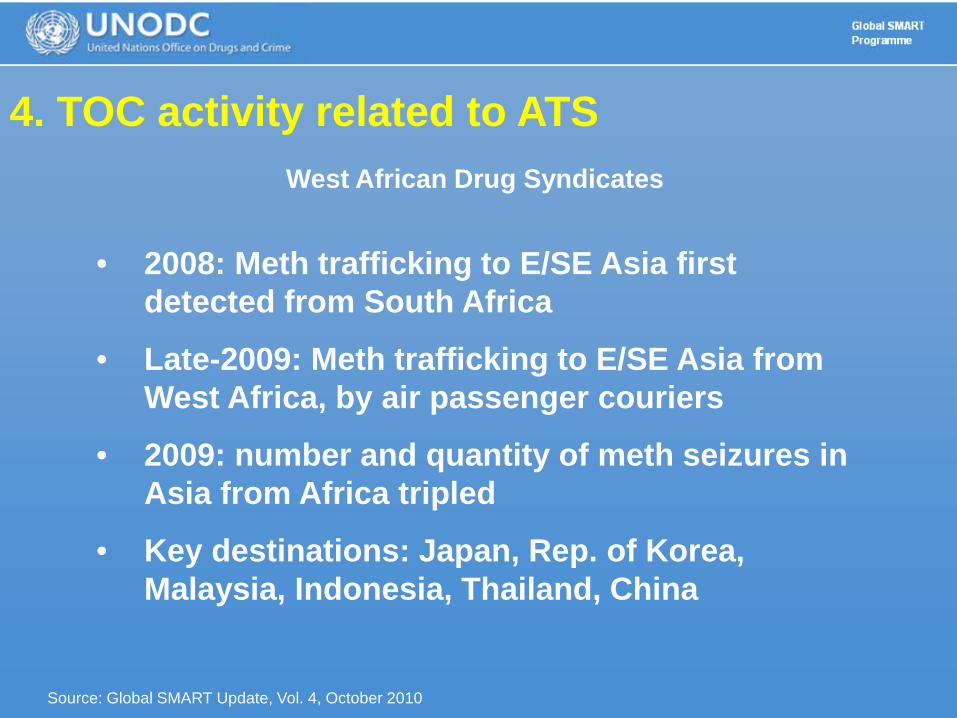
• 2008: Meth trafficking to E/SE Asia first detected from South Africa
• Late-2009: Meth trafficking to E/SE Asia from West Africa, by air passenger couriers
• 2009: number and quantity of meth seizures in Asia from Africa tripled
• Key destinations: Japan, Rep. of Korea, Malaysia, Indonesia, Thailand, China
4. TOC activity related to ATSWest African Drug Syndicates
Source: Global SMART Update, Vol. 4, October 2010

Notable locations of ATS manufacture & trafficking routes
Sources: UNODC World Drug Report 2011 & Global ATS Assessment 2011
4. WADS activity related to ATS

• Precursors in new physical forms
• Use of non-controlled licit chemicals
• Diversion of pharmaceutical preparations
• Stricter national controls on EPH and PSE
• New substances – i.e. P-2-P
5. Shift in precursor sourcing
Source: ONCB, IDEC 2011

5. Shift in precursor sourcing
Meth (pre-)precursors
• APAAN• P-2-P• Phenylacetic acid
Ecstasy precursors
• Piperonal – MDA • Safrole-rich oils – MDMA
Source: Global SMART Update 2012, Vol. 7
Conversion of APAAN to P-2-P
P-2-P bisulfite adduct
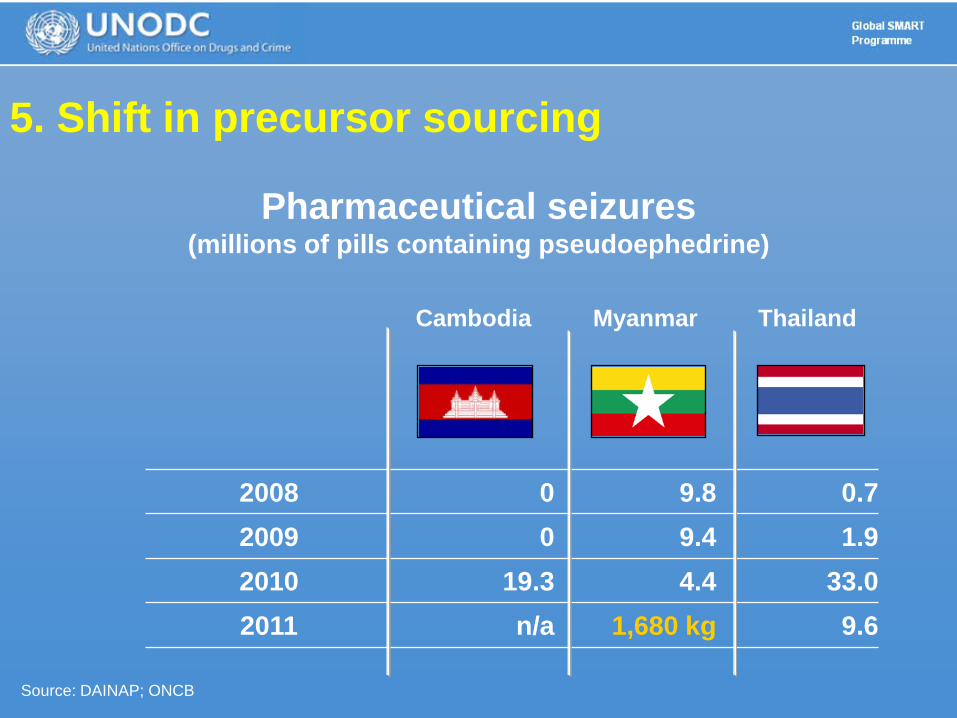
Cambodia Myanmar Thailand
2008 0 9.8 0.72009 0 9.4 1.92010 19.3 4.4 33.02011 n/a 1,680 kg 9.6
Pharmaceutical seizures(millions of pills containing pseudoephedrine)
5. Shift in precursor sourcing
Source: DAINAP; ONCB

Source: UNAIDS 2012
105,784
40,3001,15016,607
149,591170,000
400,000
193,300
75,000
1,900
0
50,000
100,000
150,000
200,000
250,000
300,000
350,000
400,000
450,000
500,000
ChinaJapan
Vietnam
Malaysia
Australia
Indonesia
Myanmar
Thailand
Philippines
Cambodia
Lao PDR
0%
10%
20%
30%
40%
50%Estimated number ofpeople who inject drugsPrevalence of HIV
2.35 million
6. Injecting drug use

7. ATS treatment demand rising
3
9
13
19
24
27
50
62
85
90
95
98
99
0 10 20 30 40 50 60 70 80 90 100
Myanmar
Hong Kong, China
Malaysia
China
Indonesia
Singapore
Japan
Philippines
Thailand
Cambodia
Lao PDR
Republic of Korea
Brunei Darussalam
Primary drug of use among those treated (%)
Methamphetamine treatment demand in E/SE Asia
Source: DAINAP; 2011 World Drug Report, UNODC
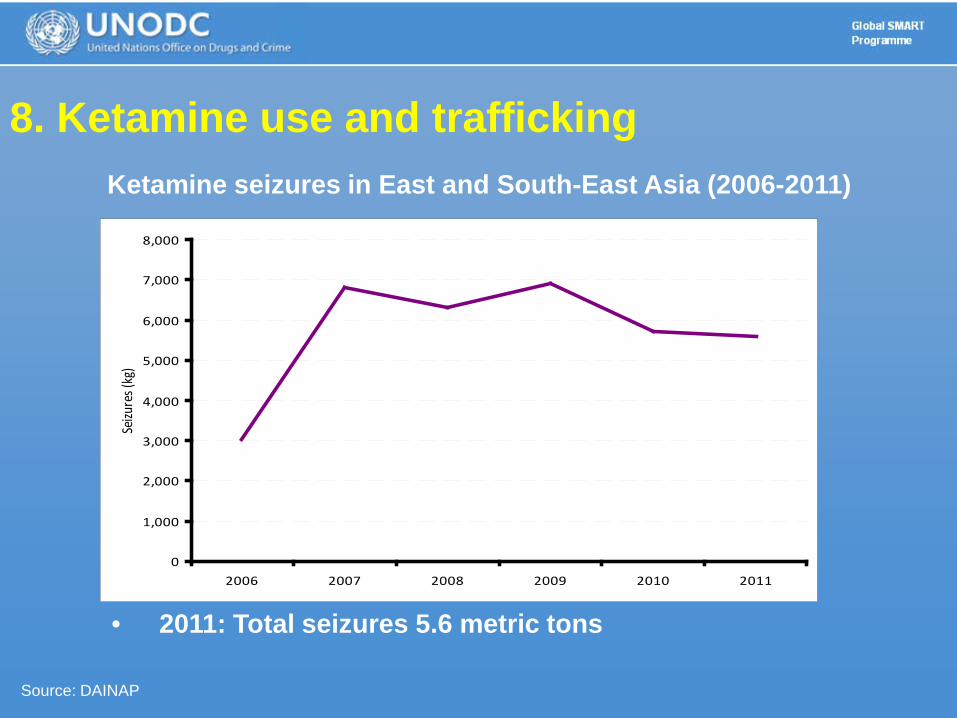
Ketamine seizures in East and South-East Asia (2006-2011)
• 2011: Total seizures 5.6 metric tons
0
1,000
2,000
3,000
4,000
5,000
6,000
7,000
8,000
2006 2007 2008 2009 2010 2011
Seizu
res (
kg)
8. Ketamine use and trafficking
Source: DAINAP

• Piperazines – BZP, TFMPP, m-CPP• Mephedrone• 2C-B – first identified in Viet Nam in 2007• Synthetic cannabinoids – JWH• Often marketed as ‘legal highs’
9. Emerging synthetic substances
THANK YOU
www.apaic.org
www.unodc.org/eastasiaandpacific