overview of economy 2020
TRANSCRIPT

OVERVIEW OF ECONOMY 2020
Tallinn 2021

2 Economic overview 2020
Ministry of Economic Affairs and Communications • Ministry of Finance 2021
Contents
The macroeconomic situation ................................................................................................................................. 3
Foreign trade ........................................................................................................................................................... 9
The manufacturing industry .................................................................................................................................. 16
Food and beverage production ............................................................................................................................. 21
Textile production .................................................................................................................................................. 26
Clothing production ............................................................................................................................................... 29
Wood processing ................................................................................................................................................... 32
Manufacture of paper pulp, paper and paper products ........................................................................................ 36
The chemical industry ............................................................................................................................................ 39
Manufacture of rubber and plastic products ........................................................................................................ 44
Manufacture of metal and metal products ........................................................................................................... 48
Manufacture of electronic and electrical equipment ............................................................................................ 51
Manufacture of machinery and equipment .......................................................................................................... 56
Manufacture of means of transport ...................................................................................................................... 59
Manufacture of furniture ...................................................................................................................................... 63
The construction sector ......................................................................................................................................... 66
Domestic trade ...................................................................................................................................................... 72
Tourism .................................................................................................................................................................. 76
Information and communications ......................................................................................................................... 85
Transport ............................................................................................................................................................... 91
Annexes ................................................................................................................................................................. 97
Abbreviations in text:
*- preliminary, short term statistics
y-o-y – year-over-year
no – number
l.s. – left scale
r.s – right scale

3 Economic overview 2020
Ministry of Economic Affairs and Communications • Ministry of Finance 2021
The macroeconomic situation
Estonia’s economic downturn in 2020 (-2.9%) was twice smaller than the EU average and, like many other countries, smaller than initially forecast. The Estonian economy was supported by the resilience of its closest trade partners – in Finland, Sweden and Lithuania, GDP decreased less than in Estonia. Also, as a 2020 average, domestic restrictions on economic activity and to the free movement of people in Estonia were the mildest in comparison with the rest of the EU. In the first months of the crisis, the wage compensation measure was a great help to companies. Due to cross-border movement restrictions, the Estonian economy lost 1.3 billion euros in tourism revenue in 2020 and the recovery will take time. Hospitality and commerce sectors each accounted for 0.6 percentage points of the decline in 2020. However, the largest contribution to Estonia’s economic downturn last year was made by the manufacturing industry with its large number of employees (0.9 percentage points), but at the end of the year, this sector was already showing signs of recovery in relation to improving global demand. The financial sector and computer services survived the first year of the crisis well, with exports doubling in the last four years.
Domestic demand increased slightly in 2020, but statistics were distorted by a start-up whose investment in computer software in the second half of the year led to a ninefold increase in software investments in the entire business sector. Without it, domestic demand would have fallen sharply. The decline in private consumption was mainly caused by restrictions on the movement and assembly of people and on the business activities of services
-20
-15
-10
-5
0
5
10
15
2006 2008 2010 2012 2014 2016 2018 2020
% y-o-y
Source: Statistics Estonia
Economic growth
European Union Estonia
-40
-20
0
20
40
60
2006 2008 2010 2012 2014 2016 2018 2020
% y-o-y
Source: Statistics Estonia
Domestic demand
Private demand Investments
Estonia’s economic downturn was twice smaller than the EU average and, like many other countries, smaller than initially forecast.
Hospitality and commerce sectors each accounted for 0.6 percentage points of the decline in 2020.
Statistics were distorted by a start-up whose investment in computer software in the second half of the year led to a ninefold increase in software investments in the entire business sector.

4 Economic overview 2020
Ministry of Economic Affairs and Communications • Ministry of Finance 2021
companies and commercial establishments. However, the decline in private consumption (-2.5%) remained somewhat smaller than in the economy as a whole. Services made the largest contribution to the decline in consumption, since various restrictions hindered their provision the most. Consumption of transport and hospitality and leisure services decreased sharply, which was made even worse for the local undertakings by the lack of foreign tourists. However, the consumption of non-durable goods, which forms the lion’s share of the people’s consumption basket, increased in the first year of the crisis and the growth rate slowed down only slightly compared to the earlier times. The growth of consumption of basic non-durable goods, such as food and alcohol and tobacco, clearly accelerated compared to 2019, due to consumption restrictions in cafes and restaurants. Consumption of semi-durable goods decreased significantly in 2020, mainly due to decreased purchasing of clothing and footwear. This was due to restrictions on the opening hours of stores during the emergency situation in spring, as well as a reduced need to renew wardrobe goods due to working from home more and the lack of public events. Consumption of durable goods remained at pre-crisis levels, with lower purchases of personal means of transport offset by higher expenditure on household maintenance and repair goods. Investments are particularly sensitive to changes in economic conditions, and in the spring of 2020 it responded rapidly to growing uncertainty across the EU, with a deep decline in almost all countries in the first half of the year. Investment activity was actually slowing down already in 2019 due to global trade tensions, which is why the unexpected crisis intensified this trend. In the second half of 2020, the decline slowed down, but overall, investment remained lower than in the previous year almost everywhere in the EU. In Estonia, however, investments were increased by the government, households and companies in 2020, and investments as a whole grew by 18% at constant prices. Government investment was supported by a political decision to continue with the previously planned expenditures, and the spring supplementary budget encouraged local government investments. Residents’ real estate investments in new housing slowed down for only a few months in the spring and accelerated significantly at the end of the year. Businesses generally responded to the crisis as expected and investment activity declined in almost all areas. The rapid statistical growth of corporate investment is due to the software purchases of one company, which increased capital investment in computer software tenfold and led to a 23% increase in corporate investment as a whole. Time will tell whether such transactions that significantly affect statistics will take place in the future, but their impact on the supply potential of the Estonian economy is marginal. However, it can be expected that sooner or later this investment will also yield a return, but mostly as return on capital owned by a foreign owner. Against the background of the almost double-digit decline in euro area exports, export developments in the Baltic and Nordic countries were less affected by the virus. In 2020, Estonian exports of goods and services decreased by 5.5% and export prices dropped by 2.1%. Considering the 7.4% decline in external demand, we were able to increase our market share in foreign markets also during the corona crisis. Due to the rapid recovery of merchandise exports that started in autumn 2020, exports of goods also exceeded the last year’s result by 2%. Of the goods of Estonian origin, the largest contribution to growth was made by a one third increase in exports of communication equipment, mainly reflecting the transport of 5G equipment to the US market. Exports of optical equipment, chemical products and oil products, which gained momentum from the recovery in oil prices, also reached double-digit growth. The field
Against the background of the almost double-digit decline in euro area exports, export developments in the Baltic and Nordic countries were less affected by the virus.
The decline in private consumption was mainly caused by restrictions on the movement and assembly of people and on the business activities of services companies and commercial establishments.

5 Economic overview 2020
Ministry of Economic Affairs and Communications • Ministry of Finance 2021
of mechanical machinery and equipment did not perform so well and wooden house manufacturers also had difficulties with exports. Exports of services fell by almost a fifth in 2020, the decline being higher than in the euro area as a whole. The decline was driven by tourism services which account for a larger share of the economy than the euro area average. ICT and business services which create higher added value, have been playing an increasing role in the export of services in recent years. Even during the crisis, these industries were able to continue their growth. The import statistics of 2020 were distorted by launching of an automotive sector software development unit in Estonia. This was reflected in imports of intellectual property in the ICT sector and led to a 0.7% increase in imports. Due to the aforementioned large-scale acquisition, the current account turned into a deficit of 1% of GDP. Without this transaction, the current account surplus would have increased, as is typical to a crisis period. As a result of increasing household savings and declining corporate fixed investment, the trade deficit was the smallest in a decade. In 2020, consumer prices reacted strongly to the corona crisis and the resulting sharp fall in oil prices. Over the year, consumer prices fell by 0.4%, being one of the largest in the euro area. The last time there was a similar fall in prices was during the previous crisis 12 years ago. The bottom of the decline in consumer prices was in May (-1.7%) when the decline in prices was increased by temporary measures imposed by local governments during the emergency situation and the reduction of excise duties on fuel, gas and electricity. This tax measure lowered the consumer price index by an additional 0.5 percentage points. As a result of the pandemic, service prices began to decrease in the second half of the year. Prices of services were put under pressure by tourism-related fields that were in a more difficult situation during the crisis. At the end of the year, accommodation, plane and boat tickets became cheaper by 10% to 15%. At that, the decrease in accommodation prices was the largest in the euro area. Oil was almost one third cheaper in 2020 and accounted for most of the 7% drop in energy prices. Due to the decrease in consumption because of the restrictions and favourable weather conditions in the first half of the year, lower electricity prices also contributed significantly to the decrease in energy prices. The corona crisis did not affect food price developments much. The slowdown in increase of prices could not be seen until the autumn months, and food prices rose by 2% year-on-year.
-4-202468
101214
2005 2007 2009 2011 2013 2015 2017 2019 2021
% y-o-y
Source: Statistics Estonia, Eurostat
Consumer price index
Consumer price index: Estonia
Consumer price index: Euro zone (MUICP)
In 2020, consumer prices reacted strongly to the corona crisis and the resulting sharp fall in oil prices.

6 Economic overview 2020
Ministry of Economic Affairs and Communications • Ministry of Finance 2021
According to the labour survey, the number of employed decreased by 2.2% on a year-on-year basis and unemployment rose to 6.8%. The labour market situation deteriorated sharply with the outbreak of the corona crisis in spring 2020, but the negative effects were somewhat alleviated by the wage compensation measure paid from March to June. In total, around 17,500 companies benefited from this state aid and 137,500 people received compensation totalling 256 million euros. According to Praxis, it helped to save at least 65,000 jobs and reduce the increase in poverty. Despite the wage compensation, the growth of unemployment in Estonia was one of the largest in the European Union, rising to 8% by June, i.e. by 3 percentage points compared to the pre-crisis level. At the same time, unemployment in the European Union increased by only 0.4 percentage points. The crisis mainly affected the fields that are directly related to tourism and entertainment in which economic activities were physically restricted, and have lower-than-average wages. At the same time, the situation was also used to increase efficiency in other areas of activity. By the end of the emergency situation, one in five workers in the hospitality sector had lost their job. In terms of numbers, this number was the same as in the secondary industry sector, although the share of industry in total employment was 18% against the 4% of the hospitality sector. The number of jobs in industry were already declining before the crisis, and the first half of 2020 was still relatively successful in construction by virtue of orders made earlier. With the reduction of employees and using the wage compensation measure, companies in industry, construction and trade were mostly able to maintain profitability. According to Statistics Estonia, the average gross monthly wage increased by 2.9% in 2020. Wage growth slowed significantly during the emergency situation, but moderate wage growth has continued in many sectors since the summer. Wage growth remained surprisingly strong in all the economy, despite the rapid rise in unemployment. This reflects the nature of the current crisis – the situation is extremely poor in a limited number of areas of activity. Average wages fell only in the sectors that were hit very hard by the crisis, such as hospitality service activities, commerce, culture and entertainment. In the field of information and communication, rapid wage growth continued throughout the year. The financial sector has escaped this crisis relatively painlessly because it has not been accompanied by a widespread wave of bankruptcies and an increase in bad loans. In 2020, public sector wage growth was strong, but when taking into account the state aid to the private sector, the aggregate income of people working in the private sector did not decrease. Public sector workers were less affected by the crisis and wage growth there remained relatively strong throughout the year, but this was largely due to the increased workload due to the crisis, especially in the areas of health, education and internal security.
0
5
10
15
20
25
-80
-60
-40
-20
0
20
40
60
2006 2008 2010 2012 2014 2016 2018 2020
%thousand
Source: Statistics Estonia
Employment and unemployment
Change of number of employed
Unemployment rate (r.s)
The labour market situation deteriorated sharply with the outbreak of the corona crisis in spring 2020, but the negative effects were somewhat alleviated by the wage compensation measure paid from March to June.
Wage growth slowed significantly during the emergency situation, but moderate wage growth has continued in many sectors since the summer.

7 Economic overview 2020
Ministry of Economic Affairs and Communications • Ministry of Finance 2021
1 According to the ESA2010 methodology, the following is deemed to be included among labour taxes: social security contributions, personal income tax on wage income, personal income tax on social transfers and pensions, personal income tax on business activities. 2 According to the ESA2010 methodology, the following is deemed to be included among taxes on consumption: value added tax, customs duty, excise duties, motor vehicle registration fee, sales tax, pollution charges, fee for the right of fishery, boat tax, AAU sales revenue, liquid fuel reserve charge and Guarantee Fund contributions. 3 According to the ESA2010 methodology, the following is deemed to be included among capital taxes: corporate income tax, personal income tax on capital income, gambling tax, advertisement tax, land tax, heavy goods vehicles tax, state fees on activity licences and professional licences, fee for the special use of water, road and street closure tax, other taxes and fees.
In 2020, the general government budget position fell into a deep deficit due to the outbreak of the COVID-19 pandemic, which according to the preliminary data of Statistics Estonia amounted to 1.3 billion euros or 4.8% of GDP. The central government and social security funds were in deficit (3.6% and 1.2% of GDP, respectively), which was partly balanced by a surplus from local governments (0.02% of GDP). The central government deficit was due to the state budget, which was affected on the one hand by the decline in tax revenues and on the other hand by the increase in expenditures related to the crisis relief measures of the supplementary budget. The budget deficit of social security funds was also due to a sharp increase in expenditure levels due to the crisis. The financial situation of local governments also suffered as a result of the crisis due to reduced income tax revenues, but with the help of state support measures and more prudent spending, the year ended with a budget surplus of 6 million euros. The structural budget balance of the government sector was in a deficit of 3.6% of the GDP in 2020. The budget deficit in 2021 will reach 6% of GDP, taking into account the decisions of the budget strategy, which, despite the additional costs of the supplementary budget, will be 0.7% better than the original state budget due to the II pension pillar changes and improved economic environment. In 2022, the deficit will decrease by about 560 million euros and reach 3.8% of GDP. As the economic environment recovers, the deficit will decrease to 585 million euros or 1.7% of GDP by the end of the forecast period at 2025. The tax burden in 2020 amounted to 34.2% of GDP, which was 1.1% higher than the year before (2019). The pandemic affected taxes significantly less (-0.2%) than it did the GDP (-3.4%). Compared to 2019, the volume of labour taxes1 increased by 7.2%. This was partly due to the suspension of 4% payments from the state to the second pension pillar from 1 July 2020, which technically increased the tax burden by 143 million euros. At the same time, the state budget’s personal income tax receipts also increased by 23.3% due to various factors – the income tax receipts from pensions increased, as well as the ones from unemployment insurance and other benefits and dividends (at the rate of 7%). The receipt of labour taxes was also supported by the Unemployment Insurance Fund’s wage compensation. In 2020, consumption taxes2 decreased by 7.8% and capital taxes3 by 7.6%. According to the state budget strategy 2022–2025, the tax burden in 2021 will be 35.0% of GDP due to changes in the second pillar of the pension system. In 2022, these effects will decrease significantly and the tax burden will fall to 33.3% of GDP. In the period 2023–2025, labour taxes will increase due to an increase in the average wage, but this will be balanced by an increase in tax-free income from pensions from 2023 onwards. Capital taxes are growing somewhat faster than GDP due to rising dividends from state-owned enterprises. The tax burden will decrease during this period due to consumption taxes, as the growth of both VAT and excise duties will slow down significantly at the end of the forecast period. The tax burden will fall to 32.6% of GDP by 2025.
In 2020, the general government budget position fell into a deep deficit due to the outbreak of the COVID-19 pandemic, which according to the preliminary data of Statistics Estonia amounted to 4.8% of GDP.
As a result of the pandemic, the general government debt increased at a record rate in 2020, increasing by 9.8 percentage points or to 18.2% of GDP over the year

8 Economic overview 2020
Ministry of Economic Affairs and Communications • Ministry of Finance 2021
*The economic forecast for the spring of the Ministry of Finance is based on the assessment of the situation as of 31 March 2021.
As a result of the pandemic, the general government debt increased at a record rate in 2020, increasing by 9.8 percentage points or to 18.2% of GDP over the year. In 2021, the government sector’s debt burden is projected to increase to 21.4% of GDP. The debt is increasing both at central and local government’s level. The debt burden is projected to continue to increase due to negative cash flow and will make up 24.6% of GDP at the end of the year 2022.
% 2019 2020 2021* 2022*
Growth of real GDP 5,0 -2,9 2,5 4,8
Growth of nominal GDP 8,4 -3,4 4,9 7,0
GDP in current prices (bln €) 28,1 27,2 28,5 30,5
Change of consumer price index 2,3 -0,4 2,0 2,1
Employment (15–74-year-old, thousands) 671,3 656,6 650,6 655,9
Growth of employment 1,0 -2,2 -0,9 0,8
Unemployment rate 4,4 6,8 8,0 7,3
Average monthly wage (€) 1 407 1 448 1 504 1 588
Real growth of average monthly wage 5,1 3,4 1,8 3,4
Nominal growth of average monthly wage 7,5 2,9 3,9 5,6
Current account (% of GDP) 2,0 -1,0 3,4 3,3
Change in private consumption expenditure 3,1 -2,5 1,3 4,0
Change in gross fixed capital formation 11,0 18,4 -15,4 8,8
Change of domestic demand 4,5 2,4 -2,2 4,6
Change of exports of goods and services 6,2 -5,5 6,0 6,3
Change of imports of goods and services 3,7 0,7 -0,6 6,2

9 Economic overview 2020
Ministry of Economic Affairs and Communications • Ministry of Finance 2021
Foreign trade
The year 2020 brought major changes in trade. Due to the global spread of COVID-19, overall economic activity in international commodity markets and external demand were extremely low. In addition, many companies were forced to reduce production volumes due to virus-related restrictions, and cross-border trade was also hindered. Therefore, in the first half of the year, Estonia’s trade decreased but already in the fourth quarter the economy gained momentum and Estonian companies were able to remain relatively competitive internationally and Estonia’s foreign trade turnover increased. In 2020, total Estonian exports of goods decreased by one percent and imports by six percent compared to the previous year. The foreign trade balance was still negative, but the deficit decreased twofold compared to the previous year. The decrease in the deficit was impacted the most by a decrease in imports of means of transport and an increase in exports of electrical equipment. The decrease in trade turnover was also influenced by export and import prices, dropping respectively by 5.1% and 5.0% over the year.
Estonia’s economic growth is largely influenced by foreign trade, the development of which is strongly related to the economic situation of its trading partners. A slight decline in foreign trade began already in 2019, but the COVID-19 virus that has devastated the world from the beginning of 2020 and the measures put in place to combat it led to an even greater decline in trade. The total trade turnover in Estonia decreased by 3.4% in 2020, remaining slightly below 30 billion euros. The volume of exports was 14.3 billion euros and the volume of imports was 15.2 billion euros. In 2020, the trade deficit was 0.8 billion euros. Estonia’s main trading partners performed better than the European Union countries on average, and as a result, the decline in Estonia’s foreign trade was more modest than in many other European Union countries. In addition, merchandise exports were supported by the manufacturing industry, which was able to withstand the crisis relatively well.
-10
0
10
20
30
40% y-o-y
Source: Statistics Estonia
Export and import growth
Nominal export growth Nominal import growth
-20-15-10
-505
101520
billion €
Source: Statistics Estonia
Trade dynamics
Exports Imports Balance
In the first half of the year, Estonia’s trade decreased but already in the fourth quarter the economy gained momentum.
The total trade turnover in Estonia decreased by 3.4% in 2020, remaining slightly below 30 billion euros.

10 Economic overview 2020
Ministry of Economic Affairs and Communications • Ministry of Finance 2021
In 2020, Estonia exported goods to 184 countries and imported from 143 countries. The foreign trade balance was positive with 140 countries. However, Estonia’s foreign trade is relatively concentrated, as trade with 10–12 main partner countries accounts for more than 70% of foreign trade. The largest trade surplus was in trade with the USA, Norway, and Sweden. The biggest trade deficit outcome was with Germany, Poland, and Lithuania. The shares of exports and imports in trade were 49% and 51%, respectively. Compared to the previous year, the share of exports increased by 2%. The share of goods of Estonian origin in total export of goods was 71%. Compared to the previous year, both exports of domestic goods and their re-exports decreased by one per cent. Big negative balances appeared in the trade of chemical products (-0.7 billion euros), means of transport (-0.56 billion euros), mechanical machinery (-0.34 billion euros), and rubber and plastic products (-0.39 billion euros). Greater surplus was in the trade of wood and timber products (0.9 billion euros), various industrial products such as furniture, pillows, blankets and wooden houses (0.7 billion euros), and electrical equipment (0.5 billion euros). Changes in trade are closely linked to the dynamics of price indices. Similar to trade, both the export and import price indices decreased by 5.1% and 5%, respectively. Price indices showed a positive development only in January, but were in decline in the remaining months. The export price index was mostly affected by changes in the prices of oil products and electricity. The fall in the price level was caused by both the low price of oil and the changes in the world economy caused by the corona crisis. Estonia is still in the grip of the coronavirus, but the ongoing vaccination gives cause for cautious optimism. In the event of a gradual reduction of restrictions, the Estonian economy is expected to start to recover from the crisis in 2021. The rapid rebound of the economy in the third quarter of 2020 showed that the Estonian economy will be able to recover quickly once the restrictions are lifted. The recovery of trade in Estonia is supported by the recovery of global demand. The number of export orders from local undertakings also remains strong, since the coronavirus has not had a significant impact on the euro area manufacturing sector in recent months. The expectations of the panel of experts of the Estonian Institute of Economic Research concerning the development of the general economic situation in the second half of 2021 were also positive. 71% of the experts predicted that the situation would improve, 22% that the situation would remain the same and only 7% that it would deteriorate.
Export In 2020, the export of Estonian goods reduced by 1% compared to the previous year. At the same time, the changes in the volume of exports in the first and second half of the year were very different. The COVID-19 pandemic sharply reduced external demand in the first half of the year, reducing exports of goods by 12%. However, after the virus withdrew in the summer, a rapid recovery in exports began, and the decline in trade in the first half of the year was somewhat balanced by growth in the last months of the year – in the fourth quarter, the export of goods increased by 13% compare to the previous year and in December, the export grew as much as 25%. Although the recovery of exports was not broad-based, the areas significant in the sense of added value did better. Electronic equipment and mineral oils and fuels, as well as the production of timber and timber products and metal products contributed the most to the growth in exports.
The foreign trade balance was positive with 140 countries.
The rapid rebound of the economy in the third quarter of 2020 showed that the Estonian economy will be able to recover quickly once the restrictions are lifted.
Although the recovery of exports was not broad-based, the areas significant in the sense of added value did better.

11 Economic overview 2020
Ministry of Economic Affairs and Communications • Ministry of Finance 2021
In 2020, as before, electrical equipment, mineral products, timber and timber products and agricultural products and foodstuffs were exported the most from Estonia. Exports were most affected by a 12% increase in exports of electrical equipment. About half of electrical equipment exports went to the United States in the form of communications equipment. In addition to electrical equipment, exports of optical, measuring and precision instruments, chemical products and plastic and plastic products also increased in 2020. Although the growth of exports of optical, measuring and precision instruments was the largest, i.e. 13%, their share in total exports was only 4%. The largest impact in this product group was made by the increase in exports of thermometers and X-ray-based equipment. The export growth of chemical products was more modest, remaining at only 3%. Fertilisers, one of the largest product groups, had a decline of more than 40%. However, the growth of chemical products was driven by cosmetics and disinfectants. The growth of plastic products was mostly influenced by the increase in exports of plastic pipes and hoses and plastic products for packaging.
The largest decline in export turnover in 2020 was in the group of goods for transport equipment. The 12% decrease in means of transport significantly affected the decrease in total export turnover since it accounts for 7% of Estonia’s total exports. The main reason for the decline was the decrease in exports of passenger cars, which is mostly transit trade. Mineral products which account for a larger share of means of transport (11%), fell by 8% in 2020. From the commodity group of mineral products, exports of goods based on local raw materials, such as peat, increased, but the decline in the volume of exports was influenced by a larger share of re-exported products, i.e. fuels. The change in export turnover was also significantly influenced by the decline in mechanical machinery, various industrial products and metals and metal products, which accounted for 9%, 8%, and 8%, respectively. Exports of mechanical machinery decreased by 8% in a year, mainly due to lower exports of construction machinery, such as shovel excavators, excavators and shovel loaders, and vending machines. Exports of various industrial products decreased by 5% and the decrease in this group of goods was mainly due to prefabricated wooden buildings. The export of wooden houses was very successful in 2019, elevating the comparison base. In addition, the manufacturers of wooden houses were affected by the pandemic, leading to the postponement of projects in Sweden and Norway. Norway and Sweden are the main target markets for housing developments, public buildings and apartment buildings. The volume of work there is usually quite large, and the postponement, suspension or cancellation of individual large transactions has a significant impact on the sector’s export turnover. The decrease in metals and metal products remained at 5% and was not caused by a decrease in exports of any specific product group, but of all product groups. One of the most important commodity groups for Estonia, timber and timber products, significantly positively affecting the foreign trade balance of Estonia, decreased by 2% in 2020. This was mainly
0 5 10 15 20 25 30
Means of transportation
Metals and metal products
Furniture, log houses
Wood and wood products
Mineral products
Machinery and equipment
Source: Statistics Estonia
%
Exports by commodity groups
2020 2019
About half of electrical equipment exports went to the United States in the form of communications equipment.
The largest decline in export turnover in 2020 was in the group of goods for transport equipment.

12 Economic overview 2020
Ministry of Economic Affairs and Communications • Ministry of Finance 2021
due to a decrease in exports of unprocessed timber which creates less added value. However, several commodity groups that create higher added value domestically were growing.
Out of goods of Estonian origin, the export of animal products grew the most, increasing by 25% over the year. The total export of goods of Estonian origin decreased by 1% in 2020, but their share in total export remained on the level of 2019, i.e. at 71%. Of goods of Estonian origin, optical, measuring and precision instruments showed a 15%, electrical equipment a 14%, plant products and chemical products both an 11% growth. Exports of Estonian shale oil, processed fuel oil, vending machines, equipment parts and prefabricated wooden buildings decreased significantly. The main destination countries for goods of Estonian origin were Finland, Sweden, and the USA.
In total, Estonia’s merchandise exports remained at a very good level in 2020, considering the difficulties that the COVID-19 pandemic caused to the undertakings. In addition, exports of higher value-added goods have shown growth in recent years, with contributions from the timber, metal and agricultural sectors.
In 2020, the share of the European Union in the total Estonian exports fell to 66% which is 4 percentage points less than a year earlier. The decline in exports was also affected by the departure of Great Britain from the EU. The export volume of Estonian businesses to the European Union internal market was 9.5 billion euros. Of the major single market partners, exports increased only to the Netherlands (20%), while volumes to other EU countries dropped. In trade with non-EU countries, Estonian exports increased by 7%, mainly due to increased exports of communication equipment to the United States.
Exports to the CIS countries have been in decline since 2018. In 2020, the export turnover was 4.5% lower than a year earlier. Exports to Russia had the greatest impact, making up almost 85% of all exports to the CIS countries. Export volume to Russia fell by 7%. Moreover, exports to Armenia, Georgia, and Moldova were in decline, but they have a marginal share in the total exports of the CIS countries. The larger decline in export sales was slightly offset by an increase in exports to Belarus. Belarusian exports accounted for 8% of the total CIS exports and increased by 20.5% in 2020.
In the markets of the NAFTA countries, however, exports increased by almost 10% in 2020 due to the growth of the US export turnover. Exports to the United States account for more than 90% of all NAFTA exports, so its 16% growth outweighed the 26% decrease to Canada and the 35% decrease to Mexico. Exports of electrical equipment (mainly 5G equipment) continue to lead the US and NAFTA exports.
0 3 6 9 12 15 18
Lithuania
Germany
USA
Latvia
Sweden
Finland
Source: Statistics Estonia
%
Exports target countries
2020 2019
The total export of goods of Estonian origin decreased by 1% in 2020, but their share in total export remained on the level of 2019
Exports of higher value-added goods have shown growth in recent years, with contributions from the timber, metal and agricultural sectors.

13 Economic overview 2020
Ministry of Economic Affairs and Communications • Ministry of Finance 2021
The trade volume of Finland, Estonia’s largest export partner, fell by 4% year-on-year, which also reduced Finland’s share by one percentage point compared to a year earlier. Yet, this export turnover was almost 750 million higher than with the second largest export partner, Sweden. The largest share of the Finnish export was made up by electrical machinery and equipment, the exports of which increased by 2%. Important export commodity groups included also miscellaneous industrial products and timber and timber products which decreased by 6% and 14%, respectively. Exports to Sweden fell by 1%, which was the smallest decline in recent years. The decline in Swedish exports has so far been due to a decline in exports of communications equipment due to changes in their supply chain. In 2020, however, it was the export of electrical equipment that increased by 18%. The decline in exports was mostly influenced by a 12% decline in timber and timber products and a 9% decline in various industrial products, including, in particular, prefabricated wooden houses. In 2020, Latvia remained in the third place with a similar level as in 2019, i.e. 9%. However, exports dropped by 2% in a year. Among the target markets of Estonian exports, the share of the USA has grown strongly, being the fourth largest export partner for several years already. This is mainly due to the increase in exports of a single commodity group – communication equipment, but given the increasing use of 5G, there is a cause for optimism about further export volumes as well. In 2020, a year of decline for many markets, exports to the United States increased by 16%, increasing its share of total exports to 8%. Germany remained in the fifth place in the ranking of destination countries, with its share and export turnover remaining at the same level as in 2019. At the beginning of 2021, trade in international commodity markets picked up and the export growth expectations of the Estonian manufacturing industry, as the largest industry exporting goods, were also promising. World trade volumes started to grow already at the end of 2020, mainly with the support of Asia, but the purchasing managers index of the euro area turned to growth again at the end of the first quarter of 2021 after a six-month break. This was driven by a record high level of export orders, supporting the revival of trade in Estonia as well. The assessments of the experts of the Estonian Institute of Economic Research concerning the development of foreign trade in March 2021 were quite optimistic. Experts’ expectations were divided as follows: 64% were expecting an increase in the export volume, 22% projected the export volumes to remain at the same level, and 14% of the exports expected export volumes to decrease.
Import
In 2020, imports fell more than exports, reducing the trade deficit twofold compared to 2019. Imports fell by 6% year-on-year to 15.1 billion euros. Like exports, imports also declined at the beginning of the year and only increased in the last two months of the year. The imports increased by 7% in November and by 10% already in December.
0 5 10 15 20 25 30
Prepared foodstuffs and…
Metal and metal products
Chemical products
Means of transport
Mineral products
Machinery and equipment
Source: Statistics Estonia%
Imports by commodity groups
2020 2019
Exports of electrical equipment (mainly 5G equipment) continue to lead the US and NAFTA exports.
Export growth expectations of the Estonian manufacturing industry, as the largest industry exporting goods, were also promising.

14 Economic overview 2020
Ministry of Economic Affairs and Communications • Ministry of Finance 2021
The decrease in imports was mostly influenced by the decrease in imports of transport equipment, mineral products and machinery and equipment (incl. electrical equipment). Imports of transport equipment fell by 19% year-on-year, mainly due to reactions to the coronavirus pandemic which led to a decline in the sales of passenger cars. In total, almost 30% less new cars were sold in Estonia than a year earlier. Imports of mineral products fell by 16% in a year, the main reason being the fall in oil prices on the world market. The import turnover of the machinery and equipment commodity group decreased by 6% and the import of mechanical machinery (-6%) and electrical equipment (-7%) were also in decline. Electrical equipment was the largest outsourced group of goods with a share of 12%, as it includes many inputs od goods. Imports of electronic integrated circuits decreased the most during the year, by almost 40%. In addition, among the main goods, imports of printed circuits, radar equipment, electric capacitors and transformers decreased as well. The main goods that affected the decline of mechanical machinery were self-propelled bulldozers (-54%), elevators, conveyors and similar handling equipment (-32%) and air conditioners (-22%). Import turnover grew in only three commodity groups – timber and timber products by 8%, optical, measuring and precision instruments by 6% and chemical products by 3%. Of these, chemical products accounted for the largest share of total imports, accounting for 10%. The shares of timber and timber products and optical, measuring and precision instruments were 4% and 2%, respectively. The growth of chemical products was influenced by the growth of imports of goods and pharmaceutical products with the largest share. Compared to the previous year, in 2020, Estonia imported more unprocessed wood and sawn timber and the growth of optical, measuring and precision instruments was mostly impacted by the increase in the import of medical equipment.
Estonia’s main import partners are EU countries. The EU’s share of total imports was almost 76% in 2020, four percentage points less than in 2019. The turnover of imports from EU countries decreased by 7% within the year. Imports from non-EU countries fell by 3%.
The volume of imports from the CIS countries decreased by 8% in 2020. Imports from Russia, which accounted for 83% of total imports from the CIS countries, also fell by 8% over the year, having the largest impact on the indicator. This was mainly due to a decrease in imports of mineral fuels and fertilizers. Another important supplying country among the CIS countries is Belarus, the import volume of which decreased by almost 10% in a year. The
0 4 8 12 16
Sweden
Russia
Lithuania
Latvia
Germany
Finland
Source: Statistics Estonia
%
Imports by country of consigner
2020 2019
Imports of transport equipment fell by 19% year-on-year, mainly due to reactions to the coronavirus pandemic which led to a decline in the sales of passenger cars.
Electrical equipment was the largest outsourced group of goods with a share of 12%, as it includes many inputs od goods.

15 Economic overview 2020
Ministry of Economic Affairs and Communications • Ministry of Finance 2021
volume of imports from Belarus was also mostly affected by mineral products. However, import from NAFTA countries increased by 5%. This was supported by imports from the USA which increased by 8% and accounted for almost 90% of all NAFTA imports. The most important commodity group in imports from the USA was arms and ammunition, the import of which increased almost five times during the year. The volume of imports from Canada decreased by 5% and imports from Mexico by 40% in 2020. In 2020, Finland remained Estonia’s biggest import partner, although its share fell by one percentage point to 13.5%. Imports of goods from Finland remained on the same approximate level as in 2019. The second largest import market was Germany whose imports increased by 3%. The main group of goods was means of transport with a share of 17%, but their purchase decreased by 15% during the year because the sale of new passenger cars was declining in Estonia. Another important group of goods was mechanical machinery and equipment, their imports decreased by 8%. Electrical machinery and equipment was also more important with its imports increasing by 9%. Latvia rose to the third place among the supplying countries with 9.5%. Although the import turnover from Latvia was 1% lower than a year earlier, the volume of purchases from Lithuania which was fourth among the supplying countries decreased by as much as 15%, which raised Latvia to the third place among Estonia’s import partners. The main reason for the decline in Lithuanian imports was the 54% decline in the import of mineral products. Russia ranked fifth in the ranking of importing countries with an 8% share. Estonian production depends very much on imported production inputs, which is why exports and imports generally move in the same direction. General trade activity is expected to recover or even increase in 2021, increasing both Estonian exports and imports. Imports are increasing due to the increase in imports of inputs needed for production, acceleration of investment activities and also the growth of domestic demand. The assessment of the experts who participated in the March 2021 forecast of the Estonian Institute of Economic Research had not significantly improved compared to December 2020, but was still positive. Experts’ expectations were divided as follows: 72% were expecting an increase in the volume of imports, 14% left their expectations at the same level and 14% of the experts predicted a drop in the volume of import.
General trade activity is expected to recover or even increase in 2021, increasing both Estonian exports and imports.
Latvia rose to the third place among the supplying countries with 9.5%.
16 Economic overview 2020
Ministry of Economic Affairs and Communications • Ministry of Finance 2021
The manufacturing industry There are about 7,500 companies operating in the manufacturing industry in Estonia, most of them small and medium-sized. There are more than 200 companies with at least 100 employees, but they employ almost half of the employees in the industrial sector. Larger enterprises include manufacturers of cellular equipment, Ericsson Eesti AS, manufacturer of electrical equipment ABB AS, shipbuilding and metal processing group BLRT Grupp AS, woodworking company Stora Enso Eesti AS, manufacturer of industrial electronics Enics Eesti AS, manufacturer of automobile safety systems (seat belts) AS Norma, and producer of meat products AS HKScan Estonia.
In Estonia, the share of the industrial sector in the economy on the basis of value added is slightly smaller than the EU average (approximately 15%). However, the share of people employed in manufacturing in Estonia is one of the highest among the EU countries (almost one fifth), which shows that in the other EU countries it is possible to create more value added with the same number of employees.
The manufacturing industry as a whole is the largest employer in Estonia – almost every fifth employed person works in this field. The share of people employed in industry in the total economic circle has gradually decreased, while the number of people employed has not changed significantly in recent years (with the exception of 2020 which was heavily impacted by the coronavirus). A higher number of jobs have been created within ten years in the timber sector, the repair and installation of machinery and equipment, metal industry and the manufacturing of electrical equipment; timber sector is the one that has grown the most in terms of production volume. The largest industries in terms of number of employees are the wood industry, food production and the metal industry.
The sector is heavily dependent on foreign markets, where more than 60% of production is sold. The main export markets are Finland and Sweden, which also account for the largest share (more than half) of foreign direct investment in Estonian manufacturing.
The number of employees in the manufacturing industry is not expected to change remarkably in the coming years (excluding fluctuations due to the economic situation), but employment in the more labour-intensive sectors is expected to continue declining. Jobs are expected to be created in higher value-added sectors (electronics), but the wood industry based on local raw materials also sees growth potential. However, competitiveness remains based on increasing productivity, which requires continued investment in machinery and equipment, digital technologies and people, as well as product development and improved work organisation.
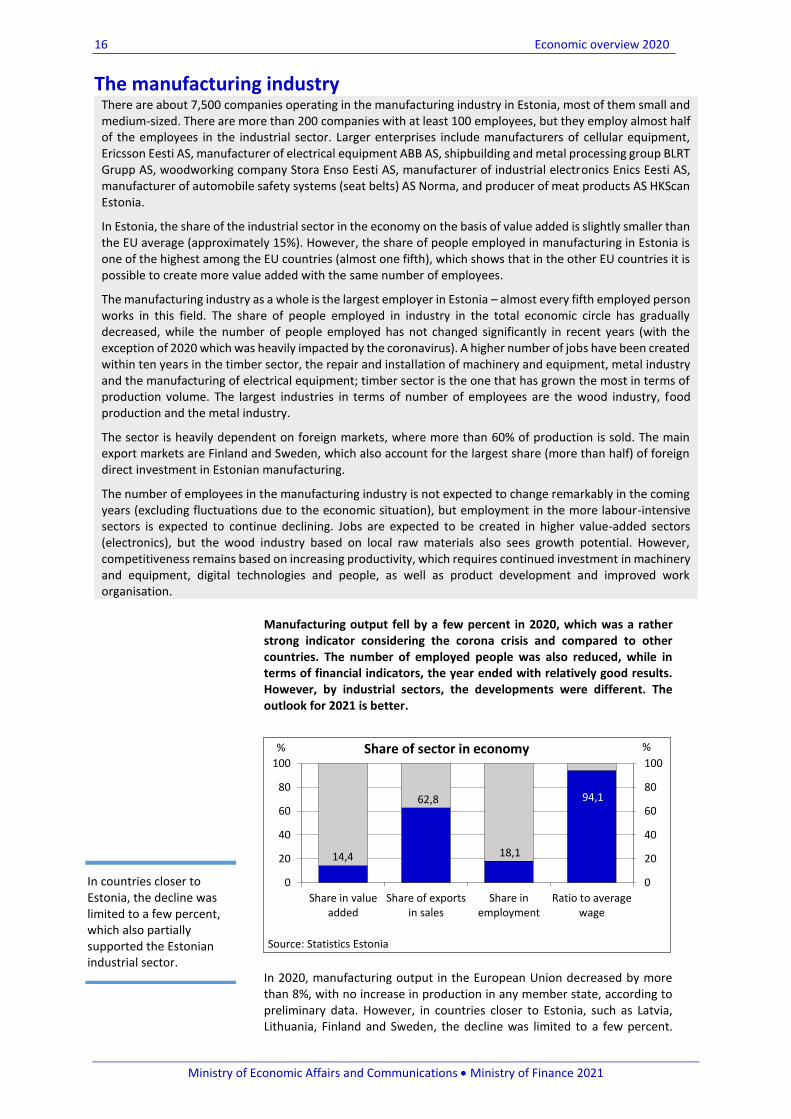
Manufacturing output fell by a few percent in 2020, which was a rather strong indicator considering the corona crisis and compared to other countries. The number of employed people was also reduced, while in terms of financial indicators, the year ended with relatively good results. However, by industrial sectors, the developments were different. The outlook for 2021 is better.
In 2020, manufacturing output in the European Union decreased by more than 8%, with no increase in production in any member state, according to preliminary data. However, in countries closer to Estonia, such as Latvia, Lithuania, Finland and Sweden, the decline was limited to a few percent.
14,4
62,8
18,1
94,1
0
20
40
60
80
100
0
20
40
60
80
100
Share in valueadded
Share of exportsin sales
Share inemployment
Ratio to averagewage
%%
Source: Statistics Estonia
Share of sector in economy
In countries closer to Estonia, the decline was limited to a few percent, which also partially supported the Estonian industrial sector.

17 Economic overview 2020
Ministry of Economic Affairs and Communications • Ministry of Finance 2021
Since they are our most important trade partners and customers for industrial products, it also partially supported the Estonian industrial sector.
The spread of the coronavirus and the associated restrictions also hampered the work of the manufacturing industry. In April and May, the volume of industrial production fell by 15–20% compared to the same period in the previous year. In May, however, the production volume almost returned to the level of the previous year and in the fourth quarter it already increased slightly. This was partly due to a lower benchmark because production declined in the second half of 2019.
In the year as a whole, production in manufacturing decreased by more than 4%. The situation was quite different across branches. The volume of industrial production decreased by more than a tenth in the leather industry, the building materials industry, the machinery industry, the manufacture of motor vehicles and trailers, and printing. At the same time, together with the spread of the virus, the demand for many pharmaceutical and chemical products increased dramatically, leading to a 10-15% increase in production in these industries. Apart from these fields, only the timber industry was able to increase production in 2020.
Producer prices in the manufacturing industry decreased by 1.6% over the year – the decline was the same in the European Union as a whole. The fall in oil prices on the world market dropped producer prices in the oil industry by almost a fifth. A larger decline in producer prices also characterised paper and chemical industries. Similar developments were reflected in export and import prices. The increase in demand and also the increase in the price of inputs raised producer prices in the pharmaceutical industry.
Sales of industrial products decreased by almost 4% over the year, exports by somewhat less. While in the second quarter exports suffered a slightly larger setback than sales to the domestic market, the exports managed to increase already in the second half of the year. By industry, the developments of sales and exports were quite similar to the changes in production.
-6
-4
-2
0
2
4
6
8
0
2 000
4 000
6 000
8 000
10 000
12 000
14 000
2015 2016 2017 2018 2019 2020*
% y-o-ymillion €
Source: Statistics Estonia
Sales and exports
Sales Exports Change in sales Change in exports
The exports managed to increase already in the second half of the year.

18 Economic overview 2020
Ministry of Economic Affairs and Communications • Ministry of Finance 2021
When the corona crisis broke out, efforts were made to save costs and also the wage growth slowed down. In the second quarter, the average wage in manufacturing was slightly lower than a year ago; in the second half of the year and in the year as a whole, the wage growth remained to a few percent. According to a labour force survey, the number of people employed in manufacturing (including employees abroad) also decreased by about 2%. However, according to short-term business statistics, the number of the employed fell by more than 4%, and the number of working hours even more. According to preliminary data, the largest reductions in the number of persons employed and hours worked were in the manufacture of clothing and leather, in the manufacture of furniture, in the manufacture of construction materials and in the manufacture of computers and electronic equipment. All in all, costs were reduced more than the sales revenue decreased and according to preliminary data, the total profit of industrial enterprises increased in 2020. Productivity indicators improved as well. However, the situation varied from industry to industry.
0 5 10 15 20 25
Rubber and plastic industry
Transport industry
Building materials industry
Furniture industry
Textile and clothing industry
Chemical industry
Metal industry
Other sub-sectors
Food industry
Equipment industry
Wood industry
Source: Statistics Estonia
%
Share of sub-sectors in sales of manufacturing industry
-5-4-3-2-101234
0
20
40
60
80
100
120
140
2016 2017 2018 2019 2020*
% y-o-ythousand
Source: Statistics Estonia
Number of employed people
Number of employed people (labour survey data)Number of employed people (business statistics)Change in number of employed people (r.s.)Change in number of employed people in companies (r.s.)
According to preliminary data, the largest reductions in the number of persons employed and hours worked were in the manufacture of clothing and leather, in the manufacture of furniture, in the manufacture of construction materials and in the manufacture of computers and electronic equipment.
Costs were reduced more than the sales revenue decreased and according to preliminary data, the total profit of industrial enterprises increased

19 Economic overview 2020
Ministry of Economic Affairs and Communications • Ministry of Finance 2021
Investments in tangible fixed assets of manufacturing enterprises decreased by one fifth in 2020 (preliminary data). This cannot be directly related to the corona crisis – investments were lower already from the beginning of the year and increased every quarter. In contrast to general developments, the timber industry continued to invest actively. Traditionally, more than 60% of capital investments were aimed at machinery and equipment. According to short-term statistics, only investments in computers and computer systems increased, other types of assets were in decline.
In 2020, the assessments of entrepreneurs polled by the Estonian Institute of Economic Research fluctuated quite heavily when it came to business environment. The crunch of 2019 carried over to 2020, and the spread of the coronavirus, as well as the associated uncertainty, further undermined the estimations. In the second quarter, six out of ten industrial companies said
0
2
4
6
8
0
500
1 000
1 500
2015 2016 2017 2018 2019 2020
% y-o-y
Source: Statistics Estonia
Average gross wages
Average wages (in euros) Change (r.s.)
-6
-4
-2
0
2
4
6
8
0
500
1 000
1 500
2 000
2 500
3 000
3 500
4 000
2015 2016 2017 2018 2019 2020*
% y-o-ymillion €
Source: Statistics Estonia
Value added, labour costs and productivity
Value addedLabour costChange in total productivity (r.s.)Change in labour costs productivity (r.s.)
-20
-15
-10
-5
0
5
10
15
0
100
200
300
400
500
600
700
800
2015 2016 2017 2018 2019 2020*
% y-o-ymillion €
Source: Statistics Estonia
Investments of companies
Investments in fixed assets
Change in investments (r.s.)
In contrast to general developments, the timber industry continued to invest actively.

20 Economic overview 2020
Ministry of Economic Affairs and Communications • Ministry of Finance 2021
that there were fewer orders than usual, prices were forecast to fall and the number of employees were expected to decrease. At the end of the year, however, the situation changed and at the beginning of 2021, the estimates had returned to normal. The confidence indicator reached the level last seen 3 to 4 years ago. In the first months of 2021, expectations for the growth of production volume were quite high and an increase in sales prices and in the number of employees were expected. In April, the problem of labour shortage became topical again, with one in five respondents highlighting it. At the same time, the lack of materials and equipment was starting to become an obstacle.
However, the estimates of entrepreneurs were not similar across industries, and the industrial output of the first quarter of 2021 still remained lower than in the previous year in more than half of the industries. However, based on the decline caused by the coronavirus, rather strong growth numbers can be expected in 2021.
In the first months of 2021, expectations for the growth of production volume were quite high and an increase in sales prices and in the number of employees were expected.

21 Economic overview 2020
Ministry of Economic Affairs and Communications • Ministry of Finance 2021
Food and beverage production The food industry is one of the largest ones in Estonia in terms of production volume and it is the main activity of more than 700 companies. Although most of the sales revenue comes from the domestic market, the volume of exports has also been growing steadily. In total, nearly 15,000 people find employment in the production of foodstuffs and beverages. Food and beverage companies may be found all over Estonia, and the food industry is an important employer in several rural areas. The largest company in this industry among the meat industries is AS HKScan Estonia in Lääne-Viru County. Another large meat industry is the Atria Group, located in Southern Estonia. The largest bakery companies are AS Eesti Pagar in Paide and OÜ Cristella VT in Võru. The largest companies in the food industry also include the beverage producers Saku Õlletehase AS in Harju County and AS A. Le Coq in Tartu County, the dairy industries Valio Eesti AS and the Maag Group which includes AS Farmi Piimatööstus and Tere AS. The largest fish processors are AS MVWool located in Harju County and AS Paljassaare kalatööstus belonging to the Vičiūnai group, AS Japs M.V.M. located in Pärnu County and OÜ Vettel operating in Saare County. The largest confectionery producer is the Kalev production unit belonging to the Orkla Eesti AS group. The largest producers of ready meals are Lunden Food OÜ and Kulinaaria OÜ, which belongs to the Tallinna Kaubamaja group. Oil is produced by AS Scanola Baltic and yeast is produced by AS Salutaguse pärmitehas. There is intense competition and a fast product cycle in the production of food and beverages. Success is possible only for companies that are able to offer consumers products that they have grown to love over time, that have the same taste and quality, but at the same time also add new products to their assortment.
2020 was a diverse year for the sector. On the one hand, the demand for food increased significantly in the spring just before the emergency situation, but on the other hand, the sector was hit by supply chain disruptions and the spread of coronavirus within the workplaces.
The food industry consists of two major sectors: food and beverage production. 2020 was a bit more successful for food producers; sales in beverage production fell by 8 percent over the year. In 2020, raw material prices were on a downward trend. The purchase price of milk decreased by 5% during the year, to 293 euros per ton. This was hard for the producers because the profitability limit at Estonian farms is around 300 euros per ton. The prices of goat meat, sheep meat, pork and beef fell by a few percent during the year. At the same time, beef and pork production increased over the year, but decreased slightly for sheep meat and goat meat. In the production of beverages, producer prices fell by 1.2% over the year. Labour continued to rise in price, competition was intense and export sales declined. In 2020, the grain harvest in Estonia was again the highest in history but grain prices were slightly lower than a year earlier and industry’s raw materials therefore slightly cheaper. Export growth accelerated in 2020. In total, 1% more products were sold to foreign markets than in the previous year. While previously, the largest
1,9
7,934,7
12,4
92,5
0
20
40
60
80
100
Share in valueadded
Share in man.industryexports
Share ofexports in
sales
Share inemploy-ment
of man.industry
Ratio toaverage wage
%
Source: Statistics Estonia
Share of sector in economy
Problems in supply chains and soaring demand made the year difficult for the sector.
Raw materials became cheaper during the year.

22 Economic overview 2020
Ministry of Economic Affairs and Communications • Ministry of Finance 2021
destination country was Finland, Latvia took this place in 2020 - 10% more goods were sold there than a year before. In total, the share of Latvia increased to 22%. Growth was driven by fish and dairy products. At the same time, alcohol sales decreased by almost a fifth due to the stopping of the vodka race. In addition to Latvia and Finland, exports to Lithuania also exceeded 100 million euros, growing by 4% in a year. The general trend was a decline in exports in the Nordic countries and growth in poorer countries. Exports to Ukraine increased by a fifth over the year and to China by almost a third. Exports of all kinds of residues and dairy products increased mainly to Ukraine. Chinese exports were also driven by dairy products. In addition, sales to Israel almost doubled because of an increase in rapeseed oil sales by 4.5 million euros. Of the larger product groups, rapeseed oil exports increased by a quarter, and exports of fish products decreased by the same amount. Shutdown in the HORECA sector also took away the market of Estonian fish product exporters.
2020 was quite successful for the dairy industry as the largest branch of the food industry. The purchase price of milk decreased significantly because milk production set a record of the last 17 years and the demand was not entirely consistent. At the same time, the export volume of dairy products increased. The decrease in the price of milk led to a decrease in the number of dairy cows, but the increase in productivity per cow improved and the total milk yield increased. At the beginning of 2021, the purchase price of milk went up and this will probably help to stop the decline in the number of cows. In the spring of 2021, the financing scheme for the new planned dairy industry of E-Piim was completed and the construction itself should start in the summer of the same year, production 2 years later. This will ensure additional demand for Estonian milk and help to add value to raw milk on the spot. In terms of tons, the production of drinking milk and cheese increased by 1% and the production of curd by 4%.
-10
-5
0
5
10
0
500
1 000
1 500
2 000
2015 2016 2017 2018 2019 2020*
% y-o-ymillion €
Source: Statistics Estonia
Sales and exports
Sales Exports Change in sales (r.s.) Change in exports (r.s.)
Meat processing
industry20%
Fish processing
industry7%
Dairy industry22%
Production of bakery and pasta products
10%
Production of beverages
10%
Other27%
Processing and preserving of fruit
and vegetables4%
Share of sub-sectors in sales
Source: Statistics Estonia
Coronavirus reduced fish products exports, but increased oil exports.
Although the year was difficult, exports continued to increase.

23 Economic overview 2020
Ministry of Economic Affairs and Communications • Ministry of Finance 2021
In 2020, the productivity indicators of the dairy industry improved after several years of decline. Volumes increased, the number of employees decreased and profits increased by as much as a third. The growth of net value added reached 10% and investments increased by 15% during the year. 2020 turned out to be more successful for the meat industry than 2019. Total sales increased by 2%, which was lower than in the rest of the food industry, but at the same time losses were avoided and productivity indicators were improved. This was achieved thanks to cheaper raw materials and decreases in the number of employees. HKScan Estonia is at the top of the sector with a quarter of a billion euros in annual turnover and 1,100 employees. The next company is already 5 times smaller - Atria. The largest companies in the sector are all owned by Finnish capital and are part of larger multinational groups. For the beverage industry, 2020 was difficult. As a result of the change in excise policy, exports decreased, bars were closed to prevent the coronavirus from spreading and additional restrictions on alcohol sales were imposed. This led to an almost 8% decrease in beverage production. The drastic decline in the number of tourists also played a role in the reduced demand. As a result, the sector’s profits decreased by almost a quarter. Net value added decreased by 8% and labour productivity by 12% due to increase in labour costs and the number of people employed. A total of 62 million euros was exported in the beverage industry. The largest target market continued to be Latvia, sales to where decreased by 20% last year. The second target market was Finland, sales to where decreased by 18%. At the same time, exports to Lithuania increased by 43% over the year. Growth was driven by beer but Lithuanians were also happy to buy Estonian cider and vodka. For producers of bakery and pasta products, 2020 turned out to be rather poor. Quarantine significantly reduced orders in the HORECA sector and the exports also decreased slightly. Since the raw material prices did not change significantly over the year, producer prices also remained at the same level as a year before. The sector’s profit decreased by 5% and value added by 1% over the year. The frozen bakery segment, which has been growing rapidly so far, decreased by almost a tenth over the year. Fish industry sales decreased by 3% in 2020. Both the domestic market and exports were in decline. Although the listeria scandal that took place a year earlier had already been forgotten, the sector was plagued by a change in consumption patterns. Orders in the HORECA sector decreased and household demand was not able to fully cover the difference. At the same time, the companies managed to reduce losses and increase the net value added by 4%. Sales of Crustacea made the largest decline in exports, but frozen fish and fish fillets were also on decline.
The decline in the number of tourists and sales restrictions reduced alcohol sales.

24 Economic overview 2020
Ministry of Economic Affairs and Communications • Ministry of Finance 2021
Employment in food and beverage production decreased by 3% in 2020. The growth of the average wage in the food industry was slightly quicker than the Estonian average growth, but still remained lower than the Estonian average. The average wage is lowered by food producers, where the average wage is about 80% of that of the Estonian average. In the production of beverages, wages were 1.2 times higher than these of the Estonian average.
0 5 10 15 20 25 30
Latvia
Finland
Lithuania
Sweden
Denmark
Ukraine
Source: Statistics Estonia
%
Exports by main target countries
2020 2019
Meat products10%
Fish products11%
Dairy products20%
Bakery and pasta products…
Beverages9%
Other43%
Main export product groups
Source: Statistics Estonia
-4
-2
0
2
4
6
8
10
02 0004 0006 0008 000
10 00012 00014 00016 00018 000
2015 2016 2017 2018 2019 2020*
% y-o-y
Source: Statistics Estonia
Number of employed people and wages
Number of employed peopleAverage wages (in Euros)Change in the number of employed people (r.s.)Change in wages (r.s.)
The growth of the average wage in the food industry was slightly quicker than the Estonian average growth, but still remained lower than the Estonian average.

25 Economic overview 2020
Ministry of Economic Affairs and Communications • Ministry of Finance 2021
Investments in the food and beverage industry in 2020 decreased by 18% compared to the previous year. Two thirds of investments were made in machinery and equipment, where 27% less funds were invested than a year earlier. Besides fixed assets, it is important to invest in development activities to ensure competition in the sector. In 2019, there were only 4 full-time scientists or engineers in the production of food and beverages, which was three more than a year earlier. A total of 1.3 million euros was spent on research and development, which was 0.5 million euros less than a year earlier.
A survey of industrial enterprises conducted by the Estonian Institute of Economic Research in the spring of 2021 revealed that the confidence indicator, which summarises the production forecast, general demand and stocks of finished products of the enterprises, was more positive in both food and beverage production than a year earlier. Half of the beverage companies had increased their production volumes in recent months, but none had more orders than usually. The demand was not above the regular levels also in food production, but no redundancies were planned.
-10-8-6-4-20246810
050
100150200250300350400450500
2015 2016 2017 2018 2019 2020*
% y-o-ymillion €
Source: Statistics Estonia
Value added, labour costs and productivity
Value addedLabour costsChange in total productivity (r.s.)Change in labour costs productivity (r.s.)
-20
-10
0
10
20
30
0
20
40
60
80
100
120
2015 2016 2017 2018 2019 2020*
% y-o-ymillion €
Source: Statistics Estonia
Investments of companies
Investments in fixed assets
Change in investments (r.s.)
Investments decreased over the year as fewer machines and equipment were purchased.
In the spring of 2021, none of the beverage companies had more orders than usually.

26 Economic overview 2020
Ministry of Economic Affairs and Communications • Ministry of Finance 2021
Textile production The Estonian textile industry is mainly an export-oriented industry, which includes 300 companies, including 7 companies with more than 100 employees. The number of both companies and employees has been declining in recent years. Companies in the sector produce a wide range of textile products, from carpets and pillows to cords and life jackets. There are large textile industry companies in many parts of Estonia. The largest producer of finished textile products is AS Wendre in Pärnu County. The largest home textile producers are AS Mivar-Viva and Paragon Sleep AS in Viljandi County and Hilding Anders Baltic AS in Harju County. Carpets and rugs are produced by AS Mistra-Autex in Harju County. The largest textile finisher is AS Qualitex in Pärnu County and the largest producer of twine, rope and net linen is Saare Frydendahl OÜ in Saare County. The largest textile fibre producer is OÜ SKS Estonia Textile in Narva. There is intense competition in the textile industry and success is often determined by the ability to produce cheaper. Together with the increase in labour costs, also the textile industry in Estonia has reduced its activities in recent years.
The production volume of the textile industry decreased by 5% in 2020. Sales showed a slight increase due to higher prices. The growth of sales was driven by the domestic market, exports did not change during the year.
The share of exports in the sector’s sales has been historically high, but the growth has faltered in recent years. Since 2015, exports have grown by only 8%. At the same time, sales of the sector’s largest company, Wendre, have decreased for the past three years in a row. Hopefully, changes made in the management at the beginning of 2021 will be beneficial and the company will return to the growth path. In 2020, textile companies exported for a total of 261 million euros, which was 0.3% more than a year earlier. By major partners, exports to each country decreased. The biggest decline was in Germany, declining by 13% year-on-year. The largest increase came from Serbia to where there were no exports in the past, and in 2020 it rose to 2.9 million euros. Of the commodity groups, the sales of blankets and pillows decreased by 9% over the year, making a significant contribution to the decline in total exports, as this commodity group accounts for almost two thirds of the sector’s total exports. Furthermore, sales of wool yarn continued to decrease, with exports falling by 24%. At the same time, non-woven exports showed rapid growth, increasing by 72% in a year to 25 million euros. A somewhat worrying trend continued with the volume of goods in tons growing faster than their value. Thus, it can be concluded that the unit price of goods will decrease, i.e. more cheaper products will be exported.
0,4
3,4
73,8
3,0
71,2
0
20
40
60
80
100
Share in valueadded
Share in man.industryexports
Share ofexports in
sales
Share inemploy-ment
of man.industry
Relation toaverage wages
%
Source: Statistics Estonia
Share of sector in economy
Sales showed a slight increase due to higher prices.

27 Economic overview 2020
Ministry of Economic Affairs and Communications • Ministry of Finance 2021
The number of employees in the textile industry also continued to decrease in 2020. The rapid wage growth of the previous year did not continue and during the year, wages in the sector increased by 3%, which is significantly less than the Estonian average. According to preliminary data, the decrease in costs more than doubled the profit and increased the productivity indicators.
-10
-5
0
5
10
15
20
25
050
100150200250300350400
2015 2016 2017 2018 2019 2020*
% y-o-ymillion €
Source: Statistics Estonia
Sales and exports
Sales Exports Change in sales (r.s.) Change in exports (r.s.)
0 5 10 15 20 25 30
Poland
UK
Denmark
Germany
Finland
Sweden
Source: Statistics Estonia
%
Exports by main target countries
2020 2019
Other ready-made textile
products15%
Wool5% Carpets and
other textile floor covering
4%
Wadding, felt and nonwovens, cordage, ropes
17%
Blankets and pillows
53%
Other textile products6%
Main export commodity groups
Source: Statistics Estonia
By major partners, exports to each country decreased.

28 Economic overview 2020
Ministry of Economic Affairs and Communications • Ministry of Finance 2021
It is difficult to estimate investment in the textile industry according to short-term statistics, as the final figure is often significantly different from the initial one. Due to the small size of the sector, even a single investment may affect volumes. In 2020, half of the investments were made in machinery and equipment, where volumes decreased by 70% over the year.
The overall assessment of textile industry companies in the spring of 2021 was quite positive. One-fifth of the companies had more orders than usually and none of them had decreased their production volume in the previous months.
-15
-10
-5
0
5
10
15
0500
1 0001 5002 0002 5003 0003 5004 0004 5005 000
2015 2016 2017 2018 2019 2020*
% y-o-y
Source: Statistics Estonia
Number of employed people and wages
Number of employed peopleAverage wages (in euros)Change in the number of employed people (r.s.)Change in wages (r.s.)
-16-12-8-40481216
0102030405060708090
100
2015 2016 2017 2018 2019 2020*
% y-o-ymillion €
Source: Statistics Estonia
Value added, labour costs and productivity
Value addedLabour costsChange in total productivity (r.s.)Change in labour costs productivity (r.s.)
-100
-50
0
50
100
150
0
5
10
15
20
2015 2016 2017 2018 2019 2020*
% y-o-ymillion €
Source: Statistics Estonia
Investments of companies
Investments in fixed assets
Change in investments (r.s.)
According to preliminary data, the decrease in costs more than doubled the profit and increased the productivity indicators.
The overall assessment of textile industry companies in the spring of 2021 was quite positive.

29 Economic overview 2020
Ministry of Economic Affairs and Communications • Ministry of Finance 2021
Clothing production There are more than 500 companies operating in the clothing industry in Estonia, and this sector employs more than 4,000 people. Over the last decade, the sector volumes have been steadily declining. Estonian labour has become expensive and production has moved to cheaper countries. The largest companies in the clothing industry are the manufacturers of workwear AS Triest-Val and AS Svarmil in Ida-Viru County, the manufacturers of outerwear AS Protex Balti, Nurme Production OÜ, the manufacturer of children’s clothing OÜ Lenne and the manufacturer of underwear Miss Mary Production OÜ in Tallinn. The trend towards reduction that began many years ago will continue in the coming years. The sector that once employed more than 20,000 people, has shrunk 4 times. Constant wage pressures and staff shortages leave only well-specialized manufacturers with strong design skills.
2020 was the third consecutive year of decline for the clothing industry. The main reason for the decline was poor sales on the domestic market.
For the clothing industry, 2020 was difficult. On the one hand, many clothing stores were closed in the spring, but on the other hand, teleworking reduced the demand for office clothing. In addition, the halt in tourism meant that hotel and catering no longer required so much work clothes. This meant the need for the sector to adapt. Export is quite important for the clothing industry, accounting for more than two thirds of sales. In 2020, sales in the ten largest target markets decreased in half of the cases. More than half of the sector’s exports go to Finland and Sweden and sales in these markets decreased by 14% and 27%, respectively. In the case of Finland, the culprit was poor sales of sportswear and in the case of Sweden, reduced exports of men’s shirts. Sales increased by a quarter to Germany, where women’s underwear made in Estonia did well.
0,4
1,6
66,7
4,3
52,6
0
20
40
60
80
100
Share in valueadded
Share in man.industryexports
Share ofexports in
sales
Share inemploy-ment
of man.industry
Ratio toaverage wage
%
Source: Statistics Estonia
Share of sector in economy
The pandemic reduced demand for office-, work- and sportswear.

30 Economic overview 2020
Ministry of Economic Affairs and Communications • Ministry of Finance 2021
In the clothing industry, wages grew at a slower pace than the Estonian average for the third year in a row in 2020, which is why the gap with the average wage continued to increase. In total, the sector’s average gross monthly salary amounted to 850 euros, which exceeds the minimum wage by only 282 euros. This level makes the clothing industry one of the lowest average wage sectors, which has made it very difficult to find employees. Weak demand led to a drop in profits by almost a third and an almost a one-fifth decrease in net added value. Although the number of employed was optimized, productivity indicators fell.
-15-10-50510152025
0
50
100
150
200
2015 2016 2017 2018 2019 2020*
% y-o-ymillion €
Source: Statistics Estonia
Sales and exports
Sales Exports Change in sales (r.s.) Change in exports (r.s.)
0 10 20 30 40
UK
Germany
Russia
Norway
Sweden
Finland
Source: Statistics Estonia
%
Exports by main target countries
2020 2019
Men's clothing30%
Women's clothing16%
Bra's20%
Sports- and workwear
10%
Babies clothes2%
Other products22%
Main export commodity groups
Source: Statistics Estonia
In 2020, sales in the ten largest target markets decreased in half of the cases.

31 Economic overview 2020
Ministry of Economic Affairs and Communications • Ministry of Finance 2021
According to preliminary data, investments in fixed assets in the clothing industry increased by more than 50% over the year. At the same time, the total volume of investments in this sector is small and short-term statistics are usually adjusted to a large extent, which means that the data for 2020 may still change significantly.
The estimates of the textile industry enterprises surveyed by the Estonian Institute of Economic Research in the spring of 2021 were significantly more positive with regard to the near future as in the previous year. One third of the producers had more orders than usual. The same proportion of respondents expected growth to continue in the coming months. They also planned to increase the number of employees.
-20
-15
-10
-5
0
5
10
0
1 000
2 000
3 000
4 000
5 000
6 000
7 000
2015 2016 2017 2018 2019 2020*
% y-o-y
Source: Statistics Estonia
Number of employed people and wages
Number of employed people
Average wages (in euros)
Change in the number of employed people (r.s.)
-20
-15
-10
-5
0
5
10
01020304050607080
2015 2016 2017 2018 2019 2020*
% y-o-ymillion €
Source: Statistics Estonia
Value added, labour costs and productivity
Value addedLabour costChange in total productivity (r.s.)Change in labour costs productivity (r.s.)
-60
-40
-20
0
20
40
60
80
012345678
2015 2016 2017 2018 2019 2020*
% y-o-ymillion €
Source: Statistics Estonia
Investments of companies
Investments in fixed assets
Change in investments (r.s.)
Profit and productivity fell.
One third of the producers had more orders than usual.

32 Economic overview 2020
Ministry of Economic Affairs and Communications • Ministry of Finance 2021
Wood processing More than half of Estonia’s area is covered with forest, which is why we have good preconditions for the development of the forest and wood industry. In total, the wood industry in Estonia employs 18,000 people in 1,100 companies. The sector generates more than a billion euros in exports a year and maintains jobs outside major cities. At least 500 people work in five companies. The range of products for the wood industry is wide, starting with the production and processing of sawn timber and ending with the production of wooden houses, windows and doors. More employed are in Jeld-Wen Eesti AS, which produces wooden doors and windows, Stora Enso Eesti AS, which produces sawn and planed material and glue-laminated beams, and AS Technomar & Adrem, which produces parquet, packaging and cable drum pallets. Other large companies include AS Viljandi Aken ja Uks, which manufactures wooden doors, windows, shutters and their frames, and veneer and plywood producers UPM-Kymmene Otepää OÜ and OÜ Balti Spoon. Chip-board is produced by AS Repo Vabrikud. Thermory AS has become one of the largest sawmill industries. In terms of turnover, AS Toftan, which produces sawn timber in Võru County, and AS Palmako and OÜ Harmet, which produce garden houses, may also be highlighted. One aspect of the success of the timber industry is the availability of raw materials. Relying only on imported logs will lose the competitive advantage and the sector may run into difficulties.
In 2020, the timber industry did not allow itself to be disturbed by the crisis and sales volumes increased due to strong domestic demand.
In 2020, the price of wood continued to fall, bringing down producer prices in the sector, which fell by 1.1% in a year. According to RMK’s interim warehouse statistics, timber prices fell by 17% over the year. The year was particularly hard in terms of pulpwood, the price of which fell by 22%. The only type of pulpwood whose price increased over the year was aspen pulpwood which increased by 1%. The decrease in prices was lower than average for birch logs and offers. At the end of the year, the trend changed and in December, retail prices had risen to the highest level of the year. Exports have always played an important role in the Estonian wood industry, accounting for almost two thirds of sales, reaching 1.7 billion euros in 2020. The main export partners were Sweden, Denmark and Germany, which accounted for just over a third of exports. Finland and Norway dropped out of the top three. While in the case of Finland the weakness of exports was general and the decline was in many different commodity groups, in the case of Norway the reason was the fall in exports of wooden houses. The travel restrictions related to the pandemic did not allow the installation teams to move freely, and several projects were also put on hold until the circumstances became clear. Denmark rose to sixth place with a 37% increase because exports of wood pellets to that country increased significantly. Among the larger and more exotic countries, the USA and Korea
2,7
18,4
60,5
16,3
91,8
0
20
40
60
80
100
Share in valueadded
Share in man.industryexports
Share ofexports in
sales
Share inemploy-ment
of man.industry
Ratio toaverage wage
%
Source: Statistics Estonia
Share of sector in economy
Raw material prices were cheap and demand for production was high.

33 Economic overview 2020
Ministry of Economic Affairs and Communications • Ministry of Finance 2021
showed good growth. More wood treating products went to the USA and plywood to Korea. Of the larger commodity groups, plywood sales continued to grow strongly, increasing by 10% year-on-year to 108 million euros. Sales of wooden windows also went well, growing by a fifth during the year. The sales of wooden houses which had grown rapidly so far, decreased by 11% or 45 million euros. Sales of this product group to the main target market in Norway decreased by 28%. Sales of wood pellets also started to decline, decreasing by 2% year-on-year.
-4-202468101214
0
500
1 000
1 500
2 000
2 500
2015 2016 2017 2018 2019 2020*
% y-o-ymillion €
Source: Statistics Estonia
Sales and exports
Sales Exports Change in sales (r.s.) Change in exports (r.s.)
0 10 20
TheNetherlands
Norway
Finland
Germany
Denmark
Sweden
Source: Statistics Estonia
%
Exports by main target countries
2020 2019
Building components (incl. windows, doors)
21%
Sawn timber17%
Plywood2%Veneer
7%
Log houses22%
Profiled timber11%
Other products20%
Main export commodity groups
Source: Statistics Estonia
The sales of wooden houses and pellets which had grown rapidly so far, decreased.
Exports were carried by plywood and various wooden products.

34 Economic overview 2020
Ministry of Economic Affairs and Communications • Ministry of Finance 2021
In 2020, wages in the wood industry grew quicker than the year before and the sector average got a bit closer to the Estonian average. At the same time, wage growth was faster in companies with at least 50 employees. In the smaller ones, the growth was below the Estonian average. According to preliminary data, the number of employed in the sector decreased by a few percent, but the added value increased. This meant that productivity per employee also increased. In addition, the sector’s profit increased almost three times during the year.
Pursuant to preliminary data, investments in the wood industry increased by 13% in 2020. At the same time, the volume of investments in this sector has been notably adjusted in several cases upon receipt of the final data, which is why the final data may differ remarkably from those presented here. For example, the final amount of investments in 2018 was more than twice as high as the initial one. According to preliminary data, investments in machinery and equipment were the same as a year earlier, but investments in buildings increased significantly, growing by 82%.
-6-4-20246810
0
5 000
10 000
15 000
20 000
2015 2016 2017 2018 2019 2020*
% y-o-y
Source: Statistics Estonia
Number of employed people and wages
Number of employed peopleAverage wages (in euros)Change in the number of employed people (r.s.)Change in wages (r.s.)
-10-5051015202530
0
100
200
300
400
500
600
2015 2016 2017 2018 2019 2020*
% y-o-ymillion €
Source: Statistics Estonia
Value added, labour costs and productivity
Value addedLabour costsChange in total productivity (r.s.)Change in labour costs productivity (r.s.)
-30
-20
-10
0
10
20
30
0
50
100
150
200
250
2015 2016 2017 2018 2019 2020*
% y-o-ymillion €
Source: Statistics Estonia
Investments of companies
Investments in fixed assetsChange in investments (r.s.)
Low costs and strong demand increased the sector's productivity significantly.
Greater automation would help limit labor cost growth and increase productivity.

35 Economic overview 2020
Ministry of Economic Affairs and Communications • Ministry of Finance 2021
The expectations of the enterprises surveyed by the Estonian Institute of Economic Research in the spring of 2021 were notably more positive compared with the previous year. 53% of the surveyed companies had more orders than usually. In addition, two thirds of respondents planned to raise their prices. The lack of labour and materials was pointed out as the main factor limiting the growth of production. It is the lack of material and rising timber prices that can leave an important mark on the sector’s results in 2021.

36 Economic overview 2020
Ministry of Economic Affairs and Communications • Ministry of Finance 2021
Manufacture of paper pulp, paper and paper products Although the paper industry has a long tradition in the Estonian economy, it is a rather small industry. There are more than 60 companies engaged in the production of paper, pulp or paper products in Estonia, which employ about 1,300 people. Half of the sector’s turnover is generated by two companies. AS Estonian Cell, producer of aspen pulpwood, and Horizon Tselluloosi ja Paberi AS, slightly smaller paper and board producer. AS Räpina Paberivabrik recycles wastepaper. The largest manufacturer of paper stationery is Victor Stationery OÜ. There are a total of 8 companies in the sector with a turnover exceeding 10 million euros. Four of them are engaged in the production of cardboard containers. Estonia’s wood resource would also allow opportunities for chemical treatment of wood here, but for various reasons this has not happened so far.
2020 was a difficult year for the paper industry. The price of wood pulp on the world market fell and it also reduced the sales of Estonian producers.
2020 was the second difficult year in a row for the paper industry. The price of mechanical pulp was low on the world market and the sector yielded a loss compared to the previous year. Although online trade increased during the pandemic, it was not enough to compensate for lost demand for paper in other segments. Although the largest company in the sector, Estonian Cell, increased its production volume by 4% in 2020, the low prices brought down the sales revenue by 13%. Although the company has significantly improved its energy efficiency in recent years, saving more than 10 GWh of electricity per year, in 2020 it had a loss of almost 10 million euros. Horizon’s turnover also decreased. 77% of the paper industry’s production was exported, which was the average level in recent years. The larger export destinations are largely due to the operations of Estonian Cell and Horizon, as the companies’ exports account for more than two thirds of the total branch’s exports. The significant fall in prices in the sector is shown by the fact that although exports in monetary terms fell by 4%, they increased by 6% when measured in tons. The largest export partner in 2020 was Italy, accounting for 10% of the sector’s total exports. Exports to India which had the first place a year earlier, fell by 28%, leading to the 4th place in the ranking. There was a very strong continued growth on the direction of China to which 5 times more production was sold than the year before. If world market prices for pulp recover, growth in the sector’s exports is also expected. In total, exports of wood pulp in monetary terms decreased by 2% and exports of kraft paper by 13% during the year.
0,4
2,1
77,2
1,4
99,3
0
30
60
90
120
150
0
20
40
60
80
100
Share in valueadded
Share in man.industryexports
Share ofexports in
sales
Share inemploy-ment
of man.industry
Ratio toaverage wage
%%
Source: Statistics Estonia
Share of sector in economy
The price of wood pulp on the world market fell and it also reduced the sales of Estonian producers.
Although online trade increased during the pandemic, it was not enough to compensate for lost demand for paper in other segments.

37 Economic overview 2020
Ministry of Economic Affairs and Communications • Ministry of Finance 2021
In 2020, wages in the paper industry grew slower than the Estonian average, falling below the national average for the first time. The largest and highly automated plants in the sector have a small number of employees and, despite their high wages, do not have a significant impact on the sector average. According to preliminary data, the number of employed in the sector decreased by 5% according to business statistics. However, employment statistics in the sector are very volatile due to the small number of enterprises. The sector’s efficiency indicators continued to decline. The profit of ten million euros earned a year earlier was replaced by a loss of a few million euros and the value added fell by a third.
-15
-10
-5
0
5
10
15
0
50
100
150
200
250
300
2015 2016 2017 2018 2019 2020*
% y-o-ymillion €
Source: Statistics Estonia
Sales and exports
Sales Exports Change in sales (r.s.) Change in exports (r.s.)
0 10 20
The Netherlands
UK
India
Sweden
Finland
Italy
Source: Statistics Estonia
%
Exports by main target countries
2020 2019
Uncoated kraft paper and cardboard
20%
Boxes, crates, bags and other packaging
15%
Pulp37%
Other products28%
Main export commodity groups
Source: Statistics Estonia
In 2020, wages in the paper industry grew slower than the Estonian average, falling below the national average for the first time.
Italy became the largest export partner.

38 Economic overview 2020
Ministry of Economic Affairs and Communications • Ministry of Finance 2021
Investments in the paper industry depend to a large extent on the activities of the two largest companies in the sector. Therefore, a single major investment can have a significant impact on the overall numbers. The information is also affected by the time the data is received. According to preliminary figures, investments in the sector in 2020 were three times smaller than the year before. This was mainly due to buildings and machinery and equipment, investments into which were significantly smaller than a year earlier.
In the spring of 2021, the paper industry companies surveyed by the Estonian Institute of Economic Research had a similar attitude towards the future than the year before. One fifth of the responding companies had more orders than usual and no one planned to reduce the number of employees.
-6-4-20246810
0200400600800
1 0001 2001 4001 6001 800
2015 2016 2017 2018 2019 2020*
% y-o-y
Source: Statistics Estonia
Number of employed people and wages
Number of employed people
Average wage (in euros)
Change in the number of employed people (r.s.)
-40
-30
-20
-10
0
10
20
0102030405060708090
2015 2016 2017 2018 2019 2020*
% y-o-ymillion €
Source: Statistics Estonia
Value added, labour costs and productivity
Value addedLabour costsChange in total productivity (r.s.)Change in labour costs productivity (r.s.)
-100
0
100
200
300
400
0
5
10
15
20
25
30
35
2015 2016 2017 2018 2019 2020*
% y-o-ymillion €
Source: Statistics Estonia
Investments of companies
Investments in fixed assets
Change in investments (r.s.)
There has been a lot of investment in recent years, and now we can see how, for example, electricity consumption per unit of production has decreased.
The sector's performance indicators fell sharply.

39 Economic overview 2020
Ministry of Economic Affairs and Communications • Ministry of Finance 2021
The chemical industry A unique part of the Estonian chemical industry is the oil shale-based industry, although the majority of the sector is still made up of other sub-sectors, such as the construction or consumer chemical industry. The smallest sub-sector (with a few hundred employees) is the pharmaceutical industry. The chemical industry is a capital-intensive activity, the growth of production volume has not led to a significant increase in the number of jobs. Despite productivity growth, the gap with the EU average is still significant.
There are more than 150 chemical companies operating in Estonia. About half of the chemical industry is located in Ida-Viru County, a third of the employees work in Tallinn and Harju County. The largest chemical companies are VKG Oil AS and KKT Oil OÜ (shale oil production; Enefit Power AS is engaged in oil production in addition to energy production), Akzo Nobel Baltics AS, AS Tikkurila and AS Eskaro (paints and varnishes), NPM Silmet OÜ (rare metals), Mayeri Industries AS (household care, washing and cleaning products), OÜ Eurobio Lab (manufacture of cosmetics), AS Novotrade Invest (refining of petroleum products), OÜ Krimelte and Henkel Balti Operations OÜ (assembly foams), Eastman Specialties OÜ (benzoic acid, sodium benzoate, plasticisers), Orica Eesti OÜ (explosives), AS Chemi-Pharm (disinfectants, cleaning and special care products) and Interchemie Werken De Adelaar Eesti AS (veterinary medicines and products).
Large investments in the oil industry create new jobs, but the industry is highly dependent on world oil prices and climate policy, and it is therefore difficult to assess whether or not plans to construct new oil plants and refineries are being met. No major employment increase is expected in the sector as an entirety in the coming years. The boost of production volumes will continue to be based on increasing productivity. The need to improve efficiency stems from the increase in the cost of production inputs, and the chemical industry is also largely affected by the surge of environmental costs.
4 In addition to the production of chemicals and chemical products (EMTAK 20), this sector also includes the production of fuel oils
(EMTAK 19) and the production of basic pharmaceutical products and pharmaceutical preparations (EMTAK 21).
The sub-sectors4 of the chemical industry were affected very differently by the corona crisis – demand for pharmaceutical products grew sharply while production in the oil industry dropped. The number of people employed in the sector as a whole did not change significantly. The outlook for 2021 is rather positive.
In the chemical industry, industrial production grew quite strongly in 2020 in the form of production of chemical and pharmaceutical products, while the oil industry was in decline. Sales and exports moved at a somewhat different pace, especially in the production of chemical products.
The rapid growth of pharmaceutical production continued in 2020, with the spread of the coronavirus providing an additional impulse. In the year as a whole, industrial production increased by almost 15%, in the III quarter the growth even exceeded a quarter. The growth of sales was even faster due to the price increase, producer prices increased by 4%. The exports increased approximately 40% in a year. Starting from the second quarter, sales to the domestic market fell several times, but this may partly reflect changes in the
0,9
7,7
86,9
3,8
99,4
0
30
60
90
120
150
0
20
40
60
80
100
Share in valueadded
Share in man.industryexports
Share ofexports in
sales
Share inemploy-ment
of man.industry
Ratio toaverage wage
(r.s.)*
%%
*Manufacture of chemical products
Source: Statistics Estonia
Share of sector in economy
In the chemical industry, industrial production grew quite strongly in 2020 in the form of production of chemical and pharmaceutical products, while the oil industry was in decline.

40 Economic overview 2020
Ministry of Economic Affairs and Communications • Ministry of Finance 2021
sales structure - the products were sent to foreign markets without local intermediaries. Exports accounted for over 90% of the sales.
However, the oil industry was characterised by an opposite situation. Restrictions on movement to prevent the coronavirus reduced demand for transport services and therefore, fuels, which in turn led to lower prices. In April, producer prices in the oil industry were 30% lower than a year ago, and export and import prices fell by as much as 50-60%. After that, the situation improved, but producer prices were almost a fifth lower also as a yearly summary. The decline in export and import prices reached 30–40%. Decreased demand meant almost a tenth less production for the Estonian oil industry than a year ago, while sales and sales revenue fell even more.
In the production of chemical products, industrial production increased by a tenth over the year, but sales were slightly lower than last year. Producer and export prices have been declining since March, reaching 6–7% year-on-year.
Exports of chemical products of Estonian origin were most affected by the decline in the sales of shale oil. On the other hand, exports of various oils and fuels in relation to processing or blending fuels, as well as bunkering ships, increased. Sales of disinfectants and denatured alcohol increased several times, and in addition to the increase in quantities, also higher prices contributed to the growth of export revenues. Most of the chemical product groups grew in 2020, but the so-called conventional pharmaceutical products, i.e. medicines (not containing antibiotics, while sales of medicines containing antibiotics increased) was in decline.
In 2020, the statistics showed the offshore (ship bunkering) as a separate destination, to which various oils and other products were exported. Relatively many larger changes took place across countries. Sales of products of Estonian origin increased significantly in the USA, mainly due to various petroleum products and oils (but sales of shale oil decreased), in addition, exports of sealing mixtures also increased. Oils also had an increased growth in Sweden, as well as disinfectants. Motor gasoline was mainly sold to Australia. The growth of sales to the Netherlands was mainly due to various oils, but the sales of various medicines also increased significantly. There were many more countries that showed rapid growth. The biggest drops in terms of exports involved Netherlands and Belgium, driven by various oils and petroleum products, including shale oil.
-30
-20
-10
0
10
20
30
40
0100200300400500600700800
2015 2016 2017 2018 2019 2020*
% y-o-ymillion €
Source: Statistics Estonia
Sales and exports
Sales Exports Change in sales (r.s.) Change in exports (r.s.)
Sales of disinfectants and denatured alcohol increased several times, and in addition to the increase in quantities, also higher prices contributed to the growth of export revenues.
The rapid growth of pharmaceutical production continued in 2020, with the spread of the coronavirus providing an additional impulse.

41 Economic overview 2020
Ministry of Economic Affairs and Communications • Ministry of Finance 2021
The number of people employed in the chemical industry as a whole did not change significantly over the year, the number of working hours decreased by a few percent. However, in oil industry, labour use was reduced by about 7% while the number of employed in other sub-sectors increased slightly. In the production of chemical products, wage growth in larger companies with 50 and more employees remained close to 5%. In other branches of the chemical industry, the change in labour costs also indicated continued wage growth.
Due to the difficult situation in the oil industry, the year ended with a loss, and productivity indicators also deteriorated significantly. In the chemical product manufacturing and pharmaceutical industries, both profit and productivity figures were significantly better than a year before, but it should be kept in mind that the final statistics may differ significantly from the initial ones.
0 5 10 15 20 25 30
Finland
Belgium
UK
Latvia
Russia
Sweden
Offshore
USA
The Netherlands
Source: Statistics Estonia
%
Exports by main target countries
2020 2019
Mineral fuels and oils62%
Inorganic chemicals4%
Organic chemicals4%
Pharmacy products3%
Fertilizers2%
Paints, varnishes, mastics
10%Cosmetic or toilet
preparations, essential oils2%
Other13%
Main export commodity groups
Source: Statistics Estonia
The number of people employed in the chemical industry as a whole did not change significantly over the year, the number of working hours decreased by a few percent.

42 Economic overview 2020
Ministry of Economic Affairs and Communications • Ministry of Finance 2021
According to short-term statistics, investments in the production of chemical products decreased by one fifth over the year. More than half of investments went to machinery and equipment. More investments were made in buildings (a third of all investments), as well as in the purchase of land, means of transport and computer systems. Data from other sub-sectors of the chemical industry is incomplete.
The estimates of chemical producers were on the negative side for most of 2020, but the situation improved at the end of the year. In the middle of the
-10-8-6-4-20246810
0500
1 0001 5002 0002 5003 0003 5004 0004 5005 000
2015 2016 2017 2018 2019 2020*
% y-o-y
Source: Statistics Estonia
Number of employed people and wages
Number of employed peopleAverage wage: manufacture of chemical products (euros)Change in the number of employed people (r.s.)Change in wages (r.s.)
-25-20-15-10-5051015202530
0
50
100
150
200
250
2015 2016 2017 2018 2019 2020*
% y-o-ymillion €
Source: Statistics Estonia
Value added, labour costs and productivity
Value added
Labour costs
Change in total productivity (r.s.)
Change in labour costs productivity (r.s.)
-80-70-60-50-40-30-20-100102030
0
20
40
60
80
100
120
140
2015 2016 2017 2018 2019 2020*
% y-o-ymillion €
* 2017. ja 2018. data on oil industry and pharmaceutical industry investments are inadequate, reflecting only the production of chemicals and chemical products
Source: Statistics Estonia
Investments of companies
Investments in fixed assets
Change in investments (r.s.)
Due to the difficult situation in the oil industry, the year ended with a loss, and productivity indicators also deteriorated significantly.

43 Economic overview 2020
Ministry of Economic Affairs and Communications • Ministry of Finance 2021
year, the representatives of the companies surveyed by the Estonian Institute of Economic Research mostly pointed out the low demand, but at the beginning of 2021 the situation had changed – shortage of materials and equipment was mentioned the most, and finding labour was an issue again. Undertaking’s expectations for the future were rather positive, there were more orders than usual, and prices were expected to increase. For oil producers, 2021 is also expected to be better than the previous one, supported by the recovery in oil prices. While the coronavirus provided additional work for the pharmaceutical industry in certain areas, the improved situation due to the virus and increased supply and logistical challenges in other countries may mean that there may not be similar results in 2021 (as to the same products), but new sources of growth are expected to be found.
Undertaking’s expectations for the future were rather positive, there were more orders than usual, and prices were expected to increase.

44 Economic overview 2020
Ministry of Economic Affairs and Communications • Ministry of Finance 2021
Manufacture of rubber and plastic products Products of the rubber and plastics industry are used in many fields, from the food industry (packaging) to the automotive and building materials industries. The Estonian rubber and plastics industry is made up by approximately 200 mostly small and medium-sized enterprises. The largest companies are OÜ Aquaphor International (water filters), Pipelife Eesti AS (plastic pipes), AS Estiko-Plastar (film and film packaging), OÜ Plasto Aknad.Uksed (plastic windows and doors), Promens AS, Talent Plastics Tallinn AS (plastic products for the automotive industry), Plastone OÜ (plastic products for various industries), AS Reideni plaat (heat insulation boards), AS Dagöplast (film products), Greiner Packaging AS (plastic packaging), Cipax Eesti AS (plastic containers), Sigma Polymer Group OÜ (rubber and metal parts for automotive and machinery industry), OÜ Merinvest (rubber o-rings, membranes) and AS Balteco (plastic baths and cast marble basins). Larger companies are situated in Tallinn and Harju County (almost half of the workforce), Saare County and Tartu County (about 15% of the workforce), but there are also quite a lot of employees in Ida-Viru County and Hiiu County.
The number of people employed in the rubber and plastics industry will rather shrink in the future. Production becomes more complex and more labour-intensive tasks will be replaced by machines. Mass production has already partially moved out of Estonia and companies with a flexible focus on smaller batches have better prospects.
In the rubber and plastics industry, sales decreased in 2020 mainly due to the domestic market. According to preliminary data, the number of employed increased, wages increased and financial indicators improved, but the final statistics may differ. At the beginning of 2021, the assessments of undertakings had not improved much yet, although production was already showing growth.
In the rubber and plastics industry, production volumes fell already in the beginning of 2020, and the corona crisis reduced production even further. In May, the production numbers were 25% lower than a year earlier. From there, the situation started to improve and at the end of the year the level of the previous year was exceeded. However, production decreased by almost 7% during the year and the sales followed suit. Exports decreased by only a few percent, but more than 15% less production was sold to the domestic market than in the previous year. While more positive developments in production could be seen in the second half of the year, prices continued to fall. In the year as a whole, however, producer prices were only slightly lower than a year ago, with export prices falling by more than 2%.
Among products of Estonian origin, exports of plastic pipes and hoses and plastic or foam plates and films increased, while exports of furniture or vehicle fittings decreased. The importance of the main export partners did not change. Sales increased more to Germany (due to increased sales of plastic pipes and hoses), Latvia (plastic boxes and packaging), and Lithuania (pipes and hoses, boxes and cases). Fewer furniture or vehicle fittings, boxes, packaging, caps, etc. and rubber washers and other seals were sold to Sweden.
0,5
3,2
60,4
4,1
86,8
0
20
40
60
80
100
Share in valueadded
Share in man.industryexports
Share ofexports in
sales
Share inemploy-ment
of man.industry
Ratio toaverage wage
(r.s.)
%
Source: Statistics Estonia
Share of sector in economy
In the rubber and plastics industry, production volumes fell already in the beginning of 2020, and the corona crisis reduced production even further.
Exports decreased by only a few percent, but more than 15% less production was sold to the domestic market than in the previous year.

45 Economic overview 2020
Ministry of Economic Affairs and Communications • Ministry of Finance 2021
According to preliminary data, the number of people employed in the rubber and plastics industry increased by 5% in 2020, and the number of working hours grew even more. The final statistics are likely to show somewhat more modest numbers. The average salary also grew at a fairly fast pace (by almost 6%, reflecting companies with 50 and more employees). While industrial production indices showed a decrease in sales, according to the preliminary financial indicators, sales revenue, value added and profit increased and productivity indicators improved. However, final estimates may differ slightly from the short-term statistics.
-10
-5
0
5
10
15
0
100
200
300
400
500
2015 2016 2017 2018 2019 2020*
% y-o-ymillion €
Source: Statistics Estonia
Sales and exports
Sales Exports Change in sales (r.s.) Change in exports (r.s.)
0 5 10 15 20 25 30
Poland
The Netherlands
Denmark
Norway
Lithuania
Germany
Latvia
Sweden
Finland
Source: Statistics Estonia
%
Exports by main target countries
2020 2019
Fittings for furniture,
coachwork or the like30%
Boxes, bottles, etc.22%
Plastic sheets and films
16%
Pneumatic tyres1% Vulcanized rubber
products (seals etc.)7%
Plastic pipes and hoses12%
Plastic baths, sinks etc
2%Other building components of
plastics7%
Other products3%
Main export commodity groups
Source: Statistics Estonia
Among products of Estonian origin, exports of plastic pipes and hoses and plastic or foam plates and films increased, while exports of furniture or vehicle fittings decreased.

46 Economic overview 2020
Ministry of Economic Affairs and Communications • Ministry of Finance 2021
According to preliminary data, investment in the rubber and plastics industry fell by a fifth, but final statistics may not show such a large decline. Half of the capital investments in tangible fixed assets went to machinery and equipment, their volume decreased by one tenth compared to the previous year. However, investments in computers and computer systems increased significantly. In 2019, record large investments were made in buildings, which resulted in a larger drop in 2020, but the investments were still significant compared to previous years (one third of the total investments).
According to a survey by the Estonian Institute of Economic Research, the assessments of the rubber and plastics industry’s economic situation
-1012345678
0500
1 0001 5002 0002 5003 0003 5004 0004 500
2015 2016 2017 2018 2019 2020*
% y-o-y
Source: Statistics Estonia
Number of employed people and wages
Number of employed people
Average wage (in euros)
Change in the number of employed people (r.s.)
Change in wages (r.s.)
-4
-2
0
2
4
6
8
10
12
0
20
40
60
80
100
120
140
160
2015 2016 2017 2018 2019 2020*
% y-o-ymillion €
Source: Statistics Estonia
Value added, labour costs and productivity
Value added
Labour cost
Change of total productivity (r.s.)
Change of labour costs productivity (r.s.)
-30
-20
-10
0
10
20
30
40
0
5
10
15
20
25
30
35
40
2015 2016 2017 2018 2019 2020*
% y-o-ymillion €
Source: Statistics Estonia
Investments of companies
Investments in fixed assets
Changes in investments (r.s.)
According to preliminary data, the number of people employed in the rubber and plastics industry increased by 5% in 2020, and the number of working hours grew even more. The final statistics are likely to show somewhat more modest numbers.
Half of the capital investments in tangible fixed assets went to machinery and equipment.

47 Economic overview 2020
Ministry of Economic Affairs and Communications • Ministry of Finance 2021
remained rather pessimistic throughout 2020, and the first months of 2021 did not bring any significant change yet. However, there were also more positive developments, especially in terms of forward-looking expectations. The share of companies that forecast the growth of production increased, sales prices were expected to increase and the number of employees was no longer expected to decrease. The problem of weak demand began to ease and production growth began to be constrained by other factors, such as shortage of materials and equipment, and to a lesser extent, labour. In the first quarter of 2021, production grew at a fairly fast pace.
However, there were also more positive developments, especially in terms of forward-looking expectations - the share of companies that forecast the growth of production increased, sales prices were expected to increase and the number of employees was no longer expected to decrease.

48 Economic overview 2020
Ministry of Economic Affairs and Communications • Ministry of Finance 2021
Manufacture of metal and metal products The metal industry is involved in several areas, such as the manufacture and construction of machinery and equipment. Metal industry companies employ more than 14,000 people in Estonia, thus being one of the largest industry after the wood industry and next to the food industry. The branch has more than 1,400 companies. The metal industry is concentrated in Tallinn and its vicinity (60% of the workforce) and in Ida-Viru, Pärnu and Tartu County (approximately one tenth of the workforce). The largest companies are AS Metaprint (production of metal packaging), Hanza Mechanics Tartu AS, AS Favor, AQ Lasertool OÜ (metal processing), ETS Nord AS (ventilation equipment), Ruukki Products AS (metal products, building structures), AS Saku Metall Allhanke Tehas (thin sheet metal products, lifts), Fortaco Estonia OÜ, OÜ Marketex Offshore Constructions, AS AXIS Tech Estonia (metal structures), Tammer OÜ (metal doors), and AS Estanc (containers).
In the long run, the metal industry may be expected to continue to grow, mainly driven by exports. However, the number of the employed may rather decrease, the growth of production must be ensured by the increase of productivity.
In the metal industry, sales decreased in 2020 mainly due to the decline in the domestic market. At the end of the year, the situation started to improve and at the beginning of 2021, the assessments of companies were already at the usual level and the production had also increased.
In the metal industry, industrial production continued to decline at the beginning of 2020, with a larger drop (by more than a fifth) occurring in May, similar to the production of construction materials. It was only at the end of the year that more positive developments could be seen. In the year as a whole, both production and sales decreased by 7%. The decline was mainly due to the domestic market, the decline in exports was only a few percent. In the production of metals, producer prices also decreased significantly over the year, but in the production of metal products they increased by 1%, export prices even more.
Exports of several products of Estonian origin increased, such as gas tanks and smaller barrels and containers, caravans, aluminium doors or windows. However, sales of very different products decreased. The decline in sales of metal structures and containers reduced exports to Sweden. Sales in Poland decreased mainly due to a decrease in lead exports; less tantalum, hooks and clamps, etc., niobium and rhenium products were sold to the USA. However, exports increased to the Czech Republic (lead), Germany (containers and various products) and Sweden (caravans, metal structures, containers). Sales to the main export market, Finland, remained stable although there were several positive and negative changes concerning products.
1,8
9,2
52,7
12,0
99,3
0
20
40
60
80
100
120
0
20
40
60
80
100
Share in valueadded
Share in man.industryexports
Share ofexports in
sales
Share inemploy-ment
of man.industry
Ratio toaverage wage
(r.s.)*
%
* Production of metal products
Source: Statistics Estonia
Share of sector in economy
It was only at the end of the year that more positive developments could be seen.
The decline was mainly due to the domestic market, the decline in exports was only a few percent.

49 Economic overview 2020
Ministry of Economic Affairs and Communications • Ministry of Finance 2021
According to the short-term statistics, the number of people employed in the metal industry remained at the same level as a year ago, but the number of working hours decreased slightly. In the largest sub-sector of the sector, manufacturing of metal products, wage levels remained at the level of the previous year (in companies with at least 50 employees). Therefore, labour costs did not change significantly. Although total costs were somewhat reduced, this was not sufficient to compensate the decline in sales revenue, and profits, added value and productivity indicators were all poorer than a year ago.
-10
-5
0
5
10
15
0200400600800
1 0001 2001 4001 600
2015 2016 2017 2018 2019 2020*
% y-o-ymillion €
Source: Statistics Estonia
Sales and exports
Sales Exports Change in sales (r.s.) Change in exports (r.s.)
0 10 20 30 40
Denmark
The Netherland
Poland
Russia
Norway
Germany
Sweden
Finland
Source: Statistics Estonia
%
Exports of goods of Estonian origin by main target countries
2020 2019
Iron and steel8%
Iron and steel products60%
Copper and copper products
1%
Aluminium and aluminium products
8%
Lead and lead products
3%
Miscellaneous articles of base
metal8%
Other products
12%
Main export commodity groups
Source: Statistics Estonia
According to the short-term statistics, the number of people employed in the metal industry remained at the same level as a year ago, but the number of working hours decreased slightly.

50 Economic overview 2020
Ministry of Economic Affairs and Communications • Ministry of Finance 2021
According to preliminary data, investments in the production of metal products decreased by almost a fifth, mainly on account of buildings and means of transport. However, based on figures from previous years, it can be expected that the final statistics will considerably adjust these estimates. Still, active investments were made in machinery and equipment, accounting for almost 80% of capital formation. Investment data on the smaller sub-sector, metal production, is incomplete but may have remained at a level comparable to previous years.
According to a study by the Estonian Institute of Economic Research, the main problems in the metal industry in 2020 were related to insufficient demand, but in the second half of the year several companies also mentioned financial problems, for instance. All the main indicators remained negative for almost the entire year – there were few orders, sales prices were forecast to decrease and the number of employees to reduce. At the beginning of 2021, however, normal situation was restored. Although demand was still lower than usual, growth was expected in the coming months. Companies’ estimates indicated a further increase in prices and the number of employees. In April 2021, one in five respondents pointed out labour shortage. Improved confidence of companies was also reflected in the production figures at the beginning of the year.
-6-4-20246810
02 0004 0006 0008 000
10 00012 00014 00016 000
2015 2016 2017 2018 2019 2020*
% y-o-ythousand
Source: Statistics Estonia
Number of employed people and wages
Number of employed peopleAverage wage: production of metal products (euros)Change in the number of employed people (r.s.)Change in wages (r.s.)
-10
-5
0
5
10
0
100
200
300
400
500
2015 2016 2017 2018 2019 2020*
% y-o-ymillion €
Source: Statistics Estonia
Value added, labour costs and productivity
Value addedLabour costsChange in total productivity (r.s.)Change in labour costs productivity (r.s.)
-20
-10
0
10
20
0
20
40
60
80
2015 2016 2017 2018 2019 2020*
% y-o-ymillion €
Source: Statistics Estonia
Investments of companies
Investments in fixed assetsChange in investments (r.s.)
Although total costs were somewhat reduced, this was not sufficient to compensate the decline in sales revenue, and profits, added value and productivity indicators were all poorer than a year ago.
Still, active investments were made in machinery and equipment, accounting for almost 80% of capital formation.
At the beginning of 2021, however, normal situation was restored. Although demand was still lower than usual, growth was expected in the coming months.

51 Economic overview 2020
Ministry of Economic Affairs and Communications • Ministry of Finance 2021
Manufacture of electronic and electrical equipment Manufacture of Estonian electronic and electrical equipment is a sector with a large export share in which the negative impact of the COVID-19 crisis has manifested itself mainly through difficulties in the supply of production inputs and labour problems. On the other hand, the corona crisis has strengthened the trend to return production from China back to Europe in order to make supply chains more local, and Estonia can also benefit from it. In addition to moving out of China, there is another important trend in the market – using smaller but more frequent product batches. Estonian companies can benefit from this trend as well since it requires a great deal of flexibility which our local companies can offer. The future prospects for the electronics and electrical equipment sector are generally good since global trends like the digitalisation of industry, the Internet of Things (IoT) and the development of environmentally friendly technologies are increasing the demand for electronics. There are more than 250 companies operating in the electronic and electrical equipment manufacturing sector. Most of the large companies are production units or production service providers with international capital. Many companies are located in and around Tallinn, but factories further away from the capital also make a significant contribution to the sector’s exports. For example, electronics companies operating in Saare County, Pärnu, Elva, and Ida-Viru County form one of the most important areas of activity in their region. The manufacture of electronic and electrical equipment is divided into two sub-sectors – manufacture of computer, electronic and optical products and manufacture of electrical equipment. The largest companies in the production of computers, electronic and optical equipment are Ericsson Eesti AS (mobile network equipment), Enics Eesti AS (electronic parts for industrial and medical equipment) and FLIR Systems Estonia OÜ (production of thermography systems), and the largest computer manufacturer Ordi OÜ. Contrary to the general trend in this industry, computer sales are mainly focused on the domestic market. The largest company in the field of electrical equipment production is ABB AS, whose main activity is the production of electricity distribution equipment and power generators. Other large companies are Prysmian Group Baltics AS (cable manufacturing), Ensto Ensek AS (electricity distribution equipment and control equipment), AS Konesko (electric motors and equipment), AS Glamox (production of electric lighting equipment) and AS Harju Elekter Elektrotehnika (electrical distribution equipment).
In 2020, the electronics industry was primarily affected by supply difficulties due to the corona crisis, due to which, according to preliminary statistics, the sales revenue of the electronics industry decreased by 2%. Although the demand for electronic products has increased, the capacity to fulfil orders was limited due to component supply problems.
Although the largest share of the sector’s total sales comes from the production of computers, electronic and optical equipment, the share of the production of electrical equipment has increased by almost 10% compared to previous years. In 2020, the production of electrical equipment accounted for 39% of the total sales of the electronics industry. Most of the production of both industries is exported. Exports accounted for 96% of sales of computers, electronic and optical equipment and 86% of sales of electrical
1,6
23,6
92,2
12,9
102,5
0
20
40
60
80
100
120
140
0
20
40
60
80
100
Share in valueadded
Share in man.industryexports
Share ofexports in
sales
Share inemploy-ment
of man.industry
Ratio toaverage wage
(r.s.)
%
Source: Statistics Estonia
Share of sector in economy
In 2020, the electronics industry was primarily affected by supply difficulties due to the corona crisis

52 Economic overview 2020
Ministry of Economic Affairs and Communications • Ministry of Finance 2021
equipment. The sector provides an important contribution to the entire export of the manufacturing sector.
In 2020, the production volume of electronics and electrical equipment manufacturing sector decreased in constant prices by 2%. According to preliminary data, sales revenue and exports in the electronic and electrical equipment manufacturing sector also declined. However, the share of exports of companies in the sector in sales remained high, over 90%, and the share of exports of manufacturing increased slightly. The impact of the coronavirus on the electronics industry was rather modest due to the good supply of production components and an increased demand for certain electronics products. For example, the spread of the virus increased a demand in the production of medical electronics, but at the same time reduced demand in areas related to the production of the means of transport. Exports of computers, electronic and optical equipment fell to 1.1 billion euros and exports of electrical equipment to 0.6 billion euros. Exports of mobile communications equipment continued to account for the largest share of total exports of electronic and electrical equipment, accounting for 40% of the sector’s exports, which was 25% higher than in 2019. Transformers, power distribution equipment and cables were also important export articles, but exports of these product groups decreased compared to the previous year. The largest increase in exports could be seen in various medical devices. In 2018, the largest target market for exports of electronic and electrical equipment was the USA which made up 18% of total exports. By 2020, the share of the USA had risen to 25%, and the export turnover increased by 38% compared to the previous year. Mobile devices accounted for 84% of exports to the United States, with exports growing by 40% year-on-year. The large
-15
-10
-5
0
5
10
0
500
1000
1500
2000
2500
2015 2016 2017 2018 2019 2020*
% y-o-ymillion €
Source: Statistics Estonia
Sales and exports
Sales Exports Change in sales (r.s.) Change in exports (r.s.)
-25
-20
-15
-10
-5
0
5
10
15
2015 2016 2017 2018 2019 2020*
Change in sales by sub-sectors
Manufacture of computers, electronic and optical devices
Manufacture of electrical equipmentSource: Statistics Estonia
%
However, the share of exports of companies in the sector in sales remained high, over 90%.
The impact of the coronavirus on the electronics industry was rather modest due to the good supply of production components and an increased demand for certain electronics products.

53 Economic overview 2020
Ministry of Economic Affairs and Communications • Ministry of Finance 2021
increase in exports is due to the fact that US telecommunications companies are rapidly building 5G networks and the equipment for this is manufactured in Estonia. Larger volumes of electronic and electrical equipment production are also exported to Finland, the portfolio of exported product groups being broader. The largest commodity groups were transformers (20%), power distribution equipment (15%), parts for electric motors and generators (15%) and cables (10%). Although the export turnover to Finland decreased by just 0.4% over the year, its share in total exports decreased by two percentage points to 16%. The other most important export destinations of the electronics industry are also Sweden, Russia and Germany whose export volumes changed by 14%, 10% and -24%, respectively.
Despite the economic problems related to the coronavirus, demand for electronic products has increased. Technological and digital developments are demanding more and more electronics, which means that more and more work needs to be done in the electronics industry. In the conditions of increased demand, the number of employees in the electronic and electrical equipment manufacturing sector increased by 1,700 in 2020, according to the labour force survey. Positive changes took place both in the manufacture of computer, electronics and optical equipment and the production of electrical equipment. Wage growth in the electronics sector remained rather modest in 2020. Compared to the previous year, the average gross monthly salary of the sector increased by 3.5%. The largest increase could be seen in wages of the computer, electronics and optical equipment sub-sector, increasing by 5.7% in a year. In the manufacture of electrical equipment, the average gross monthly salary increased by only 1.4%.
USA25,4%Finland
16,0%
Sweden12,3%
Russia6,2%
Germany6,1%
China3,8% Others
30,2%
Exports by main target countries
Despite the economic problems related to the coronavirus, demand for electronic products has increased.

54 Economic overview 2020
Ministry of Economic Affairs and Communications • Ministry of Finance 2021
Productivity indicators based on added value followed a positive trend. The total productivity of the sector increased by 5% and the productivity of labour costs by 4%. In addition, labour productivity per employed person also increased – by almost 10%. There are many companies in the electronics industry in Estonia that are moving towards higher and higher added value, offering not only production but also participating in product development. The growth of added value is also supported by global trends such as 5G, digitalisation, the Internet of Things (IoT) and green technologies, all increasing the demand for high-tech electronic products.
Due to global uncertainty about the state of the economy because of the coronavirus, corporate investment decreased in 2020. Investments in the
-20-15-10-5051015202530
02468
1012141618
2015 2016 2017 2018 2019 2020*
% y-o-ythousand
Source: Statistics Estonia
Number of employed people and wages
Number of employed peopleAverage wage (in euros)Change in the number of employed people (r.s.)Change in wages (r.s.)
0
2
4
6
8
10
0
200
400
600
800
1000
1200
1400
1600
2015 2016 2017 2018 2019 2020
% vea
Source:Statistics Estonia
Average gross wages
Average wages (in euros) Change (r.s)
-15
-10
-5
0
5
10
15
20
25
050
100150200250300350400450
2015 2016 2017 2018 2019 2020*
% y-o-ymillion €
Source: Statistics Estonia
Value added, labour costs and productivity
Value added
Labour costs
Change in total productivity (r.s.)
Change in labour costs productivity (r.s.)
There are many companies in the electronics industry in Estonia that are moving towards higher and higher added value, offering not only production but also participating in product development.

55 Economic overview 2020
Ministry of Economic Affairs and Communications • Ministry of Finance 2021
electronics industry sector fell by almost 40% over the year. Most of the sector’s investments are made by the computer, electronics and optical equipment manufacturing sub-sector, which decreased its investments by 38% in 2020. Investments in tangible fixed assets of electrical equipment manufacturing companies decreased by 43%. In addition to the uncertainty about the future caused by the corona pandemic, the decline in investment is also affected by the fact that companies do not make large investments themselves but instead lease both the production building and the necessary machinery and equipment.
Year 2020 when the COVID-19 pandemic began, was a difficult one for all sectors. The economic performance of the electronics industry was relatively good, but general economic uncertainty and supply difficulties led to a downturn in the sector. However, the current situation shows an increase in demand for electronic products and the trends are supporting strong growth in demand also in the future. Both the European Union and the United States plan to bring the production of the most important electronic components geographically closer and Estonia has an opportunity to take part in these developments. According to a survey conducted by the Estonian Institute of Economic Research in March 2021, the production volume increased in the production of computers, electronic and optical equipment, and more than half of the companies foresee an increase in production volume in the next 3 months. In addition, bigger export orders and an increase in the number of employees were expected. Orders for the production of electrical equipment also increased and the decline in production volume slowed down on account of increased domestic demand. Nevertheless, an increase in export orders and a moderate increase in the number of employees were forecast for the next 3 months.
-50-40-30-20-1001020304050
0102030405060708090
2015 2016 2017 2018 2019 2020*
% y-o-ymillion €
Source: Statistics Estonia
Investments of companies
Investments in fixed assets
Change in investments (r.s.)
Investments in the electronics industry sector fell by almost 40% over the year.
However, the current situation shows an increase in demand for electronic products and the trends are supporting strong growth in demand also in the future.

56 Economic overview 2020
Ministry of Economic Affairs and Communications • Ministry of Finance 2021
Manufacture of machinery and equipment The production volume of the machinery industry grew rapidly before the global economic crisis, but as a result of the crisis, manufacturers of investment goods, including mechanical engineering, suffered severely in 2009 as well as in 2020 due to the coronavirus. In terms of production volume, the industry recovered from the crisis of 2009 but growth was achieved with a smaller number of employees. The development of the machinery industry is primarily influenced by foreign markets, most of the production is exported.
There are approximately 200 mostly small and medium-sized manufacturers of machinery and equipment in Estonia with a total of approximately 4,000 employees. The largest companies in the machine industry are AS Hekotek (wood processing equipment), OÜ Palmse Mehaanikakoda, Oniar OÜ (forest trailers, log lifts), AS Sami (construction lifts, forest machines), AS Tech Group (production automation equipment, production lines), JTK Power Finmec Estonia AS, AS Rauameister, Stera Technologies AS (handling and lifting equipment and their parts), OÜ PMT (various equipment for the machine industry), Sveba-Dahlen Baltic OÜ (food industry equipment), and Metos AS (catering equipment). However, the sector is dominated by rather small companies. Large companies are located in Tallinn and Harju County, but the machinery industry is represented in almost every region of Estonia.
In compliance with the forecasts, both machinery industry exports and sales to the domestic market will increase in the long run. Due to the higher value added of the sector and the example of developed countries, additional jobs could be created in the machinery industry, but according to the representatives of the sector, production will be greatly affected in the future by automation, which reduces the need for labour.
The output of the machinery industry declined almost throughout 2020, and the number of employed also decreased. At the beginning of 2021, more positive developments could be seen in several industries but in the machinery industry, both the assessments of the situation by companies and the production indicators remained modest.
The entire 2020 was a difficult year for the machinery industry. While in many industries the situation started to improve after the easing of corona restrictions, in the machinery industry the production decreased essentially throughout the entire year. In the year as a whole, production, sales, exports and sales to the domestic market decreased by more than ten percent. Import, export and import prices did not change much during the year.
Of the major export destinations, only sales to Germany increased in 2020 (mainly wind turbines and cranes were behind growth). However, sales increased the most to India which bought parts of lifting and handling mechanisms, packaging equipment and lifts, etc. Sales to the USA that had risen significantly a year earlier dropped in 2020 due to the decline in parcel machine exports. The decline in exports was also characteristic of several other main trading partners, such as Finland, Russia, Sweden and others.
0,7
5,1
81,6
3,7
107,2
0
20
40
60
80
100
120
0
20
40
60
80
100
Share in valueadded
Share in man.industryexports
Share ofexports in
sales
Share inemploy-ment
of man.industry
Ratio toaverage wage
(r.s.)
%%
Source: Statistics Estonia
Share of sector in economy
The entire 2020 was a difficult year for the machinery industry
Of the major export destinations, only sales to Germany increased in 2020.

57 Economic overview 2020
Ministry of Economic Affairs and Communications • Ministry of Finance 2021
The number of employees in the machinery industry decreased every quarter. The total yearly decrease was over 5% according to preliminary data. The number of working hours dropped even more, by more than ten percent. In larger companies, wages remained at the level of the previous year. The companies were able to reduce their expenses proportionally to the decrease in sales revenue, so the profit did not change significantly. Various productivity indicators also remained stable or even improved slightly.
-15
-10
-5
0
5
10
15
20
0
100
200
300
400
500
600
2015 2016 2017 2018 2019 2020*
% y-o-ymillion €
Source: Statistics Estonia
Sales and exports
Sales Exports Change in sales (r.s.) Change in exports (r.s.)
0 5 10 15 20 25 30 35
China
India
Poland
USA
Sweden
Germany
Russia
Finland
Source:Statistics Estonia
%
Exports by main target countries
2020 2019
-6
-4
-2
0
2
4
6
8
0500
1 0001 5002 0002 5003 0003 5004 0004 500
2015 2016 2017 2018 2019 2020*
% y-o-ythousand
Source: Statistics Estonia
Number of employed people
Number of employed people (labour survey data)Number of employed people (business statistics)Change in number of employed people (r.s.)Change in number of employed people in companies (r.s.)
The number of employees in the machinery industry decreased every quarter. The total yearly decrease was over 5% according to preliminary data.

58 Economic overview 2020
Ministry of Economic Affairs and Communications • Ministry of Finance 2021
Similarly to other indicators, the machinery industry was characterised by a decline also in investments. Pursuant to short-term statistics, investments decreased by more than a third in 2020. The decline was mainly due to machinery and equipment, which accounted for half of all investments. Significantly less funds were also allocated to buildings than a year earlier.
The worse performance of the machinery industry in 2020 was also reflected in the assessments of companies. Representatives of the sector interviewed by the Estonian Institute of Economic Research pointed out other problems in addition to low demand, such as labour shortages and more specific issues that were probably caused by the coronavirus. While the situation in several industries improved in the second half of the year and in 2021, the confidence indicator in the machinery industry remained below the usual level and the production volume is yet to increase.
-12-10-8-6-4-20246
020406080
100120140160180
2015 2016 2017 2018 2019 2020*
% y-o-ymillion €
Source: Statistics Estonia
Value added, labour costs and productivity
Value added
Labour costs
Change in total productivity (r.s.)
-60
-40
-20
0
20
40
60
80
0
5
10
15
20
25
30
2015 2016 2017 2018 2019 2020*
% y-o-ymillion €
Source: Statistics Estonia
Investments of companies
Investments in fixed assets
Change in investments (r.s.)
Similarly to other indicators, the machinery industry was characterised by a decline also in investments.
While the situation in several industries improved in the second half of the year and in 2021, the confidence indicator in the machinery industry remained below the usual level and the production volume is yet to increase.

59 Economic overview 2020
Ministry of Economic Affairs and Communications • Ministry of Finance 2021
Manufacture of means of transport The production of means of transport depends primarily on foreign demand, most of the sector’s sales are exports. As a result of the economic crisis, both domestic sales and exports fell sharply in 2009, but this was followed by a rapid recovery. The corona crisis of 2020 also led to production interruptions in the world and it affected Estonian industrial enterprises.
There are more than 150 companies manufacturing transport equipment in Estonia. The largest of them are AS Norma (car safety systems, seat belts), Stoneridge Electronics AS (electronic equipment for the car industry), AS Fors MW (forest trailers and hoists), AS Respo Trailers, OÜ Birger and AS Bestnet (trailers), OÜ Tarmetec (car accessories), PKC Eesti AS (cable ties for the automotive industry), Universal Industries OÜ (silencers), Baltic Workboats AS (workboats) and AS Luksusjaht (plastic yachts and scooters). Many shipbuilding or repair companies are reflected in the repair of machinery and equipment, for example several subsidiaries of BLRT Grupp AS. Larger companies are mainly concentrated in Tallinn and Harju County (two thirds of the sector’s employees), Tartu County and Saare County also stand out.
According to long-term forecasts, export volumes will increase sales in the future, and the role of the domestic market is modest. The increase in production volume is due to the increase in productivity, as the shortage of skilled labour and the boost of labour costs force us to focus on more expensive products.
In the production of transport vehicles, the spread of the coronavirus in 2020 led to interruptions in the automotive industry and the production of motor vehicles and their parts also decreased heavily in Estonia. At the end of the year, however, the developments became more positive and the outlook for 2021 is also better.
The production of means of transport decreased by one tenth in 2020, mainly due to the import of motor vehicles, their parts and trailers. European car factories temporarily suspended work in the spring due to logistical problems. Production of motor vehicles and trailers halved in April, but the year ended with strong growth. This was partly due to a lower benchmark because production declined in the second half of 2019. In the production of other means of transport, production decreased by a few percent but there was also a notable drop in sales. In both sub-sectors of transport production, producer prices remained stable, export prices increased by about 1% during the year.
Out of the main export commodity groups, sales of motor vehicle parts decreased by more than a tenth in 2020, while sales of trailers increased. Various ships and floating structures were exported less than a year earlier; only sales of yachts, boats and canoes to foreign markets increased slightly. Out of the main target markets, sales to Sweden decreased but it was largely due to the sale of a single ship a year earlier. Sales of motor vehicle parts also decreased, while exports of seat belts increased, and more trailers were sold to Sweden. The German export figure was also mostly affected by some ship transactions in 2019 which resulted in lower sales in 2020. Sales of
0,5
5,0
82,5
3,8
94,3
0
20
40
60
80
100
120
0
20
40
60
80
100
Share in valueadded
Share in man.industryexports
Share ofexports in
sales
Share ofemploy-ment
in man.industry
Ratio toaverage wage*
%%
* Production of motor vehicles and trailers
Source: Statistics Estonia
Share of sector in economy
The production of means of transport decreased by one tenth in 2020, mainly due to the import of motor vehicles, their parts and trailers.

60 Economic overview 2020
Ministry of Economic Affairs and Communications • Ministry of Finance 2021
motor vehicle parts (such as silencers) to Germany decreased as well, while exports of motor boats and electric bicycles increased. Thanks to trailers, sales increased to Finland.
Despite a difficult year, short-term statistics showed that additional people were employed in both transport sub-sectors. The number of persons employed in the manufacture of motor vehicles, their parts and trailers increased by 5%, the number of working hours remained the same.
-20-15-10-50510152025
0
100
200
300
400
500
600
2015 2016 2017 2018 2019 2020*
% y-o-ymillion €
Source: Statistics Estonia
Sales and exports
Sales Exports Change in sales (r.s.) Change in exports (r.s.)
0 5 10 15 20 25 30
Latvia
UK
Germany
The Netherlands
Czech Republic
Norway
Finland
Sweden
Source: Statistics Estonia
%
Exports by main target countries
2020 2019
Parts and accessories of motor vehicles
39%
Motor vehicles for the transport of goods
7%
Trailers and semi-trailers
35%
Yachts and boats8%
Floating structures
9%Other boats
2%
Main export commodity groups
Source: Statistics Estonia
Out of the main target markets, sales to Sweden decreased but it was largely due to the sale of a single ship a year earlier.

61 Economic overview 2020
Ministry of Economic Affairs and Communications • Ministry of Finance 2021
However, the number of employees in the production of other means of transport increased by 15%, which meant more than 100 additional jobs considering the size of the branch.
In the manufacture of motor vehicles, wage growth in larger companies with at least 50 employees continued to be quite rapid (over 6%). Although other costs decreased, this was not sufficient to balance the decrease in sales, reducing the profits. However, in the production of other means of transport costs also increased, leading to a decrease in profits and productivity, but it is likely that the data will be significantly revised when the final statistics will be available.
According to preliminary data, investments of motor vehicle manufacturing companies decreased by one fifth in 2020. Investments were withdrawn in almost all areas. Purchase of machinery and equipment (more than half of investments) and capital investments in buildings (more than a quarter) had a greater impact. For other means of transport, short-term statistics show increased investments, but final statistics show that volumes have been many times higher than initially estimated, so no conclusions can yet be drawn.
-10
-5
0
5
10
15
0500
1 0001 5002 0002 5003 0003 5004 0004 500
2015 2016 2017 2018 2019 2020*
% y-o-y
Source: Statistics Estonia
Number of employed people and wages
Number of employed peopleAverage wage: production of motor vehicles (in euros)Change in the number of employed people (r.s.)Change in wages (r.s.)
-20
-15
-10
-5
0
5
10
0
20
40
60
80
100
120
140
160
2015 2016 2017 2018 2019 2020*
% y-o-ymillion €
Source: Statistics Estonia
Value added, labour costs and productivity
Value addedLabour costsChange in total productivity (r.s.)Change in labour costs productivity (r.s.)
In the manufacture of motor vehicles, wage growth in larger companies with at least 50 employees continued to be quite rapid.
Investments were withdrawn in almost all areas.

62 Economic overview 2020
Ministry of Economic Affairs and Communications • Ministry of Finance 2021
While in 2020 production was stopped in many parts of the world, by 2021 the demand for means of transport had recovered, but the availability of several (electronic) components has become a new problem. In Estonia, the production of motor vehicles (parts) and trailers increased at a fairly fast pace. In the production of other means of transport production was declining but due to the small size of the branch, production is very irregular and in the year as a whole, it is likely that positive developments can be expected in this field.
-30-20-1001020304050
0
5
10
15
20
25
2015 2016 2017 2018 2019 2020*
% y-o-ymillion €
* Investment in production of other means of transport is partly covered by short-term statistics in the reference period, so growth is rather overpriced…
Investments of companies
Investments in fixed assets
Change in investments (r.s.)
While in 2020 production was stopped in many parts of the world, by 2021 the demand for means of transport had recovered, but the availability of several (electronic) components has become a new problem.

63 Economic overview 2020
Ministry of Economic Affairs and Communications • Ministry of Finance 2021
Manufacture of furniture Over 700 companies are involved in manufacture of furniture in Estonia, employing nearly 8,000 people. The furniture industry is a sector with long traditions in Estonia, being an important employer in rural areas and helping add value to domestic raw produce. The largest furniture companies by the number of employees are mainly located in northern and south-eastern Estonia. The largest furniture manufacturers in 2018 were manufacturers of soft furniture OÜ Fleming, AS Bellus Furniture and Antsla Inno AS, office furniture manufacturer AS Standard, furniture parts manufacturer Flexa Eesti AS, wooden furniture manufacturer Gomab OÜ and the primarily bedroom fittings manufacturer OÜ Delux. The furniture industry has enjoyed good recent years, as the purchasing power of the domestic market has increased and lowered the pressure to export. Nonetheless, export has been grown as well. Estonia has no advantage in mass production but smaller batches and fast supply help keep the sector competitive.
The pandemic and the logistics problems caused by it also left its mark on the furniture industry. Both exports and the domestic market dropped.
Furniture exports have been relatively weak for years. At the same time, the domestic market has remained strong and maintained the sales. This may become even more difficult in the coming years when a full-sized IKEA will open its doors and may win several local buyers over to prefer imported furniture. The most important markets for furniture production are the Nordic countries, where the market is known and people are able to recognise the design. What is more, several Finnish and Swedish furniture manufacturers have production located in Estonia. The share of these two countries in exports was 58%. If Denmark and Norway are added, the share of the Nordic countries in exports reached 72%. Exports to the three largest destination countries decreased in 2020, with the largest decline to Denmark which dropped by a third. Of the larger partners, exports to Germany increased by 20%. Since this is a large market, it is a good sign for the future. Of the larger commodity groups, exports of wooden frame seats decreased by 11% and exports of bedroom furniture by 14%. At the same time, exports of spring mattresses increased by 16% and exports of foam rubber mattresses by 19%.
0,6
4,0
57,1
6,7
77,3
0
20
40
60
80
100
Share in valueadded
Share in man.industryexports
Share ofexports in
sales
Share inemploy-ment
of man.industry
Ratio toaverage wage
%
Source: Statistics Estonia
Share of sector in economy
Exports may become even more difficult in the coming years.

64 Economic overview 2020
Ministry of Economic Affairs and Communications • Ministry of Finance 2021
Pursuant to preliminary data, the number of employed in the sector decreased by 12 percent in 2020. The average wage grew slightly slower than the national average and the gap with the Estonian average wage worsened. Although general unemployment in the country increased, such a lag from the Estonian average makes it increasingly difficult for the furniture industry to find employees. The furniture industry managed to significantly improve its efficiency in 2020. Cheap raw materials and drastic staff reductions led to the best profits in recent years and improved efficiency ratios. Profit increased by 53% year-on-year and the labour cost productivity by 12%.
-15
-10
-5
0
5
10
15
0
100
200
300
400
500
600
2015 2016 2017 2018 2019 2020*
% y-o-ymillion €
Source: Statistics Estonia
Sales and exports
Sales Exports Change in sales (r.s.) Change in exports (r.s.)
0 10 20 30 40
Lithuania
Norway
Germany
Denmark
Sweden
Finland
Source: Statistics Estonia
%
Exports by main target countries
2020 2019
Seats34%
Parts of furniture
17%Living and dining room
furniture12%
Wooden kitchen furniture3%
Wooden bedroom furniture
15%
Other furntiture19%
Main export commodity groups
Source: Statistics Estonia
The share of the Nordic countries in exports reached 72%.

65 Economic overview 2020
Ministry of Economic Affairs and Communications • Ministry of Finance 2021
In conformity with the preliminary data, investment activity in the furniture industry increased by 31% in 2020. However, investment statistics in the sector are rather volatile and may be considerably revised later. Investment in means of transport and computer systems increased, but investment in machinery and equipment decreased, taking up 30% less than the year before. The results of a survey by the Estonian Institute of Economic Research suggested that in the spring of 2021, furniture industry companies were fairly more positive than a year earlier. 40% of the respondents had more export orders than usual and 81% of the production capacity was in use, which was the highest level in recent years. No one planned to reduce the number of employees.
-15
-10
-5
0
5
10
0
2 000
4 000
6 000
8 000
10 000
2015 2016 2017 2018 2019 2020*
% y-o-y
Source: Statistics Estonia
Number of employed people and wages
Number of employed peopleAverage wage (in euros)Change in the number of employed people (r.s.)Change in wages (r.s.)
-10
-5
0
5
10
15
20
020406080
100120140160180200
2015 2016 2017 2018 2019 2020*
% y-o-ymillion €
Source: Statistics Estonia
Value added, labour costs and productivity
Value addedLabour costsChange in total productivity (r.s.)Change in labour costs productivity (r.s.)
-40-30-20-1001020304050
0
5
10
15
20
25
30
35
2015 2016 2017 2018 2019 2020*
% y-o-ymillion €
Source: Statistics Estonia
Investments of companies
Investments in fixed assets
Change in investments (r.s.)
The furniture industry managed to significantly improve its efficiency in 2020.
The average wage grew slightly slower than the national average and the gap with the Estonian average wage worsened.
In the spring of 2021, furniture industry companies were fairly more positive than a year earlier.

66 Economic overview 2020
Ministry of Economic Affairs and Communications • Ministry of Finance 2021
The construction sector It is characteristic of the construction sector that carrying out of a construction project is a long-term process and it can take years from the planning of a building to the start of construction work. Construction is also cyclical, influenced by many factors such as business and consumer confidence, general economic development, access to credit and interest rates, government programs, and so on. For these reasons, the construction sector normally reacts to macroeconomic change with some delay. For the construction sector, 2020 was a year of uncertainty and unpredictability due to the restrictions imposed by the COVID-19 virus on most of the industrial sector. When the state of emergency was declared, several private sector development projects were suspended. Most of them were continued in the summer months as the situation eased. The supplementary budget provided additional appropriations to alleviate the crisis related to the spread of COVID-19, and the volume of public construction investments was not reduced due to the pandemic. On the contrary, additional allocations of around EUR 100 million were made for housing reconstruction measures distributed through Kredex. In the private sector, the start of new projects was postponed due to economic uncertainty, especially in the housing sector where the postponed investment led to a temporary shortage of new housing on the market. The increased use of home offices due to the restrictions has raised questions about starting new office building development projects since the persistence of demand for office space even after the pandemic has subsided is unclear. At the same time, good liquidity and favourable financing conditions for developers support the decision to complete the projects started before the pandemic. It is worth noting that in 2020 the number of building permits and operating permits issued increased. On this basis, it can be concluded that the activity of the construction sector remains high and volumes recover rapidly as the virus recedes. Due to restrictions on cross-border labour movements because of the COVID-19 virus, in particular the introduction of testing and quarantine requirements, the share of foreign labour in the construction sector decreased. According to Statistics Estonia, the growth of the payroll in the construction sector stopped, employment decreased, but the average wage continued to rise, remaining below the average wage growth in Estonia. Cross-border restrictions also had a negative impact on construction exports.
According to Statistics Estonia, the sales revenue of the construction sector decreased by 4.9% in 2020 compared to the previous year, while the total profit increased. Construction volumes, value added and employment declined somewhat, but construction prices showed a slight growth. Pursuant to Statistics Estonia, investments in tangible fixed assets increased by 5%. Since the input prices fell temporarily due to the crisis, the year turned out to be profitable for companies in the sector. The share of construction work performed abroad increased by 1.5 percentage points, accounting for 5% of all construction work performed. In 2020, the number of employees in the construction sector decreased and the wage growth was marginal, falling below the national average wage growth.
The volumes of the construction sector decreased by about 3.5% in 2020, being 154 million euros less in real terms than in 2019. The turnover of the construction sector in Estonia was 4.495 billion euros which exceeded the pessimistic expectations caused by the pandemic. While the turnover of construction was forecast to decrease by 5–6% in 2020, the actual result turned out to be a positive surprise. Although the turnover of the sector decreased, according to the building permits and use permits statistics, the construction volumes in the construction of residential buildings increased
6,4 9,2
94,3
0
20
40
60
80
100
Share in GDP Share in employment Ratio to average wage
%
Source: Statistics Estonia
Share of sector in economy
Construction volumes, value added and employment declined somewhat, but construction prices showed a slight growth.

67 Economic overview 2020
Ministry of Economic Affairs and Communications • Ministry of Finance 2021
in 2020, the number of construction permits for new dwellings increased by 10% and the number of dwellings authorised for use by 8%. The number of non-residential buildings authorised for use increased by 15.7% and the number of building permits decreased by 4.1%. Together with the real estate sector, the construction sector remained in third place in terms of employment, lagging behind only the manufacturing industry and wholesale and retail sale. The share of employment in the construction sector alone was 9% of all employees and together with the real estate sector it was 11%. According to a labour force survey, the construction sector employed a total of more than 60,000 people and according to business statistics, the number was 44,000 people (flash estimate). According to the Estonian Tax and Customs Bard, in the last quarter of 2020, more than 52,000 workers were legally employed in the construction sector. Based on this data, it can be stated that in 2020 the construction sector employed almost 50,000 people. There are no exact statistics on the number of persons employed abroad, but based on the data of the labour force survey and the business statistics, it can be stated that the number of employees in the construction sector abroad is around 8,000–10,000 people. The assessment of the labour force survey also includes Estonian labour force operating abroad, which is why employment is also affected by the construction markets of the destination countries of labour migration. According to statistics compiled by the Police and Border Guard Board, in 2020, 296 residence permits were issued for work in the field of construction (372 in 2019) and 7,626 short-term employments were registered (10,888 in 2019). Although the data of the labour force survey does not show a decrease in the number of the employed, according to the PBGB, the number of employed in the construction sector decreased by 3.6%. According to business statistics, this number is 5.1%. According to the labour market survey carried out by Eesti Pank in 2021, the number of employees recruited from outside the European Union in construction decreased by 30%. The decline in employment in construction started already in the second half of 2019, and during the coronavirus crisis, employment was hampered by the suspension of development projects and putting constructions on hold. Labour demand in construction may increase in 2021 because the employment expectations of construction employers in confidence surveys have improved drastically since the fourth quarter of 2020.
Eesti Pank’s review of the labour market shows that the time lag in the economic downturn and the decline in employment was quite short, which may have been due to the specifics of the crisis. In the second half of the year, economic activity picked up, but without an equivalent increase in employment, which meant that value added per employee exceeded the level of the previous year in the second half of the year. Since the decline in
-8
-6
-4
-2
0
2
4
6
0
10 000
20 000
30 000
40 000
50 000
60 000
70 000
2015 2016 2017 2018 2019 2020*
% y-o-y
Source: Statistics Estonia
Number of employed people
Number of employed people (labour force survey)Number of employed people (business statistics)Change in no of employed people (labour force survey, r.s.)Change in no of employed people (business statistics, r.s.)
Wage support measures and the reduction in the share of short-term foreign labor have made it possible to maintain employment.
The time lag in the economic downturn and the decline in employment was quite short

68 Economic overview 2020
Ministry of Economic Affairs and Communications • Ministry of Finance 2021
turnover in the construction sector turned out to be lower than expected, companies were able to maintain the core of their employees and ensure a good starting position in reducing the effects of the pandemic. In construction, as in the wider manufacturing industry, most workers have company-specific skills and are expensive to recruit afterwards after a temporary drop in demand. Therefore, the temporary workforce is let go first. Due to wage pressures due to labour shortages, unit labour costs in construction had increased significantly before the pandemic, and the suspension of construction projects led to a sharp slowdown in wage growth and a decline in employment. In the construction sector, the growth of labour costs which started in 2017, exceeded 10% and stopped in 2020 remained at the same level throughout the year (0.4% growth compared to the previous year). The recovery in construction volumes will be accompanied by an increase in the need for labour, which in turn will increase the pressure to increase wages. In 2020, the difference between the average salary in Estonia and the average salary in the construction sector somewhat increased, the gross monthly salary in the construction sector increased to 1365 euros (growth of 0.7%), while the Estonian average increased to 1448 euros (growth of 2.9%).
According to Statistics Estonia’s short-term estimate, in 2020, construction work was performed in Estonia in the total amount of current prices of 4,495 million euros. The volume of self-performed work in Estonia was 3,011 million euros, decreasing by 5.7%. According to a short-term estimate, the share of construction work performed abroad accounted for 4.6% of all construction volumes, increasing by 1.5 percentage points year-on-year. The reason for the decrease in the volume of construction work performed abroad was mainly the restrictions to cross-border movement.
0
2
4
6
8
10
0200400600800
1 0001 2001 4001 600
2015 2016 2017 2018 2019 2020
% y-o-yEUR
Source: Statistics Estonia
Wages
Average wage (Estonian avg)
Average wage (construction)
Change in wages(avg, r.s.)
-5
0
5
10
15
20
25
30
0500
1 0001 5002 0002 5003 0003 5004 0004 500
2015 2016 2017 2018 2019 2020*
million € % y-o-y
Source: Statistics Estonia
Construction works performed by own resources
Construction in foreign countriesConstruction in Estonia (at current prices)Change in construction in Estonia (r.s.)
The recovery in construction volumes will be accompanied by an increase in the need for labour, which in turn will increase the pressure to increase wages.
The average wage in the sector increased marginally, but not at the same pace as the national average.

69 Economic overview 2020
Ministry of Economic Affairs and Communications • Ministry of Finance 2021
The construction price index increased by 0.4% in 2020, which is similar to the growth in 2014 and 2015 but considerably lower than in 2017–2019 (1.5–1.9%). Of the price components, the price of construction machinery increased the most by 1.5%, construction materials by 0.5% and labour by 0.1%. The reason for such a modest increase in the labour and construction materials price index was the decrease in construction volumes due to the pandemic. The biggest challenge in 2021 will be the rise in the prices of construction materials and raw materials in general, which will also affect the prices of construction machinery. Once the construction volumes reach the level of 2019, the wage pressure on labour will also increase, which is why it can be predicted that the increase in construction prices in 2021 will reach the level of 2019.
According to preliminary data, the profits of construction companies increased by one tenth, but the final statistics may adjust the figures. The net added value of the construction sector decreased by 5.0% over the year. The construction sector accounted for approximately 6.4% of the value added of the total economy. Productivity in the construction sector, both in terms of labour costs and employment, returned to growth after a small decline in 2018. According to short-term statistics, labour productivity, i.e. value added per employee, was 21,400 euros in 2020 (final figures are usually significantly higher), staying at the previous year’s level. The average value added per employee in the European Union countries in 2018 (latest EU comparison data) was 42,000 euros, i.e. the level of productivity in Estonia is 60% compared to the EU average. In the Nordic countries, the corresponding productivity indicator per employee is about 55,000–80,000 euros, i.e. 2–3 times higher than the productivity of the Estonian construction sector.
-10-505101520253035
-1
-1
0
1
1
2
2
3
2015 2016 2017 2018 2019 2020*
% y-o-y% y-o-y
Source: Statistics Estonia
Developments in the construction sector
Construction price index (left scale)Construction volume index of buildings (r.s.)Construction volume index of facilities (r.s.)
-5
0
5
10
15
0
5
10
15
20
25
30
35
2015 2016 2017 2018 2019 2020*
thousand € % y-o-y
Source: Statistics Estonia
Labour productivity
Labour productivity on the basis of value added
Change in labour productivity (r.s.)
The construction price index increased by 0.4% in 2020, which is considerably lower than in 2017–2019.

70 Economic overview 2020
Ministry of Economic Affairs and Communications • Ministry of Finance 2021
The investment activity of construction companies increased in 2019 and the volume of investments continued to increase in 2020 as well. According to short-term statistics, 5% was invested in tangible fixed assets in 2020. It can be estimated that 2017–2020 will be the high point of investments into fixed assets in the construction sector. Opportunities for making investments are found in economically favourable conditions in which the earned profit is used as self-financing and the interest rate is favourable when raising capital. Investment in construction machinery is encouraged by the rising labour costs and competition in the construction market that threatens profitability. Since real estate development has been profitable so far, several construction companies have acquired properties suitable for development and started their development projects.
In 2020, building permits were issued for 8,833 (in 2019 – 8,025) new dwellings and 2,584 (in 2019 – 2,233) non-residential buildings. Permits for use were granted for 7,579 (in 2019 – 7,014) dwellings and 1,352 (in 2019 – 1,410) non-residential buildings, respectively. The total closed net area in residential buildings that received a building permit was 747,900 (in 2019 – 694,800) square metres and in approved residential buildings 707,600 (in 2019 – 658,300) square metres. The total closed net area in non-residential buildings that received a building permit was 1,312,000 (in 2019 – 947,800) square metres and in non-residential buildings approved for use 927,300 (in 2019 – 679,800) square metres. The number of building permits issued for the construction of dwellings increased by 10% and the number of building permits by 8%. In the case of non-residential premises, the growth was 15.7% in the case of building permits and the number of permits for use decreased by 4.1%. In the case of both dwellings and non-dwellings, the number of building permits and the closed net area increased year-on-year. According to a report on the procedures at the information portal of the Building Register, the number of building permits and notifications was on the rise. When in 2018, the number of buildings was 18,058, then in 2019 it was 20,776 and in 2020, 24,945. The data of the Building Register reflects
-10
-5
0
5
10
15
20
0
50
100
150
200
250
2015 2016 2017 2018 2019 2020*
million € % y-o-y
Source: Statistics Estonia
Investments of companies
Investments in fixed assets Change in investments (r.s.)
0
100
200
300
400
500
600
700
800
-20
-10
0
10
20
30
40
2015 2016 2017 2018 2019 2020
thousand m2%
Source: Statistics Estonia
Granted building permits and completed dwellings area (new construction)
The area of completed dwellings (r.s.)The area of dwellings in construction (r.s.)Change in completed dwellings (l.s.)Change in dwellings in construction (l.s.)
According to short-term statistics, 5% more than in 2019 was invested in tangible fixed assets in 2020.
Uncertainty in the global economy, including Estonian export markets, has a negative impact on the export of construction services.

71 Economic overview 2020
Ministry of Economic Affairs and Communications • Ministry of Finance 2021
new buildings but the trend is obvious. In 2020, the number of building permits and notifications submitted to the Building Register increased by 20%, which indicates an increase in construction activity and, in particular, an increase in the volume of reconstruction of existing buildings.
For 2021 it can be estimated that the waves caused by the seasonality of the COVID-19 virus will bring short-term fluctuations to the construction sector. During the peak period of the virus, investments will be postponed due to uncertainty, which leads to an accumulation of demand, which in turn leads to a rapid increase in volumes as the virus recedes. This in turn creates short-term labour shortages and raises the construction prices. The main warning sign in the construction market in the first half of 2021 is the increase in the prices of construction materials, which may cause problems in performing long-term contracts concluded in 2020 at lower input prices.

72 Economic overview 2020
Ministry of Economic Affairs and Communications • Ministry of Finance 2021
Domestic trade The trade sector includes retail and wholesale trade enterprises, including companies engaged in the sale of motor vehicles and their spare parts, i.e. motor vehicle dealers. Trade generates 13.2% of the value added of the entire economy and employs 82,000 people in 17,000 companies. The major retail companies in Estonia are Coop (which includes Maksimarket, Konsum, A&O), Maxima Eesti OÜ, Tallinna Kaubamaja Grupp AS (Kaubamaja AS, Selver, Kia Auto AS, Viking Motors AS), AS Prisma Peremarket, Rimi Eesti Food AS (Rimi), AS OG Elektra and RRLektus AS (Meie Toidukaubad). There is intense competition between companies and all market participants try to increase their market share each year. Domestic trade has been growing rapidly for several years in a row. Both the physical retail space and the volume of e-shops are increasing.
Despite high volatility, 2020 was a successful year for retail companies whose sales increased by 2.8%. At the same time, the sales of wholesale companies decreased by one fifth. The turnover of vehicle sale companies also decreased by the same amount.
Year 2020 was turbulent in Estonia’s domestic trade. In the spring, all shopping centres were closed for several months and only grocery stores remained open. This led to a shopping boom just before the closures and a rapid increase in the use of online commerce. Therefore, despite everything, retail sale was able to show growth compared to the previous year. The turbulent times also meant several changes to plans. For example, Lidl was forced to postpone the opening of its stores for about a year. There has been a lack of a chain like Lidl on the Estonian market for some time now since the other discounter-type stores have not been able to gain a larger market share. In terms of the number of stores, Coop is the largest store chain in Estonia, with 330 stores and 6,000 employees as at 2021. The chain’s turnover amounted to over 700 million euros, which gave it a 24.5% market share in Estonia. During the year, the net turnover of the chain’s stores increased by 63 million euros. In terms of turnover, the largest retail company is Tallinna Kaubamaja Grupp, of which sales in 2020 amounted to 742 million euros. The group includes the Selver chain, several car sales companies in Estonia and other Baltic countries, and department stores in the city centre of Tallinn and Tartu. 4,500 employees work there. The acquisition of Comarkets contributed to the growth of Kaubamaja in 2020. The Maxima chain, which also employs more than 4,000 people and has a turnover exceeding 600 million euros, is not far behind. In addition to the well-known OG Elektra, Prisma and Rimi, there is also a retail chain in the market, for example, owned by RRLektus, using the ‘Meie’ (‘Our’) brand with more than 60 stores.
13,2 12,63,2
82,0
0
20
40
60
80
100
Share in valueadded
Share inemployment
Share in exportsof services
Ratio to averagewage
%
Source: Statistics Estonia
Share of trade sector in Estonian economyDespite the closures, the retail sector showed growth.
In 2021, Lidl will open its first stores, and in 2022, a new full-scale IKEA will be opened.

73 Economic overview 2020
Ministry of Economic Affairs and Communications • Ministry of Finance 2021
Large shopping centres were no longer opened in 2020. The crisis was rather used as a chance for refreshment. The construction of Porto Franco is also drawn out. In 2022, the opening of a new full-scale and eagerly awaited IKEA is expected in Kurna, Rae municipality.
In 2020, wages in the trade sector decreased by almost one tenth. According to business statistics, the number of the employed persons decreased by 3.7%, but pursuant to the labour force survey, the number was 4.3%. At that, the number of hours worked increased by 5.2%, indicating a smaller workload for employees. By subsectors, employment decreased in retail sale by 2% and in wholesale trade by 7%. Employment in the vehicle trade did not change. Based on productivity indicators, the year was good for the sector. The decrease in labour costs by 5% resulted in a 9% increase in total profit to 834 million euros.
-25
-20
-15
-10
-5
0
5
10
15
20
0
5
10
15
20
25
2015 2016 2017 2018 2019 2020*
% y-o-ybillion €
Source: Statistics Estonia
Sales revenue at current prices
Trade in vehiclesWholesale tradeRetail tradeChange in turnover, companies trading in vehicles (r.s.)Change in turnover, wholesale companies (r.s.)Change in turnover, retail companies (r.s.)
Food products33%
Alcoholic beverages, tobacco products
9%
Clothing, fabrics, footwear
6%
Motor vehicles, spare parts, motor fuel 15%
Other goods37%
Share of retail trade by commodity groups
Source: Statistics Estonia
In 2020, wages in the trade sector decreased

74 Economic overview 2020
Ministry of Economic Affairs and Communications • Ministry of Finance 2021
In 2020, the sales period of inventories increased by 3 days to 43 days compared to the previous year. At the same time, the trade mark-up increased from 19% to 23%. The largest mark-up was in retail sale, reaching 30%, and the lowest in vehicle trade (13%). Pursuant to the preliminary data, investments in the trade sector decreased by 13% in 2020. However, short-term investment statistics in the sector are very volatile. For instance, the final figure for 2018 was approximately 120 million euros higher and for 2019, 100 million euros higher than the short-term statistics. Thus, there is a possibility that this number will also be adjusted upwards. One third of investments were made in machinery and equipment, and the volume of these investments increased by 13%. At the same time, 59% more funds were invested in computer systems than the year before.
-5-4-3-2-1012345
0102030405060708090
100
2015 2016 2017 2018 2019 2020*
% y-o-ymillion €
Source: Statistics Estonia
Number ofpeople employed in trade
Number of employed people (labour survey)Number of employed people (business statistics)Change in no of employed people (labour survey, r.s.)Change in no of employed people (business statistics, r.s.)
-15
-10
-5
0
5
10
15
0
200
400
600
800
1 000
1 200
1 400
2015 2016 2017 2018 2019 2020
% y-o-y
Source: Statistics Estonia
Wages in trade sector
Average wage (in euros) Change in wages (r.s.)
-15
-10
-5
0
5
10
15
20
0
500
1 000
1 500
2 000
2 500
3 000
2015 2016 2017 2018 2019 2020*
% y-o-ymillion €
Source: Statistics Estonia
Value added, labour costs and productivity
Value addedLabour costsChange in labour productivity (r.s.)Change in labour costs productivity (r.s.)

75 Economic overview 2020
Ministry of Economic Affairs and Communications • Ministry of Finance 2021
Retail For retail companies, 2020 was more successful than 2019. In total, retail sales increased by 0.9%. The crisis led to uncertainty about the future and several consumption decisions were postponed. Partly because of this, deposits of Estonian resident households increased by 1.2 billion euros over the year. The fact that travelling was limited also played its part, leaving more money in the Estonian economy. In 2020, the total retail turnover in Estonia was 7.3 billion euros, of which vehicle trade accounted for 0.6 billion euros. Retail sales of household goods, household appliances, hardware and construction materials increased by 11% in a year. Despite the restrictions, the growth of e-commerce was rather modest – online sales increased by 7%. At the same time, goods sold in online shops of local stores are excluded from this calculation and the stores are grouped in their respective segments. The clothing trade experienced a sharp decline, with sales dropping by 16% in a year. Sales of motor fuel also decreased by 14%. On the one hand, road traffic decreased significantly during quarantine, but on the other hand, the price of fuel was also cheaper. Efficiency indicators in retail sale improved in 2020. Sales grew faster than costs and, unlike in previous years, there was no problem of the too rapid growth of labour costs. As a result, the sector managed to increase profits by more than a third to almost a quarter of a billion euros. Net added value also increased by almost 9%. The year 2020 was diverse in retail sale. Although part of the time the shops were closed, both the sales and profit increased year-on-year. It is safe to say that for those who survived the hard times, the year was a success. The year 2021 started similarly to the previous one for the sector. For almost a month, all stores were closed except for grocery stores and other convenience stores. It is difficult to predict how the year will end. Since the labour market showed more signs of recovery in the spring of 2021 and the crisis has not affected most sectors (except tourism), 2021 may also prove to be a success for the sector.
-15
-10
-5
0
5
10
15
20
25
30
0
100
200
300
400
500
2015 2016 2017 2018 2019 2020*
% y-o-ymillion €
Source: Statistics Estonia
Investments of companies
Investments in fixed assets Change in investments (r.s.)
Investments fell.
Now all major retail chains have their own e-shop and people are using this opportunity more and more.

76 Economic overview 2020
Ministry of Economic Affairs and Communications • Ministry of Finance 2021
Tourism The share of the tourism economy in Estonia’s GDP and employment is approximately 7–8%, considering the indirect effect, tourism makes a powerful contribution to export revenue. The Estonian tourism industry relies heavily on foreign visitors who normally account for more than 60% of all overnight stays in accommodations, but the coronavirus changed the situation in 2020. A huge part of foreign visitors (15%) are Finnish one-day visitors, while the number of visitors from other countries has increased at a faster pace and the dependence on the Finnish market has decreased.
The main tourist magnet is Tallinn, where a large part of tourism companies are concentrated. Year by year, interest in other regions has also grown – this has been facilitated by the addition of rehabilitation centres, accommodation and other service companies.
There are more than 900 accommodation establishments in Estonia (in addition to a large number of self-employed persons and enterprises whose main activity is another, as well as private accommodation providers), there are more than 2,000 catering establishments and about 300 travel agencies and tour operators. The largest accommodation companies are OÜ TLG Hotell (Tallink), AS Sokotel (Hotell Viru), Hotell Olümpia AS, Meriton Hotels AS, OÜ Swissotel Estonia and OÜ SPA Tours. The biggest catering companies are Premier Restaurants Eesti OÜ (McDonald’s), AS Hesburger, and Baltic Restaurants Estonia AS. Major travel agencies and tour operators include AS Estravel, Novatours OÜ, Reisieksperdi AS, OÜ TEZ Tour and CWT Estonia AS. Hurtigruten Estonia OÜ has the largest number of employees, which offers travel reservations and other support services to its group. Approximately 60% of the employees in the tourism sector work in Tallinn companies, other regions include Tartu and Pärnu, but the tourism industry is represented all over Estonia.
The spread of the coronavirus has severely affected the tourism industry and such setbacks can be expected in the future. Nevertheless, in the long run, travel growth is expected, which will also bring benefits to Estonian companies. Demand is expected to increase in both domestic and foreign tourism, and therefore the supply of services will also increase (new accommodation and catering facilities will be established). However, long-term growth will be slower than before. In the accommodation sector, the shared economy offers competition to traditional businesses, which means renting out their living space. In particular, the number of foreign tourists is expected to increase in the future and, as a result, export revenues will increase. The increase in supply means a greater need for additional labour in the tourism sector. As incomes rise, both domestic tourism and the number of foreign trips will increase in the long run. Tourism policy seeks to extend the duration of travel in Estonia and to diversify demand both on a seasonal and geographical basis.
The tourism sector suffered the most because of the coronavirus. Although domestic tourism helped to balance the fall in external demand in some regions during the summer, the year was very difficult for the sector and a full recovery from the crisis could take years.
2020 was the worst year in history for tourism. According to the World Tourism Organization, the number of international travels in the world dropped by more than 70%, compared to only 4% during the economic crisis of 2009. The coronavirus affected tourism around the world.
1,3
3,6
59,4
0
25
50
75
100
0
20
40
60
80
100
Share in valueadded*
Share of tourismin exports
Share in employ-ment*
Ratio to averagewage*
%%
* indicators characterise the accommodation and catering companies not the whole tourism sector
Source: Statistics Estonia
Share of sector in economy
2020 was the worst year in history for tourism.

77 Economic overview 2020
Ministry of Economic Affairs and Communications • Ministry of Finance 2021
The spread of the virus in March led to severe restrictions in Estonia and other countries, which had a strong impact on tourism. In April and May, the tourism sector was almost entirely closed down – there were about ten times fewer overnight stays than a year earlier. In the summer, the situation eased somewhat (the number of overnight stays decreased by a third from June–July compared to the previous year), but the situation worsened again in autumn both in terms of the spread of the virus and the situation in the tourism sector.
Due to negative developments, the value added created in the accommodation and food service activities decreased by more than a third at constant prices over the year, which was the worst indicator among the areas of activity. Although the share of accommodation and catering in the economy is relatively small, its contribution to the economic downturn (0.6 percentage points) was the same the trade sector which is several times larger.
The average cost of a night in an accommodation facility dropped by 20% in 2020. The total decline in accommodation prices (over 14% according to Eurostat) was the largest among the European Union countries. It was about the same in Latvia and Cyprus, followed by Finland and Sweden with an almost 10% drop. In catering, however, the price level in 2020 increased by a few percent both in Estonia and in the European Union as a whole.
Exports and imports of tourism services fell three times in 2020 compared to the previous record year. The positive balance of tourism services also decreased by the same amount.
In the year as a whole, the number of tourists staying in Estonian accommodations and the number of their overnight stays decreased by almost half compared to 2019. It was strongly affected by foreign tourism that decreased approximately 70%. The number of domestic tourists and overnight stays decreased by 10–15%. In some areas, domestic tourists helped to soften the decline in foreign visitors, but not everywhere. Holiday trips, business trips and overnight stays related to trips made for other purposes (incl. rehabilitation) decreased more or less the same, that is, by half. However, the target group that usually takes part in conferences and training courses suffered a heavier loss and the number of accommodated guests and overnight stays was 70% less than the year before.
Low demand forced some accommodation establishments to close their doors or not to open (for the summer period). The number of accommodations decreased by about one tenth over the year, however, the number of rooms and beds decreased by only a few percents, meaning that smaller accommodations were the ones to close their doors. Despite the
-2 000
-1 500
-1 000
-500
0
500
1 000
1 500
2 000
2 500
2015 2016 2017 2018 2019 2020
mld EUR
Source: Bank of Estonia
Tourism services
Exports Imports Balance of tourism services
Accommodation and catering contribution to the economic downturn was the same the trade sector which is several times larger.
In the year as a whole, the number of tourists staying in Estonian accommodations and the number of their overnight stays decreased by almost half
Low demand forced some accommodation establishments to close their doors or not to open (for the summer period).

78 Economic overview 2020
Ministry of Economic Affairs and Communications • Ministry of Finance 2021
reduction in supply, only one in five beds was filled on average. The decrease in supply affected Tallinn the most and the impact of the loss of foreign demand was the highest there. Prices also fell the most in Tallinn where the average cost of nightly accommodation fell by 30% in a year. In other regions, the decline was in most cases limited to a few percent, but there were also counties where prices increased slightly – Valga and Võru counties and Hiiumaa.
Preliminary business statistics show that the number of people employed in accommodation fell by almost 30% in 2020 and the number of working hours even more. The number of employed and working hours decreased by 10–15% in catering enterprises, and somewhat more in travel companies (together with reservation and other activities). According to the labour force survey which also reflects working abroad, the number of people employed in accommodation and catering decreased by 15–20%, but due to being a sample survey, the margins of error are quite extensive. The difficult situation and efforts to reduce costs also led to a drop of wages in the hospitality sector by 5% on average. The salary level of the industry has been consistently the lowest and in 2020, the gap with the average salary in Estonia widened even more.
Despite the cost cuts and various support measures (wage compensations were paid to the hospitality sector in the order of 10% of the previous year’s labour costs), accommodation, catering, travel agencies, tour operators and reservation providers ended the year at a loss. In the case of accommodation and travel agencies, the loss took more than the profit of an entire regular year (compared to short-term statistics). Under such conditions, various productivity indicators decreased as well.
-25-20-15-10-5051015
0
5
10
15
20
25
30
35
2015 2016 2017 2018 2019 2020*
% y-o-ythousand
* Labour survey: accommodation and catering companies; business
statistics: plus travel agencies and tour operators
Source: Statistics Estonia
Number of employed people
Number of employed people according to labour survey
No of employed people according to business statistics
Change in the number of employed people (r.s.)
Change in no of employed people in companies (r.s.)
-10
-5
0
5
10
15
0
200
400
600
800
1 000
2015 2016 2017 2018 2019 2020
% y-o-y
* accommodation and catering establishments
Source: Statistics Estonia
Wages
Average wage (in euros) Change in wages (r.s.)
The salary level of the industry has been consistently the lowest and in 2020, the gap with the average salary in Estonia widened even more.

79 Economic overview 2020
Ministry of Economic Affairs and Communications • Ministry of Finance 2021
According to preliminary data, investments by accommodation establishments decreased by a fifth in 2020, while increasing by the same amount in catering and by even more among travel agencies, tour operators and in the reservation business. Although these sectors together showed the same level of capital investment in fixed assets as a year earlier, it must be borne in mind that short-term statistics cover less than half of the total, so final estimates may show different developments. According to preliminary data, investment in buildings increased, accounting for almost half of capital investment. More investment was also made in computers and computer systems and means of transport, but the purchase of machinery, equipment and inventory decreased.
The assessments of the economic situation by the companies questioned by the Estonian Institute of Economic Research were very negative. The spread of the coronavirus and the establishment of restrictions took the hotels, restaurants and tourism businesses to a level of confidence that was comparable to or worse than during the 2008 economic crisis. The main problem had to do with low demand, but other problems were also pointed out and presumably they were related to restrictions. The usual difficulties in finding employees were mentioned only by few respondents.
At the beginning of 2021, the spread of the virus once again imposed restrictions on activities. In the first quarter, the number of guests and overnight stays was about half as low as the year earlier. Companies were much more conservative in their future forecasts, with only some of the respondents expecting an increase in demand and the number of employees in the coming months. Also the longer, half-year assessments were dominated by negative views. However, thanks to the growing number of vaccinations, there is hope for stopping the spread of the virus, making it easier for vaccinated people to travel (with no need to remain in isolation).
-50-40-30-20-100102030
050
100150200250300350400450
2015 2016 2017 2018 2019 2020*
% y-o-ymillion €
Source: Statistics Estonia
Value added, labour costs and productivity
Value addedLabour costsChange in total productivity (r.s.)Change in labour costs productivity (r.s.)
-20-1001020304050
0102030405060708090
2015 2016 2017 2018 2019 2020*
% y-o-ymillion €
* accommodation, catering, travel agencies and tour operators
Source: Statistics Estonia
Investments of companies
Investments in fixed assetsChange in investments (r.s.)
At the beginning of 2021, the spread of the virus once again imposed restrictions on activities.

80 Economic overview 2020
Ministry of Economic Affairs and Communications • Ministry of Finance 2021
According to a survey by a panel of experts from the World Tourism Organization, international tourism in Europe was expected to grow in the second half of 2021 and a fairly large number of respondents expected it as late as in 2022. Hospitality sector is expected to return to the level of 2019 in 2023 or later. As the availability of vaccines improves and it is likely that the majority of the population will be vaccinated quite soon, the changes, including for the tourism sector, may be faster than generally expected – once the restrictions are eased, people may want to make up for the lost time. However, this is a rather short-term effect. In the long run, the coronavirus period will leave a more lasting mark on travelling, for example, preferring virtual meetings to business trips.
Inbound tourism The spread of the coronavirus and the accompanying restrictions brought cross-border travel to almost complete standstill, which severely set back international tourism. The number of foreign visitors arriving in Estonia dropped by almost four times in 2020. One-day visitors were affected slightly more, but there were also more than three times less foreign tourists staying overnight than a year ago.
Coronavirus-related effects were strong across countries and visitor groups. In the second quarter, the arrival of foreign visitors decreased by more than ten times, in the summer the situation eased slightly, but in the last quarter of the year the situation was similar to the on in spring again. The impact of the virus on tourism was more visible in relation to visitors from more distant countries, but the number of passengers arriving from neighbouring countries also decreased several times. Due to the so-called Baltic bubble, Latvia and Lithuania somewhat stood out. From mid-May to September, residents of the Baltic States were free to visit neighbouring countries, thanks to which the number of their arrivals ‘only’ dropped to half of the one in the previous year. The Baltic bubble supported more multi-day visits while the impact to day trips was more modest.
In 2020, the cruise season was called off. As a result, the number of one-day visitors from the USA and Germany, for example, dropped sharply. The majority of one-day visitors were from the neighbouring Finland and Latvia, and the decline was smaller than average for these countries.
Changes in the arrival of foreign visitors were also reflected in the amount of money they spent in Estonia – compared to 2019, it decreased threefold. In the section of business trips, the coronavirus had a smaller impact on the costs of cross-border and short-term employees. Out of private trips, expenditures related to studies in Estonia were almost the same as a year
-80-70-60-50-40-30-20-10010
01 0002 0003 0004 0005 0006 0007 000
2015 2016 2017 2018 2019 2020
% y-o-ythousand
Source: Statistics Estonia
Inbound travel to Estonia
Total number of visitsNumber of overnight visitsChange in the number of visits (r.s.)Change in the number of overnight visits (r.s.)
Due to the so-called Baltic bubble, Latvia and Lithuania somewhat stood out. From mid-May to September, residents of the Baltic States were free to visit neighbouring countries.
The spread of the coronavirus and the accompanying restrictions brought cross-border travel to almost complete standstill, which severely set back international tourism.
Coronavirus-related effects were strong across countries and visitor groups.
Out of private trips, expenditures related to studies in Estonia were almost the same as a year earlier

81 Economic overview 2020
Ministry of Economic Affairs and Communications • Ministry of Finance 2021
earlier but the decrease came from smaller expenditures in relation to holidays and trips made for other purposes.
Estonian transport companies also suffered severely. International rail passenger transport stopped completely but its share in passenger transport exports is also traditionally very small. Maritime transport export revenues from passenger transport decreased by almost 60%. Although international air traffic also stopped, the decline in exports in air transport was the smallest (over 40%), which was partly due to the provision of services outside Estonia, for example on Swedish domestic routes.
At the beginning of 2020, the number of foreign visitors staying in accommodations was still on a considerable rise, but the coronavirus completely changed the situation. In April and May, instead of the usual 150,000–200,000 foreign visitors, only a few thousand arrived in Estonian accommodation establishments. Although the easing of restrictions increased travelling, even in the summer the demand for foreign tourists was more than twice as low as a year earlier and the situation became even worse when autumn arrived. In total, the number of foreign visitors and their overnight stays in accommodations dropped by about 70% in 2020 compared to the previous year.
The decline in the number of foreign tourists affected Estonian accommodation establishments quite similarly almost everywhere in Estonia. In some counties the decrease in the number of overnight stays was smaller thanks to long-term foreign soldiers and in Põlva County, thanks to Latvian tourists. During the time of restrictions, Latvian and Lithuanian tourists were able to come to Estonia more easily and therefore the decline in the demand by them was slightly smaller. The number of overnight stays of the Ukrainian population decreased by half and the average duration of overnight stays increased, which indicated accommodating foreign workers. Due to the situation caused by the coronavirus, the work permits of foreign workers were temporarily extended.
The decrease in the number of foreign tourists had the strongest impact on accommodations in Tallinn that normally welcomes guests 85% of whom are from abroad. Easier travel of Latvian tourists during the restrictions was also seen in Tallinn accommodation establishments but this had little effect on the overall situation.
-80-70-60-50-40-30-20-1001020
0500
1 0001 5002 0002 5003 0003 5004 0004 5005 000
2015 2016 2017 2018 2019 2020
% y-o-ythousand
Source: Statistics Estonia
Number of foreign tourists and overnight stays in accomodation establishments
Number of accommodated foreign visitorsNumber of overnight staysChange in the number of foreign visitors (r.s.)Change in the number of overnight stays (r.s.)
During the time of restrictions, Latvian and Lithuanian tourists were able to come to Estonia more easily and therefore the decline in the demand by them was slightly smaller.

82 Economic overview 2020
Ministry of Economic Affairs and Communications • Ministry of Finance 2021
At the beginning of 2021, new restrictions were introduced and in the first quarter, foreign visitors made 80–90% fewer trips to Estonia; the decline in accommodations followed the same pattern. However, at the end of the year, the number of foreign visitors can be expected to exceed the level of 2020 because vaccines are expected to prevent the future waves of the coronavirus.
Domestic tourism Domestic tourism did not remain untouched by the coronavirus but the situation was much better than with the foreign tourism. Since travelling abroad was complicated, people paid more attention to domestic opportunities.
The number of Estonian residents staying in accommodation establishments decreased by more than 15% in 2020, the number of overnight stays declined by somewhat less. During the spring restrictions, the number of guests and overnight stays in April fell by 80–90% year-on-year, but new records were set from July to October. In the year as a whole, the previous year’s number of overnight stays of domestic tourists in Hiiu County, Jõgeva County and Pärnu was exceeded. Domestic tourists helped Hiiu County to fully compensate for the decrease in the number of foreign tourists.
Accommodation of Estonian residents decreased the most in Tallinn, by more than a quarter. In the second half of the year, the number of guests and overnight stays almost returned to the level of previous years, but in the spring and summer the demand remained significantly lower.
0 10 20 30 40
ItalyUSA
PolandSweden
FranceUkraine
UKLithuaniaGermany
RussiaLatvia
Other cuntriesFinland
Source: Statistics Estonia
%
Overnight stays by foreign tourists by countries
Since travelling abroad was complicated, people paid more attention to domestic opportunities.

83 Economic overview 2020
Ministry of Economic Affairs and Communications • Ministry of Finance 2021
From 2021, more positive developments in domestic tourism can be expected than in the previous year. Restoring transport connections with foreign countries and facilitating cross-border travel will take time and the restrictions on the domestic market will be lifted sooner. Although the restrictions also affected domestic tourism, in the first quarter of 2021 the stays of Estonian residents in accommodations decreased by about one tenth compared to the previous year, which was a significantly better indicator compared to foreign tourism. Four of the five guests were from Estonia: usually, they make up less than half of the clients at that time.
Outbound tourism The coronavirus had a strong impact on the foreign trips of Estonian people. The number of foreign trips decreased somewhat less than the number of incoming visitors, but in 2020, almost three times fewer foreign trips were made than a year earlier. The decline affected both multi-day trips and one-day visits. Once the restrictions eased, Estonian people used the opportunity to travel outside Estonia in the summer, but travel still remained modest compared to the usual situation. The decline was relatively smaller in the direction of Latvia (less than 40%), supported by smaller restrictions, and the number of trips to Finland and Lithuania also decreased less than average. In case of some remote tourist areas (Thailand, Egypt), the main demand is at the beginning and end of the year, so half of the tourist season was still largely unaffected by the virus at the beginning of the year and the decline in the number of trips was therefore smaller.
-20
-15
-10
-5
0
5
10
15
0
500
1 000
1 500
2 000
2 500
3 000
2015 2016 2017 2018 2019 2020
% y-o-ythousand
Source: Statistics Estonia
Estonian tourist in accomodation establishments
Number of accommodated peopleNumber of overnight staysChange in the number of accommodated people (r.s.)Change in the number of overnight stays (r.s.)
-70-60-50-40-30-20-10010
0500
1 0001 5002 0002 5003 0003 5004 000
2015 2016 2017 2018 2019 2020
% y-o-ythousand
Source: Statistics Estonia
Foreign trips of Estonian residents
Total number of visitsNumber of overnight visitsChange in the number of visits (r.s.)Change in the number of overnight visits (r.s.)
From 2021, more positive developments in domestic tourism can be expected than in the previous year.
Once the restrictions eased, Estonian people used the opportunity to travel outside Estonia in the summer, but travel still remained modest compared to the usual situation.

84 Economic overview 2020
Ministry of Economic Affairs and Communications • Ministry of Finance 2021
Expenditures of Estonian residents on foreign trips decreased by more than 60% over the year, imports of travel services dropped even more. Expenses related to work and studies were only 15% lower than in the previous year, but other expenses fell similarly with the general market developments.
At the beginning of 2021, travel abroad was still quite complicated and the number of foreign trips in the first quarter was four times lower than a year ago. However, growth can be expected in the second half of the year as coronavirus restrictions are expected to ease and the transport options improve. Although the corona crisis hit the economy hard and unemployment rose, the forecasts turned out to be more pessimistic than the reality. People’s assessments of their family’s economic situation and prospects did not change much. Nevertheless, it can be expected that it will take years for the number of foreign trips to reach the usual levels.
Growth can be expected in the second half of the 2021 as coronavirus restrictions are expected to ease and the transport options improve.

85 Economic overview 2020
Ministry of Economic Affairs and Communications • Ministry of Finance 2021
Information and communications Information and communication activities embrace publishing, including software publishing, production of motion pictures and sound recordings, production and distribution of radio and television programmes, as well as compilation and provision of on-demand programme catalogues for audiovisual media services, electronic communications, information technology and other information service activities. In addition to the aforementioned service areas, the information and communication technology (ICT) sector also includes the wholesale of ICT and the repair of computers and communication equipment, as well as electronic components and printed circuit boards belonging to the manufacturing industry, companies manufacturing computers and computer peripherals, communications equipment, consumer electronics, and magnetic and optical media. The main developments in the sector are described below on the basis of companies in the information and communication sector. The manufacturing share of the ICT sector is covered by an overview of the electronics industry. The ICT sector has an important role to play in sustaining the economy and society, and the need for it has been particularly evident during the global COVID-19 pandemic. The provision of services from afar and cloud services have become important tendencies. The trend in the ICT sector is also characterised by a boost in the use of smart devices and the opportunities offered by the Internet, and in this context by the development of technologies (sensors, Internet of Things, smart devices and networks, embedded systems, 5G, etc.) and innovation. Products and services in the information and communication sector are steadily linked to developments in other sectors of the economy, such as education, medicine, manufacturing, transport and construction. Already almost 7,000 companies operated in the information and communications sector in 2020. These are for the most part micro-enterprises in the field of information technology (programming, consulting, etc.) with less than ten employees. More than 60% of information and communication companies are engaged in programming. The largest providers of mobile communication services and other telecommunications services are Telia Eesti AS, Tele2 Eesti AS and Elisa Eesti AS. To boot, the leading companies in the field of telecommunications are AS STV, wired telecommunication services provider, Nord Connect OÜ and OÜ Top Connect, telecommunication services providers, and AS TV Play Baltics, satellite communication services provider. The most important companies in the software industry are Bolt Operations OÜ, Pipedrive OÜ, Playtech Estonia OÜ, Helmes AS and Nortal AS. The largest newspaper publishing companies are AS Postimees Grupp and AS Äripäev. The largest companies in the field of television programmes and radio broadcasting and information activities (data processing, web portals, hosting services) are Raadiotehnika OÜ, Adcash OÜ and Heathmont OÜ, but their turnover is much smaller than that of large companies in the sector.
The ICT sector is one of those positively affected by the global coronavirus crisis. The emergency situation forced us to look for solutions in this new situation in all sectors, so that virtual life management would help to continue the business sustainably. Many companies switched to telecommuting, which increased the sales of computers, the need for conference calling solutions, secure access to systems, development of e-commerce solutions, and the availability of high-speed Internet access. Thus, during the coronary pandemic, ICT companies have been partners for airlines, as well as in the development of e-commerce, transport and logistics and industrial solutions. In 2020, sales revenue, value added and the wage level in the information and communication sector increased.
8,6 16,94,7
177,8
0
40
80
120
160
200
0
20
40
60
80
100
Share in valueadded
Share of ICT inexports*
Share inemployment
Ratio to averagewage (r.s.)
%%
* based on Balance of Payments statistics
Source: Statistics Estonia, Bank of Estonia
Share of sector in economy
ICT companies have been partners for airlines, as well as in the development of e-commerce, transport and logistics and industrial solutions.

86 Economic overview 2020
Ministry of Economic Affairs and Communications • Ministry of Finance 2021
In 2020, the total sales revenue of companies in the sector was already nearly 3 billion euros, increasing by 16% compared to the previous year. Most of the sales revenue in the sector was earned by programming and telecommunications companies, 55% and 26% respectively. Similar situation has also been characteristic of previous years. The share of other sub-sectors (publishing, information service activities, production of motion pictures and sound recordings, broadcasting) was several times smaller. Information activities grew the most, reaching 37%. Programming and telecommunications also showed growth, at 27% and 8% respectively. Other sub-sectors of the sector were in decline compared to 2019.
Similar to sales revenue, productivity indicators also followed a growth trend. In 2020, the total productivity of companies increased by 4% on the basis of added value and labour productivity per employee by 12%. The value added of the sector also continued to grow. The value added increased by 21% compared to the previous year, reaching 1 billion euros. Due to this, the share of value added in the information and communication sector in the entire Estonian economy also increased to 8.6%. Value added grew similarly to sales revenue in information technology companies (39% growth), programming (28%) and telecommunications (15%).
0
2
4
6
8
10
12
14
16
18
0,0
0,5
1,0
1,5
2,0
2,5
3,0
3,5
2015 2016 2017 2018 2019 2020*
% y-o-ymld EUR
Source: Statistics Estonia
Sales revenue
Sales revenue Change in sales revenue (r.s.)
Telecommunication26%
Programming55%
Publishing5% Information activities
10%
Production of films and audio recordings
3%
Broadcasting1%
Information and communication sector based on sales revenue
Source: Statistics Estonia
Most of the sales revenue in the sector was earned by programming and telecommunications companies
The value added increased by 21% compared to the previous year, reaching 1 billion euros.
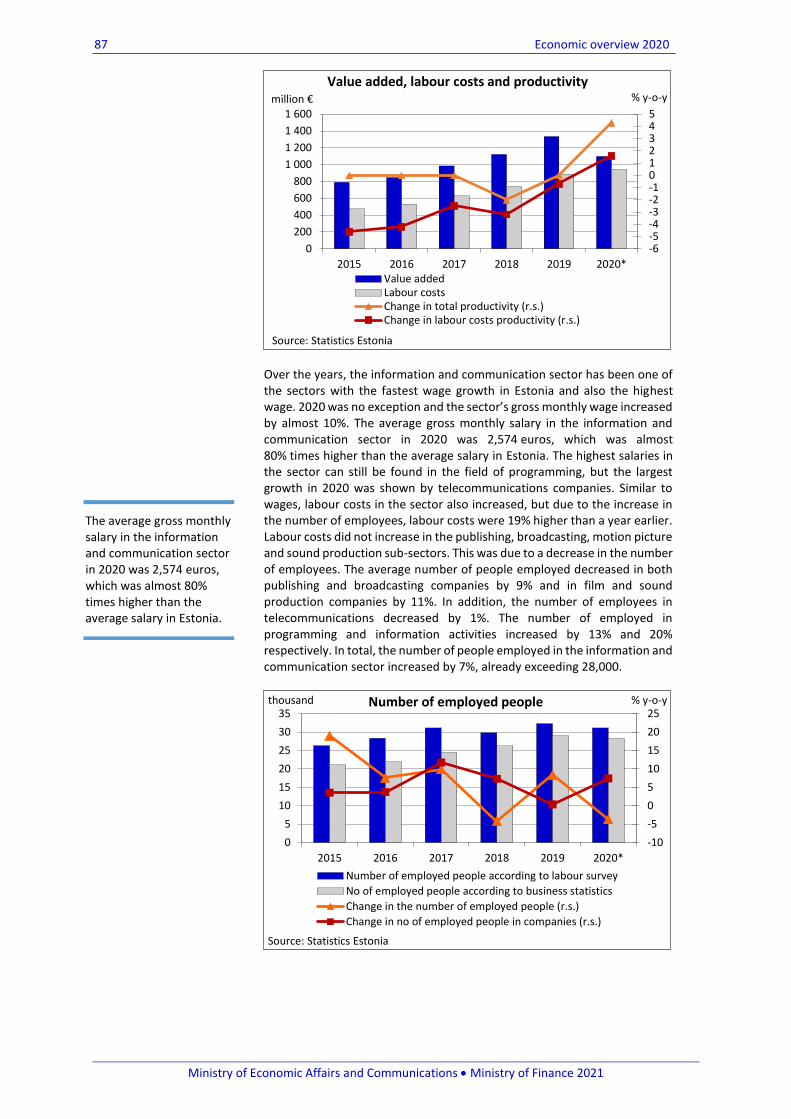
87 Economic overview 2020
Ministry of Economic Affairs and Communications • Ministry of Finance 2021
Over the years, the information and communication sector has been one of the sectors with the fastest wage growth in Estonia and also the highest wage. 2020 was no exception and the sector’s gross monthly wage increased by almost 10%. The average gross monthly salary in the information and communication sector in 2020 was 2,574 euros, which was almost 80% times higher than the average salary in Estonia. The highest salaries in the sector can still be found in the field of programming, but the largest growth in 2020 was shown by telecommunications companies. Similar to wages, labour costs in the sector also increased, but due to the increase in the number of employees, labour costs were 19% higher than a year earlier. Labour costs did not increase in the publishing, broadcasting, motion picture and sound production sub-sectors. This was due to a decrease in the number of employees. The average number of people employed decreased in both publishing and broadcasting companies by 9% and in film and sound production companies by 11%. In addition, the number of employees in telecommunications decreased by 1%. The number of employed in programming and information activities increased by 13% and 20% respectively. In total, the number of people employed in the information and communication sector increased by 7%, already exceeding 28,000.
-6-5-4-3-2-1012345
0
200
400
600
800
1 000
1 200
1 400
1 600
2015 2016 2017 2018 2019 2020*
% y-o-ymillion €
Source: Statistics Estonia
Value added, labour costs and productivity
Value addedLabour costsChange in total productivity (r.s.)Change in labour costs productivity (r.s.)
-10
-5
0
5
10
15
20
25
0
5
10
15
20
25
30
35
2015 2016 2017 2018 2019 2020*
% y-o-ythousand
Source: Statistics Estonia
Number of employed people
Number of employed people according to labour survey
No of employed people according to business statistics
Change in the number of employed people (r.s.)
Change in no of employed people in companies (r.s.)
The average gross monthly salary in the information and communication sector in 2020 was 2,574 euros, which was almost 80% times higher than the average salary in Estonia.

88 Economic overview 2020
Ministry of Economic Affairs and Communications • Ministry of Finance 2021
According to preliminary data, investments in information and communication sector companies in tangible fixed assets decreased by 13% in 2020. The largest investments were made in telecommunication companies, accounting for more than 60% of all investments made in information and communication enterprises. The decline in investment may be due to the fact that in addition to tangible fixed assets, investments in intangible fixed assets are becoming increasingly important. The second largest investment was in the programming sub-sector, where the volume of investments decreased by more than 40% in a year. Investments in machinery and equipment still accounted for the largest share of the total sector, accounting for about half of the total sector’s investments. Investments in computers and computer systems increased to 30%, while investments in buildings fell to 9%.
The corona crisis led to a more active use of home offices. According to Statistics Estonia, the number of people working from home increased to
0
2
4
6
8
10
12
0
500
1 000
1 500
2 000
2 500
3 000
2015 2016 2017 2018 2019 2020
% y-o-y
Source: Statistics Estonia
Wages
Average wage (in euros) Change in wages (r.s.)
-30
-20
-10
0
10
20
30
40
50
0
50
100
150
200
250
300
2015 2016 2017 2018 2019 2020*
% y-o-ymillion €
Source: Statistics Estonia
Investments of companies
Investments in fixed assets Change in investments (r.s.)
Telecommunication69%
Programming19%
Information activities8%
Production of films and audio recordings
4%Publishing0%
Investments in fixed assets in the information and communication sector
Source: Statistics Estonia
The largest investments were made in telecommunication companies, accounting for more than 60% of all investments made in information and communication enterprises.

89 Economic overview 2020
Ministry of Economic Affairs and Communications • Ministry of Finance 2021
31% of all employed during the springtime virus wave. In addition, in 2020, students spent most of their time distance learning. However, the number of Internet users decreased compared to the previous year. Since the change was minimal, it can be considered a normal fluctuation because this indicator has been high in Estonia already since 2015. However, duration and frequency of Internet use is on the rise. In 2020, 90% of Estonian households had a home Internet connection. However, during the corona pandemic, the use of mobile internet increased significantly. In the year as a whole, for example, call volumes in Telia’s mobile network increased by almost 16%, while the use of mobile Internet increased by as much as 32%. In Elisa’s cable network, the consumption of data communications increased by almost half in the first days of the emergency situation, and there was also an increase in the volume of uploads which is probably due to holding video conferences. In addition, the nature of mobile internet consumption changed during the corona pandemic: consumption levelled during working and non-working hours and there was no major difference between the nature of weekday and weekend consumption. The pattern of mobile Internet use also changed in the geographical view, moving more often from cities to rural areas. According to the data of the survey Information Technology in Households, Estonian people use the Internet the most to send e-mails, search for information, read media publications and use Internet banking services. More than 90% of 16–74-year-olds living in Estonia do all the above. In 2020, 80% of 16–74-year-olds used e-services when communicating with public authorities.
According to the survey Business Information Technology 2020, 99% of companies had an Internet connection and mostly, it was a fixed connection. The use of information technology helps companies to work more efficiently thanks to the use of digital documents, cloud services, big data, robots, etc. The use of cloud services has grown steadily in recent years. Six years ago, just over a tenth of companies had purchased paid cloud services, by 2020, already 57% of companies were using them, and the distinction between large and small companies had disappeared. Financial or accounting
0
20
40
60
80
100
2015 2016 2017 2018 2019 2020
%
Share of 16-74 years old internet and e-commerce users
Internet E-commerce
Source: Statistics Estonia
0
20
40
60
80
100
2015 2016 2017 2018 2019 2020
%Share of households with internet connection at
home
Source: Statistics Estonia
Duration and frequency of Internet use is on the rise.
During the corona pandemic, the use of mobile internet increased significantly.
In addition, the nature of mobile internet consumption changed during the corona pandemic: consumption levelled during working and non-working hours and there was no major difference between the nature of weekday and weekend consumption.

90 Economic overview 2020
Ministry of Economic Affairs and Communications • Ministry of Finance 2021
software is mainly purchased as a cloud service, as well as office software and e-mail services. Only 9% of companies still deal with big data. Similarly, the use of robots remains modest. According to a survey by Statistics Estonia, 3% of enterprises used industrial robots and only less than 1% of enterprises used service robots. However, an increase in use is visible and can be observed in many different sectors. The use of the Internet of Things (IoT) is more popular than robots, used by 16% of companies. 38% of them use the Internet of Things (IoT) to improve customer service and more than a third to optimise energy consumption. More than half of businesses that use the Internet of Things (IoT) use it to track the movement of vehicles and goods.
The information and communication sector was one of the sectors that grew despite the crisis caused by the COVID-19 pandemic. The crisis has brought new business opportunities to the ICT sector because automation, digitalisation and virtual products / services are on the rise. According to a survey conducted by the Estonian Institute of Economic Research in March 2021, the confidence indicator of IT companies was on the positive side and in the telecommunications sector, it was higher than in any other branch. The forecasts of IT service companies concerning the demand in the next 3 months were at the same level as in 2020 at the same time. Many companies have already increased their workforce and plan to hire additional staff in the coming months. In telecommunications companies, sales of services have been on the rise due to active demand, and consistently good demand or growth was also expected in the coming months.
entterprises using servicerobotics
enterprises using industrial robots
enterprises analysing big data*
enterprises using IoT
enterprises having bought cloudcomputing services
0 10 20 30 40 50 60
%
Share of enterprises using IT solutions
Source: Statics Estonia
* 2019
The use of information technology helps companies to work more efficiently thanks to the use of digital documents, cloud services, big data, robots, etc.
The crisis has brought new business opportunities to the ICT sector because automation, digitalisation and virtual products / services are on the rise.

91 Economic overview 2020
Ministry of Economic Affairs and Communications • Ministry of Finance 2021
Transport
Parts of the Estonian transport system are rail, road, sea, inland waterway and air transport, electricity transport in cities and pipeline transport. 7% of all employed persons, i.e. approximately 45,000 people (2020), are employed in transport and warehousing. Transportation services make a significant contribution to export revenue collection and balance to Estonia’s foreign trade balance. Many inputs in the transport sector (expenditure on the purchase of vehicles, their maintenance and fuel) are quite large imported products. The transport sector is also a major emitter of greenhouse gases (GHGs). Given the European Union’s climate targets for reducing greenhouse gas emissions in the transport sector to 1700 kt (by 700 kt) by 2035, more attention must be paid to increasing energy efficiency in the further development of the sector. About 6,000 companies operate in the field of transport and warehousing. AS Tallinna Linnatransport, which provides bus, tram and trolley bus traffic services with the largest transport volume in Tallinn, has the biggest land transport capacity. Domestic passenger transport by rail is organised by AS Eesti Liinirongid (Elron), goods are transported by rail mainly by AS Operail. Logistics companies DSV Estonia AS, AS Smarten Logistics and DHL Logistics Estonia OÜ are leading in freight transport. The largest company in the entire transport sector is AS Tallink Grupp, which is engaged in the maritime transport of passengers and goods. The most important provider of port services is AS Tallinna Sadam, which manages five ports: Old City Harbour (incl. Old Port Yacht Harbour), Muuga Harbour, Paldiski South Harbour, Paljassaare Harbour and Saaremaa Harbour. The largest company in the field of air transport is the subsidiary of AS Nordic Aviation Group, Regional Jet OÜ. AS Nordic Aviation Group operates in international passenger and freight transport. The largest company in the postal and courier service is AS Eesti Post.
In 2020, the global COVID-19 pandemic and the consequent closure of national borders and the introduction of movement restrictions domestically led to a significant decline in freight and passenger transport for all modes of transport. The transport volumes (in tons) of Estonian companies decreased by a little over 20%. The largest decrease in transport volumes, 28%, was in rail transport. Freight turnover (in ton-kilometres) also decreased in 2020 by 14.3%. The number of passengers decreased by 34.7% in 2020, the passenger turnover by almost 60%. The total number of public transport users decreased by 34% compared to 2019. The number of rail, sea and land transport users also increased (28.5%, 46.6%, and 34.2% respectively). The number of air transport users decreased the most (-78.4%).
The total cargo volume of goods decreased by 20.9% in 2020, to 39.4 million tons. By rail, the volume of oil shale trade decreased the most, the total volumes of freight transportation in ports remained similar to the previous year.
6,2
7,0
95,8
0
20
40
60
80
100
Share in value added Share in employ-ment Ratio to average wage(r.s.)
%
Source: Statistics Estonia
Share of sector in economy
In 2020, the global COVID-19 pandemic and the consequent closure of national borders and the introduction of movement restrictions domestically led to a significant decline in freight and passenger transport for all modes of transport.

92 Economic overview 2020
Ministry of Economic Affairs and Communications • Ministry of Finance 2021
-20
-15
-10
-5
0
5
10
15
0
1
2
3
4
5
6
7
2015 2016 2017 2018 2019 2020*
% y-o-ybillion €
Source: Statistics Estonia
Sales revenue
Sales revenue Change in sales revenue (r.s.)
Oher supporting services
54%
Road34%
Water4%
Air3%
Postal and courier service5%
Estonian transport sector based on sales revenue
Source: Statistics Estonia
-25
-20
-15
-10
-5
0
5
0
20
40
60
80
2015 2016 2017 2018 2019 2020
% y-o-ymillion t
Source: Statistics Estonia
Transport of goods by Estonian companies
Transported cargo Change (r.s.)
Railway; 15 799
Road; 23 623
Water; 37 688
Cargo transport of Estonian companies by modes of transport (th tons)
Source: Statistics Estonia
The total cargo volume of goods decreased by 20.9% in 2020, to 39.4 million tons.

93 Economic overview 2020
Ministry of Economic Affairs and Communications • Ministry of Finance 2021
The volume of container transport increased in 2020 to 10.8% TEU or 215,905. The amount of goods passing through Estonian ports remained the same as in the previous year, i.e. 37.7 million tons of goods. 1.4% more goods arrived in Estonia from foreign ports, i.e. 6.7 million tons; 10.2 million tons of goods were sent abroad from our ports, which was 4.9% less. Unloading or discharging of goods from the ship amounted to 13.1 million tons of the cargo volume of the ports in 2020 and loading or arranging cargo of goods to the ship amounted to 24.6 million tons. Compared to the previous year, unloading increased by 6.3% and loading decreased by 2.9%. Chemicals, rubber, and plastic products were the products most often loaded to ships in Estonian ports in 2020. Refined petroleum products were unloaded the most. The ports served approximately 65.3% of the cargo flows sent by sea and for the rest, trade flows arriving by the sea. The number of people travelling by sea dropped by 46.6% compared to 2019. Estonian maritime transport companies carried 5.1 million passengers in 2020. The number of passengers going abroad from the Estonian ports decreased by 56%, remaining at 2.2 million passengers. We received 2.2 million passengers or 61% less than a year before. The largest decrease (99.8%) was made by the number of cruise tourists visiting Estonia – in 2020, only 1,023 tourists arriving from abroad by cruise ships visited Estonia. The number of passengers of Estonian maritime transport companies also decreased on domestic routes (16.9% to 2.15 million). The number of passengers on international routes decreased to 2.69 million passengers or 60.8%. The passenger turnover of maritime transport companies dropped from 1.30 billion to 0.35 billion passenger kilometres, which was 72.7% less than last year. Although the general and long-term decline in rail freight is due to the European Union’s sanctions imposed on Russia in 2014 and Russia’s
0
100 000
200 000
300 000
2015 2016 2017 2018 2019 2020
TEUContainer transport through Estonian ports
Source: Statistics Estonia
-40
-30
-20
-10
0
10
0
10
20
30
40
2015 2016 2017 2018 2019 2020
% y-o-ymillion t
Source: Statistics Estonia
Cargo transport through Estonian ports
Total cargo Transit
Change in cargo volume (r.s.) Change in transit volume (r.s.)
Chemicals, rubber, and plastic products were the products most often loaded to ships in Estonian ports
The volume of container transport increased in 2020 to 10.8% TEU or 215,905.
The amount of goods passing through Estonian ports remained the same as in the previous year, i.e. 37.7 million tons of goods.

94 Economic overview 2020
Ministry of Economic Affairs and Communications • Ministry of Finance 2021
increasing use of its ports to send goods abroad instead of railway, the major decline in 2020 was due to the global COVID-19 pandemic. The volume of goods transported by rail was 15.8 million tons or 26% less than a year earlier. In 2020, the freight turnover of rail transport increased by 20% to 1.73 billion ton-kilometres. Freight transport by public rail decreased by 14.9% to 11.3 million tons. Domestic railway transport carried the most oil shale, but compared to 2019, these volumes decreased by 51.8% to 3.7 million tons. In 2020, transit goods accounted for 55.6% of all goods on railroad. Chemicals, chemical products and man-made fibres, rubber and plastic products were mostly transported as goods in transit. The volume of international rail transport in 2020 was 8.2% lower (i.e. 10.2 million tons) than a year before. In 2020, the volume of transit goods transported by rail decreased by 6.6% to 8.8 million tons. Imports decreased by 16.4% to 1.2 million tons and exports decreased by 20.9% to 0.2 million tons. Passenger transport by rail fell by 28.5%, reaching 5.98 million passengers. International passenger transport by rail was 92% slower than in the previous year, i.e. 8,700 passengers. The passenger turnover of railway transport decreased by 32.8% to 263.4 million passenger kilometres. In 2020, Estonian air transport companies carried 78.4% less passengers, which was 134,000 people. Passenger turnover of air transport companies fell by 82.2% to 225.8 billion passenger kilometres. The size of Nordica’s fleet remained the same as in the previous year – 19 aircrafts in total. The largest airport in Estonia, Tallinn Airport, was used by 863,589 people in 2020 (a decline of 73.8%), and most of the goods transported by air were also transported through it. In 2020, road transport companies transported 23.6 million tons of goods, which was almost 18% less than in 2019. The volume of international freight transport decreased by 5.5%, reaching 4.7 million tons. The volume of domestic freight transport increased by 19.1% to 18.9 million tons. Road passenger transport decreased by 34.2% in 2020 compared to the previous year, i.e. to 133.7 million passengers, of whom 108.7 million or 35% more travelled inside cities (incl. with trams and trolley buses). On county routes, the number of passengers decreased by 29.6% to 25 million passengers. Domestic occasional services carried 2.8 million passengers (a drop of 42.4%). The number of passengers on domestic long-distance routes decreased by 39.4%, reaching 2.4 million passengers; 0.4 million passengers travelled on international routes (a 74% drop). Passenger turnover of road transport companies fell by 49.4% to 1.64 billion passenger kilometres. Passenger turnover decreased by 81% in international transport and by 49% in domestic transport.
The largest decrease (99.8%) was made by the number of cruise tourists visiting Estonia – in 2020, only 1,023 tourists arriving from abroad by cruise ships visited Estonia.
Passenger transport by rail fell by 28.5%, reaching 5.98 million passengers.
In 2020, Estonian air transport companies carried 78.4% less passengers, which was 134,000 people.

95 Economic overview 2020
Ministry of Economic Affairs and Communications • Ministry of Finance 2021
0
50
100
150
200
250
0
2
4
6
8
10
2015 2016 2017 2018 2019 2020
Source: Statistics Estonia
Passenger transport by Estonian companies by mode of transport (million passengers)
Railway (l.s.) Water (l.s.) Air (l.s.) Road (r.s.)
-8,0
-6,0
-4,0
-2,0
0,0
2,0
4,0
6,0
8,0
35 000
36 000
37 000
38 000
39 000
40 000
41 000
42 000
2015 2016 2017 2018 2019 2020*
Source: Statistics Estonia
Number of employed people
Number of employed people
Change in the number of employed people (r.s.)
0123456789
0
200
400
600
800
1 000
1 200
1 400
1 600
2015 2016 2017 2018 2019 2020
% y-o-y
Source: Statistics Estonia
Wages
Average wage (in euros)
Change in wages (r.s)
-16-12-8-40481216
0200400600800
1 0001 2001 4001 600
2015 2016 2017 2018 2019 2020*
% y-o-ymillion €
Source: Statistics Estonia
Value added, labour costs and productivity
Value added
Labour costs
Change in total productivity (r.s.)
Change in labour costs productivity (r.s.)
Wage growth in the sector was 0,1% higher than the Estonian average

96 Economic overview 2020
Ministry of Economic Affairs and Communications • Ministry of Finance 2021
5 FORECAST. Eesti Pank forecasts that the economy will probably recover to its pre-crisis level in the second half of next year. Available at: https://www.eestipank.ee/en/press/eesti-pank-forecasts-economy-will-probably-recover-its-pre-crisis-level-second-half-next-year-16122020
In 2020, the number of employees in transport and storage companies decreased by 6.3%. Wage growth in the sector was higher than the Estonian average (2.9%), i.e. 3.0%, which means that the gap with the Estonian average wage decreased. Investments of transport and storage companies decreased by 26.7% in 2020. It must also be taken into account that data in the fields of rail, other land, water and air transport are confidential, which means that information is incomplete. The ongoing COVID-19 pandemic will also have a major impact on the economy in 2021. According to Eesti Pank’s economic forecast, the Estonian economy will start recovering from the crisis in 2021 by virtue of more widespread vaccination and will reach the pre-crisis level in the second half of the year. At the same time, it is acknowledged that the course of the pandemic and the new restrictions caused by it, having a significant impact on the economy, are almost impossible to predict.5 The impact of movement restrictions on the transport sector will continue in 2021, but passenger transport in the maritime and aviation sectors is likely to increase due to partially open national borders. Due to milder domestic restrictions, it can be expected that domestic passenger transport (public transport) will also increase in 2021.
-30
-20
-10
0
10
20
30
40
0
100
200
300
400
500
600
2015 2016 2017 2018 2019 2020*
% y-o-ymillion €
Source: Statistics Estonia
Investments of companies
Investments in fixed assets
Change in investments (r.s.)
Warehousing and support activities for
transportation52%
Road transport46% Others
2%
Investments in fixed assets in the transportation sector
Source: Statistics Estonia
The impact of movement restrictions on the transport sector will continue in 2021, but passenger transport in the maritime and aviation sectors is likely to increase due to partially open national borders.

97 Economic overview 2020
Ministry of Economic Affairs and Communications • Ministry of Finance 2021
Annexes
Annex 1. Trade with associations of countries
Association Volume (million €) Share (%) Change (y-o-y)
of countries Imports Exports Imports Imports Exports Imports
2019 2020 2019 2020 2019 2020 2019 2020 2020 2020
EU 10 093,40 9 726,90 12 754,30 11 838,20 70,1 68,0 79,2 78,1 -3,6 -7,2
CIS 979,70 935,70 1 572,80 1 452,90 6,8 6,5 9,8 9,6 -4,5 -7,6
EFTA 688,10 598,10 240,80 293,10 4,8 4,2 1,5 1,9 -13,1 21,7
NAFTA 1 123,60 1 232,30 256,40 269,00 7,8 8,6 1,6 1,8 9,7 4,9
Associations in total 12 884,80 12 493,00 14 824,30 13 853,20 87,0 89,5 92,1 92,1 -3,0 -6,6
Estonia total 14 391,60 14 304,40 16 099,40 15 149,10 100 100 100 100 -0,6 -5,9
Source: Statistics Estonia

98 Economic overview 2020
Ministry of Economic Affairs and Communications • Ministry of Finance 2021
Annex 2. Export commodity groups by main target countries in 20120 (%)
Commodity group Finland Sweden Latvia USA Germany Russia Lithuania Norway Denmark The Netherlands
Total share
Live animals and animal products 2,8 0,8 7,6 0,2 1,5 0,1 9,0 0,9 2,9 2,4 2,9
Vegetable products 1,6 0,8 2,4 0,1 2,1 0,7 1,7 3,0 0,9 3,7 1,5
Animal and vegetable fats and oils 0,5 0,3 1,2 0,0 0,3 0,1 2,4 0,1 0,5 0,2 0,6
Prepared foodstuffs; beverages; tobacco 5,5 3,3 9,3 0,2 1,1 5,3 7,3 3,3 3,4 0,6 4,3
Mineral products 1,8 2,4 14,6 16,6 2,1 1,8 2,3 1,6 12,5 36,4 7,7
Chemical products 4,3 4,0 6,1 4,2 4,2 11,2 10,0 0,8 2,3 6,4 5,3
Plastics and articles thereof, rubber products 4,1 4,4 5,5 0,4 4,0 4,6 5,3 2,8 1,7 2,1 3,7
Leather, fur skins and articles thereof 0,3 0,1 0,3 0,1 0,1 0,3 0,4 0,1 0,2 0,0 0,2
Wood and articles of wood 8,2 14,7 6,0 5,0 12,1 0,3 2,9 20,5 38,4 13,8 10,1
Pulp and articles thereof 2,1 2,7 1,1 0,1 1,9 0,9 0,8 2,7 1,5 3,0 1,7
Textiles and textile articles 2,8 5,0 2,6 0,6 2,1 3,4 4,2 4,6 3,7 1,1 3,0
Footwear, headgear, umbrellas 0,4 0,2 0,7 0,0 0,3 0,6 0,5 1,0 0,0 0,0 0,4
Articles of stone; ceramic products and glassware 3,5 2,4 2,1 0,1 0,5 0,6 1,2 2,6 0,7 0,1 1,7
Precious stones, precious metals, jewellery 0,5 1,4 1,2 0,0 1,1 0,1 0,9 1,9 3,1 2,0 1,0
Metals and metal products 14,4 8,3 6,9 1,6 12,6 7,0 8,5 7,3 4,1 4,7 8,6
Machinery and equipment 28,2 26,5 12,0 60,9 25,0 47,7 12,8 14,8 6,7 5,2 26,6
Means of transport 4,6 5,2 17,5 0,2 6,0 3,7 25,6 7,4 1,8 3,4 7,5
Measuring and medical devices 2,5 2,3 0,8 6,4 6,4 8,5 0,6 0,6 4,0 6,6 3,6
Arms and ammunition 0,0 0,0 0,0 0,0 0,0 0,1 0,0 0,0 0,0 0,0 0,0
Other industrial goods 11,9 15,0 2,1 3,3 16,4 2,8 3,5 24,0 11,4 8,1 9,5
Works of art, antiques 0,0 0,0 0,0 0,0 0,0 0,2 0,0 0,0 0,0 0,0 0,0
Source: Statistics Estonia

99 Economic overview 2020
Ministry of Economic Affairs and Communications • Ministry of Finance 2021
Annex 3. Import commodity groups by main countries of consignment in 2020 (%) Commodity group Finland Germany Lithuania Sweden Russia Latvia Poland The
Netherlands China UK Total share
Live animals and animal products 2,6 1,3 3,0 2,2 0,3 3,2 4,2 2,4 0,1 1,2 2,2
Vegetable products 1,7 0,7 3,4 1,0 0,6 6,5 1,8 10,5 0,3 0,7 2,6
Animal and vegetable fats and oils 0,2 0,1 0,6 0,2 0,3 0,3 0,3 0,3 0,0 0,0 0,2
Prepared foodstuffs; beverages; tobacco 3,9 4,0 10,7 2,2 0,9 11,5 7,9 7,0 0,6 5,4 5,6
Mineral products 22,1 1,2 19,1 2,9 50,1 7,6 0,5 4,5 0,1 2,5 13,3
Chemical products 5,6 9,4 18,0 6,3 10,6 7,9 14,4 17,6 2,8 11,5 10,0
Plastic and articles thereof, rubber products 4,9 7,9 4,6 5,1 1,2 6,6 8,5 6,7 6,2 5,9 5,6
Leather, fur skins and articles thereof 0,2 0,4 0,2 0,2 0,1 0,2 0,2 0,8 0,6 0,3 0,3
Wood and articles of wood 5,9 0,9 1,6 2,2 14,0 8,2 3,0 0,5 0,6 0,1 4,4
Pulp and articles thereof 3,6 1,1 1,7 3,0 1,3 2,2 1,9 0,7 0,4 2,0 2,0
Textiles and textile articles 2,3 4,8 2,7 3,1 0,8 3,6 5,4 6,4 9,4 5,2 3,8
Footwear; headgear; umbrellas 0,4 1,4 0,5 0,3 0,1 1,2 1,3 0,9 0,7 0,6 0,7
Articles of stone; ceramic products and glassware 1,9 1,5 2,2 0,7 1,8 1,7 3,1 0,5 1,3 0,5 1,7
Precious stones, precious metals, jewellery 0,5 2,5 0,2 0,8 0,3 0,4 0,9 0,2 0,1 0,3 0,7
Metals and metal products 11,6 8,4 5,7 11,3 10,0 8,0 14,0 4,2 8,1 4,1 9,2
Machinery and equipment 22,5 30,2 18,8 23,7 5,1 20,0 15,1 27,1 53,8 42,6 23,0
Means of transport 5,9 17,4 2,5 29,3 1,2 6,2 12,3 3,1 1,9 6,5 9,2
Measuring and medical devices 1,5 4,5 1,2 3,7 0,3 1,0 1,5 4,1 2,2 8,5 2,3
Arms and ammunition 0,0 0,1 0,0 0,0 0,1 0,0 0,0 0,0 0,0 0,1 0,0
Other industrial goods 2,7 2,1 3,2 1,9 0,9 3,7 3,8 2,5 7,0 1,8 2,9
Works of art, antiques 0,0 0,0 0,0 0,0 0,0 0,0 0,0 0,1 0,0 0,1 0,0
Source: Statistics Estonia

100 Economic overview 2020
Ministry of Economic Affairs and Communications • Ministry of Finance 2021
Annex 4. Accommodation by country in Estonia
Number of people Number of overnight stays
2020 Change, % y-o-y
Share, % 2020 Change, % y-o-y
Share, %
Total 1 972 131 -48,0% 100,0% 3 674 012 -47,3% 100,0%
Estonia 1 296 065 -15,6% 65,7% 2 270 210 -12,4% 61,8%
Finland 281 982 -65,0% 14,3% 528 904 -65,0% 14,4%
Latvia 96 995 -47,0% 4,9% 161 427 -42,3% 4,4%
Russia 75 220 -71,1% 3,8% 155 608 -70,1% 4,2%
Lithuania 40 656 -49,2% 2,1% 70 739 -46,4% 1,9%
Germany 30 882 -80,9% 1,6% 87 885 -71,9% 2,4%
UK 15 603 -77,8% 0,8% 44 847 -72,2% 1,2%
Sweden 11 278 -85,6% 0,6% 25 081 -84,5% 0,7%
Poland 9 446 -74,0% 0,5% 25 292 -63,7% 0,7%
Ukraine 8 917 -63,6% 0,5% 42 122 -49,9% 1,1%
France 7 051 -82,9% 0,4% 29 210 -67,0% 0,8%
Italy 6 060 -83,7% 0,3% 15 707 -80,5% 0,4%
USA 5 852 -88,4% 0,3% 18 038 -83,3% 0,5%
Norway 5 716 -83,8% 0,3% 13 314 -83,5% 0,4%
The Netherlands 5 401 -81,1% 0,3% 12 009 -79,3% 0,3%
Spain 4 368 -88,5% 0,2% 11 683 -86,3% 0,3%
Denmark 3 675 -81,9% 0,2% 8 134 -79,6% 0,2%
Japan 2 816 -90,7% 0,1% 6 178 -88,2% 0,2%
Belgium 2 678 -79,9% 0,1% 5 719 -78,5% 0,2%
Switzerland 2 301 -85,0% 0,1% 4 786 -83,8% 0,1%
Austria 2 053 -82,2% 0,1% 5 600 -77,0% 0,2%
Romania 1 645 -68,3% 0,1% 2 952 -74,5% 0,1%
China 1 557 -94,1% 0,1% 3 187 -92,3% 0,1%
Czech Republic 1 528 -84,0% 0,1% 5 697 -77,5% 0,2%
Ireland 1 421 -76,8% 0,1% 3 003 -78,1% 0,1%
Bulgaria 1 283 -63,9% 0,1% 4 805 -30,9% 0,1%
Hungary 1 264 -80,6% 0,1% 4 093 -71,2% 0,1%
Canada 1 017 -86,2% 0,1% 2 515 -85,3% 0,1%
Turkey 952 -85,3% 0,0% 3 384 -77,6% 0,1%
Slovakia 937 -74,1% 0,0% 4 751 -42,2% 0,1%
Australia 909 -90,9% 0,0% 2 050 -90,6% 0,1%
Greece 870 -85,4% 0,0% 2 509 -80,0% 0,1%
Portugal 836 -83,4% 0,0% 2 768 -74,3% 0,1%
Luxembourg 771 -50,0% 0,0% 1 529 -51,4% 0,0%
Slovenia 550 -80,6% 0,0% 1 154 -81,9% 0,0%
Brasil 467 -88,1% 0,0% 1 776 -79,6% 0,0%
Cyprus 459 -74,1% 0,0% 1 030 -77,9% 0,0%
Island 455 -77,1% 0,0% 873 -81,6% 0,0%
Croatia 396 -81,6% 0,0% 1 977 -61,3% 0,1%
South-Korea 310 -97,7% 0,0% 728 -96,1% 0,0%
Malta 291 -71,8% 0,0% 631 -76,8% 0,0%
Albania 104 -81,3% 0,0% 189 -87,5% 0,0%
South Africa 95 -89,3% 0,0% 202 -92,0% 0,0%
Other 38 999 -63,6% 2,0% 79 716 -62,0% 2,2%
Source: Statistics Estonia

101 Economic overview 2020
Ministry of Economic Affairs and Communications • Ministry of Finance 2021
Authors
Editor-in chief Mario Lambing 625 6387 [email protected]
Macroeconomic situation Irina Bõtškova (Ministry of Finance) Madis Aben (Ministry of Finance) Kristjan Pungas (Ministry of Finance) Margus Täht (Ministry of Finance) Erki Lõhmuste (Ministry of Finance)
[email protected] [email protected] [email protected] [email protected] [email protected]
Foreign trade Manufacture of electronic and electrical equipment Information and communication
Maris Paumets 625 6401 [email protected]
Manufacture of food and beverages Textile industry Manufacture of wearing apparel Wood processing Manufacture of pulp, paper and paper products Furniture industry Domestic trade
Karel Lember 625 6402 [email protected]
Manufacturing industry Manufacture of chemicals and chemical products Manufacture of rubber and plastic products Manufacture of metal and metal products Manufacture of machinery and equipment Manufacture of transport equipment Tourism
Mario Lambing 625 6387 [email protected]
Construction sector
Teet Kukk 625 6399 [email protected]
Transport
Triin Orav 625 6459 [email protected]