overview of financial management - cengage the meaning of financial management. 2 ... computech...
TRANSCRIPT

NEL
Learning ObjectivesAfter reading this chapter, you should be able to:
1 Learning Objective
Define the meaning of financial management.
2 Learning Objective
Identify the individuals responsible for the finance function.
3 Learning Objective
Explain the four financial objectives.
4 Learning Objective
Comment on the three major types of business decisions.
5 Learning Objective
Discuss issues related to corporate transparency and accountability.
Chapter OutlineWhat Is Financial Management?Who Is Responsible for the Finance Function?Financial ObjectivesBusiness DecisionsCorporate Transparency and Accountability
C H A P T E R11[OVERVIEW OF FINANCIAL MANAGEMENT]
01ch01.indd 201ch01.indd 2 1/25/10 9:53 AM1/25/10 9:53 AM

NEL 3
After spending ten years with different organizations, Len and Joan Miller decided to open their own retail business, CompuTech Sales and Service. While Len had worked for several computer retail stores, Joan was employed as a sales representative for a multinational com-puter organization. Both felt that their combined experience would prove to be a valuable asset for succeeding in their new venture.
However, before making their final decision, they decided to speak to a long-time friend and entrepreneur, Bill Murray, who had operated his own very successful retail business for the past 25 years. The intent of the meeting was to obtain some advice before launching their business. The following summarizes Bill’s comments:
The two most important factors for any business to be successful are prod-ucts/services and management. There must be a demand for the products or services that you want to sell, and you must possess management skills (e.g., planning, organizing, leading, and controlling) and business skills (e.g., merchandising, pricing, sales, and promotion) if you are to realize your vision and objectives. You will also need operating and financial informa-tion to enable you to gauge the results of your ongoing business decisions. Although an accountant will help you set up your bookkeeping and accounting systems, you have to make sure that you have the ability to analyze your financial statements. Not being able to read financial state-ments is much like being a racing car driver who is unable to read the instruments on his dashboard. Like these instruments, financial statement analysis will help you see how well your business has done and, most impor-tantly, what decisions you need to make to improve the financial performance of your retail operations.
To succeed, your business will have to generate a healthy profit (effi-ciency) and be able to pay its bills on time (liquidity). In addition, your business must show signs of continuous growth in all segments, such as revenue and profit (prosperity). Be sure that you do not overburden your business with too much debt (stability).
You will always be faced with three types of business decisions. The first are investing decisions, such as launching your business. This is not the only investing decision that you will make. If your business prospers, you will be faced with a series of investing decisions such as expanding your business, opening up new retail outlets, buying equipment for your business, and so on. Operating decisions are the second type of business decisions. They have to do with day-to-day operations. You will be continually faced with decisions such as pricing, advertising, hiring new employees, office expenses, and so on. Through your budgeting exercise, you will have to ensure that you keep your operating costs as low as possible in order to maximize your profit (efficiency). The third type is financing decisions. Once you know exactly how much it will cost you to start your business, you will have to approach investors such as lenders for financial support. These
O P E N I N G C A S E
01ch01.indd 301ch01.indd 3 1/25/10 9:54 AM1/25/10 9:54 AM

NEL
4 CHAPTER 1 Overview of Financial Management
different sources of financing bear a cost. You have to make sure that your business generates enough profit (return) to pay for financing your business (cost).
Len and Joan were enlightened by Bill Murray’s comments and were convinced that if they put his suggestions into practice, they would stand a good chance of realizing their dream.
Chapter OverviewFinancial management has undergone major changes during recent decades. Initially, finance consisted mainly of raising cash to purchase the assets a business needed. This was understandable because, when finance emerged as an organizational func-tion back in the 1920s, financial management focused almost exclusively on legal matters: acquisitions, corporate offerings, mergers, formation of new businesses, reorganizations, recapitalizations, bankruptcies, and business consolidations. Finance concentrated mostly on the external activities of a business, such as raising cash, rather than on internal activities, such as finding methods to allocate cash effectively within a business. Originally, activities such as cost accounting, credit and collection, budgeting, financial planning, financial accounting, management of working capital, and capital budgeting including risk analysis were not an important part of the manager’s “tool kit.” Only in the past several decades has attention been turned to developing analytical and decision-making techniques geared to assist managers in improving the effectiveness of their operating, financing, and investing decisions. Put simply, in the beginning, more attention was devoted to managing one segment of the statement of financial position: raising money from lenders and shareholders.
Today, although the management of raising money from investors is still considered important, financial management has focused increasingly on the other segment of the statement of financial position (finding ways to manage more efficiently all assets of a business, such as inventories, trade receivables, and cash, and on improving the productivity of assets). Finance has assumed unprecedented importance as a manage-ment function. Today, improving a company’s bottom line (profit or earnings) is a major managerial challenge. Here are some of the reasons.
First, on the economic front, the recessions of the early 1980s and the early 1990s were considered by many economists to be deeper and broader than any other down-turns experienced since the Great Depression. As a result, the cost of operating businesses came under intense scrutiny. During the 1980s, managers began to realize that the North American economy was not only undergoing another shift in the business cycle, but also that it had reached a certain level of maturity. Managers began to downsize their organizations in an effort to make them more efficient, responsive,
01ch01.indd 401ch01.indd 4 1/25/10 9:54 AM1/25/10 9:54 AM
Chapter Overview 5
NEL
and productive. Today, businesses are again facing extraordinary challenges in view of the slowdown in economic activity. As a result of the acute slump in world econo-mies, many governments (e.g., Canada, the United States, the United Kingdom, Germany) are now helping (through “stimulus packages”) financial institutions, car industries, housing industries, and other sectors of the economy in order to stimulate economic growth. In the meantime, many businesses are employing cost-cutting measures (e.g., closing plants, cutting back on production, laying off workers, reducing wages) in order to sustain their operating activities at a reasonable profit level.
Second, on the political side, governments began to open their national borders and push business strategies to fashion their companies and industries to be leaders in world markets. Both the Free Trade Agreement, which was implemented in 1989, and the North American Free Trade Agreement, which took effect in 1994, forced managers to rethink their cost structure, improve their manufacturing capabilities, and sharpen their international marketing strategies.
Third, with more global and open world economies, companies were forced to make structural changes to their organizations (removing organizational layers and introducing cross-functional teams and boundaryless, virtual, and network organiza-tions) in order to make them more responsive to market demand.
Fourth, technological changes have compelled managers to alter their company’s operations dramatically by producing new and/or better products or services, reducing their operating costs, modifying the size of their plants, and integrating operating activities. Technological change is taking place in all sectors of organizations, such as manufacturing (e.g., reengineering), administration (e.g., office automation), com-munication (e.g., information technology), and the increasing use of the Internet (e.g., websites to advertise and promote products and services).
Fifth, the product life cycle is now measured not in years, but in months. Whenever a company introduces a product or service into the market, “time risk,” that is, the number of months or years it should take a company to recover its investment, has to be measured in order to determine a price structure that is acceptable.
Sixth, on the manufacturing side, managers have to not only find more innovative ways to produce their goods and provide services more efficiently, but also be con-cerned about quality objectives. Many Canadian firms have turned to total quality management (the Six Sigma, for example, which is a highly technical method used by engineers and statisticians to fine-tune products and processes) to gauge the quality of their products and services against world standards with a goal of near-perfection in meeting customer satisfaction. Today, many companies are getting certification from the International Organization for Standardization (ISO), which is an organization that develops and publishes standards that facilitate the interna-tional exchange of goods and services and assures constancy in quality management and quality assurance throughout the world. Companies are subscribing to the ISO certification because, increasingly, customers want them to do so. The ISO
01ch01.indd 501ch01.indd 5 1/25/10 9:54 AM1/25/10 9:54 AM

NEL
6 CHAPTER 1 Overview of Financial Management
accreditation also makes it easier for companies to improve their chances of success on world markets by using the ISO certificate in their advertising programs and publications.
All these changes are putting a strain on the company’s bottom line. And now, when organizational managers make operating, financing, and investing decisions, they have to gauge how these decisions affect their bottom line.
This chapter examines five key topics. The first topic focuses on the importance of financial management. We will learn that the fundamental role of financial manage-ment is to “manage” and “control” money and money-related matters within a business.
The second topic gives the profiles of individuals who are responsible for the finance function. We will learn that although the treasurer and the controller (both reporting to the chief financial officer, or CFO), play a key role in the management and control function of money, operating managers also play an important task in financial management as they are the ones who make critical business decisions. They are the ones who are responsible for the production, marketing, research and development, engineering, and administration functions, where key decisions affecting an organization’s bottom line are made. Here are typical examples of such decisions:
• Should we increase our selling price?• Should we spend more money on modernizing and/or buying new
equipment?• Should we hire more employees?• Should we spend more money in research and development?• Should we increase our advertising budget?
The third topic of this chapter pinpoints the four financial objectives. We will learn that all types of organizations (small and large, for-profit and not-for-profit, manufac-turing and service) want to be efficient (generate a reasonable profit). They also want to be liquid in order to pay their bills on time. Also, all organizations want to prosper, that is, continue to grow in terms of revenue and profitability, and pay dividends to their shareholders. Finally, they want to be stable, that is, not bear a disproportionate amount of debt.
The fourth topic explores three basic types of business decisions. As shown on the right side of Figure 1.1, the first one has to do with operating decisions, that is, making sure that a company’s bottom line is kept healthy. This is accomplished by ensuring that operating costs are maintained at a minimum level. Managers are also responsible for keeping their inventories and trade receivables at minimum levels. As shown in the figure, operating decisions will be examined in Chapter 5 (Profit Planning and Decision-Making); this chapter looks at how much revenue a business must earn when making decisions related to their operations (e.g., hiring more employees, changing the selling price, or spending more money in an advertising
01ch01.indd 601ch01.indd 6 1/25/10 9:54 AM1/25/10 9:54 AM

Chapter Overview 7
NEL
campaign) before making a profit. Chapter 6 (Working Capital Management) exam-ines how current asset and current liability accounts shown on the statement of financial position should be managed in order to improve its cash conversion cycle. Chapter 7 (Planning, Budgeting, and Controlling) describes the importance of plan-ning, budgeting, and controlling management functions and how plans, budgets, and projected financial statements are prepared. The second type of business decisions has to do with financing. All companies need money in order to function. Business man-agers can raise money from lenders and shareholders. As we will see in Chapter 8 (Sources and Forms of Financing), money can be obtained from different sources or institutions such as commercial banks, investment bankers, mortgage companies, and venture capitalists. Money also comes in different forms such as mortgages, bonds, common shares, and lease financing. Chapter 9 (Cost of Capital, Capital Structure, and Financial Markets) looks at the cost of raising money from these different insti-tutions and explores how much debt a company should have compared to equity. The third type of business decision has to do with investing, that is, the acquisition of non-current assets such as the purchase of equipment or a business, the construction of a new plant, or the modernization of an existing one. As shown in Figure 1.1, investing decisions will be covered in three chapters. Chapter 10 (Time Value of Money Concepts) looks at the reasons managers should not count the cash earned in the future on a new project before it is discounted. Chapter 11 (Capital Budgeting) explores different time value of money yardsticks that can be used to gauge the viability or profitability of capital expenditure projects. Chapter 12 (Business Valuation) looks at different approaches for putting a price tag on an ongoing business.
The fifth and last topic examines “ways” and “means” that businesses and govern-ment organizations are putting in place to prevent individuals and organizations from carrying out fraudulent activities. We have all read and heard about corporate scandals
Figure 1.1 Business Decisions and Organization of This Text
Chapter 1 Overview of Financial Management
Chapter 2 Accounting and Financial StatementsChapter 3 Statement of Cash FlowsChapter 4 Financial Statement Analysis
Chapter 5 Profit Planning and Decision-MakingChapter 6 Working Capital ManagementChapter 7 Planning, Budgeting, and Controlling
Chapter 8 Sources and Forms of FinancingChapter 9 Cost of Capital, Capital Structure, and Financial Markets
Chapter 10 Time Value of Money ConceptsChapter 11 Capital BudgetingChapter 12 Business Valuation
Accounting, Financial Statements, and Ratio Analysis
Operating Decisions
Financing Decisions
Investing Decisions
01ch01.indd 701ch01.indd 7 1/25/10 9:54 AM1/25/10 9:54 AM

NEL
8 CHAPTER 1 Overview of Financial Management
dating back to the 1990s, from Bre-X Minerals to Enron Corp., WorldCom, Arthur Andersen, Hollinger International (Conrad Black), and the more recent Bernard L. Madoff of Investment Securities. Techniques and practices to make individuals and organizations more transparent and accountable that will be covered in this section include government legislation, corporate governance, corporate culture (business ethics), and global accounting and financial standards via the International Accounting Standards Board (IASB)’s1 International Financial Reporting Standards (IFRS). The objective of this organization is to harmonize and converge different generally accepted accounting principles (GAAP) developed in various countries over the past decades. Both the IASB and the International Organization of Securities Commissions (IOSCO) are working together to move toward global convergence where more than 100 countries have to date converged or are on a path to converge. In the News 1.1 gives an illustration of the difficulty that may arise from different accounting organizations regarding ways of presenting information in finan-cial statements.
In The News [1.1]
Which Method Is More Accurate to Value Assets: Judgment or Market Prices?
Every time changes are announced, there are individuals or interest groups that are for the change, and others against. The changes regarding the global accounting standards announced by the IASB are no exception!
An important piece of this change has to do with the way that capital assets are presented on finan-cial statements. Everyone now has an opinion, including politicians, bank lobbyists, Wall Street, bank regulators, economists, Securities Commissions, lawyers, the U.S. Congress, Bay Street, and Canadian accounting firms. Even some Canadian interest groups and U.S. interest groups do not see eye to eye with the new accounting regulations. Some say that some new accounting rules will weaken the banking system while others say that the “fair-value,” or “mark-to-market” accounting system is the most correct and objective way to price assets. Who is right on these issues?
Source: Adapted from Duncan Mavin and Eoin Callan, “Accounting boards call U.S. changes ‘crazy,’” Financial Post, April 21, 2009, p. FP3. For updates on the IFRS, visit www.iasb.org/IFRSs/IFRS.htm.
What Is Financial Management?Financial management ensures that a company uses its resources in the most efficient and effective way: maximizing the profit (or earnings) generated by a business, which ultimately increases the value of a business (its net worth or equity). What was called finance in the past is now referred to as financial management, reflecting the current emphasis on the importance of having all managers in a business participate in making
1. For recent updates on the work accomplished by the IASB, visit the website, www.iasb.org.
International Accounting Standards Board (IASB)Organization that develops, in the public interest, a single set of high-quality, understandable, and enforceable global standards that require transparent and comparable information in general-purpose financial statements.
International Financial Reporting Standards (IFRS)Accounting standards issued by the IASB.
1 Learning Objective
Defi ne the meaning of fi nancial management.
01ch01.indd 801ch01.indd 8 1/25/10 9:54 AM1/25/10 9:54 AM

What Is Financial Management? 9
NEL
important decisions that affect the financial destiny of their respective organizational units and the company as a whole.
Financial management deals with two things: first, raising funds, and second, buying and utilizing assets in order to gain the highest possible return. An important objective of financial management is to ensure that the assets used in business produce a return that is higher than the cost of borrowed funds. For example, if an individual borrows money from a bank at 6% and lends it to a friend, he would certainly lend it for more than 6%. Using this example, we have two transactions. First, the indi-vidual borrows money from a bank, and second, lends it to a friend in the form of an investment. Businesses function in the same way. Managers borrow money from lenders and invest it in business assets for the purpose of earning a profit.
It would be pointless for a business to raise funds from investors at a cost of 10% and invest them in assets (i.e., a project) that generate only 7%. As shown in Figure 1.2, the objective of financial management is to ensure that the return on assets (ROA) gener-ated by a business (here, 10%) is higher than the cost of money borrowed from investors—that is, lenders and shareholders (here, 7%). This figure shows that the state-ment of financial position has two sides. On the left, it lists assets such as non-current assets (e.g., cars, buildings, equipment), and current assets (e.g., inventories, trade receiv-ables) that a business owns; on the right, the money raised from investors such as equity (shareholders), non-current liabilities (long-term borrowings), and current liabilities. Here is how the 10% and 7% figures were calculated. If the business invests $100,000 in assets (left side) and generates $10,000 in profit from its revenue, it will have earned 10% ($10,000 ÷ $100,000). If the business borrows the $100,000 from different sources such as commercial banks, term lenders, and mortgage companies and pays $7,000 in interest, the cost of financing would therefore be 7% ($7,000 ÷ 100,000).
In the main, financial management focuses on five important questions:
1. How are we doing? Everybody wants to know about a company’s financial performance: managers, short- and long-term lenders, shareholders, suppliers, etc. They want answers to the following questions: Is the
Financial managementActivity involved in raising money and buying assets in order to obtain the highest possible return.
Figure 1.2 Relationship between ROA and Cost of Financing
Statement of Financial Position
Assets• Non-current assets• Current assets
Equity and Liabilities• Equity• Non-current liabilities• Current liabilities
InvestorsCost of financing
7%
Return on assets
10%
01ch01.indd 901ch01.indd 9 1/25/10 9:54 AM1/25/10 9:54 AM

NEL
10 CHAPTER 1 Overview of Financial Management
company profitable? How about the return on its assets? Is the company efficient and keeping its costs under control? Is the company adding value for its shareholders? As we will see in later chapters, a company’s financial statements provide answers to these questions and help managers find ways to maximize profitability.
2. How much cash do we have on hand? Knowing how much cash a company has on hand is important to determine its liquidity and its ability to pay its bills on time. Here are typical questions related to liquidity issues: Can the business meet its payroll? Pay its suppliers on time? Service its line of credit or seasonal loan? How much cash can be generated internally, that is, from the business itself, within the next 12 months? Managers must know how much cash the company has on hand now and how much it will have in the future in order to determine how much it will need to borrow from external sources such as lenders and shareholders.
3. What should we spend our money on? Money can be spent on (a) operating activities such as salaries, advertising, freight, promotions, and insurance, including current assets such as inventories and trade receivables; and (b) investing activities, that is, non-current assets such as property, plant, machinery, and equipment. Managers must determine whether the money that will be spent on non-current assets for automation and expansion will generate a ROA that is higher than the cost of financing, and equally important, compensate for the risk. Because money can be invested in different projects bearing different risk levels, the return to be earned from various capital investments must therefore show different economic values. For example, managers may accept an 8% return on a project that bears a low risk and will not approve one even if it generates 15% because of higher risks.
4. Where will our funds come from? Once managers have identified how much money the business needs and how much cash it has on hand, they have to determine where cash can be obtained in the future. Suppliers? Bankers? Long-term investors such as shareholders, venture capitalists, or insurance companies?
5. How will our business be protected? One of the most important responsibilities of managers is to protect the investors’ interests. It is important to recognize that managers are employed by shareholders and should therefore act on their behalf. However, managers have to reconcile the legitimate and sometimes conflicting objectives of various interest groups (e.g., unions, lenders, employees, customers, suppliers, communities, and government agencies). Because shareholders have a unique and legal status, managers must ensure that their interests are not compromised and that they are clearly protected.
01ch01.indd 1001ch01.indd 10 1/25/10 9:54 AM1/25/10 9:54 AM

Who Is Responsible for the Finance Function? 11
NEL
It is important to note that the downfall of companies like Enron Corp. and WorldCom were not due only to accounting errors, but instead, largely due to accounting irregularities, manipulation of books, misrepresentation, and fraudulent activities.
Since the start of this chapter, we have mostly referred to businesses. It should be noted that effective financial management should be performed not only in for-profit enterprises but also in all types of not-for-profit (NFP) organizations such as hospitals, colleges, churches, and universities. As will be explained in this text, NFP organizations also publish financial statements such as the statement of income, the statement of financial position, and the statement of cash flows. All organizations have assets, liabili-ties, revenue, and expenses. There are, however, variations in terminology for a for-profit enterprise’s statement of financial position and statement of income accounts versus that for an NFP. The CICA Handbook—Accounting sets out the applicability of accounting principles and financial statements to NFPs. For example, financial state-ment concepts and generally accepted accounting principles have general applicability for NFPs, while differential reporting has limited or no applicability. Also, current assets and current liabilities have general applicability, while income tax expense, goodwill, and share capital have limited or no applicability to NFPs.
Self-Test Exercise 1.1ROA and Cost of Financing
Len and Joan intend to invest $200,000 in a business to launch their CompuTech Sales and Service retail store. Their financial projections show that during the first year of operations CompuTech would generate $25,000 in profit with substantial increases during the following years. To finance their busi-ness, Len and Joan would obtain $100,000 for different loans (short-term and long-term borrowings) from the bank at 6% (after taxes) and invest $100,000 of their savings into the business. The Millers are currently earning 8% (after taxes) on their savings.
Questions
1. With the above information, calculate CompuTech’s ROA and its cost of financing their new retail business.
2. Should the Millers launch their business? Why or why not?
Who Is Responsible for the Finance Function?Figure 1.3 shows the basic structure of a company’s organization. In corporations, the owners are the shareholders. However, because there are numerous owners, few of them are involved in managing the business. So shareholders elect a board of directors to oversee the business and approve the major decisions affecting the organization, subject to corporate charter and bylaw provisions. The authority
2 Learning Objective
Identify the individuals responsible for the fi nance function.
01ch01.indd 1101ch01.indd 11 1/25/10 9:54 AM1/25/10 9:54 AM

NEL
12 CHAPTER 1 Overview of Financial Management
vested in the board of directors is assigned to a chief executive officer (CEO). This person is personally accountable to the board and to the shareholders for the company’s performance. The CEO is usually the president or the chair of the board of directors and is probably the single most important individual in any organization. The CEO plays a major role in the complete management process and is responsible for the formulation of the strategic plans and seeing that they are effectively implemented.
The chief financial officer (CFO) and the vice-presidents report to the CEO. The CFO is the executive in charge of the finance function and is responsible for all accounting functions and external activities. The title vice-president of finance is sometimes used instead.
The finance activities are carried out by the controller, the treasurer, and operating managers. As shown in Figure 1.3, both the controller and the treasurer report to the chief financial officer.
CONTROLLERThe controller establishes the accounting and financial reporting policies and pro-cedures; maintains the accounting, auditing, and management control mechanisms; and analyzes financial results. Together with operating managers, the controller pre-pares annual budgets and financial plans and determines financial objectives and standards to ensure efficiency and adequate returns. This controllership function has to do with how funds are expensed and invested to satisfy consumer needs and share-holder interests.
TREASURERThe treasurer—that is, the person responsible for raising funds—looks after inves-tors, plans investment strategies, analyzes tax implications, and gauges the impact of internal and external events on a firm’s capital structure, or the relationship between liabilities and equity. The treasurer also regulates the flow of funds, determines
Chief executive officer (CEO)Person who plays a major role in the complete management process and is responsible for the formulation of the strategic plans and seeing that they are effectively implemented.
Chief financial officer (CFO)Person in charge of the finance function and responsible for all accounting functions and external activities.
ControllerPerson responsible for establishing the accounting and financial reporting policies and procedures.
TreasurerPerson responsible for raising funds and regulating the flow of funds.
Figure 1.3 Responsibility of Financial Management
Board of Directors
Controller Treasurer Operating Managers
CEO
CFO V.P. Marketing V.P. Production V.P. Human Resources
01ch01.indd 1201ch01.indd 12 1/25/10 9:54 AM1/25/10 9:54 AM

Who Is Responsible for the Finance Function? 13
NEL
dividend payments, recommends short- and long-term financing strategies, and cultivates relations with investors. In short, the treasurer is responsible for the lia-bility and shareholder equity accounts shown on the statement of financial position.
Table 1.1 shows a list of typical activities of the finance function under the jurisdic-tion of the controller (controllership functions) and the treasurer (treasury functions).
OPERATING MANAGERSFinancial management is also a responsibility of operating managers (managers responsible for line and staff functions) in various organizational units such as mar-keting, manufacturing, human resources, research and development, and general administration. As shown in Figure 1.3, these managers report to various vice-presidents (marketing, production, human resources, etc.) and are responsible for analyzing operating and financial data, making decisions about asset acquisitions, and improving the operating performance of their respective organizational units and of the company as a whole.
People often think of finance as a function performed only by accountants, book-keepers, treasurers, controllers, or financial analysts. Although these people play a key role in financial management and in the financial planning process, all managers are accountable for their decisions as they may impact, directly or indirectly, the financial performance of their business unit or organization.
A business is much like an aircraft—someone has to pilot it. In an aircraft, a pilot is responsible for analyzing various instruments on the dashboard to make sure that the flight will run smoothly, from takeoff to landing. For a business establishment, an operating manager is responsible for managing or piloting it, and the instruments
Operating managersPerson in charge of organizational units such as marketing, manufacturing, and human resources, and responsible for making operating and investing decisions.
Table 1.1 The Functions of the Controller and the Treasurer
Functions of the Controller Functions of the Treasurer• General accounting • Raising capital• Cost accounting • Investor relations• Credit and collection • Short-term borrowings• Management information system • Dividend and interest payments• Trade and other payables • Insurance• Corporate accounting • Analysis of investment securities• Internal auditing • Retirement funds• Budgets and analysis • Property taxes• Payroll • Investment portfolio• Systems and procedures • Cash flow requirements• Planning • Actuarial• Controlling • Underwriting policy and manuals• Interpreting financial reports • Tax administration
01ch01.indd 1301ch01.indd 13 1/25/10 9:54 AM1/25/10 9:54 AM

NEL
14 CHAPTER 1 Overview of Financial Management
used to steer the business are financial statements. These financial statements reflect how well a business has done in the past and, based on goals and plans, how well it will perform in the future.
Business decisions of all types cut across all business functions such as marketing, manufacturing, administration, human resources, research and development, and after-sales services. Operators of businesses make many of these decisions on a daily basis. For example, some of these decisions may include the hiring of an employee, increasing the selling price of one or two product lines or services, cutting back some operating expenses, adding a bigger share of the budget to promotion and advertising, buying new equipment in order to make the business more efficient, and providing a better service to customers. These decisions have one thing in common: They impact on a business establishment’s financial performance (statement of income) and financial structure (statement of financial position). These two financial documents inform operators of business establishments about the outcome of their decisions. Operating managers who have difficulty reading or interpreting financial statements are unable to effectively gauge how well their business has done, is currently doing, or will do in the future.
An aircraft pilot is in the best position to control his airplane (whether it is a small or large aircraft) for three reasons.
• He understands his operating environment.• He knows exactly where he wants to go.• He has an appreciation about what needs to be done in order to reach his
destination.
An aircraft pilot does not delegate this most important activity. He may ask for advice or help, but in the end, he makes critical decisions based on his analysis and the input of others. The same should apply for businesses. It is the operating manager (CEO, vice-presidents, directors, managers) who is ultimately responsible for making important decisions and for determining the financial destiny of an organizational unit or business as a whole.
Operating managers are often tempted to hand over the analysis of financial state-ments to others, such as accountants or business consultants, because of their lack of understanding of accounting and finance. If accountants and business consultants don’t have a crisp understanding or appreciation of an operator’s business environ-ment and operating functions, they risk making decisions that may be damaging to the financial health of the business.
Finance is a business function that is far too important to be left only to financial specialists or consultants. It is important that all managers (top, middle, or first-level) responsible for resources or budgets become familiar with the language of finance and with the different tools available for analyzing business performance and making vital business decisions. A manager who lacks these skills will not be in a position to con-tribute fully and effectively to improving the operational and financial performance of his business unit and that of the organization.
01ch01.indd 1401ch01.indd 14 1/25/10 9:54 AM1/25/10 9:54 AM

Financial Objectives 15
NEL
Financial ObjectivesAs mentioned earlier, finance involves “handling money.” There is no question that all organizations—small or large, public or private, manufacturing or service, govern-ment agencies or Crown corporations, for-profit or NFP—need money to function. All these organizations have this in common: They want to be efficient, they need to be liquid in order to pay their current bills on time, they do their best to prosper, and they want to secure a certain level of stability. These are the four most important financial objectives. Let’s examine these four objectives.
EFFICIENCYEfficiency means the productivity of assets, which is the relationship between the profit generated and assets employed. In the language of finance, this is referred to as ROA, return on equity, and return on revenue (ROR). The objective of any organization is to ensure that a business’s resources are used efficiently to produce an acceptable return. High profits satisfy investors and indicate that the assets of an organization are working hard. The more profit a business earns, the more cash it can invest in operations to finance its growth and to purchase non-current assets such as machinery and equipment. The notion of efficiency applies to not only for-profit enterprises but also NFP organizations; churches, hospitals, colleges, and universities want to ensure that they use their resources efficiently. If organizations can save money by using their resources wisely, more money will be available to invest in their organizations. When an organization deducts all costs from its revenue, businesses call this “profit” while a NFP organization may choose to call it a “surplus” or “excess of revenues over expenses.”
Let’s examine the meaning of efficiency. Figure 1.4 shows a business that gener-ates $100,000 in revenue and earns $8,000 in profit. As shown, the company is earning $0.08 (or 8.0% of revenue) for every revenue dollar. If another business generates $10,000 in profit with the same amount in revenue, it may very well mean that it is more efficient; it will be earning $0.10 for every revenue dollar.
3 Learning Objective
Explain the four fi nancial objectives.
EfficiencyThe relationship between profit (outputs) generated and assets employed (inputs).
Figure 1.4 Return on Revenue
Revenue
Cost of sales
Gross profit
Other costs
Profit before taxes
Income tax expense
Profit for the year
100,000
(70,000)
30,000
(15,000)
15,000
(7,000)
8,000
Statement of Income(in $)
100.0
(70.0)
30.0
(15.0)
15.0
(7.0)
8.0
%
Retu
rn o
n Re
venu
e
01ch01.indd 1501ch01.indd 15 1/25/10 9:54 AM1/25/10 9:54 AM

NEL
16 CHAPTER 1 Overview of Financial Management
Let’s now explore what this business can do with the $8,000 of profit or $0.08 for each revenue dollar. This is commonly referred to as return on revenue. As shown in Figure 1.5, this $8,000 could be reinvested in the business through retained earnings (say, $5,000 or $0.05). Retained earnings simply means the amount of money that will be kept by the business for reinvestment purposes. As shown in Figure 1.5, the company will invest $3,000 or $0.03 in non-current assets to purchase, for example, equipment and machinery, and $2,000 or $0.02 for every revenue dollar in current assets, or working capital accounts such as trade receivables and inventories (for day-to-day operating purposes). The balance of the cash ($3,000 or $0.03) will be used for external purposes. Here, the shareholders would receive $2,000 in dividends or $0.02 to compensate for the invest-ment they have made in the business, and $1,000 or $0.01 will be used to repay the principal on the debt. The bottom line is this: If the $8,000 or $0.08 ROR begins to shrink to, say, $6,000 or even $3,000, the company will have less money to invest inter-nally to help its growth, to invest in assets, and to satisfy its shareholders.
LIQUIDITYLiquidity is a company’s ability to meet its short-term financial commitments. If a business increases its revenue, it will inevitably increase its working capital accounts such as inventories, trade receivables, and cash required for paying its employees, sup-pliers, and creditors on time. As shown in Figure 1.5, $2,000 or $0.02 for each revenue dollar is invested in such working capital accounts. If a business wants to grow but shows a reduction in its ROR performance (say, less than $0.08 per revenue dollar), it will have less cash from internal operations (retained earnings) to invest in working capital accounts, and may have to rely on short-term borrowings in order to keep growing. As a consequence, additional borrowings reduce a company’s profit (because of increased finance costs) and further reduce its ROR.
LiquidityAbility of a firm to meet its short-term financial commitments.
Figure 1.5 Return on Revenue Objective
Return on revenue$8,000 or $0.08
Internal use(retained earnings)
$5,000 or $0.05
External use$3,000 or $0.03
Current assets$2,000 or $0.02
Non-current assets$3,000 or $0.03
Dividends$2,000 or $0.02
Debt reduction$1,000 or $0.01
01ch01.indd 1601ch01.indd 16 1/25/10 9:54 AM1/25/10 9:54 AM

Financial Objectives 17
NEL
PROSPERITYProsperity means growth in all segments of a business: revenue, profit, dividend pay-ments, non-current assets, equity, and working capital. If a company’s ROR deteriorates, it may not be able to finance its growth through internally generated cash. Consequently, it would have difficulty investing in non-current assets such as equipment and machinery in order to expand its operations and improve its productivity (as shown in Figure 1.5, an amount of $3,000 or $0.03 for each revenue dollar is invested in non-current assets). Again, if the organization wants to invest in these types of assets, it may have to borrow (if internally generated cash is insufficient) from long-term lenders and shareholders to finance the purchase of non-current assets.
STABILITYStability refers to the financial structure of a business. Here, financial management ensures equilibrium between the cash provided by creditors and that provided by shareholders (relationship between debt and equity). If a business continues to borrow from lenders, it may have a high debt-to-equity ratio and as a result may not be able to meet its short- and long-term debt obligations, particularly if there is a slowdown in business activities caused by economic conditions. If the company’s ROR is adequate, it will have enough cash (as shown in Figure 1.5, an amount of $3,000 or $0.03 for each revenue dollar is used for external activities) to pay dividends ($2,000 or $0.02 for each revenue dollar) and reduce the principal on its debt ($1,000 or $0.01 for each revenue dollar). If the company does not produce an adequate ROR, again it may have to borrow more from lenders and consequently produce a negative effect on its stability.
The bottom line is this: If a company wants to maintain or improve its stability, it must never lose sight of the first objective, to earn a suitable return on revenue. If suc-cessful, profit (or retained earnings) can be used to increase working capital and to purchase non-current assets (if required), to pay dividends, and to reduce debt without relying too extensively on debt financing.
Self-Test Exercise 1.2Distribution of Profit
Len and Joan want to reinvest 70% of their $25,000 profit (see Self-Test Exercise 1.1 on page 11) in their business and use the rest to pay the principal on their loan. They expect to invest 50% of the reinvested earnings in working capital and 50% in non-current assets. CompuTech’s 2009 revenue is estimated to be $350,000.
Question
On the basis of the above information, calculate, as a percentage of revenue, how much the Millers would keep in the business for growth purposes (i.e., working capital and the purchase of non-current assets), and how much would be used to pay off the principal on their loan.
ProsperityThe ability of a firm to grow (i.e., revenue, profit, equity).
StabilityRelationship between debt and equity.
01ch01.indd 1701ch01.indd 17 1/25/10 9:54 AM1/25/10 9:54 AM

NEL
18 CHAPTER 1 Overview of Financial Management
Business DecisionsFigure 1.6 shows the three major types of business decisions made by managers: oper-ating decisions, financing decisions, and investing decisions. For example, if managers want to invest $1.0 million in non-current assets (investing decisions), the cash required to purchase these assets would be provided by (1) internal activities (oper-ating decisions) and (2) external activities (financing decisions). First, managers provide internal cash through operating decisions (profit for the year shown on the statement of income and improvement in the management of current asset and current liability accounts shown on the statement of financial position); second, shareholders and long-term lenders, through financing decisions, provide external funds. As shown in Figure 1.6, if the company provides $500,000 from internal operations and is able to obtain the rest from investors ($500,000), the $1.0 million in non-current assets (investing decisions) would be financed equitably.
The ideal situation is to finance, to the maximum, the purchase of non-current assets with internally generated cash. For example, if the company purchases the assets ($1.0 million) with $800,000 of internally generated cash, it would rely less on external financing and be able to enhance its financial stability.
Internal financing is provided from retained earnings—that is, the profit gener-ated by the business—plus the depreciation/amortization that appears on the statement of income as a non-cash expense2—and by reducing current asset accounts such as trade receivables and inventories. In Figure 1.6, the box representing working capital (current assets and current liabilities) is shaded because managers can obtain cash only
2. The notion of depreciation/amortization being considered a non-cash expense is explained in Chapter 2 on page 65.
4 Learning Objective
Comment on the three major types of business decisions.
Internal financingCash provided from retained earnings, depreciation/amortization, and a reduction in working capital accounts.
Figure 1.6 Business Decisions
Investing Decisions
Operating Decisions
InternalFinancing$500,000
(managers)
Financing Decisions
ExternalFinancing$500,000
(investors)
Non-current Assets
$1,000,000
Profit for the Year
Depreciation/Amortization
Mortgages
Bonds
Common Shares
Preferred Shares
Working Capital
01ch01.indd 1801ch01.indd 18 1/25/10 9:54 AM1/25/10 9:54 AM

Business Decisions 19
NEL
if they are able to reduce accounts such as trade receivables and inventories. An increase in these accounts would be considered an outflow of cash. To illustrate, sup-pose that a plant manager wants to buy a $50,000 machine; it could be financed by a $50,000 reduction in inventories.
Figure 1.7 illustrates how the three types of business decisions appear on the state-ment of financial position. On the left are investments in non-current assets such as buildings, machinery, and equipment, and other assets or intangible assets such as research and development, goodwill, and patents. These two investing decisions or activities (I) appear in boxes with vertical lines.
The right side of the statement of financial position in Figure 1.7 shows the external financing decisions related to the provision of funds obtained from long-term lenders and shareholders. The two financing decisions or activities (F) appear in boxes with horizontal lines, one a portion of equity and the other, non-current lia-bilities. Obtaining funds from these two sources is the responsibility of the chief financial officer or the treasurer.
Managers can provide cash to a business through two sources: (1) profit for the year and (2) an improvement in working capital accounts. The centre of the statement of financial position shows to what extent operating decisions affect retained earnings
External financingCash obtained from investors (long-term lenders and shareholders).
Figure 1.7 Business Decisions and The Financial Statements
Source: Adapted from Techniques of Financial Analysis, 10th Edition, by Erich A. Helfert, Irwin/McGraw-Hill, 2000.
Statement of Financial PositionAssets Equity/Liabilities
Statement of Income
Revenue
Costs
Profit for the Year
Statement of Changesin Equity
(changes during the year)
Equity
Current AssetsO
Other AssetsI
OCurrent Liabilities
O
Non-current AssetsI
Non-current LiabilitiesF
F
Statement of Cash FlowsBased on changes in assets, liabilities, and shareholders’ equity
IAn increase in non-currentassets is a cash outflow; areduction is a cash inflow.
OProfitable operations are cash inflows
but losses are cash outflows; reductionof net working capital is a cash inflow
but an increase is a cash outflow.
FIncrease in non-current
liabilities (debt) and equityare cash inflows; payment ofdividends and principal on
debt are cash outflows.
01ch01.indd 1901ch01.indd 19 1/25/10 9:54 AM1/25/10 9:54 AM

NEL
20 CHAPTER 1 Overview of Financial Management
(statement of financial position).3 Operating decisions are the responsibility of all managers and include decisions that affect every account shown on the statement of income (e.g., revenue, costs). If managers make prudent operating decisions in mar-keting, manufacturing, production, administration, human resources, etc., they will help generate higher profit (O) and ultimately improve the ROR performance. As mentioned earlier, higher profit enables managers to pay dividends and to reinvest the rest in the business through retained earnings (shareholders’ equity). As shown in Figure 1.7, profit for the year (shaded box) is reinvested in the business in the form of retained earnings and a portion of the equity comprises retained earnings (also shaded). The figure shows that managers are also responsible for the management of working capital accounts (current assets and current liabilities) that appear in the lower portion of the statement of financial position (also shaded box). The more effi-cient they are in managing these items (trade receivables, inventories, and trade and other payables), the more cash will be provided in the business (O).
The cash generated by the business (O) and obtained from investors (F) will be used to purchase non-current assets and other assets (I).
The lower portion of Figure 1.7 shows how these three types of business decisions affect a company’s cash position. For instance, a decrease in the non-current asset accounts (e.g., through selling an asset such as a truck) would be considered an inflow of cash. An increase in liability and equity accounts (through borrowing from banks or the injection of additional funds from shareholders) would also be considered an inflow of cash, as is profit generated by a business.
This book explores in detail these three types of business decisions. After exam-ining the structure of financial statements and how they can be analyzed in Chapters 2, 3, and 4, as mentioned earlier (see Figure 1.1, page 7), we will discuss operating decisions in Chapters 5, 6, and 7, financing decisions in Chapters 8 and 9, and investing decisions in Chapters 10, 11, and 12.
The rest of this chapter gives an overview of how these three types of business decisions can affect favourably the financial performance (statement of income) and financial structure (statement of financial position) of a business.
INVESTING DECISIONSAs mentioned earlier, investing decisions deal with the acquisition of non-current assets (e.g., machinery, equipment). As shown in Figure 1.7, investing decisions have an impact on a company’s cash flow. Acquiring non-current assets puts a drain on a com-pany’s cash position as it is considered an outflow of cash. However, a reduction in such assets, such as selling unproductive capital assets, is considered an inflow of cash.
Decisions dealing with non-current (also called capital or fixed) assets involve the purchase of equipment or machinery, and the more critical decisions such as plant
3. The statement of income is presented at the centre of the statement of financial position in Figure 1.7 strictly for presentation purposes. It shows how profit for the year increases the equity on the statement of financial position.
Investing decisionsDecisions related to the acquisition of non-current assets.
Non-current assetsStatement of financial position accounts such as land, buildings, equipment, and machinery.
01ch01.indd 2001ch01.indd 20 1/25/10 9:54 AM1/25/10 9:54 AM

Business Decisions 21
NEL
expansion, plant modernization to increase productivity, or investment in new facilities. These types of decisions are usually made during the capital budgeting process. Here, management examines the relationship between the cash invested in such assets and the anticipated cash that can be generated in the future by these assets. For example, if someone invests $100,000 in Canada Savings Bonds and earns $5,000 in interest, that person earns 5%. The same applies when managers invest in non-current assets. They want to measure two things: the expected ROA and how it compares to the cost of capital.
Here is an example of how investing decisions in non-current assets are calculated. Let’s say that a company invests $1.0 million in the following assets:
Land $ 100,000Buildings 500,000Machinery and equipment 400,000Total investments $1,000,000
Let’s also assume that this investment produces $132,000 in profit each year. The following shows the calculation:
Revenue $ 2,000,000Cost of sales (1,200,000)Gross profi t 800,000Total costs (560,000)Profi t before taxes 240,000Income tax expense (108,000)Profi t for the year $ 132,000
Several capital budgeting techniques are used to gauge the economic desirability of such investments. For example, there is the ROA calculation that relates profit for the year to investment in non-current (or capital) assets. It is calculated as follows:
Profit for the year $132,000Investment in non-current assets = $1,000,000 = 13.2%
This means that the $1.0 million investment in non-current assets generates a 13.2% return. Managers must also consider whether the investment is worth the risk. Before making a decision, they would have to relate the return of that particular investment to both the cost of capital and the inherent risks associated with the project. For example, if the company borrows the entire amount from lenders at a before-tax cost of 10%, it means that the after-tax cost of capital would be 6% (assuming that the business is in a 40% tax bracket). In this particular instance, the company would earn 7.2% (13.2–6.0%) more than the cost of borrowing.
The project’s risk would also be considered. Managers would have to gauge whether a 13.2% return on this particular investment is worth the risk. If this invest-ment was in the high-risk category, such as an investment in an untried product,
01ch01.indd 2101ch01.indd 21 1/25/10 9:54 AM1/25/10 9:54 AM

NEL
22 CHAPTER 1 Overview of Financial Management
management may want to earn at least 25% to 30% to justify the investment. However, if the project is low risk, such as the expansion of an existing plant, it could require a much lower return on its investment (say, around 10%).
FINANCING DECISIONSAs shown in Figure 1.7(page 19), financing decisions deal with the accounts listed on the right side of the statement of financial position—that is, funds obtained from long-term lenders and shareholders. Financing decisions examine the best way cash can be raised from these investors. Financing decisions deal with five elements: matching principle, sources and forms of financing, cost of financing, weighted average cost of capital, and financing mix.
The Matching Principle. Essentially, the matching principle explores the selection of the most appropriate financing source of cash when buying assets. This means that short-term borrowings should be used to finance current assets while long-term bor-rowings should buy the more permanent assets such as non-current assets. For example, it would not make much sense to buy a house on a credit card such as MasterCard or Visa! Simply put, the matching principle calls for relating the maturity of the sources of cash and the maturity of the uses of cash.
Sources and Forms of Financing. A business can obtain money from a wide range of sources and in different forms. Sources of financing are institutions that provide funds and include commercial banks, investment bankers, equipment vendors, gov-ernment agencies, private venture capital companies, suppliers, trust companies, life insurance companies, mortgage companies, individuals, and shareholders. Forms of financing are the financing instruments used to purchase the assets. They include short-term loans (secured or unsecured), term or installment loans, revolving loans, lease financing, mortgages, bonds, preferred shares, and common shares.
Cost of Financing. Another important element in financing decisions is determining the cost of financing when raising funds from different sources. This is critical because borrowed funds are used to purchase assets, and managers want to ensure that the return generated by the assets exceeds the cost of borrowed funds.
Weighted Average Cost of Capital. Weighted average cost of capital deals with the accounts shown on the right side of the statement of financial position. It involves the more permanent forms of financing such as mortgages, bonds, and preferred and common shares. These are referred to as capital funds, thus, their cost is known as cost of capital. In the earlier example of a $1.0 million investment in non-current assets, managers would have to determine the cost of each loan and the weighted cost of capital. For instance, if the business borrows $400,000 from a mortgage company at 12%, $300,000 from bondholders at 13%, and the rest ($300,000) from shareholders at, say, 15%,4 the weighted average cost of capital would be 9.27%. Because finance costs on mortgage and bond financing are tax-deductible and the company is in a
4. This percentage is equivalent to what the shareholders could earn if they were to invest these funds elsewhere; it is sometimes referred to as the opportunity cost.
Financing decisionsDecisions related to borrowing from long-term lenders and shareholders.
Matching principleProcess of selecting the most appropriate financing source when buying an asset.
Sources of financingInstitutions that provide funds (e.g., commercial banks).
Forms of financingFinancing instruments used to buy assets (e.g., term loans).
Cost of financingEffective after-tax cost of raising funds from different sources (lenders and shareholders).
Weighted average cost of capitalComposite weighted after-tax cost of raising funds from long-term investors (bonds, mortgages, common shares, preferred shares).
01ch01.indd 2201ch01.indd 22 1/25/10 9:54 AM1/25/10 9:54 AM

Business Decisions 23
NEL
45% tax bracket, such financing options are more attractive than equity financing as dividends are paid with after-tax profit. The calculation is as follows:
Amount Proportion Before-tax After-tax Weighted Cost Sources ($) (%) Cost (%) Cost (%) of Capital (%)
Mortgage 400,000 0.40 12.0 × 6.6 = 2.64Bonds 300,000 0.30 13.0 × 7.1 = 2.13Common shares 300,000 0.30 15.0 × 15.0 = 4.50Weighted average 1,000,000 1.00 9.27Cost of capital
Financing Mix. Another component of financing decisions is determining the financing mix, proportion of funds that should be raised from lenders versus owners. As shown in the previous example, it would be advantageous to borrow as much as possible from lenders because that is the least expensive option (6.6% and 7.1% versus 15.0%). However, because lenders do not want to take all the risks related to the invest-ment decisions, they will demand that an appropriate amount of funds be provided by shareholders. Equally important in financing decisions is a firm’s ability to repay its debt obligation. If both the economy and the industry sectors are in a strong growth position, the company will generate healthy profits, be able to repay its loan without difficulty, and raise more funds from lenders rather than shareholders. However, if the economic indicators and the marketplace indicate slow growth, a low-leveraged position (meaning less money borrowed from lenders) would be more advantageous and less risky.
Self-Test Exercise 1.3Cost of Financing and Weighted Average Cost of Capital
With the following information, calculate CompuTech’s cost of financing and its weighted average cost of capital. Assume that the company’s income tax rate is 33%.
Financing mixProportion of funds raised from lenders and shareholders.
Source Amount (in $)
Share capital 100,000
Long-term borrowings (mortgage) 60,000
Trade and other payables 17,000
Short-term borrowings (term loan) 35,000
The bank charges 12.0% (before tax) for the term loan and 11.0% for the mortgage. The Millers expect to earn 8% on their savings.
Questions
1. Calculate the company’s after-tax cost of financing. 2. Calculate the company’s weighted average cost of capital.
01ch01.indd 2301ch01.indd 23 1/25/10 9:54 AM1/25/10 9:54 AM

NEL
24 CHAPTER 1 Overview of Financial Management
OPERATING DECISIONSAs shown in Figure 1.7(page 19), operating decisions deal with many accounts appearing on both the statement of financial position and the statement of income. These financial statements will be explained in detail in Chapter 2. As shown in the figure, operating decisions deal with accounts shown on the statement of financial position such as current assets and current liabilities (shaded boxes). In the statement of income, these accounts include revenue, cost of sales, distribution costs, and administrative expenses.
Operating Decisions Related to the Statement of Financial PositionLet’s now examine how working capital decisions affect a company’s cash flow performance.
Working Capital Accounts. Working capital accounts are statement of financial position accounts such as cash, trade receivables, and inventories (current assets), and trade and other payables and short-term borrowings (current liabilities).
Managing working capital means accelerating the movement of cash in a business. This movement of cash is referred to as the cash-conversion cycle. The faster inventories are turned over and trade receivables are collected, the more cash and profit a business earns.
Current assets are not productive assets, but they are necessary for a business to operate; it must sell on credit and carry a certain amount of inventories. However, it is necessary to determine the right amount of working capital that should be main-tained. The faster working capital accounts are transformed into cash, the faster the cash can be invested into more productive assets such as equipment and machinery; this ultimately improves a company’s profit performance.
Decisions related to managing cash determine the minimum level of cash that will satisfy business needs under normal operating conditions. Cash reserves (including marketable securities) should be sufficient to satisfy daily cash expenditures (salaries, suppliers, etc.).
Decisions related to inventories deal with lowering the amount of raw materials, unfinished goods, and finished goods. Turning over inventory rapidly can improve a company’s cash position and, ultimately, its profitability and return on investment. Several techniques can be used to make such decisions, including the following:
• Just-in-time inventory management process, which is a supply system that attempts to reduce inventories.
• Economic ordering quantity system, which determines the optimal number of units that should be ordered each time goods are purchased from suppliers.
The intent here is to invest as little as possible in inventory because it is considered a non-productive asset. To illustrate, let’s assume that managers can reduce inventory levels from, say, $400,000 down to $325,000 because of inventory management approaches such as just-in-time and economic ordering quantity. This means that the company will have an extra $75,000 in cash with which to work.
Decisions related to trade receivables deal with collecting receivables from customers as quickly as possible. For example, if a business has slow-paying customers (say, 90 days),
Operating decisionsDecisions related to accounts appearing on the statement of financial position (current assets and current liabilities) and the statement of income (e.g., revenue, cost of sales, distribution costs).
Working capital accountsStatement of financial position accounts such as inventories, trade receivables, and cash (current assets), and trade and other payables and short-term borrowings (current liabilities).
01ch01.indd 2401ch01.indd 24 1/25/10 9:54 AM1/25/10 9:54 AM

Business Decisions 25
NEL
management may decide to offer cash discounts off the original sale price to accelerate the cash flow and shorten the collection period (say, a 2% discount if the customer pays within 10 days). Before offering such discounts, however, management will want to analyze the cost of offering the discount versus the interest earned in the bank as a result of receiving payment from the customers more quickly. Management will want to get answers to the following questions:
• What is the status of our trade receivables (e.g., aging of the trade receivables)?• What are our competitors’ credit policies?• How much will we lose in profit if we offer, say, a 2%, net 30-day discount?• How much interest can be earned from the bank on the additional cash flow?
For example, if managers are able to reduce the level of trade receivables from, say, $300,000 down to $250,000, it means that the company will have an extra $50,000 in cash with which to operate.
Cash reserve decisions are usually based on planning assumptions such as the following:
• The practical minimum level of cash balance required to meet ongoing operating conditions.
• An amount necessary to absorb unforeseen expenditures.• The level of cash required to exploit profitable business opportunities
(e.g., special discounts on purchases or anticipation of an increase in the price of raw materials).
It is important to keep cash at a minimum because investment securities yield very little. It would therefore be more economically advantageous to invest excess cash into investment opportunities in order to earn a more attractive return.
Operating Decisions Related to the Statement of IncomeOperating decisions can also increase a company’s profitability in many ways. Some decisions cut across all organizational functions and activities affecting the statement of income, such as improving employee productivity, reducing waste, and eliminating useless activities. Here are a few budgeting approaches used by managers that can help improve profitability.
Demassing is a recession-driven technique that was used widely during the sharp economic downturn in the early 1980s. The purpose of this approach was to remove headquarters’ staff and entire management layers and professional positions from orga-nizational charts. Organizations were simply flattened. It has been reported that more than a third of U.S. middle-management positions were eliminated in 1981–1982 as a result of demassing exercises.
Planned downsizing is similar to demassing except that it is a more systematic way of cutting costs. Guidelines used in planned downsizing include the following:5
5. For interesting reading on this subject, see Tomasso, Robert, M. Downsizing: Reshaping the Corporation for the Future, New York: AMACOM, 1987.
DemassingRecession-driven technique to remove management layers from organizational charts to cut costs.
Planned downsizingSystematic way of cutting costs.
01ch01.indd 2501ch01.indd 25 1/25/10 9:54 AM1/25/10 9:54 AM

NEL
26 CHAPTER 1 Overview of Financial Management
• Matching organizational structure with strategies.• Pinpointing excess staff in the control and support of organizational units.• Evaluating the effectiveness of organizational units.• Performing a zero-based evaluation by questioning everything.• Introducing norms and ratios such as allowing 1 staff position per
100 employees or maintaining computer-related expenses below 1%.• Using strategic concepts such as product life cycles and value added to
determine staff size.• Enforcing sunset laws by closing down, decentralizing, or contracting out
mature or aging activities before starting new ones.• Flattening organizational pyramids by asking pertinent questions such as:
How many management layers are really necessary? How many people can one manager manage? How can a manager’s span of control be increased?
Productivity measures are essential for measuring the performance of organiza-tional units. It is often said that organizational units without clearly defined goals are difficult to manage. Productivity indicators must first be identified for each organiza-tional unit before the units can be made more productive. If organizational efficiencies and effectiveness for the most important activities performed by managers and employees are measured and used as goals, they can improve productivity and ulti-mately the bottom line because:
• Productivity is more likely to improve when expected results are measured;• Productivity increases rapidly when expected benefits are shared with
those who will produce them;• The greater the alignment of employee expectations (needs) with
organizational goals (targets), the greater the motivation to accomplish both; and
• When productivity measures are placed on a time scale, there is a greater likelihood of achieving the goals.
Rewarding simplification instead of needless complication can also produce positive financial effects. Jack Welch (former CEO at General Electric) was an advocate of keeping things simple at GE. As he pointed out, “The leader’s unending responsibility must be to remove every detour, every barrier, to ensure that vision is first clear, and then real. The leader must create an atmosphere in the organization where people feel not only free to, but obliged to demand clarity and purpose from their leaders.”6 In the process, GE was able to improve its operating efficiencies and improve the bottom line by billions of dollars.
Cutting back useless activities and replacing them with productive work adds value to financial results.
6. Slater, Robert, Jack Welch and the GE Way, New York: McGraw Hill, 1999, p. 139.
Productivity measuresWays of measuring organizational performance (i.e., ROA).
01ch01.indd 2601ch01.indd 26 1/25/10 9:54 AM1/25/10 9:54 AM

Business Decisions 27
NEL
Focusing on quality work instead of fast work can also increase operating margins and the bottom line. Doing work too quickly and too cheaply often inadvertently becomes costly because quality suffers. Several of the payoffs of improving quality include lower costs, increased productivity, worker pride, and customer loyalty. One tool that has produced positive benefits to the bottom line through cost reduction, produc-tivity improvement, customer retention, cycle-time reduction, defect reduction, and product/service development is Six Sigma. It is a tool that has been adapted by com-panies such as GE, Motorola, Black & Decker, Bombardier, DuPont, Dow Chemical, and Federal Express. The Six Sigma four-step process includes measure, analyze, improve, and control. At GE, for example, Six Sigma was expected to generate $1.5 billion in 1999, while operating margins went from 14.8% in 1996 to 18.9% in 2000.7
Empowering workers through team building and communication can also produce synergistic effects on a company’s operating performance. Empowerment is more than a trendy slogan; it has produced positive financial results. Working in teams cre-ates a great sense of interdependence. Some plants have increased productivity substantially just by giving workers the option to decide how to perform their work. Workers learned to inspect their own work, management listened more actively to their suggestions, and employee dignity was greatly elevated.
The balanced scorecard (BSC) is a process that can help translate an organiza-tion’s mission, vision, and strategies into a comprehensive set of quantifiable performance measures in addition to providing a framework for a strategic measure-ment and management system. The BSC measures organizational financial and non-financial performance from across four balanced perspectives: financial, customers, internal business processes, and learning and growth.8
Organizations that have embraced the balanced scorecard realized the following benefits:
• Provide everyone in an organization with a clear line of sight to the mission, vision, and strategy.
• Make strategies operational by translating them into performance measures and targets and achieve breakthrough performance.
• Provide an effective tool for communicating (1) the mission, vision, and strategy; and (2) the processes and systems required to implement the strategy.
• Perform as an integrating device, an umbrella, for a variety of diverse, often disconnected organizational programs such as quality, reengineering, process redesign, and customer service.
7. Welch, Jack, Jack: Straight From the Gut, New York: Warner Business Books, 2001, p. 336. For interesting readings on the subject of Six Sigma, refer to Pandre, Peter, Robert Neuman, and Roland Cavanagh, The Six Sigma Way, New York: McGraw Hill, 2000; and George, Michael L., Lean Six Sigma, New York: McGraw Hill, 2002.
8. For interesting reading on the subject of the BSC, refer to Kaplan, S. Robert and David P. Norton, The Balanced Scorecard, Cambridge, MA: Harvard Business School Press, 1996; and Niven, Paul R., Balanced Scorecard, New York: John Wiley & Sons, Inc., 2006.
Balanced scorecard (BSC)A process that can translate an organization’s mission, vision, and strategies into a comprehensive set of quantifiable performance measures in addition to providing a framework for a strategic measurement and management system.
01ch01.indd 2701ch01.indd 27 1/25/10 9:54 AM1/25/10 9:54 AM
NEL
28 CHAPTER 1 Overview of Financial Management
• Provide a comprehensive view that overturns the traditional idea of an organization as a collection of isolated, independent functions and activities (the silo phenomenon).
• Help to break down corporate-level measures to lower levels in an organization so that team leaders and employees can see what they must do well in order to improve organizational efficiencies and effectiveness.
• Draw cause-and-effect roadmaps related to stakeholders, customers, internal processes, and employees.
• Demonstrate quantifiable and measurable results that can be monitored by everyone (from top to bottom) and, as a consequence, make them accountable for performance.
GROSS PROFITDecisions that affect the gross profit are revenue and cost of sales. Revenue com-prises decisions affecting the number of units sold and the selling price. Decisions regarding the marketing variables (product, price, place, and promotion) determine, to a large extent, sales output and market share performance. Effective marketing decisions can improve a company’s sales performance and, ultimately, its revenue. There are a number of ways management can determine the most appropriate selling price. These are markup percentages, cost-plus pricing, suggested retail price, psycho-logical pricing, discounts, and geographic price policies.
For manufacturing businesses, cost of sales represents a substantial percentage (as much as 80%) of a company’s total costs. For this reason, a great deal of attention is devoted to making a company’s manufacturing operations more efficient by modern-izing its plants (mechanization or automation), reducing waste, improving employee morale, and empowering workers.
Earnings before Interest and TaxesDecisions affecting earnings before interest and taxes (EBIT), which is the profit before taxes and finance costs shown on the statement of income, are grouped under two categories of costs: distribution costs and administrative expenses. Many of the operating budgeting techniques explained earlier, such as planned down-sizing, cutting useless activities, and empowering workers, are examples of how profit before taxes can be improved. In the past, incremental or traditional bud-geting was used to prepare budgets for overhead units. To justify the amount of budget or funds to be allocated to such units, input-oriented budgeting techniques (emphasis on activities and functions or on objects of expenditures such as salaries, telephone, travel, and training) were frequently used. Today, more businesses are using results-oriented budgeting techniques where productivity measures (as in the case of the BSC) or some form of standards are applied to help justify and approve budget proposals. When preparing operating budgets for most overhead units, three broad operating decisions are often explored: economy, efficiency,
Gross profitDifference between revenue and cost of sales.
Earnings before interest and taxes (EBIT)Profit before taxes and finance costs.
01ch01.indd 2801ch01.indd 28 1/25/10 9:54 AM1/25/10 9:54 AM

Corporate Transparency and Accountability 29
NEL
and levels of service (quality of service). These concepts will be discussed in Chapter 7 (Planning, Budgeting, and Controlling), under the heading “Performance Indicators” on page 305.
Profit for the YearThe account that affects profit for the year is the income tax expense. It is the dif-ference between profit before taxes and income tax expense.
Self-Test Exercise 1.4Cash Flow Provided by Operating Activities
With the following information, calculate CompuTech’s cash flow generated by the business. Between 2009 and 2010, inventories increased from $50,000 to $65,000, and during the same time period, trade receivables also increased from $35,000 to $45,000. The company also realized an increase in profit from $25,000 to $33,000.
Corporate Transparency and AccountabilityFollowing the Bre-X, Enron, WorldCom, and now Madoff scandals, there have been cries from all types of stakeholders and the general public for greater levels of corpo-rate transparency and accountability. Transparency can be defined as how business processes and related information resources, assets, and outcomes can be made more visible and open to inspection by stakeholders. What organizations now need more than ever are (1) corporate senior executives (public and private sector organizations) who have the ability to establish “social architectures” for openness, and (2) a new branch of management theory and practice to be called “transparency and account-ability management.”
Both governments and businesses have made far-reaching efforts to achieve that goal through government legislation, effective governance, more entrenched corporate culture, and global accounting and financial standards. Let’s take a look at each one.
GOVERNMENT LEGISLATIONAs a reaction to many financial scandals, including Enron and WorldCom, in 2002 the U.S. government enacted the Sarbanes-Oxley Act. The purpose of this legislation was to set new standards for all public company boards, management, and public accounting firms. The Act contained 11 titles, or sections, ranging from additional corporate board responsibilities to criminal penalties, and required the Securities and Exchange Commission to implement rulings on requirements to comply with the new law. The mandates and requirements for financial reporting include the following:
• Creation of a Public Company Accounting Oversight Board, to define processes and procedures for compliance audits.
• Auditor independence, to limit conflicts of interest.
Profit for the yearDifference between profit before taxes and income tax expense.
5 Learning Objective
Discuss issues related to corporate transparency and accountability.
TransparencyExtent to which business processes and related information resources, assets, and outcomes are visible and open to inspection by stakeholders.
01ch01.indd 2901ch01.indd 29 1/25/10 9:54 AM1/25/10 9:54 AM

NEL
30 CHAPTER 1 Overview of Financial Management
• Corporate responsibility, to ensure that senior executives take individual responsibility for accuracy and completeness of corporate financial reports.
• Enhanced financial disclosures, to show reporting requirements for all transactions including off-statement of financial position’s transactions, pro-forma figures, and stock transactions of corporate officers.
• Analysts’ conflicts of interest, to specify measures designed to help restore investor confidence in the reporting of securities analysts.
• Commission resources authority, to define reporting processes of securities analysts.
• Studies and reports, to determine how the Securities and Exchange Commission should perform various studies and report their findings.
• Corporate and criminal fraud accountability, to describe specific criminal penalties for fraud by manipulation.
• White-collar crime penalty enhancement, to recommend stronger sentencing guidelines associated with white-collar crimes and conspiracies.
• Corporate tax returns, to state that the CEO should sign their company’s tax return.
• Corporate fraud accountability, to identify corporate fraud and records tampering as criminal offenses.
This was not the first time that the U.S. government (the ultimate gatekeeper of public confidence in public markets) had introduced legislation to (1) build a stronger framework for effective governance, (2) establish high standards and healthy board dynamics, (3) set up guidance for effective corporate communications, and (4) show how red flags should be highlighted to signal the need for prompt investigation and action. There have been at least 10 powerful legislations enacted in the United States in the past 100 years. They include the Sherman Antitrust Act (1890) on monopolies; the Clayton Antitrust Act (1914) on unfair business practices; the Securities Act (on cor-porate transparency), and the Banking Act (on unfair banking practices), both enacted in 1933; the Securities Exchange Act (1934) on regulating the securities market; the Investment Company Act and the Investment Advisers Act (both 1940) on abusive invest-ment company practices; the Foreign Corrupt Practices Act (1977) on bribery; the Financial Institutions Reform, Recovery and Enforcement Act (1989) on restoring confi-dence in savings-and-loan institutions; the Comprehensive Thrift and Bank Fraud Prosecution and Taxpayer Recovery Act (1990) on strengthening federal regulators’ authority to combat financial fraud; and more recently, the Sarbanes-Oxley Act (2002) for greater agent and gatekeeper accountability for financial reporting.
Despite the enactment of all these laws with the primary intent of preventing accounting irregularities, investigations of corporate fraud continues to be alive and well (e.g., Conrad Black, Bernard Madoff, and the billions of dollars in bonuses paid to Merrill Lynch & Co. executives). It appears that government legislation to instill high ethical standards in the corporate arena is not enough. Corporate governance,
01ch01.indd 3001ch01.indd 30 1/25/10 9:54 AM1/25/10 9:54 AM

Corporate Transparency and Accountability 31
NEL
corporate culture, and, now, global accounting and financial standards are financial and management practices that have been introduced in many for-profit and NFP organizations, and will continue to be reinforced in many others.
CORPORATE GOVERNANCEBecause boards of directors bear the ultimate authority and accountability for an organization’s affairs, much attention has been focused on how board members should govern their organizations. Individuals involved in governance include the regulatory body (e.g., CEO, the board of directors, management, and shareholders) and other stakeholders (suppliers, employees, creditors, customers, and the community at large). Governance can be defined as the process of decision-making and the process by which decisions are implemented (or not implemented).
The fundamental elements of effective corporate governance include honesty, trust and integrity, openness, performance orientation, responsibility and accountability, mutual respect, and commitment to the organization. A key responsibility of effective directors and top-level managers is to develop a model of governance that aligns and instills these values throughout their organization and to evaluate the model periodi-cally for its effectiveness.
The more commonly publicized principles of effective corporate governance include the following:
• Right and equitable treatment of shareholders.• Interests of other stakeholders.• Role and responsibilities of the board.• Integrity and ethical behaviour of all members of the organization.• Full disclosure of corporate documents and transparency of information
and conduct.
Corporate governance principles and codes of conduct have been developed in many countries and issued from different stock exchanges, corporations, institutional investors, or associations of directors and managers with the support of government and international organizations. For example, companies quoted on the Toronto Stock Exchange (TSX) need not follow, on a formal basis, the recommendations of their respective national codes but must disclose whether they follow the recommen-dations in those documents and, if not, provide explanations concerning divergent practices, which ultimately exert a considerable pressure on organizations for compliance.
CORPORATE CULTURESince the beginning of the 20th century, Canadian organizations have always tried to sustain their competitive stamina in order to compete effectively on world markets. During the past 100 years, top-level managers have tried to transform their ways of managing their organizations by changing their corporate culture, that is, “doing things the right way.” There is no question that productivity, efficiency, and
GovernanceProcess of decision-making and the process by which decisions are implemented (or not implemented).
01ch01.indd 3101ch01.indd 31 1/25/10 9:54 AM1/25/10 9:54 AM

NEL
32 CHAPTER 1 Overview of Financial Management
high-quality goods and services are essential elements that make businesses prosper in the global arena. Although financial statements are simply a reflection of how well organizations perform, the manner in which organizations are managed is the means for achieving higher levels of profitability. Each time that organizations have been plagued with productivity and motivational problems, new approaches to manage-ment were discovered to solve the problems of the time. Since the start of the 20th century, we have experienced five management waves, all aimed at improving productivity, efficiency, employee motivation, quality, and assurance.
The first management wave began at the beginning of the 20th century, and is considered the classical, mechanistic, or scientific movement, when a group of writers, consultants, and researchers found logic, order, and common sense to be the prereq-uisites to organizing work and increasing productivity. A set of management principles emerged from this first wave and, as a result, productivity and employee motivation were improved.
The second management wave began in the early 1930s when it was realized that organizations and people should not be viewed as “pawns,” motivated only by finan-cial incentives. The pendulum had swung toward a more people-oriented approach: This was the behavioural or humanistic movement. A new set of values emerged from this second wave, to the effect that people should be treated as human beings. Again, there was an upswing in productivity and employee motivation.
The third management wave came about during the mid-1940s. To some extent, it was the resurgence of the scientific movement, that is, the quantitative approach, which led to the application of mathematical and statistical solutions such as optimi-zation models, information models, computer simulation, linear programming, work scheduling, and operations research. Although the quantitative movement contributed mainly to decision-making, particularly in the area of planning and controlling, it had, and still has, considerable influence on the practice of management (i.e., Edwards Deming’s approach to Total Quality Management and the Six Sigma approach). Once more, there was a bounce in productivity, efficiency, and product quality.
The fourth management wave started in the early 1960s, when a more integrative and unifying approach to management was seen to be needed. Topical management subjects at the time were styles of leadership, the systems approach, and management processes. The search for the most appropriate style of leadership was in fashion. Should a manager be autocratic or democratic, an X or Y type, results-oriented or people-oriented? In the end, most researchers and writers concluded that an organi-zation should be viewed as a system, that managers should use the style that best meets the needs of a particular situation, and that management should be regarded as a process. There was (and still is) a plethora of articles, books, and seminars on these various topics. Once more, a rise in productivity, employee motivation, and product quality surfaced.
It was in the early 1980s that the fifth management wave emerged. When North American managers began to realize that they were losing ground to other
01ch01.indd 3201ch01.indd 32 1/25/10 9:54 AM1/25/10 9:54 AM

Corporate Transparency and Accountability 33
NEL
countries, including Japan, France, Germany, and even England, they wanted to know why and the study of comparative management was born. Today, not only are countries comparing their management approaches, even North American compa-nies are searching to find the “magic of management” that makes one organization more successful than another. It all started with Ouchi’s Theory Z: How American Business Can Meet the Japanese Challenge,9 which compared the North American style of management to the Japanese style, which was followed by Peters and Waterman’s book In Search of Excellence.10 The lesson was clear. The excellent companies had one thing in common: a strong sense of shared values, norms, and beliefs about people, products, services, and innovation. It was clear that a strong corporate culture, that is a shared system of values and beliefs within an organization, was the foundation of a company’s success. North American organizations are now caught up in clari-fying the meaning and significance of organizational culture and how strong corporate values can be adapted within their own organizations. In the News 1.2 gives an example of RONA’s values and rules. To many, the value factors appear to supercharge organizational performance. As mentioned in the preceding sections on government legislation and corporate governance, the focus of many top-level man-agers is on the reinforcement of ethical standards within their organizations.
In The News [1.2]
RONA’s Values and Rules of Ethics That Guide Behaviour
If an organization wants to practise good behaviour, all it has to do is write a set of values and live by them!
RONA is a classic example about how a company goes through the process of adapting to excep-tional working habits. As pointed out by Robert Dutton, president and CEO of RONA Inc., “It is desirable to draw up a set of written rules to which we can refer.”
From the start, RONA’s employees have drawn strength by adhering to their shared vision and living out deeply entrenched values. Here are some of the terms to which employees hold fast: ser-vice, honesty, integrity, professionalism, unity, respect, search for the common good, and sense of responsibility. To many employees, “living” these words that are part of the company’s “Code of Con-duct” represents a commitment at two levels: collective and individual. The bottom line is this: everybody wins—customers, investors, suppliers, and business partners. Above all, every stake-holder appears to trust RONA.
Source: Adapted from RONA’s website: http://www.rona.ca/content/code-conduct_annual-reports-other-documents_investor-relations. Accessed October 8, 2009. You can download RONA’s complete document of the Code of Conduct in PDF version by visiting their site.
9. Ouchi, William G., Theory Z: How American Business Can Meet the Japanese Challenge, Don Mills, Ontario: Addison-Wesley Publishing Company, 1981, p. 4.
10. Peters, Thomas J., and Robert H. Waterman, In Search of Excellence, New York: Harper & Row Publishers, Inc., 1982.
Corporate cultureShared system of values and beliefs within an organization.
01ch01.indd 3301ch01.indd 33 1/25/10 9:54 AM1/25/10 9:54 AM

NEL
34 CHAPTER 1 Overview of Financial Management
GLOBAL ACCOUNTING AND FINANCIAL STANDARDSOne way to improve transparency and accountability is by introducing a common international accounting and financial language. This is precisely the role and purpose of the International Accounting Standards Committee (IASC), which was established in 1973. Until 2001, it had published only 41 International Accounting Standards (IASs). It was in the early 2000s that problems started to emerge when multinationals had to prepare financial statements with a set of different standards for different jurisdic-tions; it became more difficult to make cross-country comparisons. It was then that the International Organization of Securities Commissions (IOSCO) asked the IASC to review and reinforce global standards and to solve the financial instruments problem. The IASC’s key objective was to put in place “global convergence.”
In April 2001, a new structure of the IASB was set up and it had the exclusive responsibility for establishing IFRS.
In 2005, a new era in global conduct of business, for a worldwide adaptation of reporting rules and standards, emerged. As a consequence, most national GAAP stan-dards were reduced in importance or were being phased out as countries all over the world began to adapt the IFRS. In Canada, Canadian GAAP will be eliminated and replaced by IFRS in 2011.
The push to converge existing different financial reporting standards was clear: to facilitate the free flow of capital so that, for instance, investors in Canada would be willing to finance businesses in other countries without having to go through the financial statement “interpretation process.” The IFRS would therefore help investors to easily read financial statements from different countries written in a “common language.”
Figure 1.8 shows the structure of the IASC. The IASC Foundation includes 19 Trustees (six from North America, seven from Europe, four from Asia Pacific, and one each from Africa and South America).
Figure 1.8 The IASB Structure
IASC Foundation
IASB
Standards Advisory Council
International Financial ReportingInterpretations Committee
Steering Committees
01ch01.indd 3401ch01.indd 34 1/25/10 9:54 AM1/25/10 9:54 AM

Corporate Transparency and Accountability 35
NEL
The IASB, which is the principal body within the new structure, has 12 full-time and 2 part-time members. The Board’s key responsibilities are to (1) develop and issue IFRS and Exposure Drafts, and (2) approve interpretations developed by the International Financial Reporting Interpretations Committee (IFRIC).
The Standards Advisory Council (SAC), which consists of some 45 members, pro-vides a forum for organizations and individuals interested in international financial reporting. The Council meets three times each year and has a responsibility to:
• Advise the Board on priorities;• Inform the Board of the implications of suggested standards
for potential users and those responsible for preparing financial statements; and
• Give advice to the Board or to the Trustees.
The IFRIC, which consists of 12 members appointed by the Trustees, has a respon-sibility to:
• Interpret the application of IFRS and provide timely guidance on financial reporting issues;
• Publish draft interpretations for public comment; and• Report to the Board and obtain Board approval for final Interpretations.
The IOSCO also works with the IASB and its objective is to link together securi-ties regulators, such as the Ontario Securities Commission (OSC), the Securities and Exchange Commission (SEC), and others, to promote cooperation and high stan-dards of regulation on a global basis. In the News 1.3 gives some statistics about the number of countries that have adopted the IFRS.
In The News [1.3]
The World Is Going with the IFRS
The IFRS train is moving fast. One destination, Canada, and arrival date, January 1, 2011.Although most countries in the world will be adopting the single IFRS, depending on where a
country is located on the world map, the acceptance level on the “IFRS continuum” varies.Recent surveys indicate that publicly traded companies located in most countries are adopting
the IFRS. However, the degree of acceptance of the new standards ranges from “okay” to “not-so-okay”! The adopted standards happen to be the European model backed by the IASB and not the United States. GAAP system supported by the Financial Accounting Standards Board (FASB). Up until the early part of May 2009, 95% of 59 countries surveyed have adopted or intend to con-verge with the IFRS, and 72% (39 countries) that have the intention to move toward the conver-gence system have adopted a formal policy to go ahead with it. Included in the 39 are 25 EU members.
Source: Adapted from “World going IFRS,” CFO magazine, February 24, 2003, accessed October 8, 2009, at http://www.cfo.com/article.cfm/3008402?f=search. For IFRS adoption by country, visit http://www.pwc.com/us/en/issues/ifrs-reporting/country-adoption/index.jhtml.
01ch01.indd 3501ch01.indd 35 1/25/10 9:54 AM1/25/10 9:54 AM

NEL
36 CHAPTER 1 Overview of Financial Management
REALITY FINANCIAL SNAPSHOTSOne section of the chapters of this book will present and analyze real-life financial statements of two organizations, Enbridge Inc., a for-profit organization, and The Ottawa Hospital (TOH), a NFP organization.11
ENBRIDGE INC.Enbridge Inc. operates in Canada and the United States. It has the world’s longest crude oil and liquids pipeline system. The company owns and operates Enbridge Pipelines Inc. and a variety of affiliated pipelines. These pipeline systems have oper-ated for over 50 years, delivering more than 2 million barrels per day of crude oil and liquids. Enbridge is also involved in liquids marketing and international energy proj-ects, and has a growing involvement in the natural gas transmission and midstream businesses. As a distributor of energy, Enbridge owns and operates Canada’s largest natural gas distribution company, Enbridge Gas Distribution, which provides gas to industrial, commercial, and residential customers in Ontario, Quebec, and New York State. The company distributes gas to 2 million customers. The company employs more than 4,400 people and trades its common shares on the Toronto Stock Exchange in Canada and on the New York Stock Exchange in the United States under the symbol ENG.
The following summarizes Enbridge’s cash flows for the years 2008 and 2007 under the three major activities (operating, financing, and investing). The company’s detailed financial statements will be presented in Chapters 2 and 3 and analyzed in Chapter 4.
(CAD $ in millions) 2008 2007
Cash provided from operating activities 1,387.7 1,351.6Investing activities (2,852.9) (2,228.8)Financing activities 1,840.2 904.2Increase in cash 375.0 27.0
In 2008, with internally generated funds ($1,387.7 million), Enbridge was able to finance part of its capital investment projects ($2,852.9 million), and financed the rest through debt for an additional $1,840.2 million, while increasing its cash account by $375.0 million. A detailed outline of the various cash inflows and cash outflows for Enbridge will be presented in Chapter 3.
11. Enbridge Inc. and TOH’s financial statements presented throughout this book are based on the CICA’s traditional GAAP presentation format as the introduction of the IFRS to be adopted by Canadian organizations will take place in 2011. Chapter 2 compares the existing and the new financial statements’ presentation layouts and terminology (see Table 2.6 on page 87).
01ch01.indd 3601ch01.indd 36 1/25/10 9:54 AM1/25/10 9:54 AM

Reality Financial Snapshots 37
NEL
THE OTTAWA HOSPITALTOH is a multi-campus, academic health sciences centre, servicing 1.5 million residents of Ottawa and eastern Ontario, both in English and French. It boasts specialty centres in cancer, heart, kidney, and vision care, as well as rehabilitation services. The following presents some statistics for the period of April 1, 2007 to March 31, 2008.
Staff members 11,566
Physicians 1,150Volunteers 1,992Admissions 46,089Average length of stay (days) 8.6Outpatient visits 908,010Births 6,940Number of beds 1,066External funding for research $79,000,000
The following summarizes TOH’s flow of cash for the years 2008 and 2007. The hospital’s detailed financial statements will be presented in Chapters 2 and 3 and analyzed in Chapter 4.
(CAD $ in thousands) 2008 2007
Operating activities 6,742 57,287Financing and investing activities (38,681) (3,443)Net decrease (increase) in bank indebtedness (31,939) 53,844
As will be explained in Chapter 3 (see page 131), NFP organizations’ cash flow statements combine financing and investing activities under one heading. A detailed outline of the various cash inflows and cash outflows for TOH will be presented in that chapter.
[DECISION-MAKING IN ACTION]
The management committee of Flint Ltd. is considering investing $1.0 million in non-current assets for expansion purposes, and an additional $200,000 for working capital (e.g., inventories and trade receivables). Currently, the profit generated by the company is $500,000, which repre-sents a 5.0% ROR of $10.0 million. The investment proposal was presented to the board of direc-tors for consideration and approval.
To finance the $1.2 million investment, Flint’s CFO explained that a certain portion of the expansion would be financed by internally generated cash (operating activities). He indicated that (1) the revenue for the budget year would show a 10% increase over the current year, and
01ch01.indd 3701ch01.indd 37 1/25/10 9:54 AM1/25/10 9:54 AM

NEL
38 CHAPTER 1 Overview of Financial Management
(2) the ROR (as a result of cost-cutting activities, particularly in manufacturing) would be increased to 7.0%.
The CFO explained that the profit was to be allocated as follows:
• Sixty percent for internal use; half of the funds would be allocated toward working capital (current assets) and the rest in non-current assets; and
• Forty percent would be used for external purposes, of which 60% would be used to pay dividends and the rest to reduce the principal on the debt.
Based on the feasibility study prepared by the controller’s department, he explained that the capital expansion program would generate lucrative profits. However, in order to finance the pur-chase of these assets, he would have to raise capital funds from a lending institution at a cost esti-mated at 10% (before tax). The shareholders were prepared to invest $200,000 toward the capital projects, and an amount of $100,000 would be obtained from the bank for financing the working capital requirements. The shareholders are looking for at least a 12% return on their investment.
The board of directors indicated that if the project generated 15%, they would consider approving it. However, before approval, they wanted answers to the following questions:
Question 1: How much cash would be generated internally (operating activities)?Question 2: How much cash would have to be raised from external sources
(financing activities)?Question 3: How does the ROA of the project (investing activities) compare to the
weighted average cost of capital (financing activities)?Question 4: Should the board of directors approve the capital project?Question 5: On the basis of the above information, what is the breakdown of the
financing package?
The CFO provided the following explanation to these questions:
Answer to Question 1An amount of $462,000 would be generated internally based on the following assumptions:
• Revenue for the budget year will be $11,000,000 (a 10% increase over the current year);
• A 7% ROR would generate $770,000 in profit ($11,000,000 × 7%);• An amount of 60% or $462,000 ($770,000 × 60%) would be reinvested in the busi-
ness in the form of retained earnings and the remaining 40% (or $308,000) would be used for external use; $184,800 (or 60% of $308,000) for the payment of divi-dends, and $123,200 (or 40%) for the payment of principal on the debt.
Answer to Question 2External financing would be as follows: $200,000 from shareholders and $438,000 from long-term lenders. Here is the calculation (in $).
a. Funds generated from operating activities:
Profit for the year (retained earnings) 462,000
Working capital requirements (200,000)
Short-term borrowings 100,000 (100,000)
Funds provided by operating activities 362,000
b. Investing activities:
Non-current assets (1,000,000)
Shortfall (638,000)
01ch01.indd 3801ch01.indd 38 1/25/10 9:54 AM1/25/10 9:54 AM

Financial Spreadsheets—Excel 39
NEL
c. Financing activities:
Share capital 200,000
Long-term borrowings 438,000 638,000
$ 0
Answer to Question 3ROA is 16.7%, and weighted average cost of capital is 7.86%. The calculations are as follows:
a. ROA is 16.7% Profit = $200,000 = 16.7% Total assets $1,200,000
b. Weighted average cost of capital is 7.86%
Source Amount (in $) Proportion After-Tax
Cost (%)
Weighted
Average Cost
of Capital (%)
Share capital 200,000 0.31 × 12.0 = 3.72
Long-term borrowings 438,000 0.69 × 6.0 = 4.14
Total capital raised 638,000 1.00 7.86
Answer to Question 4The board of directors would probably approve the project for the following reasons:
• The project’s ROA compared to the weighted average cost of capital is favourable (16.7% compared to 7.86%).
• The project’s ROA exceeds the board’s expectations (16.7% ROA compared to the 12% objective).
Answer to Question 5The project would be financed in the following way:
Based on the $1.0 million purchase of the capital assets:
• 36% ($362,000) by internally generated cash and 64% ($638,000) by external financing (share capital and long-term borrowings);
Based on the $1.2 million purchase of the capital assets and working capital:
• 44.8% or $538,000 ($100,000 from short-term borrowings and $438,000 from long-term borrowings) would be obtained from creditors while 55.2% or $662,000 would be funded by ownership interest ($462,000 provided from cash flow from operating activities and $200,000 from the shareholders).
FINANCIAL SPREADSHEETS—EXCELFinancial spreadsheets can be downloaded from the Nelson Education Web site (http://www.bergeron6e.nelson.com). The objective of these spreadsheets is to per-form most financial calculations (simple or complicated) contained in this text. In fact, most calculations done for this book and the Instructor’s Manual were done with the help of these spreadsheets.
These spreadsheets allow more time for analyzing financial statements and less for “number crunching.” The website includes Read Me Notes, which explain how to
01ch01.indd 3901ch01.indd 39 1/25/10 9:54 AM1/25/10 9:54 AM

NEL
40 CHAPTER 1 Overview of Financial Management
use the spreadsheets. As we go through the chapters of this book, some brief com-ments will be made regarding the application and the type of analysis that can be done with these spreadsheets.
The spreadsheets are divided into two parts: (A) Financial Statement Analysis and (B) Decision-Making Tools.
PART A: FINANCIAL STATEMENT ANALYSIS SPREADSHEETS 15 TEMPLATESThree templates are used to input data from financial statements onto the spread-sheets. They are referred to as input templates.
Template 1: Statement of IncomeTemplate 2: Statement of Comprehensive Income and Statement of
Changes in EquityTemplate 3: Statement of Financial Position
Twelve output templates are used for analytical purposes.Template 4: Statement of Sources and Uses of FundsTemplate 5: Statement of Cash FlowsTemplate 6: Vertical Analysis of the Statement of IncomeTemplate 7: Horizontal Analysis of the Statement of IncomeTemplate 8: Vertical Analysis of the Statement of Financial PositionTemplate 9: Horizontal Analysis of the Statement of Financial PositionTemplate 10: Financial Ratios (26 ratios)Template 11: DuPont SystemTemplate 12: Cash Flow, EBIT, and earnings before interest, taxes,
depreciation and amortization (EBITDA) Template 13: Economic Value Added (EVA)Template 14: Sustainable Growth RateTemplate 15: Financial Health Score
PART B: DECISIONMAKING TOOLS 12 TEMPLATESTemplate 1: Break-Even Analysis Using the Contribution MarginTemplate 2: Break-Even Analysis Using the PV RatioTemplate 3: Operating LeverageTemplate 4: Cost of Capital for Privately Owned CompanyTemplate 5: Cost of Capital for Publicly Owned CompanyTemplate 6: Capital Project Analysis (cash flow, NPV, internal rate of
return (IRR), profitability index (PI))Template 7: Monthly Cash BudgetTemplate 8: Lease–Buy DecisionTemplate 9: Revenue and Manufacturing BudgetsTemplate 10: Cash DiscountsTemplate 11: Credit TermsTemplate 12: Economic Ordering Quantity
01ch01.indd 4001ch01.indd 40 1/25/10 9:54 AM1/25/10 9:54 AM

NEL
Chapter Summary 41
Chapter Summary
1. Defi ne the meaning of fi nancial management.
The role of financial management is not limited to raising capital dollars; it also extends to finding ways to use funds more effectively within a business. It focuses on issues dealing with the following questions: How are we doing? How much cash do we have on hand? What should we spend our funds on? Where will our funds come from? How will our business be protected?
2. Identify the individuals responsible for the fi nance function.
The finance functions are usually divided between the controller, who is responsible for the internal financial activities of a business, and the treasurer, who is responsible for the external financial activities. If financial management is to be effective, operating managers should also perform this function.
3. Explain the four fi nancial objectives.
Financial management focuses on four basic objectives: efficiency (productivity of assets), liquidity (ability to meet current debt commitments), prosperity (improve-ment in activities such as revenue, profit, payment of dividends), and stability (appropriate balance between the funds provided by the shareholders and long-term lenders).
4. Comment on the three major types of business decisions.
Business decisions can be grouped under three broad categories: investing decisions, financing decisions, and operating decisions. Investing decisions deal with accounts such as non-current assets (e.g., machinery and equipment). Investing decisions have a significant impact on a company’s cash flow. Financing decisions deal with accounts such as non-current liabilities and equity. Financing decisions look at the best way to raise funds from different investors. Operating decisions deal with the accounts appearing on the statement of income, such as revenue, cost of sales, distribution costs, and administrative expenses. Effective operating decisions can improve profit for the year and, in turn, enhance a company’s equity position and ROA. Operating decisions also deal with the management of working capital accounts (current assets and current liabilities). Cash provided for working capital accounts is a drain on a company’s cash position. However, reductions in such assets, achieved by reducing either inventories or trade receivables, result in cash for operating activities.
5. Discuss issues related to corporate transparency and accountability.
Following recent financial scandals, there have been cries from all types of stake-holders and the general public for greater levels of corporate transparency and accountability. Both government and business have made far-reaching efforts to achieve that goal through government legislation, corporate governance, corporate culture, and global accounting and financial standards.
1 Learning Objective
2 Learning Objective
3 Learning Objective
4 Learning Objective
5 Learning Objective
01ch01.indd 4101ch01.indd 41 1/25/10 9:54 AM1/25/10 9:54 AM
NEL
42 CHAPTER 1 Overview of Financial Management
Key TermsBalanced scorecard (BSC) p. 27Chief executive officer (CEO) p. 12Chief financial officer (CFO) p. 12Controller p. 12Corporate culture p. 33Cost of financing p. 22Demassing p. 25Earnings before interest and taxes (EBIT) p. 28Efficiency p. 15External financing p. 19Financial management p. 9Financing decisions p. 22Financing mix p. 23Forms of financing p. 22Governance p. 31Gross profit p. 28Internal financing p. 18International Accounting Standards Board (IASB) p. 8
International Financial Reporting Standards (IFRS) p. 8Investing decisions p. 20Liquidity p. 16Matching principle p. 22Non-current assets p. 20Operating decisions p. 24Operating managers p. 13Planned downsizing p. 25Productivity measures p. 26Profit for the year p. 29Prosperity p. 17Sources of financing p. 22Stability p. 17Transparency p. 29Treasurer p. 12Weighted average cost of capital p. 22Working capital accounts p. 24
Review Questions 1. Define the meaning of financial management. 2. Why is it important for managers to ask questions such as “How are
we doing?” and “How will our business be protected?” 3. Differentiate between the role of the treasurer and the role of the
controller. 4. What are the four financial objectives? What do they mean? 5. Comment on the importance of the “return on revenue” financial
objective. 6. Who is responsible for the business decisions in a business? 7. Differentiate between internal financing and external financing. 8. What are investing decisions and financing decisions? 9. What are non-current assets? 10. What are working capital accounts? 11. What do we mean by the “matching principle”? 12. What is the “weighted average cost of capital”? 13. What is an operating decision? Give some examples. 14. How can “productivity indicators” and “rewarding quality work”
improve the bottom line?
01ch01.indd 4201ch01.indd 42 1/25/10 9:54 AM1/25/10 9:54 AM
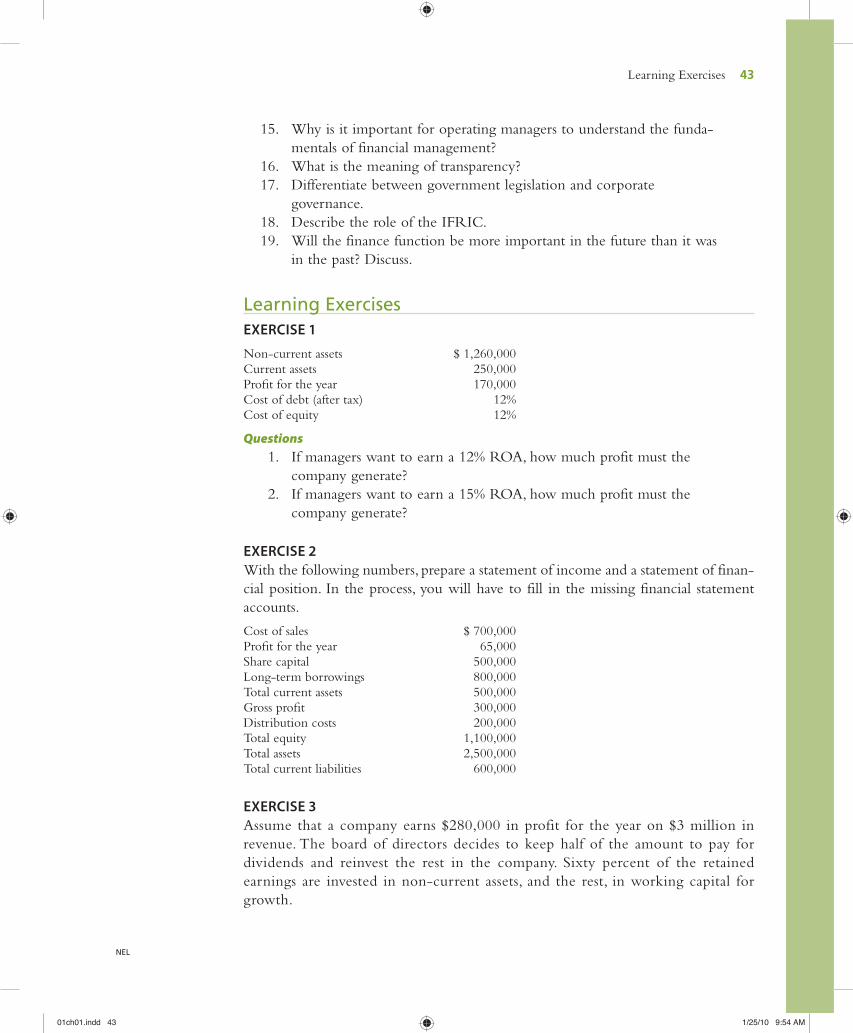
NEL
Learning Exercises 43
15. Why is it important for operating managers to understand the funda-mentals of financial management?
16. What is the meaning of transparency? 17. Differentiate between government legislation and corporate
governance. 18. Describe the role of the IFRIC. 19. Will the finance function be more important in the future than it was
in the past? Discuss.
Learning ExercisesEXERCISE 1
Non-current assets $ 1,260,000Current assets 250,000Profi t for the year 170,000Cost of debt (after tax) 12%Cost of equity 12%
Questions 1. If managers want to earn a 12% ROA, how much profit must the
company generate? 2. If managers want to earn a 15% ROA, how much profit must the
company generate?
EXERCISE 2With the following numbers, prepare a statement of income and a statement of finan-cial position. In the process, you will have to fill in the missing financial statement accounts.
Cost of sales $ 700,000Profi t for the year 65,000Share capital 500,000Long-term borrowings 800,000Total current assets 500,000Gross profi t 300,000Distribution costs 200,000Total equity 1,100,000Total assets 2,500,000Total current liabilities 600,000
EXERCISE 3Assume that a company earns $280,000 in profit for the year on $3 million in revenue. The board of directors decides to keep half of the amount to pay for dividends and reinvest the rest in the company. Sixty percent of the retained earnings are invested in non-current assets, and the rest, in working capital for growth.
01ch01.indd 4301ch01.indd 43 1/25/10 9:54 AM1/25/10 9:54 AM

NEL
44 CHAPTER 1 Overview of Financial Management
Questions 1. On the basis of the above information, calculate, as a percentage of
revenue, how much would be kept in the company for growth pur-poses (i.e., working capital and non-current assets), and how much would be used to pay dividends.
2. Explain who is responsible for making the split between the amount of funds to be retained in the business and the amount to be paid in dividends.
3. What do you think the board of directors would do if the profit for the year increased to $350,000?
EXERCISE 4Make a list of the following accounts under their respective business decisions:
Change in long-term borrowingsProfit for the yearAcquisition of a businessDepreciation/amortizationShare capital issueChange in trade receivablesNet change in short-term borrowingsSale of non-current assetsChange in trade and other payablesAdditions to property, plant, and equipment
EXERCISE 5
Sources Amounts
Trade and other payables $200,000Short-term borrowings 250,000Mortgage 500,000Long-term borrowings 250,000Share capital 300,000Retained earnings 800,000
The before-tax bank charges are 11.0% for the short-term borrowings, 10.0% for the long-term borrowings, and 10.5% on the mortgage. The shareholders expect to earn 16%. Assume that the company’s income tax rate is 50%.
Questions 1. Calculate the company’s after-tax cost of borrowing. 2. Calculate the company’s weighted average cost of capital.
01ch01.indd 4401ch01.indd 44 1/25/10 9:54 AM1/25/10 9:54 AM

NEL
Case 45
EXERCISE 6Owners of a business are contemplating investing $550,000 in non-current assets in early January 2011. They are exploring ways to finance it. In 2009, the company had $250,000 in trade receivables, an amount that it expects will increase to $275,000 in 2010. The inventory level for 2009 was $430,000 and, having introduced a new inventory management system, the owners expect to be more efficient in managing it. They forecast a level of $370,000 in inventories by the end of 2010. They expect a substantial increase in revenue, which will increase their profit from $150,000 in 2009 to $230,000 in 2010.
Questions 1. How much cash will be generated from internal operations by the end
of 2010? 2. Will the owners have to borrow money from investors in order to
finance the expansion? If yes, how much?
CasePACKARD INDUSTRIES INC.In 2010, the management committee of Packard Industries Inc. is considering investing $800,000 for the purchase of machinery and equipment in order to increase the productivity of its plant. In 2009, the company’s revenue amounted to $2,800,000, goods purchased from suppliers totalled $600,000, and the profit for the year was $280,000. The company’s 2009 statement of financial position is as follows:
Packard Industries Inc.Statement of Financial Position
As at December 31, 2009
(in $)
AssetsNon-current assets 1,000,000Current assets
Inventories 300,000Trade receivables 400,000Cash and cash equivalents 20,000
Total current assets 720,000Total assets 1,720,000Equity and liabilitiesEquity
Share capital 200,000Retained earnings 700,000Total equity 900,000Long-term borrowings 500,000
01ch01.indd 4501ch01.indd 45 1/25/10 9:54 AM1/25/10 9:54 AM

NEL
46 CHAPTER 1 Overview of Financial Management
Current liabilitiesTrade and other payables 170,000
Short-term borrowings 150,000Total current liabilities 320,000Total liabilities 820,000Total equity and liabilities 1,720,000
In 2010, management expects revenue to increase by 10%, and with cutbacks in different segments of their business activities, ROR is expected to improve to 12%. Cost of sales as a percentage of revenue is expected to show an improvement and decline to 20%.
Management also expects improvements in the working capital accounts. The company’s objective is to lower trade receivables to $370,000, with inventory levels expected to reach $280,000.
Questions 1. Calculate the company’s return on total assets for the year 2009. 2. How much cash will be provided by internal operations in 2010, in
particular by the following:• Retained earnings• Inventories• Trade receivables
3. How much will management have to get from external activities (shareholders and lenders) to proceed with an $800,000 investment in non-current assets?
01ch01.indd 4601ch01.indd 46 1/25/10 9:54 AM1/25/10 9:54 AM

01ch01.indd 4701ch01.indd 47 1/25/10 9:54 AM1/25/10 9:54 AM