overview of health promotion in taiwansuper7/49011-50001/49111-49121.pdf · overview of health...
TRANSCRIPT

Overview of Health Promotion
in Taiwan
Bureau of Health Promotion
Department of Health
1
2
� National health is a key gauge of national competitiveness. To increase physical, mental and social health in Taiwan, the BHP has taken its lead from the Alma-Ata Declaration of 1978and the five action areas for health promotion identified in the Ottawa Charter of 1986.
� BHP has been striving to set health-friendly public policies, bring about healthy communities, hospitals, schools and workplaces, enhance public consciousness of healthto usher in a society where health always comes first, and develop citizens’health skillsand readjust health services.
� The ultimate goal is to achieve “Health For All” enunciated by the World Health Organization.
� BHP also conducted public health surveillance, related research and development to made evidence-based policy goals and strategiesthat best meet present needs and future development.

3
Outline
� Taiwan Health Profiles
� Vision and Strategies of Health Promotion� Healthy Birth and Growth
� Healthy Living
� Healthy Environment
� Healthy Ageing
� Special Health Topics
� Health Surveillance
4
Taiwan Health Profiles
5
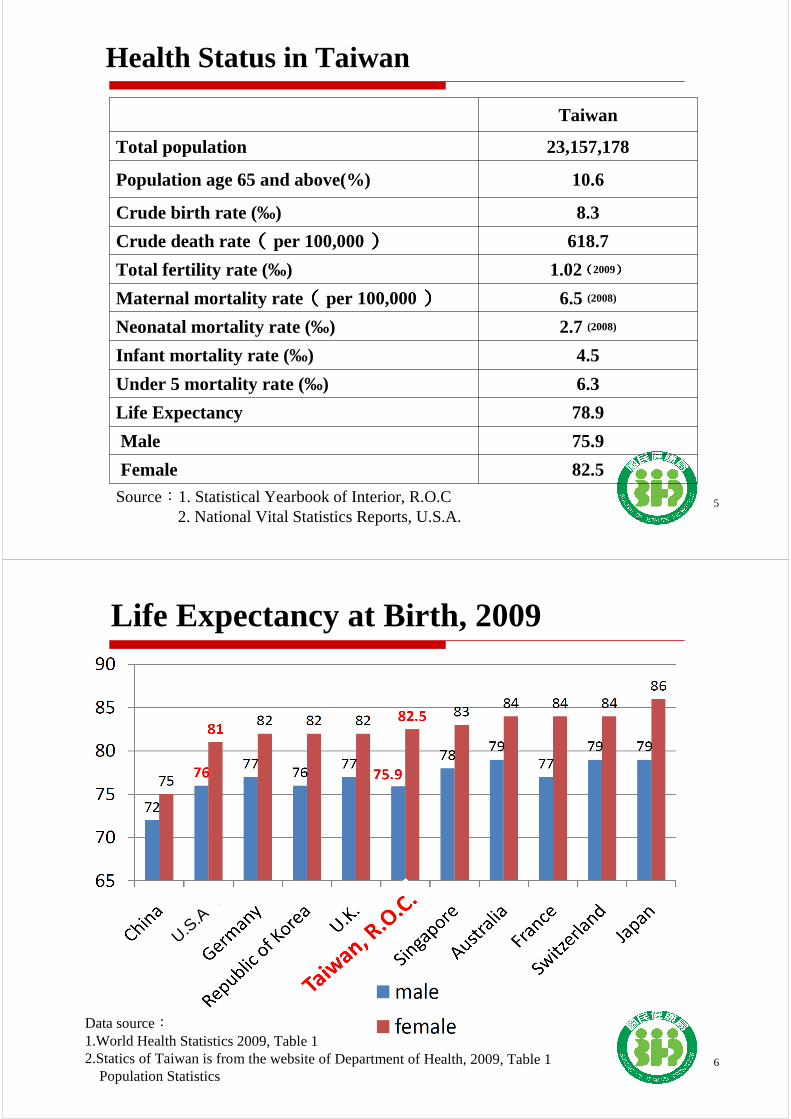
Health Status in Taiwan
Taiwan
Total population 23,157,178
Population age 65 and above(%) 10.6
Crude birth rate (‰) 8.3
Crude death rate(((( per 100,000)))) 618.7
Total fertility rate (‰) 1.02((((2009))))
Maternal mortality rate (((( per 100,000)))) 6.5 (2008)
Neonatal mortality rate (‰) 2.7 (2008)
Infant mortality rate (‰) 4.5
Under 5 mortality rate (‰) 6.3
Life Expectancy 78.9
Male 75.9
Female 82.5Source:1. Statistical Yearbook of Interior, R.O.C
2. National Vital Statistics Reports, U.S.A.
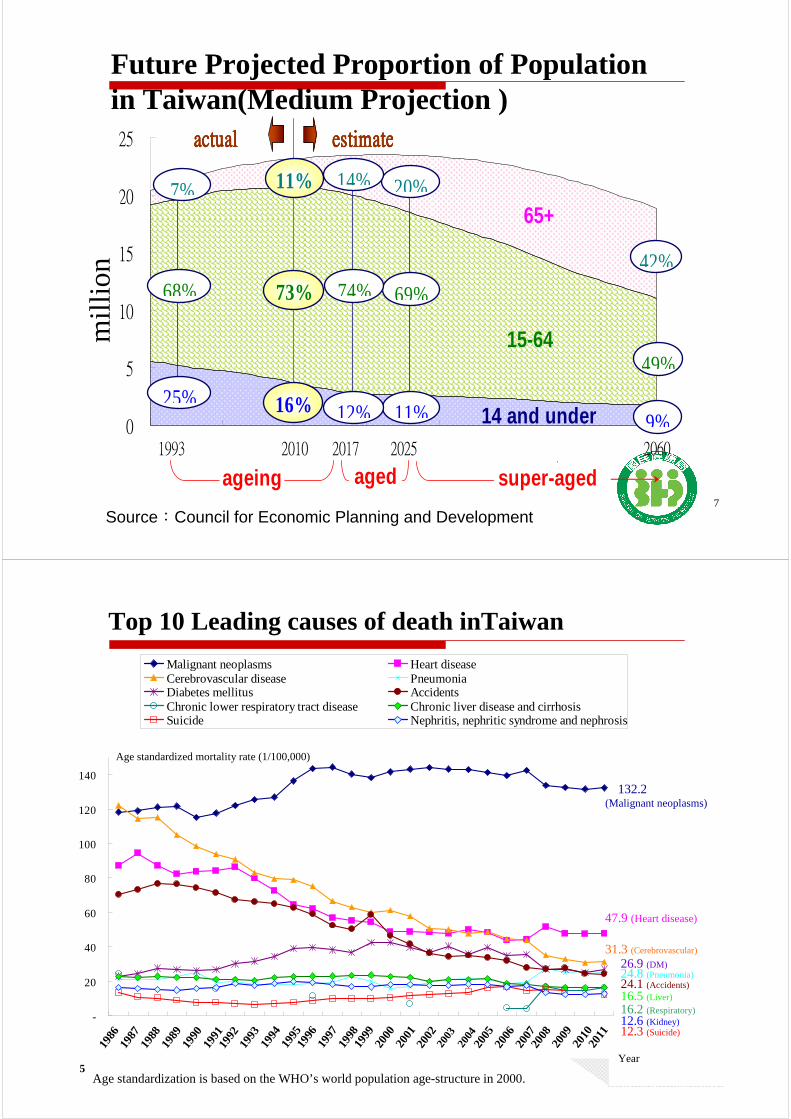
Data source:1.World Health Statistics 2009, Table 12.Statics of Taiwan is from the website of Department of Health, 2009, Table 1
Population Statistics
Life Expectancy at Birth, 2009
6
U.S.A
7
0
5
10
15
20
25
1993 2010 2017 2025 2060
mmmm
iiii
llll
llll
iiii
oooo
nnnn
actualactualactualactual estimateestimateestimateestimate
15-64
65+
14 and under
11%
73%
16%
42%
49%
9%
7%
68%
25%
20%
69%
11%
14%
74%
12%
ageing aged super-aged
Future Projected Proportion of Populationin Taiwan(Medium Projection )
Source:Council for Economic Planning and Development
mill
ion
-
20
40
60
80
100
120
140
1986
1988
1990
1992
1994
1996
1998
2000
2002
2004
2006
2008
2010
Top 10 Leading causes of death inTaiwan-
2 0 0 . 0
19
86
19
93
20
00
20
07
Malignant neoplasms Heart diseaseCerebrovascular disease PneumoniaDiabetes mellitus AccidentsChronic lower respiratory tract disease Chronic liver disease and cirrhosisSuicide Nephritis, nephritic syndrome and nephrosis
132.2 (Malignant neoplasms)
47.9 (Heart disease)
31.3 (Cerebrovascular)
24.8 (Pneumonia)26.9 (DM)
24.1 (Accidents)
16.2 (Respiratory)
16.5 (Liver)
12.3 (Suicide)12.6 (Kidney)
Age standardized mortality rate (1/100,000)
Year
Age standardization is based on the WHO’s world population age-structure in 2000.5
1993
1991
1989
1987
1986
1988
1990
1992
2001
1999
1997
1995
1994
1996
1998
2000
2009
2007
2005
2003
2002
2004
2006
2008
2011
2010

9
Vision and Strategies of Health Promotion
Cherish Life, Promote HealthCherish Life, Promote HealthIncreasing healthy life expectancyIncreasing healthy life expectancy
1010
Vision and Strategies
Prevention and Control of Noncommunicable Diseases Control ofChronic Diseases Prevention; Safety Protection)
Health Promotion (3P: Prevention, Protection, Promotion)
Cherish Life, Promote HealthCherish Life, Promote Health
ReorientHygieneServices
Develop andEnhance
Health Skills
Invigorate Communities
Create a supportive
environment
Developing public policies
for health
• Formulate a medical treatment and healthcare system conducive to health promotion
• Build a wellrounded system for preventing and caring for Noncommunicable diseases
• Turn medical care resources into health resources
• Health Literacy• Health Communication
• Health Surveillance and R&D
• Healthy Lifestyles
• Build healthy families, communities, schools, workplaces, hospitals
• Have health accepted as top priority in society
• Strengthen cross-sector cooperation
• Nurture a system conducive to health promotion
• Make industry healthy and bring health to industry
• Draft and amend laws and regulations
• Devise health policies for different societal groups
• Narrow gaps in citizen health

11
Healthy Birth and Growth
1.1. Maternal HealthMaternal Health� Systematic Reproductive Health Services
� Comprehensive Reproductive Health Regulations and Systems
1212
Preventive Services - Maternal Health Promotion
Before Pregnancy
Before the Due Date After the Due Date
10 Free Prenatal Examinations
Reproductive Health Services for Foreign Spouses
Promotion of Breastfeeding
Assisted Reproduction
Genetic Testing and Counseling Services
(including Prenatal Diagnosis )
Antenatal care coverage (%)
At least 1 visit: 98.16%At least 4 visits:
95.88%
12

13
Preventive Services - Maternal Health Promotion
Item Target Interval Content
Prenatal examinations for pregnant women
pregnant women
2 times
(<17 weeks)
Physical check-up, Blood and urine tests , Ultrasound examination, Health education
2 times
(17-29 weeks)
6 times
(>29 weeks)
Group B streptococcus screening
low income pregnant women
onceGroup B streptococcus culturing and screening
13
14
Utilization Rate of Prenatal Examinations
Source::::Data for 2002-2005 is taken from the Bureau of National Health Insurance 、data for 2006-2010 is based on BHP calculations Average utilization rate:thenumber of prenatal examinations/ the number of births multiplied by 10 prenatal tests
74.5
83.5
89.1
80.7
78.1
80.781.8
87.087.5 86.9 87.2 88.0 88.6
87.5 88.490.9
92.8
70.0
75.0
80.0
85.0
90.0
95.0
100.0
1995 1996 1997 1998 1999 2000 2001 2002 2003 2004 2005 2006 2007 2008 2009 2010 2011
Year
Util
iza
tion
rate
(%
)

15
Amniocentesis Rates for Pregnant Women over Age 34, 2000-2009
88.0%
87.3%
88.9%86.1%
83.3%
76.1%
75.5%
70.4%
77.5%
89.5%
50%
60%
70%
80%
90%
100%
2000 2001 2002 2003 2004 2005 2006 2007 2008 2009
Year
Util
iza
tion
rate
(%
)
16
Healthy Birth and Growth
2.2. Infant and Child HealthInfant and Child Health� Provision of Comprehensive Healthcare Services� Preventive Healthcare Services for Children
� Newborn Screening
� Upgrading the Competence of Health Professionals
� Creating a Friendly Environment Conducive to Breastfeeding
� Promoting Legislation on "Public Breastfeeding Act“
� Countermeasures to Rectify Sex Ratio at Birth Imbalances

1717
Newborns Pre-school childrenInfants Elementary school children
Preventive Services - Child Health Promotion
Fluoride application of teeth
Student physical
Check-ups
Elementary school students fluoride mouth rinse to prevent caries
New born screening for
congenital metabolic disorders
Preventive Health Examination for Children(vaccines, development screening, vision,
hearing, oral health screening)
Infant stool color
card
11 yrs1 yr 2 yrs 3 yrs 4 yrs 5 yrs 6 yrs 9 yrs 10 yrs1 day6 mons1
mon 7 yrs 8 yrs 12 yrs
Student physical
Check-upsVaccinatio
n
Strabismus/ Amblyopiascreening
Infants and
children’sHearing screening
18
Preventive Services - Newborns and Children
18
Item Target Interval ContentNewborn screening services
newborns once G-6-PD, CHT, CAH, PKU, HCU, Isovaleric acidemia, MSUD, GAL, MMA, GA1, MCAD
Hearing check newborns in low income families
once Hearing check
Preventive child health care services
children under 7 years old
7 times Physical check-up: Medical history of individual and family, height, weight, hearing ability, eyes, mouth and dental, growth and development appraisal
Examination of development: children hearing, language and Autism screening
Health counseling: Breast feeding, nutrition, childhood development, oral health care, eye care, injury prevention
Professionally applied fluoride treatment
children under 5 years old
semiannually Professional fluoride application by dentists, general oral examination, oral health education
Pit-and-Fissure Sealant Program for Children
elementary first and second grade students in mountainous area and first grade elementary school children of low-income families
once Pit-and-Fissure Sealant of first molar
18

19
Completion rate of Taiwan newborn screening
1.88% abnormality rate(96.76% of abnormality found are G6PD. The second highest abnormality found is CHT(2.87%)
3 screening laboratories31 hospitals
offering confirmation tests
99% of newborn babies receiving
screening
452 hospitals/ clinics nationwide offering sample taking service
6.7%
11.2%
23.2%
37.5%
56.3%
68.0%
79.4%
87.7%
94.1%
96.7%
97.8%
97.2%
98.7%
99.0%
98.4%
99.6%
99.7%
98.2%
99.6%
99.9%
100.0%
100.0%
100.0%
99.5%
98.7%
99.9%
0.0%
10.0%
20.0%
30.0%
40.0%
50.0%
60.0%
70.0%
80.0%
90.0%
100.0%
1984 1988 1992 1996 2000 2004 2008
2020
Maternal, Neonatal and Infant Mortality Rates
2.72.72.72.7
4.24.24.24.2
5.05.05.05.0
0
2
4
6
8
10
12
14
16
18
20
197119731975197719791981198319851987198919911993199519971999200120032005200720092011
Year
0
10
20
30
40
50
60
Neonatal
Infant
Maternal
1995: Birth Reporting System Initiated
Neaonatal and Infant mortality rate(per 1,000 live births)
Maternal mortality rate(per 100,000 live births)

21
Infant Mortality Rates by High/ Middle/ Low Rate Areas
Source: Department of Health, Taiwan; Ministry of the Interior, Taiwan
5.90
5.17
11.60
6.98
6.50
5.69
6.37
7.87
5.83 5.635.18
4.47
0.00
2.50
5.00
7.50
10.00
12.50
1998-2000 2001-2003 2004-2006 2007-2009
High Infant Mortality Rates Area
Middle Infant Mortality Rates Area
Low Infant Mortality Rates Area
Infant Mortality Rates ‰
Year
5.90/4.47=1.32
11.60/5.83=1.99
22
Baby- Friendly Hospital Initiative
ItemYear
No. of hospitals receiving
certification
Birth coverage rate of BFHI
2001 38 -
2002 58 -
2003 74 -
2004 77 39.2
2005 81 40.8
2006 82 41.3
2007 94 47.4
2008 94 46.3
2009 113 53.9
2010 144 67.2
2011 158 71.4

23
Promoting a Breastfeeding-Friendly Society
� Goal: To reduce barriers of and to promote breastfeeding in the communities� Strategies� Baby- Friendly Hospital Initiative � Collaboration with the Council of Labor Affairs to promote
breastfeeding-friendly workplaces. � Breastfeeding support �Hotline:0800-870870�Website:http://www.bhp.doh.gov.tw/mammy/�Workforce training
� Legislation in 2010:“Public Breastfeeding Act”to protect the right of breastfeeding in public places and require setup of
breastfeeding rooms in certain public places.
Exclusive Breastfeeding Rates, 2004-2011
Data resource:the national survey of exclusive breastfeeding rate, bureau health promotion, 2004, 2008-2011.Alterant definition: the rate in 2004 was surveyed the breastfeeding situation in different time;the rate form 2008 to 2011 was surveyed how long the babies fed with exclusive breast milk.
68.6
61.6
52.9
45.6
64.4 65.7
62.7
46.6
57.354.4
60.0
37.2
51.348.1
42.7
28.4
44.5
35.1
41.2
24.0
0
10
20
30
40
50
60
70
80
90
100
2004 2005 2006 2007 2008 2009 2010 2011
year
excl
usi
ve
bre
astf
eedin
g r
ates
(%)
exclusive under 1 month
exclusive under 2 months
exclusive under 4 months
exclusive under 6 months
the questionnaire from 2008 was surveyed how long the babies fed with exclusive breast milk

25
Screening for Hearing impairment
� Pre-school (3 y/o) pure tone audimetry hearing screenings in kindergartens carried out by public health nurses since 2001, screening rate from 25%(2002) to 87%(2010) .
� Newborn hearing screening: free for all newborn since March 15, 2012.
26
Screening for Vision in pre-school children
� Vision� Providing strabismus and amblyopia screenings
in children of four and five years old in kindergartens in the communities, carried out by trained teachers.

9 7
6 7 6 97 1
8 79 6
8 79 4
0
1 0
2 0
3 0
4 0
5 0
6 0
7 0
8 0
9 0
1 0 0
27
%
Screening rate(2011)Referral rate(2011)
Screenings for Strabismus and Amblyopiain Preschool Children
Screening rate
2004 2005 2006 2007 2008 2009 2010 2011
97
%
1 0 0 9 0 8 0 7 0 6 0 5 0 4 0 3 0 2 0 1 0 0 1 0 2 0 3 0 4 0 5 0 6 0 7 0 8 0 9 0 1 0 0
H u a l i e n C o u n ty
K e e lu n g C i t y
T a ip e i C o u n ty
Y u n l i n C o u n ty
T a i c h u n g C i t y
T a iw a n , R . O . C
T a in a n C i t y
N a n to u C o u n ty
K in m e n C o u n ty
K a o h s iu n g C i t y
Y i l a n C o u n ty
T a ip e i C i t y
T a i t u n g C o u n ty
P in g tu n g C o u n ty
M ia o l i C o u n ty
T a o y u a n C o u n ty
L i e n c h i a n g C o u n ty
H sin c h u C i t y
H sin c h u C o u n ty
C h i a y i C i t y
C h i a y i C o u n ty
C h a n g h u a C o u n ty
P e n g h u C o u n ty
94
2828
Oral health of children
1.2
3.76
4.954.95
3.673.31
2.58
0
1
2
3
4
5
6
7
8
1960 1970 1980 1990 2000 2010
1992: Launch ofNational Oral Health
2002: Comprehensivepromotion of fluoriderinse
Current
Year
1.Professionally applied fluoride treatment under 5 years old
2. A comprehensive fluoride mouth rinse program for elementary school children
3. Pit-and-Fissure Sealant Program for Underprevilidged ChildrenDMFT index for permanent teeth for 12-year-old children in Taiwan

29
Year
1.04
1.09
1.14
1.19
1.24
1.29
1987 1991 1995 1999 2003 2007 2011
Sex
Rat
io a
t Birt
h
Sex ratio at birth dropped to 1.1. It is the lowest in the past 16 years in Taiwan.
Source:1. Ministry of Interior, 1987-2003
2. Bureau of Health Promotion, Department of Health,Taiwan, 2004-2011
Countermeasures to Rectify Sex Ratio at Birth Imbalances
1.1341.079
1.102
First SecondThird and above total
1.208
1.258
1.103
Sex Ratio at Birth
30
Healthy Living
1. Tobacco Hazards Prevention and Control� MPOWER
� Monitor tobacco use and prevention policies
� Protect people from tobacco smoke via new ban
� Offer help to quit tobacco use
� Warnings on tobacco packages
� Enforce bans on tobacco advertising, promotion and sponsorship
� Raise taxes on tobacco

3131
MPOWER
�WHO Report on the Global Tobacco Epidemic, 2008 - The MPOWER Package
Monitor tobacco use and prevention policiesProtect people from tobacco smokeOffer help to quit tobacco useWarn about dangers of tobaccoEnforce bans on
tobacco advertising, promotion and sponsorshipRaisetaxes on tobacco
Monitor :Taiwan Adults Smoking Prevalence and projection to 2020(Age 18+)Taiwan Adults Smoking Prevalence and projection to 2020(Age 18+)
33.5
35.035.4
38.639.039.640.0
42.9
48.247.3
55.154.855.3
59.4
31.6
25.6
15.7
4.44.44.44.44.14.24.85.14.14.84.65.35.2
3.33.33.23.8
19.119.8
20.0
21.922.3
22.122.724.1
27.026.329.229.129.5
32.5
18.0
15.0
10.0
0
10
20
30
40
50
60
70
1990
1992
1994
1996
1998
2000
2002
2004
2006
2008
2010
2012
2014
2016
2018
2020年
Male Female Total
Source: 1. 1973-1996(Taiwan Tobacco company); 1999(Lee etc);2002(BRFSS); 2004-2011(Taiwan ASBS)Definition: Current smoker, During survey, smoke more than 100 cigarettes(5 packs) and smoking in past 30 daysAbbreviations: THWS- Tobacco health welfare surcharge, THPA: Tobacco Hazards Prevention Act
1997, THPA passed
2002, THWS NT$5(USD$0.16)
2006, THWS NT$10(USD $0.31)
2009, THPA amended THWS NT$20(USD$0.62)

33
Smoking rate
Taiwanes men smoking rate1.6 times of American’s , 1.7 times of Canadan’s
2011
33.5
4.4
Protect people from tobacco smoke via new banSmoking ban on all indoor public and work places plus some outdoor places
34

Environmental tobacco smoke exposure
8.28.28.28.2
19.919.919.919.9
30.730.730.730.7
24.924.924.924.9
20.820.820.820.8
27.227.227.227.2
33.033.033.033.035.235.235.235.2
9.19.19.19.19.09.09.09.0
23.723.723.723.7
29.029.029.029.0 30.330.330.330.3
0000
5555
10101010
15151515
20202020
25252525
30303030
35353535
40404040
2005200520052005 2006200620062006 2007200720072007 2008200820082008 2009200920092009 2010201020102010 2011201120112011
家庭家庭家庭家庭
禁菸場所禁菸場所禁菸場所禁菸場所
Amendment effective in 2009
Family
Public indoor places
35
Offer help to quit tobacco use� Smoking Cessation Outpatient Services(Since
2002,10,000/M)
� Distributed to 97%townships� Point abstinence rate at 6 month: 23.8%
� Second generation smoking cessation payment scheme (since March, 2012)
� Taiwan Smokers’ Helpline (Since 2003, 5,000/m)
� 30% success rate at 6 month
� CessationGroup-Therapy in the Community (Since 2002)
� Smoking Cessation Campaign (Quit & Win)
36

Extensive training on cessation educators
7,023
3913
2464
646
Trainee in 2012
(Jan.-Aug.)
19,524
11,932
5,198
2,394
Trainee in 2011
BackgroundEver
trainee by 2009
Trainee in 2010
Total(persons)
Physicians 8,475 2,733 14,248
Pharmacists 280 5,554 13,496
Others (nurses, psychologists, etc.)
900 19,083 35,828
Total 9,655 27,370 63,572
37
“Sign-to-quit campaign” with self-help manual
In 2010, 1,458,000 manuals distributed, 50.6% signed to receive follow-up calls, 35.5% found it helpful, 33.2% tried to reduce or quit smoking. 38

Smoke-free health care:Universal access to cessation help in clinical settings
39
� Pictorial Warnings on tobacco packages(effective in 2009)to cover at least 35% of the tobacco
package surface.
� Enforce bans on tobacco advertising, promotion and sponsorship� Raise taxes on tobacco� Tax Amount:Step-by-step increase� 2002:NT$5 ($0.15) / pack� 2006:NT$10 ($0.3) / pack� 2009NT$20 ($0.6) / pack
40
41
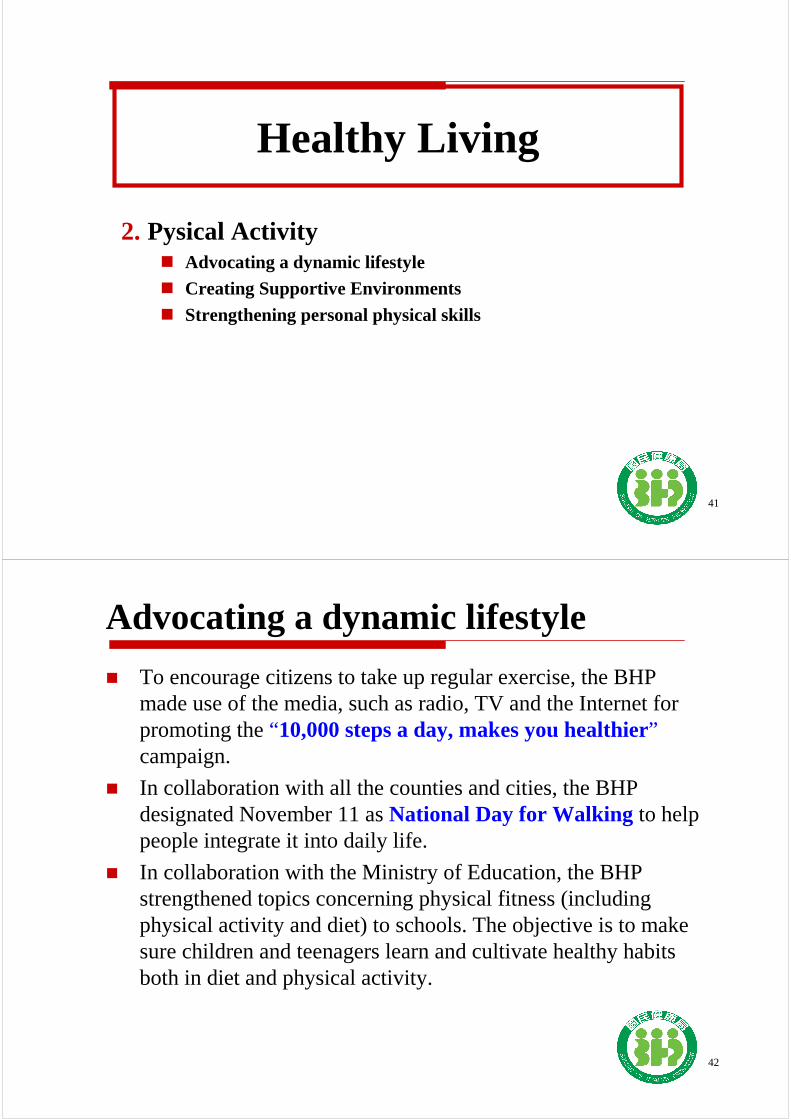
Healthy Living
2. Pysical Activity� Advocating a dynamic lifestyle� Creating Supportive Environments � Strengthening personal physical skills
42
Advocating a dynamic lifestyle
� To encourage citizens to take up regular exercise, the BHP made use of the media, such as radio, TV and the Internet for promoting the “10,000 steps a day, makes you healthier”campaign.
� In collaboration with all the counties and cities, the BHP designated November 11 as National Day for Walking to help people integrate it into daily life.
� In collaboration with the Ministry of Education, the BHP strengthened topics concerning physical fitness (including physical activity and diet) to schools. The objective is to makesure children and teenagers learn and cultivate healthy habits both in diet and physical activity.

43
Creating Supportive Environments
� Identify and improve the obesogenic environment� Community obesogenic environments assessment
� Building health information � Set up a website to provide information on healthy diets and
exercise.� Compile a list of frequently asked questions for the “Healthy
Centenary, Healthy Taiwan” campaign, and make it available for everyone to view online.
� Free healthy weight management telephone consultation service(0800-367-100)
� Provide updated information to the public through social channels such as Facebook.
� Create a healthy food supply system� Let People see, hear, buy and eat healthy foods.
� Construct dynamic living environments� Everyone can exercise wherever and whenever they can
Creating Supportive Environments
� Developing tools to examine obesogenic environments in 22 cities/counties and 368 townships
� Obesity prevention website
� Toll free helpline and internet telephony 0800-367-100
44

45
Supportive environments for healthy eating
�Healthy food certification �Aboriginal healthy meal �Healthy lunch box
�Three bundles of veggies cost NTD$ 10 �Lotus meal �Healthy lunch box
Calorie labeling in wholesale stores, lunch boxes, vending machines and chain restaurants
•label calorie info on their bakery products and deli foods.
46

47
Mayors advocate healthy eating� “Meat Free Monday” in
Taichung city and Chuanhuacounty government and schools
� 500 kilocalories menus with fresh local food ingredients in Hualien county
� “Healthy market” promote local food ingredients in Taoyuan county
� Local agriculture products-Broccoli in Chiayi county
Traditional Festival Smart Eats� Help industries make traditional festival foods that are
high in fiber and low in salt, sugar, fat and calories.� Educate the public on selecting healthy traditional festival
foods.� Rice dumpling press conference
� Osmanthus rice dumpling
� Creative grain meal
� Snacks for New Year
� Moon cake by TMH

49
Supportive environments for dynamic lifestyle
�walking trails
�Cycling paths
�Happy farm�pedestrian spaces
Supportive environments for active living
50
Calorie labeling on stairs
Healthy Exercise on fixed time and places led by volunteer in Community of Tainan
�Exercise in elementary schools
�Healthy walking in community
�Exercise in BHP

Supportive environments for active living
� Spent calories are marked on walking paths in ChiayiCity
51
Supportive environments for active living
� Meiluen Mountain healthy walk paths, Hualien County
� Path distance and calories spent are marked on the path map.
� Walk paths are planned according to time of exercise and body weights – 6 different routes in total.
52

Supportive environments for active living
� Calories spent after running are clearly labeled by the Meiluen Track Ground in Hualien County, based on user’s weight and time spent exercising.
53
Supportive environments for active living
� Calories spent after cycling for 1km is labeled on bike paths in Chia Yi county, based on the weights of the cyclists.
54

Develop Personal Skills� Designing Health Exercise
� Media promotion planning and national sweepstakes� Conduct 1st and 2nd wave survey to know the change of KAP� Set up obesity prevention website http://obesity.bhp.gov.tw� Free healthy weight management telephone consultation service(0800-367-
100)� Video whiteboard on the topic of Healthy
Weight Loss� Compile a list of frequently asked questions
for the “Healthy Centenary, Healthy Taiwan”campaign, and make it available for everyone to view online.
55
Health Exercise Disk Downloadable Health Exercise video Health Exercise Press conference
56
Guidebook, brochures, billboards, and Instruction Manuals
� Instruction Manuals for hospital, workplace, local health bureauand school to assist all sectors in implementing healthy weight loss management
� Distribute guidebooks and brochures of “Healthy Centenary, Healthy Taiwan” to help people learning “Healthy eating, Happily exercise, Weigh everyone”
billboardbrochure
Healthy living guidebook for people
Instruction Manuals

57
3.Education materials
7.Healthy martial arts for all age groups5.Aboriginal healthy exercises
6.Healthy weight management weaved into local tourism –aboriginal harvest dances
Develop Personal Skills
2.Obesity Prevention section on the BHP official website
4.Calorie comparison chart by BHP – to burn the calories of a single cup of Bubble tea, one has to climb the entire floors of Taipei 101!
1.Healthy rice dumping
58
Healthy Environment
� Healthy Settings� Healthy Hospitals
59
Partners of Health Promotion
� Public health team: central and local
� Healthcare team: public and private
� Community participation through places where people live, work, study, seek care, etc.
� Academic field
� NGOs
� Media
� Political power: political leaders, central and local governments
� Industry
60
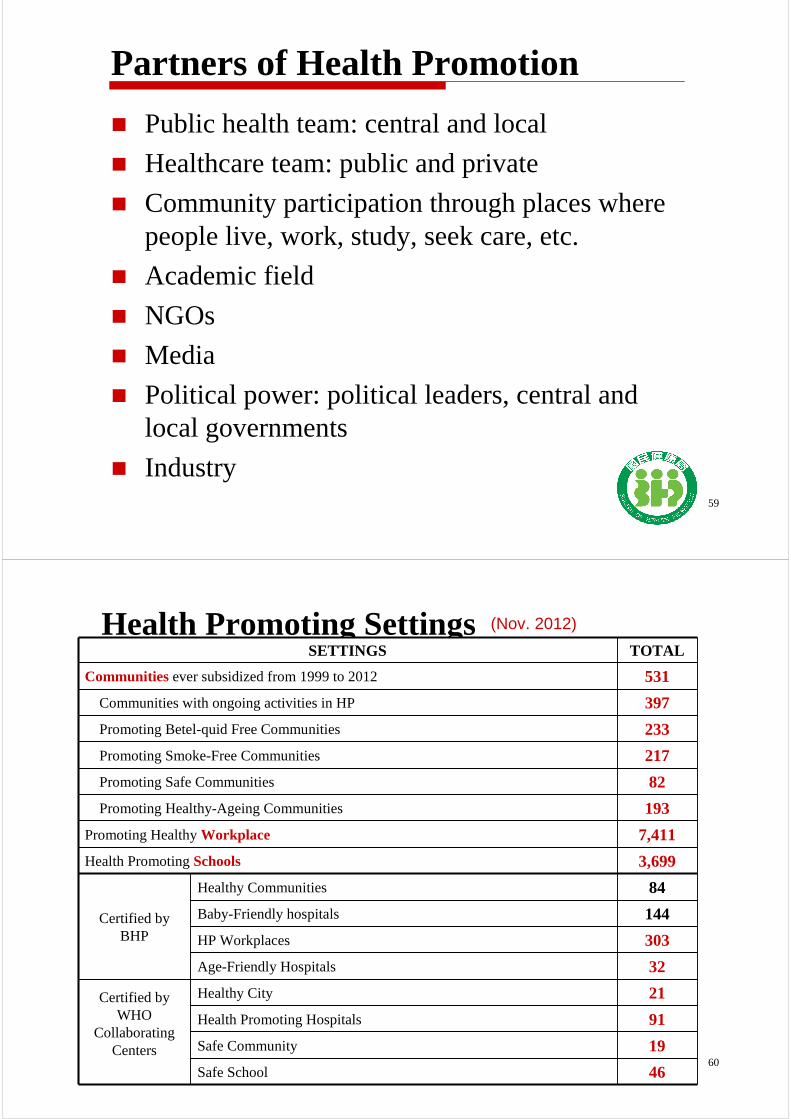
Health Promoting Settings
303HP Workplaces
SETTINGS TOTAL
Communitiesever subsidized from 1999 to 2012 531
Communities with ongoing activities in HP 397
Promoting Betel-quid Free Communities 233
Promoting Smoke-Free Communities 217
Promoting Safe Communities 82
Promoting Healthy-Ageing Communities 193
Promoting Healthy Workplace 7,411
Health Promoting Schools 3,699
Certified by BHP
Healthy Communities 84
Baby-Friendly hospitals 144
Age-Friendly Hospitals 32
Certified by WHO
Collaborating Centers
Healthy City 21
Health Promoting Hospitals 91
Safe Community 19
Safe School 46
(Nov. 2012)

61
International Certification
� Healthy Cities: a total of 10 cities/counties and 11 districtsjoined in the Alliance of Healthy Cities in the WPRO.
� Safe Communities and Safe Schools : a total of 19 communities and 46schools were approved by the WHO International Community Safety Promotion Center.
� Health Promoting Hospitals: 91Hospitals have joined the WHO International Network of Health Promoting Hospitals.
WHO Collaborating Centre
for Evidence-Based Health Promotion in Hospitals
(Nov. 2012)
62
Health Promoting Hospitals
� Establishment of Taiwan HPH Network ( 1st Network in Asia), Dec. 2006
� Taskforce on HPH and Environment was approved to set up with 4-year periods by General Assembly of International HPH Network in 2010.
--Dr. Chiou is the leader--164Taiwan hospitals and 10 foreign institutions have joined this task force.
� Dr. Chiou was elected as the Chair of International HPH Network in Apr. 2012
� The 20th International HPH Conference was successfully hosted by Taiwan in April of 2012 – the first time it ’s outside of Europe.
TAIWAN
• International HPH Network established in 1990
• Up to Nov. 2012(data from: www.hphnet.org)-- over 900 member hospitals from 40
countries-- 40 National/Regional HPH Network

63
Healthy Ageing
1. Four Key Components of Proactive Approaches to Healthy Ageing� Preventive services and Disease management
� Age-friendly health services
� Community health promotion for elderly
� Towards an age-friendly society
64
Preventive Services for Adult and Elderly
Item Target Interval Content
Adult preventive health services
People aged 40-64 3 years Physical examination ,Health education, Blood test, urine routine test
People over 65 years old
1 year
People who suffering from polio over 35 years old
1 year
Indigenous people over 55 years old
1 year
64

65
Universal coverage of health services
� Provided jointly by National Health Insurance and Bureau of Health Promotion
� Scope: � evidence-based screenings, such as screening for:
hypertension, hyperlipidemia, diabetes, obesity, GFR, health consultation, cervical cancers, CRC, breast cancer, oral cancer. � immunization (elderly flu shot), � smoking cessation, � acute and chronic illness care, � medications, � surgeries, � basic dental services, etc.
66
Disease management for chronic conditions
Ex.
� Diabetes
� Hypertension
� Chronic kidney disease
� Depression
� Asthma
� etc.

67
Components of disease management -1
� Evidence-based guidelinesfor diagnosis, management and follow-up
� Trainingand certification for healthcare providers based on the guidelines
� Team-based careby doctors + nurses, dieticians, care managers, etc.
� Cooperationbetween providers
� Quality indicators and monitoringof performance
� Extra payfor good performance
68
� Planned careaccording to the guidelines, with:� Patient registry� Computerized decision support and reminding for
providers� Regular review of complications � Reminding for patients to return for treatment and
follow-up � Personal health record for patients to carry
� Patient empowerment:� Health education and shared decision making� List of resources (ex. for group physical activity,
healthy foods, etc.)� Patient groups
Components of disease management -2

69
Taiwan’s Framework of Age-Friendly Hospitals and Health Services� Based on:
� WHO age-friendly principles
� WHO Standards of Health Promoting Hospitals
� 32 Hospitals in Taiwan are Age-Friendly certified (November 2012)
� Working Group on HPH and Age-Friendly Health Care was approved by General Assembly of International HPH Network in Apr. 2012 -- Dr. Chiou is the leader
70
2009-2012Priority topics in community
1. Physical activity 5. Smoking cessation
2. Falls prevention 6. Mental health promotion
3. Nutrition 7. Social participation
4. Oral health 8. Screening
Community Health Promotion for ElderlyNational Program on Healthy Ageing

71
Health promotion station
72
Grandpa-grandma fun contest;Will have 1000+ teams in 2011
Fall prevention exercise show

73
Community screening
74
WHO Age-Friendly Cities - A Guide

75
Age-Friendly Cities Project� in 2010: 1 pilot city
�Commitment of the mayor and inter-department cooperation of the city government
�Collecting the views regarding the problems, needs and priorities from the elderly;
�Developing locally-tailored age-friendly city indices�Review of age-friendliness in major policies and services
� in 2011:�Develop a three-year action plan based on the results of needs
assessment and self-assessment�Apply to the WHO Global Network of Age-friendly Cities.�Extend to 8 counties/cities.
� in 2012:�20 cities/counties participate
Vision� in 2013:all counties/cities in Taiwan
76
President Ma visited seniors in Chia-Yi City (the first pilot age-friendly city in Taiwan)

77
President Ma led all to pledge toward an age-friendly society
Minister of Health
PresidentMa
Mayor Hwang DG Chiou
0000
10101010
20202020
30303030
40404040
50505050
60606060
70707070
2007 2008 2009 2010
Exercise
52.3
68.4
24.0
Year
5 Fruits& Vegetables
32.3
62.6
52.9
13.4
31.4
44.340.5
34.8 35.335.3 35.0
Community Participation
Check-up
Elderly health promotion indicators : -1Exercise, Community participation, Check-up & Fruit
Source from::::
Exercise, 5 Fruits & Vegetables: Behavioral Risk Factor Surveillance System (BRFSS)Community participation : National Health Interview Survey (NHIS)Check-up: Use of Prevention Healthcare Services for Adults

Elderly health promotion indicators : -2Smoke, Suicide
0000
5555
10101010
15151515
20202020
25252525
30303030
35353535
40404040
2007 2008 2009 2010 2011
Suicide(deaths/100,000)
Smoke(%)
36.333.9
16.7
10.1
Year
36.6
17.2
12.110.9
35.8
32.2
Source from::::
Suicide: Death report systemSmoke: Adult Smoking Behavior Surveillance System (ASBS)
80
Healthy Ageing
2. Prevention and Control of Major Chronic Diseases -Cancer as an example� Screening for Major Types of Cancer
� Quality of Cancer Care
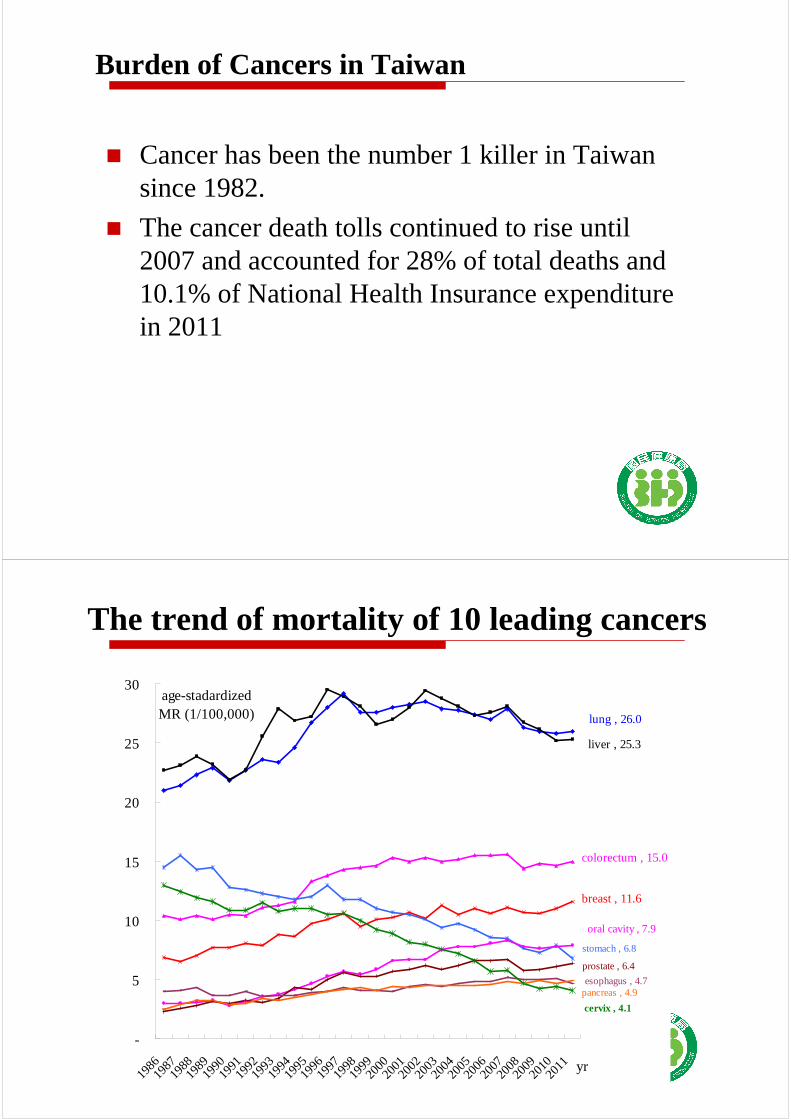
Burden of Cancers in Taiwan
� Cancer has been the number 1 killer in Taiwan since 1982.
� The cancer death tolls continued to rise until 2007 and accounted for 28% of total deaths and 10.1% of National Health Insurance expenditure in 2011
lung , 26.0
liver , 25.3
colorectum , 15.0
breast , 11.6
stomach , 6.8
oral cavity , 7.9
prostate , 6.4
esophagus , 4.7pancreas , 4.9
cervix , 4.1
-
5
10
15
20
25
30
198619
8719
8819
8919
9019
9119
9219
9319
9419
9519
9619
9719
9819
9920
0020
0120
0220
0320
0420
0520
0620
0720
0820
0920
1020
11 yr
age-stadardizedMR (1/100,000)
The trend of mortality of 10 leading cancers

Source: 1. GLOBOCAN 2008, IARC
2. Chinese Taipei data from 2008 Taiwan Cancer Registry and 2008 Statistics of Major Causes of Death
Cancer -- Incidence & Mortality Rate
Age-standardized rate (ASR), 1/100,000, 2008
196.0142.9
150.5
201.1262.4
300.2
282.1314.1
300.4274.3
241.4
266.9244.1
181.0
90.193.4
93.6
94.8100.5
104.1
105.9102.8
107.3110.6
109.5
115.8120.7124.6
350 300 250 200 150 100 50 0 50 100 150
Singapore
Malaysia
Thailand Japan
Korea
US Germany
Australia France
Italy
Spain UK
Taiwan
China Incidence rate Mortality rate
Cancer is the top leading cause of death in Taiwan. The incidence and mortality rates are both higher than many other countries
84
Objectives of National Cancer Control Program
� Long term: reducing standardized mortality rate by 10%
Cancer Target
2009 2013
RegularScreening
rate
Regular screening
rate
Lifetime screening
rate
Cervical Ca.3-yr pap smear (or HPV) for female aged 30-69
58%%%% 70%%%% -
Breast Ca.2-yr mammogram for female aged 45-69 11% 30%%%% 55%%%%
Colorectal Ca.
2-yr i-FOBT for people aged 50-69 10%%%% 50%%%% 70%%%%
Oral Ca.
2-yr visual inspection of oral cavity for smokers and betel-quid chewers aged 30+
28%%%% 50%%%% 70%%%%

85
Establish healthylifestyle
Cancer researchCancer research Cancer surveillanceCancer surveillance
Improve quality of treatment
Palliative care
Promote cancerscreening
strategy
Lower cancer mortality
Strategy of Cancer Control
86
Betel quid health hazard prevention
Tobacco hazard prevention
Healthy diet, exercise, obesity control
Hepatitis vaccination and treatment
HPV vaccination
1. Public heath education
2. Forum to collect opinions from different organizations
3. Complete HPV vaccine policy assessment report
4. Free vaccination for teenagers in low-income household and remote areas from 2011
Strategy - Establish Healthy Lifestyle
1. Public health education2. Create betel quid-free environment in schools, workplace, army and communities
3. Betel quid quitting services
Healthy Lifestyle

Strategy - Promote Cancer Screening
Cancer Target Tool Interval
Cervical Ca.
Women aged ≧30 Pap smear 3 years
Women refused Pap Smear
HPV test 5 years
Breast Ca.1.Women aged 45-692.Women aged 40-44
with family historyMammography 2 years
Colorectal Ca. People aged 50-69 i-FOBT 2 years
Oral Ca.Betel-quid chewers and smokers aged ≧30
Oral mucosa exam
2 years
Evidences of Cancer Screening
* 90年基隆市社區闔家歡健康篩檢成果發表;**93年社區到點篩檢服務計畫之經濟評估
Screening toolEffectiveness/Mortality
(screening interval) ICER
(screening interval)
Pap smear ↓60-90% (3-5 years) 12.3 thousand USDs(3 years)
Mammography ↓21-34% (1-3 years)40.3 thousand USDs(2 years)
Oral mucosa exam
↓43% (3 years)11 thousand USDs(2 years)
i-FOBT ↓18-33% (1-2 years) Dominated

89
� Promote screening through mass media and working with NGOs and enterprises
� Provide accessible services (mobile clinics)
� Subsidize hospitals to integrate cancer screening into daily practice� reminding system in the outpatient service
� patient-friendly screening services
� Establish an effective referral and follow-up system for screened positive cases
� Conduct QC program to ensure screening quality� personnel training and certification� medical institution accreditated and regular quality evaluation� data analysis, feedback and monitoring
Strategy - Promote Cancer Screening
90
Positive Predictive Value & Case Yield of Screening Program, 2011
Cancer
PPV Case Yield
Pre-cancer
Cancer TotalPre-cancer
Cancer Total
Cervical 1/2 1/5 1/2 1/92 1/293 1/70
Breast 1/17 1/17 1/172 1/172
Colorectal 1/2 1/19 1/2 1/26 1/257 1/24
Oral 1/22 1/36 1/13 1/326 1/394 1/178

8
11
10
1212
19
24
30
35
33
3030
23
32
2928
2626
2727
2525
29
27 27
2625
21
18
16
18
15
1312
1111
11 11 1110 10
109 9
8 8 7 76
6 6 5
0
5
10
15
20
25
30
35
40
80 81 82 83 84 85 86 87 88 89 90 91 92 93 94 95 96 YearYearYearYear
原位癌發生率 侵襲癌發生率 死亡率
The started yearfor Pap smear service
ASR
Unit: Per 100,000
1991 1992 1993 1994 1995 1996 1997 1998 1999 2000 2001 2002 2003 2004 2005 2006 2007
MortalityThe incidence of invasive cancer
The incidence of carcinoma in situ
The age-standard mortality and incidence rate of cervical cancer declined to 62% and 51% largely
The Trend of Incidence & Mortality of Cervical Cancer in Taiwan
92
Strategy - Improve Quality of Cancer Care
� Subsidize hospitals to enforce “ Regulations for
Cancer Care Quality Assurance Measures”
� Conduct the accreditation program of cancer care
� hospitals with more than 500 new diagnosed cancer cases
every year are qualified for application
� among 43 qualified hospitals, 41 hospitals received
certification.
� Develop quality indicators of cancer care to evaluate the performance of hospitals
� data analysis, feedback and monitoring

Lienchiang County
No. of Hospitals 012≧≧≧≧3
Note:1.Medical Center 2.Regional Hospital
6 counties without any qualified hospital
Distribution of hospitals with accreditation of the comprehensive cancer care quality
Performance on the core measures of breast cancer treatment
98%98%98%98%
65%65%65%65%
83%83%83%83% 80%80%80%80%69%69%69%69%
36%36%36%36%
44%44%44%44%
26%26%26%26%
44%44%44%44%
77%77%77%77%
91%91%91%91%
86%86%86%86%
91%91%91%91%
98%98%98%98%
71%71%71%71%
85%85%85%85% 84%84%84%84%68%68%68%68%
49%49%49%49%
48%48%48%48%
29%29%29%29%
47%47%47%47%
81%81%81%81%
84%84%84%84%
0%
20%
40%
60%
80%
100%
The ratio of histologic or cytologic confirmation before
surgery
The ratio of breast conserving surgery performed in
stage I breast cancer
The ratio of breast conserving surgery performed in
stage II breast cancer
The ratio of breast conserving surgery performed in T1
breast cancer
The ratio of sentinel node sampling in stage 1 and 2
breast cancer with tumor size less than 3 cm
The ratio of more than ten examed axillary lymph
nodes in invasive carcinoma (lobular or ductal)
The ratio of less than ten examed axillary lymph
nodes in carcinoma in situ (lobular or ductal)
The ratio of post-operative adjuvant radiotherapy
following breast conserving surgery in stage 1 to 3
breast cancer
The ratio of post-opeartive radiotherpay in breast
cancer underwent MRM with more than 3 positive
nodes
The ratio of tumor size showed in pathologic report
The ratio of adjuvant chemotherapy in stage 2-4 breast
cancer patients with age under 60
The ratio of adjuvant chemotherapy in breast cancer
patients with tumor bigger than 1cm and age under 60
2007-20082007-20082007-20082007-2008
2009 2009 2009 2009
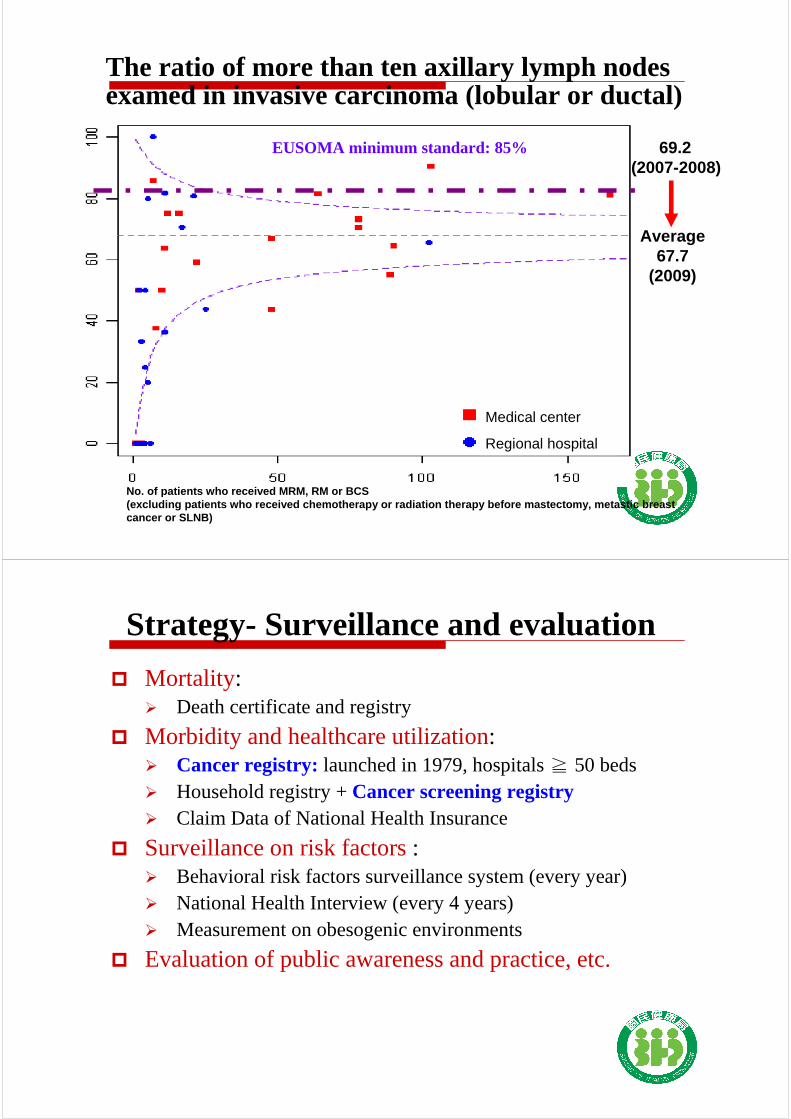
The ratio of more than ten axillary lymph nodes examed in invasive carcinoma (lobular or ductal)
No. of patients who received MRM, RM or BCS(excluding patients who received chemotherapy or ra diation therapy before mastectomy, metastic breast cancer or SLNB)
Medical center
Regional hospital
Average 67.7
(2009)
69.2(2007-2008)
EUSOMA minimum standard: 85%
Strategy- Surveillance and evaluation
� Mortality:� Death certificate and registry
� Morbidity and healthcare utilization:� Cancer registry: launched in 1979, hospitals ≧ 50 beds� Household registry + Cancer screening registry� Claim Data of National Health Insurance
� Surveillance on risk factors: � Behavioral risk factors surveillance system (every year)� National Health Interview (every 4 years)� Measurement on obesogenic environments
� Evaluation of public awareness and practice, etc.

97
Special Health Topics
� Preventive healthcare services for aboriginal adults� Oral care for people with disabilities� Services for new immigrants
Preventive healthcare services for aboriginal adults
(A)Provided once every year for aboriginals aged 55 years and older since July, 2010.
(B)An aboriginal version handbook of adult preventive health services was compiled and distributed to the eligible groups to improve their compliance with preventive healthcare and self-management of health.
(C)28,000 aboriginal adults availed themselves of the services in 2011, and the number of users is expected to be 29,000 in 2012.
98

Oral care for people with disabilities
Oral health of people with disabilities was inferior to that of the general public, and the Five-Year Oral Health Program for peoplewith disabilities was conducted in 2008.
(A)12 home service teams were established during 2010-2011 and provided oral care services to 4,000 people with disabilities
(B)Provided oral care services to 25,000 people with disabilities at homes and 154 specialized institutions during 2008-2012
99
100
Services for new immigrants
Home visit
Health education Family support groups
(A)Enroll in the National Health Insurance
(B)Reproductive health promotion and management: 99%
Health education
(C)Enhance mandarin ability
(D)Life skill education & guidance

101
Health Promotion Research and NCD Surveillance
102
Sources of NCD Surveillance Data
� Registration system� Household registration system (MOI)� Birth reporting system (BHP)� Death reporting system (DOH)� Cancer registration (BHP)
� Administration system� The National Health Insurance data (BNHI)� MCH service data base (BHP)
etc……
� Survey

103
NCD Surveys on population across lifespan
Infant Child Adolescent ElderlyAdult
Taiwan Fertility and Family Survey
(TFFS) 20-49
Global School-based Student Health
Survey (GSHS) 13-18
National Health Interview Survey (NHIS) 0-100
Community-based survey
Student self-administered surveyTelephone survey
Taiwan Birth CohortStudy (TBCS) 6mo+
Taiwan Longitudinal Studyon Aging (TLSA) 50+
Behavioral Risk factors Surveillance System (BRFSS) 18+
Adult Smoking Behavior Surveillance System (ASBS) 18+
Global Youth Tobacco Survey (GYTS) 13-18
Cross-sectional
Longitudinal
Children and AdolescentBehaviors in Long-termEvolution (CABLE) 7-20
Nutrition and Health Survey in Taiwan (NAHSIT) 0-100
The Survey on Prevalence of Hypertension, Hyperglycemia andHyperlipidemia in Taiwan (T3H) 15+
Application of Internationally Comparable Tool
�Washington Group Questions on Disability (NHIS,2013)
Others
�Global School-based Student Health Survey (GSHS,2012~)
�Global Health Professions Student Survey(GHPSS,2009~)
�The European Health Literacy Survey (NHIS,2013)
�Global School Personnel Survey (GSPS,2004 ~)
�Global Youth Tobacco Survey (GYTS,2004 ~)
WHO protocol
104

105
Thank YouIf you have any questions or sugestions, please contact Vivian Liu at [email protected]
Cherishing Life,Promoting HealthCherishing Life,Promoting Health