overview of observations from the radagast experiment …sgs02rpa/papers/slingo2008radagast1.pdf ·...
TRANSCRIPT

Overview of observations from the RADAGAST experiment
in Niamey, Niger: Meteorology and thermodynamic variables
A. Slingo,1 N. A. Bharmal,1 G. J. Robinson,1 J. J. Settle,1 R. P. Allan,1 H. E. White,1
P. J. Lamb,2 M. Issa Lele,2 D. D. Turner,3 S. McFarlane,4 E. Kassianov,4 J. Barnard,4
C. Flynn,4 and M. Miller5,6
Received 2 February 2008; revised 13 May 2008; accepted 23 June 2008; published 17 October 2008.
[1] An overview is presented of the meteorological and thermodynamic data obtainedduring the Radiative Atmospheric Divergence using Atmospheric Radiation Measurement(ARM) Mobile Facility, Geostationary Earth Radiation Budget (GERB) data, and AfricanMonsoon Multidisciplinary Analysis (AMMA) stations (RADAGAST) experiment inNiamey, Niger, in 2006. RADAGAST combined data from the ARM Program MobileFacility (AMF) at Niamey airport with broadband satellite data from the GERB instrumenton Meteosat-8. The experiment was conducted in collaboration with the AMMA project.The focus in this paper is on the variations through the year of key surface andatmospheric variables. The seasonal advance and retreat of the Intertropical Front and theseasonal changes in near-surface variables and precipitation in 2006 are discussed andcontrasted with the behavior in 2005 and with long-term averages. Observations from theAMF at Niamey airport are used to document the evolution of near-surface variablesand of the atmosphere above the site. There are large seasonal changes in these variables,from the arid and dusty conditions typical of the dry season to the much moister and morecloudy wet season accompanying the arrival and intensification of the West Africanmonsoon. Back trajectories show the origin of the air sampled at Niamey and profiles forselected case studies from rawinsondes and from a micropulse lidar at the AMF sitereveal details of typical atmospheric structures. Radiative fluxes and divergences arediscussed in the second part of this overview, and the subsequent papers in this specialsection explore other aspects of the measurements and of the associated modeling.
Citation: Slingo, A., et al. (2008), Overview of observations from the RADAGAST experiment in Niamey, Niger: Meteorology and
thermodynamic variables, J. Geophys. Res., 113, D00E01, doi:10.1029/2008JD009909.
1. Introduction
[2] Field studies play a important role in providing newdata for studying atmospheric processes and for evaluatingand improving numerical models. Given the fundamentalrole of atmospheric radiation in the climate system and ofchanges in the radiation balance in forcing climate change,observations of radiative fluxes are particularly important.Uncertainties in the radiative properties of clouds continueto motivate airborne campaigns [e.g., Ackerman et al.,2003]. The growing appreciation of the role of aerosols ininfluencing the radiation budget and climate change, either
directly or indirectly through their impact on cloud properties,is another driver for both airborne studies [Haywood et al.,2003] and for large-scale experiments such as the IndianOcean Experiment (INDOEX [Ramanathan et al., 2001]).There is thus a continuing need for new observations thatcan be used to test our understanding of radiative processesand the expression of this understanding in numericalmodels. These observations should cover the entire rangeof conditions experienced on the planet. This was a majordriver for the Radiative Atmospheric Divergence usingAtmospheric RadiationMeasurement (ARM)Mobile Facility,Geostationary Earth Radiation Budget (GERB) data, andAfrican Monsoon Multidisciplinary Analysis (AMMA) sta-tions (RADAGAST) experiment, which took place inNiamey, Niger, in 2006. One of the unusual aspects of thisexperiment was its length; observations were obtained fromlate 2005 through to the beginning of 2007, providing arecord that samples the entire range of conditions throughboth the dry and wet seasons in 2006.[3] RADAGAST coordinated surface and remote sensing
measurements made by the U.S. Department of EnergyARM Program Mobile Facility (AMF) situated in Niamey(13� 290N, 2� 100E) and by the GERB broadband radiometer
JOURNAL OF GEOPHYSICAL RESEARCH, VOL. 113, D00E01, doi:10.1029/2008JD009909, 2008ClickHere
for
FullArticle
1Environmental Systems Science Centre, University of Reading,Reading, UK.
2CIMMS, University of Oklahoma, Norman, Oklahoma, USA.3Space Science and Engineering Center, University of Wisconsin-
Madison, Madison, Wisconsin, USA.4Pacific Northwest National Laboratory, Richland, Washington, USA.5Brookhaven National Laboratory, Upton, New York, USA.6Now at Environmental Sciences Department, Rutgers University, New
Brunswick, New Jersey, USA.
Copyright 2008 by the American Geophysical Union.0148-0227/08/2008JD009909$09.00
D00E01 1 of 18

and multichannel Spinning Enhanced Visible and InfraredImager (SEVIRI) on the Meteosat-8 operational geostationarysatellite (stationed above 0� longitude). The combination ofan extended series of broadband measurements both at thesurface and from space, backed up by a wide range ofpassive and active instrumentation, is unique. Miller andSlingo [2007] describe the background to RADAGAST andprovide details of the instruments deployed at the AMF.Meteosat-8 was the first weather satellite of the MeteosatSecond Generation (MSG) series, operated by EUMETSAT.Schmetz et al. [2002] provide an introduction to MSG anddescribe the SEVIRI imager. The GERB radiometer isdescribed by Harries et al. [2005].[4] RADAGAST was timed to coincide with the special
observing periods of AMMA, a large international programto study and to improve our understanding of the WestAfrican monsoon [Redelsperger et al., 2006]. The measure-ments complemented those from several other projectswithin or related to AMMA, in particular the Dust andBiomass Experiment, DABEX [Haywood et al., 2008] inJanuary 2006. Although administered separately, theseprojects and experiments interacted closely on a daily basisand have shared data in the subsequent analysis of theresults. AMMA thus provided an excellent opportunity tofoster links between programmes and communities thatmight otherwise not have interacted with each other.[5] One important objective of RADAGAST is to derive
estimates of the radiative divergence across the atmosphere[e.g., Slingo et al., 2006], but the data also allow many otherproblems to be studied, beyond those in atmosphericradiation. In particular, the data provide a coherent pictureof the seasonal variation of meteorological and associatedvariables in this sensitive and important climatic region.[6] This first overview paper discusses the meteorological
and thermodynamic observations obtained during theexperiment and places them in the context of the long-termaverage annual cycle at Niamey. In the companion paper,the focus is on the radiative fluxes and divergences and onthe factors that control them (A. Slingo et al., Overview ofobservations from the RADAGAST experiment in Niamey,Niger: 2. Radiative fluxes and divergences, submitted toJournal of Geophysical Research, 2008, hereinafter referred
to as Part 2). The subsequent papers in this special sectionprovide detail on further specific studies that have beencarried out with the data.[7] The following section reviews the sources of data and
summarizes the processing that was carried out. Section 3documents the seasonal advance and retreat of the Inter-tropical Front (ITF) and of the associated conditions atNiamey and in the wider region. It also reviews the AMFobservations of meteorological and thermodynamic varia-bles at the surface. Section 4 presents observations of theatmospheric structure above the main site. A discussion andreview of the results is given in section 5.
2. Data and Processing
[8] The main AMF facility at the Niamey airport site(Figure 1) began making limited observations in November2005, but routine operations started at the beginning of2006. The micropulse lidar (MPL) became operational on27 December 2005, radiosonde ascents started on 7 January2006 and the cloud radar commenced observations on16 March 2006. Most instruments at the airport site inNiamey operated continuously until 7 January 2007, althoughthe cloud radar ceased operations on 24 December 2006.The more limited measurements from the ancillary site atBanizoumbou, about 50 km east of Niamey (Figure 1),cover the period from 26 December 2005 to 8 December2006. The AMF results shown here are for the calendar year2006, which covers the period when most of the instrumentsat both sites were operating and provides a continuous datarecord that spans a complete seasonal cycle. Details of allthe instruments are provided by Miller and Slingo [2007].[9] To set the AMF results in context, they are preceded
by a brief documentation of the long-term average annualclimate cycle at Niamey, based on standard meteorologicalobservations. The data were obtained from the Directions dela Meteorologie Nationale (National Weather Services) ofNiger and surrounding countries. Data for 2006 are com-pared with this background information in the followingsection.[10] Data from Meteosat-8 are not presented in this paper,
but a cloud mask derived from the data is used in Part 2 in
Figure 1. Location of primary (Niamey, N) and ancillary (Banizoumbou, B, cross) observing platformsof the ARM Mobile Facility during 2006 and the stations (including Niamey) from which long-termstandard meteorological observations were analyzed to produce Figure 2 (dots).
D00E01 SLINGO ET AL.: RADAGAST OVERVIEW
2 of 18
D00E01
the analysis of the radiative fluxes (Slingo et al., submittedmanuscript, 2008). The following discussion is includedhere for completeness, since in carrying out the experimentboth the AMF and satellite data were examined on a dailybasis, in order to monitor conditions and to identify casestudies for further detailed examination.[11] Meteosat-8 was launched in August 2002 and ran
continuously until Meteosat-9 took over as the operationalsatellite in April 2007. This changeover was much later thanplanned by EUMETSAT, because of anomalies with theSEVIRI instrument on Meteosat-9 that took a long time toresolve. This delay actually had a positive impact onRADAGAST, because it meant that Meteosat-8 operatedthroughout the experiment, so the need to merge data fromthe two satellites was avoided. Apart from very shortperiods, data from the SEVIRI instrument are availablecontinuously throughout 2006. GERB data are also availablefor most of the year (see Part 2 for further discussion).[12] The satellite data were processed at the Environmental
Systems Science Centre (ESSC) for a large study area(approximately 5�S to 30�N and 30�W to 30�E). SEVIRIlevel 1.5 data over this region were extracted by theEUMETSAT Archive Operations Division and sent by ftpto a dedicated server at ESSC in near real-time (latencyabout 30 min). The processing of the GERB data isdescribed in Part 2. The satellite data were processed todisplay images on the project website of all the SEVIRIbands and of the dust and water vapor products, plus GERBshortwave and longwave radiances and fluxes, at the fulltime and space resolution. To complement the satellite
images, selected AMF quicklook products were retrievedfrom the ARM server and also displayed (latency about 1 h).Animation of the satellite and AMF products on a dailybasis enabled interesting events to be identified in a timelymanner and a log of the whole year was maintained forfuture reference. The Web site was also used by severalother groups within AMMA.
3. Analysis of Results: Surface Variables
[13] The meteorological conditions at Niamey and thesurrounding region in 2006 are reviewed below and com-pared with the climatology of the region. This is followedby an analysis of the main surface meteorological variablesmeasured at the airport site.
3.1. West African Intertropical Front and Rainfall
[14] Standard meteorological observations from Niameyand elsewhere in West Africa are used here to providebackground information on the atmospheric behavior overWest Africa that is most pertinent for the AMF deploymentin Niamey (Figure 1). The analyses have 10-day (dekadal,Figures 2 and 3) and seasonal (Figure 4) mean time scales.[15] The measurements made at and above Niamey
throughout 2006 by the AMF’s suite of vertically pointinginstruments [Miller and Slingo, 2007] reflect the annualcycle of the West African monsoon system. Fundamental tothis monsoon annual cycle is the northward advance andsouthward retreat of the surface Intertropical Front (ITF).During the monsoon season from June-September, the ITF
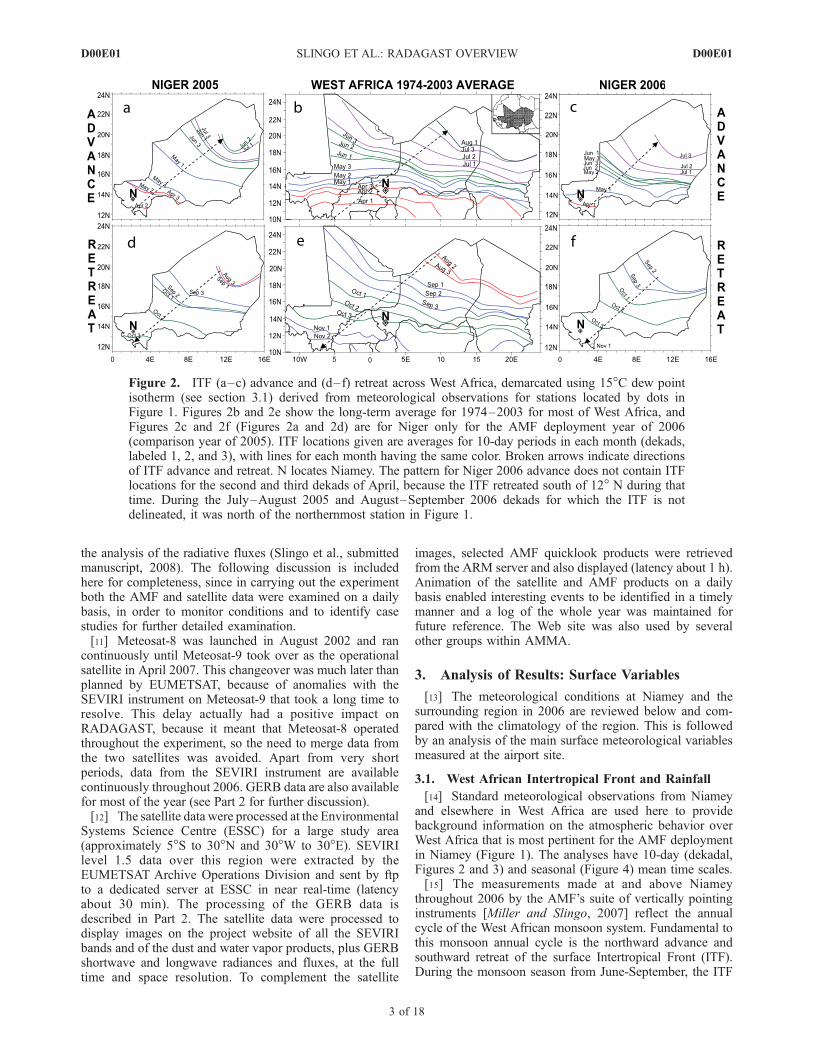
Figure 2. ITF (a–c) advance and (d–f) retreat across West Africa, demarcated using 15�C dew pointisotherm (see section 3.1) derived from meteorological observations for stations located by dots inFigure 1. Figures 2b and 2e show the long-term average for 1974–2003 for most of West Africa, andFigures 2c and 2f (Figures 2a and 2d) are for Niger only for the AMF deployment year of 2006(comparison year of 2005). ITF locations given are averages for 10-day periods in each month (dekads,labeled 1, 2, and 3), with lines for each month having the same color. Broken arrows indicate directionsof ITF advance and retreat. N locates Niamey. The pattern for Niger 2006 advance does not contain ITFlocations for the second and third dekads of April, because the ITF retreated south of 12� N during thattime. During the July–August 2005 and August–September 2006 dekads for which the ITF is notdelineated, it was north of the northernmost station in Figure 1.
D00E01 SLINGO ET AL.: RADAGAST OVERVIEW
3 of 18
D00E01

Figure
3
D00E01 SLINGO ET AL.: RADAGAST OVERVIEW
4 of 18
D00E01

separates the warm, moist, southwest monsoon flow fromthe tropical Atlantic and the much hotter, drier, dusty,northeasterly Harmattan air from the Sahara. The interfacebetween the two air masses slopes upward toward the souththrough the lowest 300 hPa of the atmosphere at averageinclinations that vary seasonally in the 1:100 to 1:400 range,with the monsoon flow undercutting the Harmattan airin a wedge-like manner [Hastenrath and Lamb, 1977;Hastenrath, 1991, pp. 166–174]. During the dry season,the zone of maximum insolation and the ITF move well tothe south of Niamey (as far as the Gulf of Guinea coast),when the cooler, dusty, northeasterly Harmattan flow under-cuts the warmer tropical air to the south [e.g., Haywood etal., 2008]. Accordingly, the total column water vapor (near-surface dust load) above Niamey maximizes when the ITFis far north (south) of that location, and vice versa.[16] Using a traditional ITF demarcation of sustained
15�C surface dew point temperature [Eldridge, 1957;Ilesanmi, 1971; Lele, 2007], Figures 2b and 2e documentthe long-term (1974–2003) average annual cycle of thesurface ITF position across most of West Africa between10� and 25�N. The ITF’s average northward advancethrough this zone occurs slowly between the first dekadof April and the first dekad in August, with the subsequentaverage southward ITF retreat between the second dekad ofAugust and the second dekad of November being almost50 percent more rapid. Northward from Niamey, the ITF hasan increasing WNW-ESE orientation. Monsoon air thustypically resides over Niamey between the first dekad ofApril and the last dekad of October (approaching sevenmonths), with the depth of the layer increasing to amaximum in late July and early to mid-August and thendecreasing. These conditions characterize other WestAfrican locations at approximately the same latitude asNiamey.[17] Figures 3b, 3e, 3h, and 3k document the average
association of the above ITF annual cycle with atmosphericvariables at Niamey that are key to interpreting the AMFmeasurements there. Most fundamental is the seasonalrainfall variation shown in Figure 3k. The zone of maximumrainfall occurs approximately 300 km south of the ITF, andadvances northward/retreats southward in tandem with theITF, because the convective systems involved [Bell andLamb, 2006] require the support of a well-developed moistmonsoon layer. As a result, Niamey’s monsoon rainfallusually commences very modestly in April-May, thenincreases markedly and progressively to a late July-entireAugust maximum, after which it declines much more
abruptly through September and October. The December–February period is always rainless, and rain seldom occursin November or March. This slow development and muchfaster cessation of monsoon rain at Niamey are fullyconsistent with the relative rates of ITF advance and retreatshown in Figure 2. The same seasonal pattern prevailsacross the entire Soudano-Sahel zone of North Africa, fromSenegal in the west to Ethiopia in the east [Segele andLamb, 2005; Bell and Lamb, 2006; Lele, 2007].[18] Associated with the mean annual cycles of the ITF
and Niamey monsoon rainfall are distinctive variations ofother atmospheric parameters that influenced the AMFmeasurements in Niamey (Figures 3b, 3e, and 3h). Thebasic moisture parameters (dew point temperature, vaporpressure) not only increase strongly during the March-Mayperiod straddling the northward ITF passage throughNiamey, but thereafter continue to increase modestly untillate September. Pronounced dew point and vapor pressuredecreases occur during October-December. In contrast, theaverage annual cycle of relative humidity is bell shaped andnear symmetrical about a mid-August maximum, with slowerrates of monsoonal increase (especially) and decrease thanfor dew point and vapor pressure. This relative humiditypattern results from its partial control by air temperature,most notably the premonsoon (mid-April to early May) andpostmonsoon (mid-October) temperature maxima and themidmonsoon (mid-August) temperature minimum. The first(and primary) temperature maximum occurs at the end ofthe dry season, when the land surface is driest and incomingsolar radiation is near maximum at 13�N. The latter cir-cumstance and postmonsoon reduced cloudiness contributeto the secondary temperature maximum in October. Theintervening temperature minimum centered on mid-Augustresults from reduced incoming solar radiation and theincreasing cloud cover, surface wetness, and evapotranspir-ative cooling that accompany the progressive increase ofmonsoon rainfall from May through August.[19] Other striking aspects of Figures 3b, 3e, 3h, and 3k
concern the mean annual cycle of visibility. Both dust andsmoke aerosol play an important role in the surface radia-tion balance during the dry season [Milton et al., 2008].However, dust is the predominant aerosol at low altitudesand therefore is the major influence on surface observationsof visibility. Accordingly, visibility can be used as a proxyfor near-surface dust (A. Ben Mohamed et al., Atmosphericdust in the West African Sahel and ocean-atmosphereclimate variations on seasonal, interannual and multi-decadal time-scales, submitted to International Journal of
Figure 3. (a–l) Annual cycles of key atmospheric variables at Niamey, given by mean values for 10-day (dekad) periods.Figures 3b, 3e, 3h, and 3k give long-term averages for 1974–2003 for most of West Africa, and broken lines and blue barsin Figures 3c, 3f, 3i, and 3l (Figures 3a, 3d, 3g, and 3j) relate annual cycles for AMF deployment year of 2006 (comparisonyear of 2005) with their long-term average counterparts in Figures 3b, 3e, 3h, and 3k. T is surface air temperature, and RHis surface relative humidity, with subscripted MAX and MIN indicating daily maximum and minimum values, respectively.TD is surface dew point temperature, and VAP PRESS is surface vapor pressure, both at the time of daily minimum surfaceair temperature. Visibility (averages of hourly values) is used as a proxy for near-surface atmospheric dust loading, hence itsinverted ordinate. The cause of the reduced visibility values for 2005–2006 relative to the 1974–2003 average is not yetclear; possibilities include changed observing practices and increased aerosols from burning and land degradation (A. BenMohamed, personal communication, 2008). However, the annual visibility cycles for 2005–2006 are considered reliableand so are compared in the text. Broken vertical lines indicate dates of northward and southward ITF passage throughNiamey (see also Figure 2).
D00E01 SLINGO ET AL.: RADAGAST OVERVIEW
5 of 18
D00E01

Figure 4. Normalized April–October rainfall departure indices (s) for (top) Niamey and (middle) theentire West African Soudano-Sahel Zone for 1941–2007 and (bottom) their relationship (where thenumbers give the last two digits of the years). Values for 2006 are in red. The West African index isaveraged across 20 stations between 11 and 18�N and west of 10�E located in the work by Lamb [1978,Figure 1], including Niamey. The normalization procedure used station means and standard deviations for1941–2000. In Figure 4 (bottom), r gives the linear correlation coefficient.
D00E01 SLINGO ET AL.: RADAGAST OVERVIEW
6 of 18
D00E01

Climatology, 2008). The visibility scale in Figure 3 isinverted to emphasize that high visibility corresponds tolow dust, and vice versa. Visibility is lowest (dust greatest)in late February to early March, near the end of the dryseason, after which visibility increases (dust decreases)strongly to be almost doubled by late August. As with mostother parameters in Figure 3, September–October is aperiod of pronounced change (decrease) for visibility (in-creased dust), after which the visibility decrease is moremodest through the late February to early March minimum.Also evident in Figure 3 is a very strong positive relation-ship between visibility and vapor pressure. The linearcorrelation between the long-term dekadal means of theseparameters in Figure 3e is +0.90 (significant at 0.001%level according to a two-tailed t test), and the correlationbetween the contributing individual dekadal averages is+0.66 (0.001% significance). This strong inverse relationbetween the atmospheric presence of Harmattan dust andmonsoon water vapor is a dominant feature of Niamey’sannual climate cycle.[20] Figure 4 shows that the total monsoon seasonal
rainfall at Niamey is quite representative of the entire WestAfrican Soudano-Sahel zone within which it resides, onboth the interannual and multidecadal time scales. Relativeto the period since 1941, West African Soudano-Sahelmonsoon rainfall was deficient during the AMF deploymentin 2006 (Figure 4). This was especially characteristic of theAMF site in Niamey (�0.88s) and of several other AMMArain gauges within 45 km (�1.03s to �1.78s, using the1941–2000 mean and standard deviation for Niamey), butless so for the AMF ancillary site at Banizoumbou (�0.32s,using Niamey standardization statistics) and theWest AfricanSoudano-Sahel zone as a whole (�0.29s). Averaged over29 AMMA rain gauges within 95 km of Niamey, the 2006rainfall departure (�0.27s, using Niamey standardizationstatistics) was very close to the zone-wide mean. Figure 4also shows that rainfall in the immediately precedingmonsoon season (2005) was more abundant at (especially)the Niamey AMF site (+0�89s) and for the entire WestAfrican Soudano-Sahel zone (+0.17s).[21] Figures 2c, 2f, 3c, 3f, 3i, and 3l show the ITF
advance and retreat across Niger during the AMF deploy-ment year (2006), and the annual cycle response at theNiamey AMF site of atmospheric variables that are key forinterpreting the AMF measurements there. For comparativepurposes, Figures 2a, 2d, 3a, 3d, 3g, and 3j provide thesame documentation for the much wetter 2005. During the2006 AMF deployment, the monsoon was anomalously dryat Niamey in several respects. The ITF’s northward passagethrough Niamey was delayed until about a month after the1974–2003 average date, whereas it was only a few daysafter that average in 2005 (Figures 2 and 3). Consistent withthese ITF differences, the early season (May-July) rainfall atthe Niamey AMF site was only 60% of the 1941–2000average during 2006, whereas it was 157% in 2005 (Figure 3).After near-average peak season (total August) rainfall in2006, the end-of-season (September-October) rainfall totalwas even more deficient (53% of the 1941–2000 average)than the early season amount. In contrast, despite belowaverage August rainfall at the Niamey AMF site in 2005,the August–October total for that year still exceeded thatduring the 2006 AMF deployment.
[22] The delayed northward ITF passage through Niameyin 2006 was also manifest there in a retarded initiation of theplateau-like monsoon maxima of dew point and vaporpressure and the associated visibility increase, in later (earlyMay) temperature maxima and slower than average temper-ature declines thereafter, and in a concomitant suppressionin relative humidity increase (Figures 3c, 3f, 3i, and 3l). Theearlier northward ITF passage in the wetter 2005 wasassociated with the opposite dew point, vapor pressure,visibility, temperature, and relative humidity anomalies(Figures 3a, 3d, 3g, and 3j). Anomalous end-of-seasoncharacteristics for 2006 in Niamey include pronouncedsecondary temperature maxima in early to mid-October(consistent with the seasonal dryness), a slightly delayedsouthward ITF passage, and an associated extensionthrough October of near annual maximum visibility andthe plateaus of maximum dew point and vapor pressure.None of these anomalies characterized the wetter 2005.Interestingly, the Niamey AMF site received no rain inOctober 2006 despite the persistence of surface monsoonmoisture there throughout that month. While rain also wasabsent from Niamey in October 2005, in that case thesurface monsoon moisture had retreated to the south bymidmonth.
3.2. Surface Variables at the Main Niamey Airport Site
[23] The surface variables measured at the Niamey airportsite in 2006 are presented here with a temporal resolution ofone day, which builds on the climatological comparisonspresented above and provides further detail for the resultsshown later and in Part 2. Daily averaging also prevents thesubstantial diurnal and higher-frequency variability fromobscuring the slower synoptic to seasonal time scale varia-tions that are the main focus of this paper.[24] The evolution of the screen-level temperature, dew
point temperature and relative humidity is shown inFigure 5. Temperatures were high throughout the year, withthe maximum at the end of the dry season and a lessermaximum at the end of the wet season. At the start of theyear, humidities were typical of the dry season, with dewpoints well below 0�C, except during isolated episodeswhen relatively moist air was advected over the site (seebelow). As the dry season progressed, temperaturesincreased and dew points decreased slightly, so there wasa distinct decrease in the relative humidity, with the lowestvalues occurring just before the onset of the summermonsoon. While it is possible that this decrease is due tothe progressive drying of the surface upstream of Niameyfollowing the previous year’s wet season, there is largeinterannual variability in the seasonal progression ofhumidity, with no clearly reproducible pattern from year-to-year (A. Ben Mohamed, personal communication, 2008).[25] As discussed earlier, the onset of the rains, marked
by the northward passage of the ITF through Niamey(Figures 3c, 3f, 3i, and 3l) and defined as occurring whendew points are consistently higher than 15�C, took placelater than usual on 5 May, but this was preceded by a ‘‘falseonset’’ in the middle of April. While no significant rainfallwas associated with this event, Figure 5 shows that in otherrespects it marked the arrival of moist air associated with thesouthwest monsoon, which then retreated and only returned
D00E01 SLINGO ET AL.: RADAGAST OVERVIEW
7 of 18
D00E01

on 5 May, much later than the normal onset date (for furtherdiscussion see section 3.1).[26] During the wet season, the temperatures decreased
with time, but the dew points increased, the lowest temper-atures and highest relative humidities occurring at about theend of August. Temperatures and dew points show pro-nounced high-frequency temporal variability in the wetseason, associated with day-to-day variability in convection.In the dry season, the variability is associated with muchslower synoptic-scale variability. The end of the wet seasonwas marked by a precipitous drop in the dew point, with theITF passing southward through Niamey on 29 October.Thereafter, conditions returned to those typical of the dryseason.[27] Surface winds (Figure 6) show the characteristic shift
in direction between the northeasterly Harmattan winds inthe dry season to the southwesterly winds of the monsoon,with a slow transition during the false onset. In contrast, aswith the other variables, the change is particularly rapid atthe end of the wet season. It is also apparent that thehumidity variations in the dry season shown in Figure 5
are correlated with changes in wind direction seen inFigure 6, suggesting that the cause is advection of moist airfrom sources less dry than in the climatological direction.
4. Analysis of Results: Atmospheric Structure
[28] This section presents data on the vertical structure ofthe atmosphere over Niamey through 2006. In sections 4.1and 4.2, summaries of the winds, temperatures and humid-ities from the ARM rawinsondes launched from the airportsite are presented. In section 4.3, back trajectories calculatedby the HYSPLIT model provide insight into the historyand origin of the air over Niamey through the year. Insection 4.4, examples of individual sondes and correctedMPL backscatter plots are shown to illustrate particularcases in more detail and to provide background for thefollowing papers.
4.1. Winds
[29] One major resource from the AMF deployment is thearchive of rawinsonde ascents through almost the whole of
Figure 5. Daily mean (a) screen-level temperature (�C), (b) dew point temperature (�C), and (c) relativehumidity (percent) during 2006 at the Niamey airport AMF site. The abscissa shows the day number in2006, and the dashed vertical lines denote the boundaries between the calendar months, the first letters ofwhich are indicated at the top of the figure. The arrows indicate the synoptic event from 15 to 22 February(A), the false onset of the wet season in mid-April (B), and the actual onset on 5 May (C). See text fordiscussion.
D00E01 SLINGO ET AL.: RADAGAST OVERVIEW
8 of 18
D00E01

2006, with an unprecedented frequency for the west AfricanSahel of four per day. Examination of individual ascentsreveals a richness of atmospheric structure, with manydistinct layers, even during the wet season. Some examplesare shown later. Here, the diurnally averaged wind speedand direction as a function of height are plotted through theyear in Figure 7. Several interesting features are apparentand may be compared with the study by Nicholson andGrist [2003], who used the NCEP-NCAR reanalysis, andwith the ERA-40 reanalysis atlas [Kallberg et al., 2005]. Atthe start and end of the year, the southern flank of thesubtropical westerly jet is over Niamey, so that west tosouthwesterly winds are evident in the mid-to-upper tropo-sphere, with peak winds around 200 hPa. Synoptic eventsassociated with midlatitude disturbances disrupt the flow, insome cases (e.g., from 15 to 22 February) leading to theadvection of anomalously moist air over Niamey, while inothers leading to the advection of the cold, dry air associ-ated with the major dust storm in early March [Slingo et al.,2006].[30] From January throughMay, the subtropical jet weakens
and moves toward the summer (northern) hemisphere,which manifests itself on Figure 7 as an elevation of theheight of the boundary between westerly and easterly winds[cf. Nicholson and Grist, 2003, Figure 3]. During July andAugust, the upper level westerlies are replaced by the
easterlies associated with the Tropical Easterly Jet (TEJ),visible at around 100 hPa on Figure 7. Lower down, theAfrican Easterly Jet (AEJ) becomes established at about600 hPa in May and persists until the end of October. Lowerstill, the southwesterly winds of the shallow monsoon layermay be seen, extending from the surface to around 800 hPa.There is strong shear between the AEJ and the monsoonflow. Many other features on shorter time scales areapparent in Figure 7 and merit further investigation.
4.2. Temperatures and Humidities
[31] The time series of diurnally averaged potential tem-perature (Figure 8a) and water vapor mass mixing ratio(Figure 8b) show that the structure of the atmosphere below500 hPa changed significantly through the year. In the dryseason up to the middle of March, episodes of relativelycool air can be seen below about 800 hPa, culminating inthe major dust storm which peaked on 8 March. This eventis dry, but in the earlier events there is no clear correlationbetween temperature and moisture. Elevated moist layersare apparent, up to about 600 hPa. From mid-March throughApril, the potential temperature gradient below 700 hPa isweak, indicative of deep well-mixed dry convective layers.The false onset in April is apparent in the moisture field, butthe temperature structure only changes with the beginningof the wet season on 5 May, when there is a marked
Figure 6. Daily mean (a) surface wind speed (m s�1) and (b) surface wind direction (degrees fromnorth: the cardinal and intercardinal directions are shown on the right), during 2006 at the Niamey airportAMF site. The abscissa shows the day number in 2006, and the dashed vertical lines denote theboundaries between the calendar months, the first letters of which are indicated at the top of the figure.The arrows indicate the synoptic event from 15 to 22 February (A), the false onset of the wet season inmid-April (B), and the actual onset on 5 May (C). See text for discussion.
D00E01 SLINGO ET AL.: RADAGAST OVERVIEW
9 of 18
D00E01

reduction in the depth of the near-surface mixed layer as themonsoon air arrives. Thereafter, temperatures below800 hPa fall and the moisture content rises, in agreementwith Figure 5. The near-surface layer becomes more shallownear the end of the wet season, which is marked by adramatic drop in the boundary layer moisture content asthe ITF passes southward. In the subsequent dry season,elevated moist layers return occasionally and the boundarylayer structure is similar to that at the beginning of theyear, although somewhat colder and drier. Some of thesefeatures are shown in more detail in section 4.4, in whichindividual sonde ascents are presented, together with thecorresponding backscatter profiles from the MPL.[32] Figure 8c shows the column water vapor (CWV)
calculated from the sonde data, with the values derived fromthe microwave radiometer (MWR [see Miller and Slingo,2007]) overplotted in gray. The latter use the improvedMWRRET algorithm described by Turner et al. [2007]. Theagreement between the sonde and MWR estimates of theCWV is extremely good. There is also a close correspon-dence between the CWV and the dew points shown inFigure 5b, which is expected since the CWV is dominatedby humidities near the surface, although there are also somesignificant differences during the dry season and particularlynear the end of the year. At these times, the sondes show
considerable structure in the vertical profile of humidity, sothe surface dew point is not such a good guide to the valueof the CWV as it is during the monsoon.[33] One of the motivations for deploying the AMF in
Niamey was the large seasonal variation in the CWV [seeMiller and Slingo, 2007, Figure 4]. Figure 8c shows thatthis was certainly justified: the observed sonde values rangefrom 3 mm on 11 April to over 60 mm on a few days duringthe wet season. This large range has a profound impact onthe radiative fluxes, as shown in Part 2. The nature of thevariability also changes between the relatively slow dryseason oscillations associated with the midlatitude synopticevents mentioned earlier, to the high-frequency variabilityarising from squall lines and individual convective systemsin the wet season.
4.3. Back Trajectories
[34] Back trajectories provide valuable information on theorigin of the air over the few days prior to its arrival atNiamey, and so aid further the interpretation of the AMFmeasurements. In particular, the mineral dust composition,as inferred from spectral infrared measurements made at theAMF site, suggests that there is a dependence on thetrajectory direction (D. D. Turner, Ground-based infraredretrievals of optical depth, effective radius and composition
Figure 7. Vertical profiles of daily mean (a) wind speed (m s�1) and (b) wind direction (degrees fromnorth), from AMF sondes launched during 2006 from the Niamey airport site. The abscissa shows the daynumber in 2006, and the dashed vertical lines denote the boundaries between the calendar months, thefirst letters of which are indicated at the top of the figure. The arrows indicate the synoptic event from15 to 22 February (A), the false onset of the wet season in mid-April (B), and the actual onset on 5 May(C). See text for discussion.
D00E01 SLINGO ET AL.: RADAGAST OVERVIEW
10 of 18
D00E01

of airborne mineral dust above the Sahel, submitted toJournal of Geophysical Research, 2008). In this subsection,back trajectories calculated using Version 4 of the HYSPLITmodel [Draxler, 2006] are shown. The trajectory calcula-tions used analyses from the National Centers for Environ-mental Prediction (NCEP) Global Data Assimilation System(GDAS).
[35] Figure 9 shows back trajectories calculated for airarriving at Niamey at heights of 500 m, 1 km, and 4 km at1200 UTC on each day of 2006. Each trajectory is 72 h longand each line on these plots represents the trajectoryarriving at the specified level on 1 day. The plots are splitinto four seasonal periods: the dry season from the begin-ning of 2006 up to 14 April, near the end of which there is
Figure 8. Vertical profiles of daily mean (a) potential temperature (K) and (b) water vapor mass mixingratio (g/g), from AMF sondes launched during 2006 from the Niamey airport site. (c) Column watervapor (cm) derived from the sondes (red points) and from the microwave radiometer (black background).The abscissa shows the day number in 2006, and the dashed vertical lines denote the boundaries betweenthe calendar months, the first letters of which are indicated at the top of the figure. The arrows indicate thesynoptic event from 15 to 22 February (A), the false onset of the wet season in mid-April (B), and theactual onset on 5 May (C). See text for discussion.
Figure 9. Back trajectories over 72 h, calculated from HYSPLIT. Each line shows the trajectory of air arriving at Niameyat 1200 UTC on each day during 2006 at heights of (a–d) 500 m, (e–h) 1000 m, and (i–l) 4000 m. To further document theannual cycle, the trajectories are separated into four periods: 1 January to 14 April (Figures 9a, 9e, and 9i), 15 April to 3 July(Figures 9b, 9f, and 9j), 4 July to 28 October (Figures 9c, 9g, and 9k), and 29 October to 31 December (Figures 9d, 9h, and9l). The location of Niamey is marked by the open circle in each panel.
D00E01 SLINGO ET AL.: RADAGAST OVERVIEW
11 of 18
D00E01

Figure 9
D00E01 SLINGO ET AL.: RADAGAST OVERVIEW
12 of 18
D00E01

the first occurrence of monsoon air at low levels at Niameybut ending before the northward ITF passage (Figure 3); thefirst part of the wet season up to 3 July; the second partof the wet season including the rest of its July-Septembercore; and finally the dry season at the end of the year thatbegins on 29 October as the ITF moves south of Niamey(Figure 3).[36] During the dry season at the start of the year
(Figures 9a, 9e, and 9i), the air at 500 m over Niameycame primarily from the north and east, associated with theclimatological Harmattan wind. The preferred sourceregions of the Bodele depression centered on 17�N, 17�E[Washington et al., 2006] and the Massif de l’Air (17�N,7�E) are evident, although trajectories cover a wide range ofother locations over the southern Sahara. The very longtrajectories that begin in southern Europe occurred duringthe major dust storm in early March 2006 [Slingo et al.,2006], as is also shown by Milton et al. [2008]. The resultsat 1000 m are very similar, but at 4000 m a large fraction ofthe trajectories originate to the south and east of Niamey,e.g., over Nigeria. Here, aerosols from biomass burning areinjected into the atmosphere and arrive over Niamey atlevels much higher than the low-level Harmattan flow. Thisis in agreement with the analysis of the DABEX data fromJanuary 2006 described by Haywood et al. [2008], and isfurther illustrated by the sonde data in the section 4.4.[37] Figures 9b, 9f, and 9j start with the ‘‘false’’ monsoon
onset on 15 April and cover the first part of the wet season.The low-level trajectories arriving from the north occurduring late April, before the monsoon flow is fully estab-lished. Following the true (and delayed) onset on 5 May,there is a marked change in the direction of the backtrajectories at 500 m and to a lesser extent at 1000 m,indicating the arrival of the moist air from the Gulf ofGuinea. At 4000 m, the winds are primarily from the east,associated with the development of the African Easterly Jet.Later in the wet season (Figures 9c, 9g, and 9k), the flow at500 m is almost exclusively from the southwest, while theflow at the two higher levels again shows the effect of theclimatological flow from the east.[38] Figures 9d, 9h, and 9l cover the return of dry season
conditions, following the retreat of the monsoon to the southof Niamey on 29 October. At 500 m and 1000 m, the tracksare much more tightly defined in direction than at the startof the year and show that the air arriving in Niamey isinfluenced by the source regions of the Bodele and Massifde l’Air. At 4000 m, the trajectories revert to the morevariable directions evident in Figure 9i, but again show thatsome of the air comes from the southeast.[39] These results are in good agreement with the source
regions derived by Schepanski et al. [2007] from SEVIRIdata for March 2006 to February 2007. Their results clearlyshow the Bodele and Massif de l’Air as preferred sourceregions for Niamey, as well as a broad region of the
southern Sahara to the north of Niamey, consistent withthe trajectories shown in Figure 9.
4.4. Atmospheric Structure for Selected Cases
[40] Selected rawinsonde ascents and range-correctedbackscatter plots from the micropulse lidar at the AMFairport site are shown in Figures 10 and 11, to illustrateevents that are either analyzed in more detail in thefollowing papers, or are typical of conditions over anextended period. With over a year of data, there are manyother days that could have been chosen. Those shown herewere selected in part because they cover the complete rangeof aerosol loadings encountered over the year, consistentwith the goal in some of the subsequent work of character-izing the aerosol properties and their impact on the radiationbudget.[41] At the beginning of 2006, during the dry season, the
atmosphere over Niamey frequently showed multiple layersin the midtroposphere, separated by inversions, with largechanges in humidity between the layers. Near the surface,solar heating created a well-mixed layer to 850–900 hPa inthe daytime, but the strong diurnal cycle in surface temper-ature led to the formation of a stable layer near the surfaceovernight. Figure 10a illustrates these features for the sondereleased on 21 January during the DABEX campaign.Osborne et al. [2008] present an analysis of the aircraftdata from flight B160 on this day. They found a dust aerosollayer extending from the surface (984 hPa) to about 900 hPa,above which was a layer of biomass burning aerosols fromabout 780 to 600 hPa. The positions of these two aerosollayers are indicated on Figure 10a, which shows that eachlayer is capped by a small inversion. The layering of thedifferent aerosol types is consistent with the trajectoryanalysis shown in Figures 9a, 9e, and 9i. The layers arealso apparent on the corresponding MPL backscatter plot(Figure 11a), which shows considerable variability in timeas the heterogeneous aerosol structures are advected overthe site. Figure 11a also shows that backscatter measure-ments at a single wavelength cannot distinguish between thetwo aerosol types. The MPL data and those from theMultifilter Rotating Shadowband Radiometer (MFRSR)on this day are analyzed in detail by McFarlane et al.[2008] in another paper in this special section.[42] Another common occurrence during the dry season
at the start of the year was the detection of very thin cloudlayers at the top of the highest aerosol layer and also athigher levels, where humidities just reached saturationbelow the inversions. Such layers are evident in the MPLplot (Figure 11a) in the evening, at 7 km (430 hPa) at thetime of the sonde, and at about 5 km at the top of thebiomass aerosol layer just before midnight.[43] As the dry season progressed, the increasing surface
temperatures shown in Figure 5 led to the development ofmuch deeper near-surface mixed layers in the daytime. On
Figure 10. Skew-T log-p plots of temperatures (black lines) and dew point temperatures (blue lines) for six representativeAMF rawinsondes launched from Niamey. The dates and launch times of the sondes are shown above each plot. The twobars on the plot for 21 January represent the approximate vertical extents of the biomass aerosol layer (top bar) and dustaerosol layer (bottom bar) observed by the UK BAe146 research aircraft during DABEX flight B160 [Osborne et al.,2008].
D00E01 SLINGO ET AL.: RADAGAST OVERVIEW
13 of 18
D00E01

Figure 10
D00E01 SLINGO ET AL.: RADAGAST OVERVIEW
14 of 18
D00E01

6 March, for example, the afternoon sonde (not shown here)indicated a well-mixed layer extending uninterrupted fromthe surface to 600 hPa. The following day, a surge of coldair from the Northern Hemisphere extratropics produced a
major dust storm over much of West Africa [Slingo et al.,2006]. The layer of cold, but well-mixed, air, extendingfrom near the surface up to 860 hPa, can be seen on thesonde ascent for 8 March shown in Figure 10b. The intense
Figure 11. Range-corrected micropulse lidar (MPL) backscatter profiles (in relative units) over 24 h forthe same days as the rawinsondes shown in Figure 10. The dates are shown above each plot. The verticalblue bands at about 1200 UTC on each day denote missing data when a shutter operated to prevent directsunlight from entering the detector optics. The enhanced noise at upper levels during daylight hours iscaused by interference from scattered sunlight (note that local time is the same as UTC in Niamey). Thebright, diffuse colors at low levels are due to backscatter from aerosols. The red spots show the bases ofoptically thick clouds, which the Lidar beam cannot penetrate, while the diffuse colored backscatter atupper levels is due to optically thin cirrus.
D00E01 SLINGO ET AL.: RADAGAST OVERVIEW
15 of 18
D00E01

backscatter from the aerosol is readily apparent inFigure 11b. Slingo et al. [2006] provide more detail on thatstriking event.[44] The dramatic change in atmospheric structure during
the wet season is illustrated by Figure 10c, which shows asonde ascent for just before midnight on 17 June. Theatmosphere is far more moist than in Figures 10a and 10band shows evidence of deep convection reaching the tropo-pause. On that evening, an intense convective storm passeddirectly over the site and caused some damage to theinstruments and loss of data, as witnessed by the missingdata on the right hand side of the MPL plot (Figure 11c).Nevertheless, as the plot clearly shows, the previous daywas almost cloud-free, with small amounts of cirrus andthin, low cloud. This is typical of the relatively drymonsoon season in Niamey in 2006: convective eventsusually lasted for no more than a few hours and were ofteninterspersed with days of suppressed and almost cloud-freeconditions. Aerosol, however, appeared to be ubiquitous inthe lowest few kilometers, as is evident on Figure 11c. Onceagain, there is considerable structure in the aerosol, withmultiple layers extending to 5 km. Animations of thesatellite imagery show dust being lofted by convectivedowndrafts, often spreading outward in almost circular,expanding features. These are most clearly seen to the northof the main convective regions, as the downdrafts propagateinto the desert. At Niamey, it was usually not possible toassociate the aerosol structures such as those illustrated byFigure 11c directly with such events, in part because highwater vapor loadings obscured the aerosol signals in thesatellite imagery.[45] Miller and Slingo [2007] show data from several key
AMF instruments [Miller and Slingo, 2007, Figure 8] andthe sonde ascent [Miller and Slingo, 2007, Figure 7] for9 July, another convective day during the wet season.Comparison of the sonde ascent given by Miller and Slingo[2007, Figure 7] with Figure 10c here illustrates the varietyof structures associated with convective activity. Their MPLplot also demonstrates that this instrument cannot penetratethick clouds, information on the cloud vertical structurecoming instead from the 95 GHz cloud radar. Although notobvious in the measurements shown by Miller and Slingo[2007], many such days show the signatures of 3-D cloudeffects in the radiation fields, which complicates the inter-pretation of the radiometer data at this time of the year.[46] Figures 10d and 11d show the final examples of
atmospheric structure for the wet season (1 August). Thiswas a day with broken high cloud and extensive aerosol,with multiple layers evident on the MPL plot. Thin medium-level cloud is again evident at around 6 km. The sondetemperature profile is less convective than on 17 June and isremarkably similar to that for 8 March (Figure 10b) in thefree troposphere. Near the surface is a well-mixed layerwhich contains most of the dust aerosol. Taylor et al. [2007]present an analysis of data from an aircraft flight to thenorthwest of Niamey on this day, which show that meso-scale atmospheric circulations can be induced in this regionby horizontal variations in soil moisture in the underlyingsurface.[47] The final two examples of atmospheric structure
come from the dry season following the retreat of the ITFsouthward on 29 October. The first shows the data for
26 November (Figures 10e and 11e), one of only a few daysin 2006 with unusually low amounts of aerosol, providingthe nearest conditions to ‘‘pristine’’ (i.e., aerosol-free) fortesting radiation codes (N. A. Bharmal et al., Simulation ofsurface and top of atmosphere thermal fluxes and radiancesfrom the RADAGAST experiment, submitted to Journal ofGeophysical Research, 2008). Only low levels of backscat-ter from aerosol can be seen on the MPL backscatter plot(Figure 11e). In contrast, at the end of the year a substantialdust storm originated over the Bodele depression on27 December, sending daily pulses of dust in a wide arctoward Niamey. By 31 December, the MPL showed a thickdust layer over the site (Figure 11f), although not as extremeas in the March event. Despite the differences in the aerosolloadings, the sondes for these two days are actually verysimilar (Figures 10e and 10f), with many stable layers in thefree troposphere and some nearly well-mixed layers inbetween. The only obvious difference is that the sonde for31 December shows a cooler, shallower surface mixed layerbeneath a strong capping inversion. This ascent is similar tothat for 8 March (Figure 10b), except that the geographicalorigin of the colder air near the surface was different.[48] One curious feature seen in the MPL data (but not
shown here) is a tendency for a plume of aerosol to appearat low levels in the early hours of the morning; typicallyaround 0300 local time. This appears to be associated withthe nocturnal jet, which was observed to peak at that time inother studies during AMMA [Lothon et al., 2008].
5. Summary and Discussion
[49] Observations of meteorological and thermodynamicvariables obtained during the RADAGAST experiment inNiamey, Niger, during 2006 are presented in this paper. Apartfrom a few brief periods, these data provide a continuousrecord of the substantial changes in conditions that occurredthrough the annual cycle of dry and wet seasons. Theexperiment combined surface observations from the U.S.Department of Energy’s Atmospheric Radiation Measure-ment (ARM) Program Mobile Facility (AMF) in Niameywith SEVIRI and GERB data from the Meteosat-8 opera-tional geostationary satellite.[50] The observations from the AMF and from many
other stations in West Africa in 2006 are contrasted withthe long-term climate averages of this region. Comparedwith the long-term mean, the onset of the wet season wasdelayed by about a month and rainfall was deficient inNiamey during most of the season. There was an abrupt endto the wet season, as documented by several differentparameters. The contrast between humidities in the wetand dry seasons was marked, with surface dew pointsranging from well below 0�C throughout most of the dryseason to over 20�C at the height of the wet season. Therawinsonde profiles reveal a rich and varied vertical struc-ture in temperatures, humidities and winds. The columnwater vapor ranged from 3 mm just before the start of thewet season to around 60 mm at its height. This large rangeprovides excellent opportunities for testing radiation codes,although a complicating factor is that aerosols (mainly dust)are almost ubiquitous throughout the year. The dust load-ings show large variability, however, so that not only werethere several events with substantial amounts of aerosol but
D00E01 SLINGO ET AL.: RADAGAST OVERVIEW
16 of 18
D00E01

also some extremely clear days, notably toward the end ofthe year. This variability is exploited in the following papersto quantify the dependence of the radiative fluxes on boththe water vapor and dust loadings.[51] Back trajectories were used to determine the source
of the air arriving over Niamey. In the dry season, the low-level Harmattan flow brought dust-laden air from the northand east. Preferential source regions such as the well-knownBodele depression were clearly identified. At higher levels,air from the southeast carried aerosols from near-equatorialAfrican regions of biomass burning, as found in theDABEX aircraft observations [Osborne et al., 2008]. Inthe wet season, the low-level southwesterly flow broughtmonsoon air from the Gulf of Guinea, while at lowermidtropospheric levels the climatological easterlies wereassociated with the African Easterly Jet.[52] Selected rawinsonde ascents and lidar backscatter
plots were shown to illustrate the range of atmosphericvertical structures observed during the year. Multiple layers,often including aerosols and separated by inversions, werecommon during the dry seasons and on many occasionsduring the wet season as well. Major dry season dust events,such as those in early March and in late December, wereassociated with large-scale dynamical forcing from theNorthern Hemisphere extratropics. Dust events in the wetseason appeared to be associated with gust fronts from localconvection and from mesoscale convective systems.[53] In Part 2 of this overview (Slingo et al., submitted
manuscript, 2008), the radiative fluxes at the top of theatmosphere and at the surface are presented and the factorsthat control these fluxes are examined. Analysis of thedivergence of the fluxes across the atmosphere is alsoincluded. Subsequent papers in this special section dealwith comparisons of the observed thermal radiative fluxeswith those simulated by a radiative transfer code [Bharmalet al., 2008]; analysis of the effects of heterogeneities onestimates of radiative divergence, including exploitation ofthe data from the ancillary AMF site at Banizoumbou [Settleet al., 2008]; retrievals of aerosol properties from spectrallyresolved measurements at the AMF airport site [McFarlaneet al., 2008; Turner, submitted manuscript, 2008]; observa-tions of cloud vertical structure and of precipitation(P. Kollias et al., Cloud and precipitation observations duringthe 2006 ARM Mobile Facility deployment in Niamey,Niger, Africa, submitted to Journal of GeophysicalResearch, 2008); and with seasonal variations in thecomponents of the surface energy balance (R. L. Milleret al., Seasonal contrasts in the surface energy balanceof the Sahel, submitted to Journal of GeophysicalResearch, 2008).
[54] Acknowledgments. This paper is a combined UK-USA contri-bution to the multinational African Monsoon Multidisciplinary Analysis(AMMA) Project and the Atmospheric Radiation Measurement (ARM)Program of the U.S. Department of Energy. The deployment of the ARMMobile Facility (AMF) in Niger during 2006 was funded by the Office ofBiological and Environment Research, Office of Science, U.S. Departmentof Energy. Analyses of the AMF and other data were performed at theUniversity of Reading with support by the UK Natural EnvironmentResearch Council; at the University of Oklahoma with support by theOffice of Science (BER), U.S. Department of Energy, grant DE-FG02-05ER64062; at the University of Wisconsin-Madison with support by theOffice of Science (BER), U.S. Department of Energy, grant DE-FG02-06ER64167; and at the Pacific Northwest National Laboratory with supportby the Office of Science (BER), U.S. Department of Energy under contract
DE-AC06-76RL01830. M. Miller is funded by the Environmental SciencesDepartment at Rutgers University and the Department of Energy throughBrookhaven Science Associates, LLC, under contract DE-AC02-98CH10866. The Pacific Northwest National Laboratory is operated byBatelle for the U.S. Department of Energy. Long-term meteorological datawere provided by the National Weather Services of Mali, Burkina Faso,Ghana, Benin, Niger, Nigeria, and Chad. The AMMA rain gauge data usedin section 3.1 were obtained from the official AMMA data archive. Thetrajectory calculations were performed by Rick Wagener of the ARMExternal Data Center at Brookhaven National Laboratory. We thankEUMETSAT for providing limited area subsets of the SEVIRI radiancesin near-real time. It is also a pleasure to reiterate the debt owed to theindividuals acknowledged by Miller and Slingo [2007] for their contribu-tions to making the deployment of the AMF in Niamey a success. Thequantity and quality of the data obtained from the AMF would not havebeen possible without their professionalism and dedication. The construc-tive suggestions of two formal reviewers sharpened the manuscript.
ReferencesAckerman, T. P., D. M. Flynn, and R. T. Marchand (2003), Quantifying themagnitude of anomalous solar absorption, J. Geophys. Res., 108(D9),4273, doi:10.1029/2002JD002674.
Bell, M. A., and P. J. Lamb (2006), Integration of weather systemvariability to multidecadal regional climate change: The West AfricanSudan-Sahel zone, 1951–98, J. Clim., 19, 5343–5365, doi:10.1175/JCLI4020.1.
Draxler, R. R. (2006), The use of global and mesoscale meteorologicalmodel data to predict the transport and dispersion of tracer plumes overWashington, D.C, Weather Forecast., 21, 383 – 394, doi:10.1175/WAF926.1.
Eldridge, R. H. (1957), A synoptic study of West African disturbance lines,Q. J. R. Meteorol. Soc., 83, 303–314, doi:10.1002/qj.49708335704.
Harries, J. E., et al. (2005), The Geostationary Earth Radiation Budget(GERB) project, Bull. Am. Meteorol. Soc., 86, 945–960, doi:10.1175/BAMS-86-7-945.
Hastenrath, S. (1991), Climate Dynamics of the Tropics, Kluwer Acad.,Dordrecht, Netherlands.
Hastenrath, S., and P. Lamb (1977), Some aspects of circulation and climateover the eastern equatorial Atlantic, Mon. Weather Rev., 105, 1019–1023, doi:10.1175/1520-0493(1977)105<1019:SAOCAC>2.0.CO;2.
Haywood, J., P. Francis, S. Osborne, M. Glew, N. Loeb, E. Highwood,D. Tanre, G. Myhre, P. Formenti, and E. Hirst (2003), Radiative proper-ties and direct radiative effect of Saharan dust measured by the C-130aircraft during SHADE: 1. Solar spectrum, J. Geophys. Res., 108(D18),8577, doi:10.1029/2002JD002687.
Haywood, J. M., et al. (2008), Overview of the Dust and Biomass-burningExperiment and African Monsoon Multidisciplinary Analysis Special Ob-serving Period-0, J. Geophys. Res., doi:10.1029/2008JD010077, in press.
Ilesanmi, O. O. (1971), An empirical formulation of an ITD rainfall modelfor the tropics: A case study for Nigeria, J. Appl. Meteorol., 10, 882–891,doi:10.1175/1520-0450(1971)010<0882:AEFOAI>2.0.CO;2.
Kallberg, P., P. Berrisford, B. Hoskins, A. Simmons, S. Uppala, S. Lamy-Thepaut, and R. Hine (2005), ERA-40 atlas, ERA-40 Proj. Rep. Ser., 19,Eur. Cent. for Med.-Range Weather Forecasts, Reading, U. K. (Availableat http://www.ecmwf.int/publications)
Lamb, P. J. (1978), Large-scale tropical Atlantic surface circulation patternsassociated with Subsaharan weather anomalies, Tellus, 30, 240–251.
Lele, M. I., (2007), Variability of Intertropical Front (ITF) and rainfall overWest African Soudano-Sahel zone, M. S. thesis, 92 pp., Sch. of Meteorol.,Univ. of Okla., Norman.
Lothon, M., F. Saıd, F. Lohou, and B. Campistron (2008), Observation ofthe diurnal cycle in the low troposphere of West Africa, Mon. WeatherRev., 136, 3477–3500.
McFarlane, S. A., E. I. Kassianov, J. C. Barnard, C. Flynn, and T. Ackerman(2008), Surface shortwave aerosol radiative forcing during the ARMMobile Facility deployment in Niamey, Niger, J. Geophys. Res.,doi:10.1029/2008JD010491, in press.
Miller, M. A., and A. Slingo (2007), The ARM Mobile Facility and its firstinternational deployment: Measuring radiative flux divergence in WestAfrica, Bull. Am. Meteorol. Soc., 88, 1229–1244, doi:10.1175/BAMS-88-8-1229.
Milton, S. F., G. Greed, M. E. Brooks, J. Haywood, B. Johnson, R. P. Allan,A. Slingo, and W. M. F. Grey (2008), Modeled and observed atmosphericradiation balance during the West African dry season: Role of mineraldust, biomass burning aerosol, and surface albedo, J. Geophys. Res., 113,D00C02, doi:10.1029/2007JD009741.
Nicholson, S. E., and J. P. Grist (2003), The seasonal evolution of theatmospheric circulation over West Africa and equatorial Africa, J. Clim.,16, 1013–1030, doi:10.1175/1520-0442(2003)016<1013:TSEOTA>2.0.CO;2.
D00E01 SLINGO ET AL.: RADAGAST OVERVIEW
17 of 18
D00E01

Osborne, S. R., B. T. Johnson, J. M. Haywood, A. J. Baran, M. A. J.Harrison, and C. L. McConnell (2008), Physical and optical propertiesof mineral dust aerosol during the Dust and Biomass-burning Experi-ment, J. Geophys. Res., 113, D00C03, doi:10.1029/2007JD009551.
Ramanathan, V., et al. (2001), Indian ocean experiment: An integratedanalysis of the climate forcing and effects of the great Indo-Asian haze,J. Geophys. Res., 106, 28,371–28,398, doi:10.1029/2001JD900133.
Redelsperger, J.-L., C. D. Thorncroft, A. Diedhiou, T. Lebel, D. J. Parker,and J. Polcher (2006), African Monsoon Multidisciplinary Analysis. Aninternational research project and field campaign, Bull. Am. Meteorol.Soc., 87, 1739–1746, doi:10.1175/BAMS-87-12-1739.
Schepanski, K., I. Tegen, B. Laurent, B. Heinhold, and A. Macke (2007), Anew Saharan dust source activation frequency map derived from MSG-SEVIRI IR-channels, Geophys. Res. Lett., 34, L18803, doi:10.1029/2007GL030168.
Schmetz, J., P. Pili, S. Tjemkes, D. Just, J. Kerkman, S. Rota, and A. Ratier(2002), An introduction to Meteosat Second Generation (MSG),Bull. Am. Meteorol. Soc., 83, 977–992, doi:10.1175/1520-0477(2002)083<0977:AITMSG>2.3.CO;2.
Segele, Z. T., and P. J. Lamb (2005), Characterization and variability ofKiremt rainy season over Ethiopia,Meteorol. Atmos. Phys., 89, 153–180,doi:10.1007/s00703-005-0127-x.
Settle, J. J., N. A. Bharmal, G. J. Robinson, and A. Slingo (2008), Samplinguncertainties in surface radiation budget calculations in RADAGAST,J. Geophys. Res., doi:10.1029/2008JD010509, in press.
Slingo, A., et al. (2006), Observations of the impact of a major Saharan duststorm on the atmospheric radiation balance, Geophys. Res. Lett., 33,L24817, doi:10.1029/2006GL027869.
Taylor, C. M., D. J. Parker, and P. P. Harris (2007), An observational casestudy of mesoscale atmospheric circulations induced by soil moisture,Geophys. Res. Lett., 34, L15801, doi:10.1029/2007GL030572.
Turner, D. D., S. A. Clough, J. C. Liljegren, E. E. Clothiaux, K. E. Cady-Pereira, and K. L. Gaustad (2007), Retrieving liquid water path andprecipitable water vapor from the Atmospheric Radiation Measurement(ARM) microwave radiometers, IEEE Trans. Geosci. Remote Sens., 45,3680–3690, doi:10.1109/TGRS.2007.903703.
Washington, R., M. C. Todd, S. Engelstaedter, S. Mbainayel, and F. Mitchell(2006), Dust and the low-level circulation over the Bodele Depression,Chad: Observations from BoDEx 2005, J. Geophys. Res., 111, D03201,doi:10.1029/2005JD006502.
�����������������������R. P. Allan, N. A. Bharmal, G. J. Robinson, J. J. Settle, A. Slingo, and
H. E. White, Environmental Systems Science Centre, University ofReading, Reading RG6 6AL, UK. ([email protected])J. Barnard, C. Flynn, E. Kassianov, and S. McFarlane, Pacific Northwest
National Laboratory, Richland, WA 99352, USA.P. J. Lamb and M. I. Lele, CIMMS, University of Oklahoma, Norman,
OK 73072, USA.M. Miller, Environmental Sciences Department, Rutgers University, 14
College Farm Road, New Brunswick, NJ 08901-8551, USA.D. D. Turner, Space Science and Engineering Center, University of
Wisconsin-Madison, Madison, WI 53706, USA.
D00E01 SLINGO ET AL.: RADAGAST OVERVIEW
18 of 18
D00E01