overview of recent progress in fisheries acoustics made by
TRANSCRIPT
Aquat. Living Resour. 22, 433–445 (2009)c© EDP Sciences, IFREMER, IRD 2009DOI: 10.1051/alr/2009027www.alr-journal.org
AquaticLivingResources
Review
Overview of recent progress in fisheries acoustics madeby Ifremer with examples from the Bay of Biscay
Verena M. Trenkel1,a, Laurent Berger2, Sébastien Bourguignon3, Mathieu Doray1, Ronan Fablet4,6,Jacques Massé1, Valérie Mazauric5, Cyrille Poncelet2, Gael Quemener2, Carla Scalabrin3
and Hector Villalobos1,7
1 Ifremer, Département EMH, rue de l’île d’Yeu, BP 21105, 44311 Nantes Cedex 3, France2 Ifremer, Département NSE, BP 70, 29280 Plouzané, France3 Ifremer, Laboratoire LTH, BP 70, 29280 Plouzané, France4 Institut Telecom/Telecom Bretagne, CNRS UMR 3192, Lab-STICC, CS 83818, 29238 Brest Cedex 3, France5 Ifremer, Département Direction des moyens et opérations navals, 155 rue Jean-Jacques Rousseau, 92138 Issy-les-Moulineaux, France6 Université européenne de Bretagne, 5 Bd René Laennec, 35000 Rennes, France7 Current address: CICIMAR-IPN, Av. Instituto Politécnico Nacional s/n., Col. Playa Palo de Sta. Rita, La Paz, BCS 23090, Mexico
Received 18 November 2008; Accepted 9 June 2009
Abstract – This paper provides an overview of the progress Ifremer has made recently in fisheries acoustics and thestudy of small pelagic fish by: i) pushing observation frontiers using a range of platforms including an autonomous un-derwater vehicle, AUV, ii) developing measuring instruments and methods and iii) studying fish distributions. Presently,information from several frequencies of single-beam echosounders is routinely collected together with data from theME70 multibeam echosounder. For onboard data acquisition control the HERMES software was developed. The newMOVIES 3D software includes modules for simultaneous realistic 3D visualisation and post-processing such as bottomdetection, school extraction and calculation of descriptors and integration of all acoustic data. Several data analysismethods are being developed and some initial results are presented. Finally, results on the spatial distribution of smallpelagic fish schools in the Bay of Biscay illustrate the role that acoustics can play, and are already playing, in theimplementation of an ecosystem approach to fisheries.
Key words: Multibeam echosounder / Oceanographic AUV / Pelagic fish / Fisheries acoustics
Résumé – Cet article présente une vue d’ensemble des avancées récentes de l’Ifremer en acoustique halieutique etune étude des petits poissons pélagiques tenant compte : i) de l’extension des limites de l’observation, en utilisant unegamme diverse de plates-formes dont un engin sous-marin autonome (AUV), ii) des développements méthodologiqueset d’instruments de mesures, iii) de l’étude de la répartition des poissons. Désormais, les données de plusieurs fré-quences des sondeurs mono-faisceaux sont collectées en routine en parallèle à celles du sondeur multifaisceau ME70.Le logiciel HERMES a été développé pour le contrôle de l’acquisition des données à bord. Le nouveau logiciel MOVIES3D comprend des modules de visualisation réaliste en 3D et de post-traitement (dont la détection du fond, l’extractionde bancs et le calcul de leurs descripteurs ainsi que l’intégration de toutes les données acoustiques). Plusieurs méthodesd’analyse de données sont en cours de développement et quelques premiers résultats sont présentés. Enfin, les résultatsrelatifs à la répartition spatiale des bancs de petits poissons pélagiques dans le golfe de Gascogne illustrent le rôle actuelet potentiel de l’acoustique dans la mise en place d’une approche écosystémique des pêches.
1 Introduction
Acoustic methods are the standard methods for obtain-ing abundance indices for pelagic and some demersal fish
a Corresponding author: [email protected]
species (Simmonds and MacLennan 2005). Increasingly theyare also playing a role for ecosystem monitoring (e.g. Masséand Gerlotto 2003; Koslow 2009). Their use has a long historyat Ifremer and its predecessor institute, CNEXO. Since the late1970s, acoustic surveys have been carried out on the Frenchshelf of the Bay of Biscay. They were originally undertaken
Article published by EDP Sciences

434 V.M. Trenkel et al.: Aquat. Living Resour. 22, 433–445 (2009)
sporadically and with limited coverage (Diner and Le Men1983). Since 2000 they have been conducted annually, cov-ering the whole French part of the shelf. At the same time, re-search into the properties of acoustic fish measurements hasbeen carried out using simulation-based and empirical ap-proaches. This has led, for example, to the development of anow widely used algorithm for correcting school length mea-surements which are biased by the increase of beam patternwith depth (Diner 1999, 2001). Another example is MOVIES,one of the early software developments for estimation ofbiomass by acoustics and fish shoal extraction and characteri-sation (Weill et al. 1993). MOVIES has allowed, among others,to test and compare different methods of biomass estimation(Massé and Rouxel 1991), to estimate the variance of biomassestimates due to species identification (Petitgas et al. 2003),to describe the spatial structure of fish schools (Scalabrin andMassé 1993; Massé 1996) and of aggregations around fish ag-gregation devices (Doray et al. 2007; Moreno et al. 2007), theirdiel variations (Zwolinski et al. 2007) and the characteristicsof clusters of schools (Petitgas et al. 2001). Since 1997, theR/V Thalassa, a modern, noise-reduced fisheries research ves-sel, has become an important operating platform for acousticresearch, particularly since 2002, when it was equipped withfive single-beam Simrad ER60 echosounders (18, 38, 70, 120and 200 kHz).
More recently, together with the manufacturer Simrad,Ifremer has developed a fully calibrated fisheries researchmultibeam echosounder, the ME70, which is installed on R/VThalassa. See Trenkel et al. (2008) for a description of the sys-tem and its potential contribution to fisheries research. Simul-taneously, a sonar version, the MS70, was developed by Sim-rad and the Norwegian Institute for Marine Research (IMR).The ME70 offers many new opportunities for ecological stud-ies but presents also technical challenges in terms of data man-agement and analysis. Recent advances in meeting these chal-lenges are described in this paper, together with some new in-sights into pelagic fish community structure. In terms of othersurvey platforms, the autonomous underwater vehicles (AUV)developed by Ifremer are expected to extend the areas that canbe surveyed acoustically (Opderbecke and Laframboise 2007;Rigaud 2007). Recent experiences with using the AUV as aplatform for biomass estimation by acoustics are reported here.
In the following, recent progress made by Ifremer in fish-eries acoustics is presented in the areas of observation plat-forms, acoustic data analysis and the study of small pelagicfishes in the Bay of Biscay (Northeastern Atlantic), illustratingthe use and potential contribution of acoustic methods for theimplementation of the ecosystem approach to fisheries (EAF).
2 Extending observation frontiers
The operating platform on which an echosounder is in-stalled is a principal factor controlling the observation volume.Surveys covering large areas on the continental shelf com-monly use hull-mounted vertical echosounders with an effec-tive observation volume ranging from about 10 m below thesea surface to less than one meter above the sea floor, depend-ing on echosounder configuration and bottom depth. Otheroperating platforms are required for surveillance outside this
volume. Single-beam echosounders provide two-dimensionalviews (vertical and along-ship track dimensions), while multi-beam systems add the third dimension (across-ship track).
2.1 AUV for acoustic observations near the sea floorand below the sea surface
Several physical factors influence the suitability of hull-mounted acoustic methods for fish biomass estimation. Beamwidth in combination with depth, but also pulse duration andbottom topography, determine the extent of the dead zone nearthe sea floor for which no information is available (Ona andMitson 1996). Another layer that cannot be sampled is situatednear the sea surface. It can extend to around 15 m below thesurface, depending on the acoustic frequency, vessel draft ordepth of the drop keel and sea state. This upper layer is calledthe “surface blind zone” (Scalabrin et al. 2009; Totland et al.2009).
There are at least two ways to reduce the volume of thedead zone in order to improve acoustic sampling of fish closeto the seabed: i) lowering the transducer to the bottom us-ing a towed body (Kloser 1996; Dalen et al. 2003) or anAUV (Fernandes et al. 2003); ii) reducing the transducer beamwidth, which has the drawback of decreasing the acousticallyobserved volume (Fig. 1). One advantage of using AUV com-pared to towed bodies is their low noise level (Fernandeset al. 2000). Numerous studies have shown that fish can re-act to an approaching survey vessel with different avoidancebehaviours (Soria et al. 2003; Gerlotto et al. 2004; Handegardand Tjøstheim 2005); close-up reaction of herring towards anAUV has also been observed (Patel et al. 2004). However, dif-ferences in reaction to different vessels are not explainableonly by noise levels (Ona et al. 2007; De Robertis et al. 2008);hence, noise reduction might not be the only factor to be con-sidered when selecting the observation platform. Towed bod-ies operated from a vessel might provide data as good as thosefrom an AUV, but their deployment is not without problems.The main limitations of AUVs are that they operate at slowerspeeds than vessels and certain fast moving fish schools, mighthave to be escorted by a vessel for security reasons and theirdeployment and recovery can be logistically demanding if theyare heavy and the sea is rough.
For observing individuals in the surface blind zone thereare at least three possibilities: i) towed bodies and AUVs, butthis time using an upwards looking transducer (Fernandes et al.2000); ii) quantitative multibeam sonars such as the MS70 andiii) moored inverted echo sounders (albeit only for small studyareas (Trevorrow 2005). The choice of method will clearly de-pend on the size of the survey area and the observation du-ration. Continuous observations are only feasible with moor-ings (Fabi and Sala 2002; Axenrot et al. 2004; Scalabrin et al.2005). The same considerations regarding noise levels applyto the choice between vessels or separate platforms.
Since 2004 Ifremer owns two identical medium-sizedAUVs (AsterX and Idef X) which can be used as platforms forfisheries acoustics (Table 1). They are fitted with two acoustictransducers operating at 70 and 200 kHz. Depending on theobjectives of the study, the transducers can be both positionedeither looking upwards or downwards or in opposite directions

V.M. Trenkel et al.: Aquat. Living Resour. 22, 433–445 (2009) 435
Fig. 1. Configurations and observation volume of AUV and vessel mounted acoustic transducers. ME70 multibeam echosounder; ER60 single-beam echosounders. The AUV has two single-beam echosounders (70 kHz and 200 kHz).
Table 1. Performance of Ifremer owned AUV manufactured byInternational Submarine Engineering Ltd. (ISE, Canada): 4.5 m long,793 kg.
Parameter Performancemax. depth 3000 mmax. speed 5 knots (without current)max. distance 100 kmacoustic payload 70 and 200 kHznavigation fixed depth or altitude
(Fig. 1 shows the M and X configurations). Several AUV fieldtrials were carried out, including an extensive study in the Bayof Biscay in September 2007 (Scalabrin et al. 2009). The lat-ter study provided observations of pelagic fish in the surfaceblind zone and demersal fish close to the bottom. For example,in one comparison carried out during this study, the AUV waspositioned at an average immersion of 50 m below the sea sur-face and the acoustic transducers were in X-configuration, i.e.one looking up and the other down (Fig. 1). Trawling showedthat fish found near the surface were mainly anchovy. Theaverage anchovy density estimated based on AUV and ves-sel data was 16 630 and 1193 kg per square nautical mile re-spectively. The large difference is due to anchovy schools inthe surface blind zone of the vessel with some contributionfrom other schools down to 30-m depth. However, the surfaceblind zone, alone, cannot explain this large difference, suggest-ing that fish avoidance of the vessel might also have playeda role. These results from an area with high anchovy densi-ties are preliminary and should be confirmed by future exper-iments. Given that spatial distributions have been found to belinked to environmental conditions (Castillo et al. 1996), theproportion of individuals found close to the sea surface can beexpected to depend on oceanographic conditions and species
behaviour and might vary according to different temporal andspatial scales. Fish biomass found in the bottom dead zone wasalso investigated during the survey in 2007. The results indi-cate that for abundant species such as hake it might be possibleto obtain biomass estimates using acoustics on an AUV plat-form (Scalabrin et al. 2009).
Several obstacles have to be overcome before the IfremerAUVs become operational and can contribute to biomass in-dices for routine stock assessment. First, given the slow speed(< 5 knots without current), it is impractical to use them tosurvey large areas such as the entire Bay of Biscay. Adaptivesampling designs, such as AUV deployment only when highconcentrations in surface layers are suspected, might help tooptimise their contribution. Second, because of safety reasonsand lack of legislation, the AUV currently needs to be escortedby a rather large support vessel able to intervene in case oftechnical problems. Third, given that transducer performancemay be depth- or temperature-dependent (Demer and Renfree2008), tank calibrations should be confirmed by in situ mea-surements. The Institute of Marine Research (IMR), Norway,has developed a tool for calibration of deepwater transducersat different depths. The output of the method provides a verti-cal profile of calibration results that can be used to compensateacoustic data according to the immersion depth profile of theAUV. The AUV transducers were specially designed for deep-water use; however, it appears that a variation of up to 2 dBcould occur in the calibration results between the transducer atthe surface and at 200 m depth (E. Ona, pers. comm.).
2.2 Improving sampling coverage and resolution
The step from vertical acoustic observations in two di-mensions (depth and time or distance) to three, adding the

436 V.M. Trenkel et al.: Aquat. Living Resour. 22, 433–445 (2009)
Fig. 2. Two- and three-dimensional images of a fish schools in the Bay of Biscay visualised using MOVIES 3D software. Top: 3D view withvessel advancing in North-eastern direction. Bottom left: 2D view across beams. Bottom right: traditional longitudinal view for beam indicatedby vertical line in bottom left and vessel advancing to the right.
across-ship dimension, was made with the introduction ofmultibeam sonars (Gerlotto et al. 1999; Gerlotto and Paramo2003). More recently, the multibeam echosounder ME70 hasadded quantitative 3D back-scattered energy measurements asit is fully calibrated, in contrast to many of the earlier multi-beam sonars. Reduced side lobes allow observing diffuse ag-gregations in combination with dense schools or individualsclose to the bottom. Due to its multiple beams, the 3D struc-ture of fish schools can now be visualised and quantitativelycharacterized (i.e. energy wise) (Fig. 2). Increased spatial reso-lution is achieved with narrower beam widths (minimum 2.2◦)compared to traditional echosounders (7–10◦). Roll and pitchbeam stabilization and reduced side-lobe levels, up to –70 dB(two-way) instead of the –25 dB commonly found in multi-beam sonars, make this system unique for fishery research ap-plications (Trenkel et al. 2008).
A procedure for in situ calibration of the ME70 across allbeams and the entire frequency band 70–120 kHz was devel-oped in collaboration with Norwegian colleagues (Ona et al.2009). Two sets of tungsten carbide spheres are available forthe calibration: i) a small sphere (25 mm diameter) allowing tocalibrate the system with target strengths from –43 to –46 dBin the full frequency bandwidth, and ii) two large spheres (75and 84 mm diameter) with high target strengths from –32 to–34 dB. These two large spheres were specifically designedto facilitate the calibration as they are sufficiently heavy tostabilize the calibration rig (the small sphere requires the useof an additional weight) and their high target strengths per-mit to unambiguously separate biological targets that mightbe in the observation volume. However, as the target strength
spectrum for spheres of this size contains both sharp peaks anddeep nulls within the band of interest (Foote 2006), the calibra-tion of a complete beam configuration requires the use of bothspheres to cover the frequency bandwidth.
Compared to single-beam multi-frequency ER60echosounders, the ME70 collects data of similar qualityin a larger volume, with a higher resolution and an addi-tional dimension. In order to simultaneously control allechosounders (ME70 and ER60s) on board, the HERMESsoftware was developed. This software controls the configu-ration and emission of all echosounders to avoid interferencebetween them, stores all data in a single file using the HACformat (standard format to allow interchange of raw andedited hydroacoustics data, and independent of specificechosounders, software and computer platforms, ICES 2005)and manages data distribution on the network (Fig. 3, toppart). The HERMES software also handles advanced config-uration modes for the ME70, which has been designed as acustomisable equipment in order to allow exploratory workfor analysing TS variations as a function of beam angle andfrequency. Expected performances of a given configuration interms of side lobe levels and beam footprints are predicted byHERMES and shown in graphical form.
3 Analysing and combining acousticobservations: MOVIES 3D
With the addition of the multibeam echosounder ME70,the quantity of data to be treated, as well as the types of

V.M. Trenkel et al.: Aquat. Living Resour. 22, 433–445 (2009) 437
analyses that can be carried out, has increased substantially.The software SBI Viewer, which was developed in the AVITISproject (Hamitouche-Djabou et al. 1999), was the first tool forvisualizing and deriving metrics on fish schools from ResonSeabat 6012 multibeam echosounder data. To meet the chal-lenge of combining quantitative single-beam multi-frequencyand multibeam data, a new modular software is currently beingdeveloped, called MOVIES 3D (Fig. 3). The modular aspectis important for exploratory research that at a later stage willlead to an operational tool for routine acoustic surveys. Allmodules can be interfaced via a third party software such asMatlab (The Mathworks, Inc., Natick, MA), which facilitatesthe exploratory process and speeds up progress. The currentprogress and content of MOVIES 3D is presented for the mod-ules for visualization, bottom detection, data pre-processingby filtering, school detection and school descriptor calculation,and school classification (see below).
3.1 Data visualization
The visualization module of MOVIES 3D allows simulta-neous representation of selected multibeam and single-beamechosounder data (Fig. 3, right-hand side). The selected datacan be either all data, only overlapping data, i.e. data with thesame observation volume (see Sect. 3.3), or data for selectedtargets such as schools. In contrast to existing software pack-ages, the real geometric shape of the observation volume ofeach data sample is represented in three dimensions, includ-ing the increase in the observation volume with depth, theoverlap between successive pings and the transversal position(Fig. 2). This allows the user to appreciate the volume sampledby each echosounder beam and to see at a glance the degreeof overlap. On R/V Thalassa, the single-beam echosoundersand the ME70 are installed in close proximity on the vesselhull, which means that they are observing overlapping but notidentical scenes. In addition to the position on the hull, differ-ences in beam opening contribute to the differences in observa-tion volume of the different echosounders. Further, the ME70is compensated for vessel roll and pitch, while single-beamechosounders are not. As a result of the visualization of the realobservation volumes, taking also into account vessel heading,more realistic school images for interpretation of fish schoolmorphology are available. Real-time access to this representa-tion already helps qualitative analysis of species compositions.
3.2 Improving bottom detection
High fish densities close to the seabed, soft or slopingbottoms (or oblique beams) can lead to false detections bycommonly used bottom detection algorithms relying on echo-amplitude measurements alone, as reported by MacLennanet al. (2004). These authors demonstrated empirically thatphase information provided by split-beam echosounders mightallow to discriminate between the seabed and fish echoes. Thephase information is already routinely used for steered beamsin bathymetric applications (e.g. Lurton 2000, 2002).
All beams of the ME70 and the traditional single-beamechosounders can be operated in split-beam mode. Further-more, due to the reduced side-lobe levels in the beam array
pattern of the ME70, improved detection of fishes close tothe bottom, and hence separation of the seabed from thefish, should be possible. To accurately locate the bottom inall beams, the use of both amplitude and phase informa-tion for bottom detection in near-normal and outer beams ofthe ME70 was investigated (Bourguignon et al. 2009). Bour-guignon et al. developed a Bayesian particle filtering algorithm(Doucet 1998) which exploits the spatial contiguity betweenthe measurements of subsequent pings for the same beam andpotentially neighbouring ME70 beams for the same ping us-ing the barycentre in echo amplitude around the maximumfor beams with incidence angles below 15◦ and the cancella-tion in the athwartship phase-difference signal for beam inci-dence angles above 15◦. This bottom continuity particle filter-ing (BCPF) method was tested in shallow (∼30 m) and in fordeeper sea bottoms, (∼200 m) using data sets collected in theEnglish channel and Bay of Biscay respectively. In the shallowbottom data set, the BCPF was quite successful in locating thebottom despite the presence of dense herring schools close tothe seabed. Similarly, for the deeper bottom data, the BCPFled to improved bottom localisation in all ME70 beams, com-pared to traditional amplitude thresholding alone. The currentversion of the BCPF, available in MOVIES 3D, works ratherwell for a flat or smoothly-sloping seabed. To improve the per-formance of the BCPF for all seabed types, the inclusion ofinformation on the seabed slope in the algorithm will be ex-plored in future work.
3.3 Improving frequency response curves usingfiltered data
For certain fish species, for example mackerel (Scomberscombrus), the reflected energy depends on the echosounderfrequency, which means that the mackerel exhibits a distinctfrequency response curve (Korneliussen and Ona 2003). Formackerel, the response is higher at higher frequencies (i.e.higher at 200 kHz than at 18 kHz) due to the lack of swimblad-der, which is the most reflecting body part in most fish species(Simmonds and MacLennan 2005). Many modern fisheries re-search vessels have several single-beam echosounders operat-ing at different frequencies and mounted in close proximity onthe vessel hull. However, direct comparison of data collectedwith different beams to obtain frequency response curves isnot straightforward due to slight differences in the observationvolume which can become preponderant in case of small struc-tures (Korneliussen et al. 2008). Due to these problems, onlyimprecise empirical frequency response curves are currentlyavailable for many species.
Berger et al. (2009) developed a method (available inMOVIES 3D) for filtering fish schools observed by severalbeams. The filtering method makes use of the true school po-sition provided by the roll and pitch stabilized ME70, the posi-tions and orientations of the transducers and the dynamic posi-tion of the vessel. This allows the removal of echoes from thesingle-beam echosounders that were not simultaneously ob-served by all frequencies. The filtered data can then be usedto study the in situ frequency response of fish schools with in-creased accuracy (2D/3D filtered data visualisation in Fig. 3),which is a first step towards species identification.

438 V.M. Trenkel et al.: Aquat. Living Resour. 22, 433–445 (2009)
Table 2. Input parameters for MOVIES 3D software for detecting 3Daggregations in acoustic backscatter of ME70.
Parameter Suitable Commentvalue
Energy threshold –60.0 dB Threshold value for all beamsMaximum vertical 1.0 Floating number multiplied withdistance factor vertical resolution (capacity of the
system to resolve two targets in range,i.e. pulse length × sound speed /2)to be used as vertical integrationdistance
Maximum athwart 0.2 m Maximum athwart ship distanceship distance between two echoes in same schoolMaximum along 2 m Maximum along ship distanceship distance between two echoes (pings) in same
school in direction of vessel trackMinimum height 2 m Minimum height for the detected
aggregationMinimum width 5 m Minimum width for the detected
aggregationMinimum length 5 m Minimum length for the detected
aggregation
voxel: sampling unit, corresponds to echo of fixed width in a singleping in a given beam.
3.4 Detecting and describing three dimensionalstructures
Several software tools have been developed for extract-ing morphological and energetic descriptors of fish schools in2D (Weill et al. 1993; Coetzee 2000) and from sonars in 3D(Lecornu et al. 1998; Gerlotto et al. 1999; Brehmer et al. 2007).Studying the three-dimensional structure of aggregations withthe ME70 requires extending existing algorithms in terms ofadditional input parameters for school detection and parame-ters for describing the detected three-dimensional objects.
Input parameters similar to existing 2D and 3D algorithmsare used for school detection in MOVIES 3D (Table 2). Theonly additional input parameter is a maximum distance in thetransversal direction. In two dimensions, it has been foundthat two detection parameters, energy density threshold andminimum dimensions, are determining factors for the num-ber and dimensions of extracted schools (Burgos and Horne2007). These parameters can be expected to be also determin-ing in three dimensions. In addition, the energy threshold valuemight have to be modulated with respect to beam angle andechosounder frequency; research is underway to investigatethis question.
The sampling unit of detected schools is the voxel (similarto a pixel in 2D). The volume of a voxel increases with depthand depends on beam opening. The center of each voxel is spa-tially referenced by its geographic and depth position. All sub-sequent school morphology descriptors are derived from thepositions of these basic voxels. For example, the average depthof a oxels’ school can be calculated as the simple mean acrossall voxels depths in the school or as a weighted mean wherethe backscattered energy of each voxel is taken as weight.
Parameters for describing the three-dimensional struc-ture of extracted schools have been defined based on school
voxel positions and measurements of school slices (Table 3).Figure 4 illustrates the horizontal and vertical school slicesused for determining maximum length, width and height. Notethat for this approach a school is assumed to be a compact en-tity even if in reality this may not be the case. For example,maximum school length is measured between extreme voxelsin the horizontal plane, which could mean across an emptyspace in the school. Compared to two-dimensional school im-ages, the additional parameters that have become availableare school width, school position with respect to the vesseltrack and school volume and surface, if the whole school wasobserved.
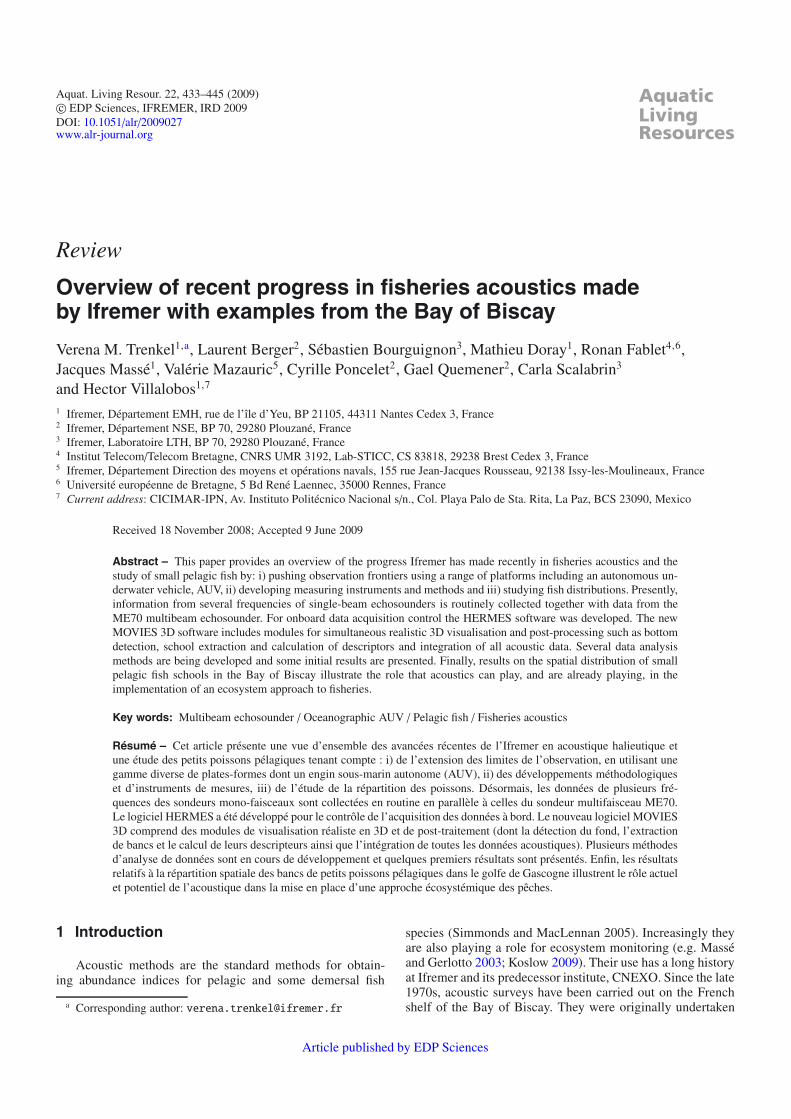
Initial results for anchovy schools observed at around100 m depth some 20 m above the seabed with the ME70(21 beams, 70–120 kHz) in the Southern Bay of Biscay(CLASS08 survey) in June 2008 indicated that maximumschool width was slightly smaller (80%) than maximum schoollength (Fig. 5a). This apparent asymmetry might, at least par-tially, be explained by the difference in resolution in the along-ship (5 to 8 m) and athwartship direction (5 to 20 m) for beamswith incidence angles 0◦ to 40◦ at a depth of about 100 metres.In addition, it could be the result of vessel avoidance reac-tions following the hypothesis proposed by Soria et al. (2003),according to which avoidance movements of fish within theschool increase inter-individual distance parallel to the vesselpath, thus making the school more elongated. School heightwas about ten times smaller than school length (Fig. 5b).
3.5 Advancing species identification
In biomass estimation by acoustics it is important to ap-portion the echoes between species or species groups, e.g. clu-peids. Most operational systems rely on experts’ interpreta-tion of echograms and the use of species composition of trawlhauls. The automation of the interpretation of the echogramshas also been investigated (Haralambous and Georgakarakos1996; Scalabrin et al. 1996). Most techniques rely on theextraction of fish schools and on their characterization us-ing various features, including school morphology or shapeand acoustic energy. More recently, multifrequency signatureshave also been considered for Atlantic herring and Norwaypout (Jech and Michaels 2006; Fässler et al. 2007), Atlanticmackerel (Gorska et al. 2005) and deep-water species (Kloseret al. 2002). Besides school characterization, the choice ofthe classification scheme is also critical. Most proposed clas-sification schemes (Haralambous and Georgakarakos 1996;Scalabrin et al. 1996; Hammond and Swartzman 2001) used“supervised training” of the classification models based on adataset with known species. Such schemes are however notsuitable for multispecies environments, such as the Bay of Bis-cay, where trawl catches are composed of a mixture of dif-ferent species. It is then impossible to create a representativedataset of schools where each school is associated with a singlespecies, and consequently a supervised training strategy can-not be applied. To overcome this problem, a novel approach forschool classification and species proportion estimation was de-veloped by Fablet et al. (2009). These authors first segmentedthe acoustic records along the survey track into successive

V.M. Trenkel et al.: Aquat. Living Resour. 22, 433–445 (2009) 439
Fig. 3. Schematic view of MOVIES 3D software structure for joint analysis of acoustic data from multibeam echosounder (ME70) and single-beam echosounders (five frequencies).
three-nautical-mile echograms and then carried out school de-tection and characterisation in these echograms. School classi-fication models are trained using the data collected at trawledsites, i.e. echograms with known relative species proportions.The models can then be used both to assign a species to agiven school and to estimate relative species proportions in anyechogram. In a second approach, echograms were analysed ona global level following Petitgas et al. (2003). Each echograminstead of school was characterized by a set of descriptors. Therelative species proportions were then inferred from the sim-ilarities between an echogram and the echograms at trawledsites, without any actual classification of individual schools.
4 Spatial distribution of small pelagic fishin the Bay of Biscay
The spatial distribution of small pelagic fish is shaped bytheir gregarious behaviour. They usually display up to four lev-els of spatial aggregation during the day, suggesting a frac-tal structure (Fréon et al. 2005). Petitgas (2001) identifiedschools, clusters of schools and assemblages of clusters ofsmall pelagic fish in the Bay of Biscay, based on acoustic data.He hypothesized that clusters of schools could be controlled bythe dynamic behaviour of schools at the small scale, whereasassemblages of clusters could be influenced by environmental

440 V.M. Trenkel et al.: Aquat. Living Resour. 22, 433–445 (2009)
Table 3. Descriptors of three-dimensional fish schools as implemented in MOVIES 3D software.
Parameter DescriptionDepth: minimum, maximum and mean Smallest and largest distance from sea surface to
top of school; mean of depth of voxels in school.Altitude: minimum and maximum Smallest and largest distance from sea floor to
bottom of school.Height: maximum Maximum height (value and horizontal distance
from vessel track, Figs. 4b,c).Geographic position: geometric Mean latitude and longitude of school voxel centresand weighted or weighted mean using voxel energy.Width: maximum Maximum width (value and depth of occurrence,
Fig. 4a).Length: maximum Maximum length (value and depth of occurrence,
Fig. 4a).Relative position: start and angle Horizontal distance from vessel track of start of
school (Fig. 4c) and angle of position wrt to track(β in Fig. 4d).
Volume: voxel volume and school Volume of school as defined by its voxels andangle opening angle for cone including school (α in
Fig. 4d).Surface Surface of school as defined by its voxelsEnergy: total and weighted Total energy as sum of energy of voxels or
weighted by voxel volume
voxel: sampling unit, corresponds to echo of fixed width in a single ping in a given beam (see Fig. 6).
b)
a) c)
d)
l
-2 0 +2 m
xSurface
Surface
Ship track
Dep
th
Dep
th
h
max length
β
α
Dep
thmax width
Fig. 4. Descriptors for three dimensional structure of fish schools as implemented in MOVIES 3D. a) maximum length and width by depthlayer; b) maximum height h and length l by vertical slice (parallel to ship track); c) same as b) but frontal view; d) school position with respectto vessel.
V.M. Trenkel et al.: Aquat. Living Resour. 22, 433–445 (2009) 441
0 10 20 30 40 50 60 70
10
20
30
40
50
60
width = 0.8 * length
Length
Wid
th
0 10 20 30 40 50 60 70
0
2
4
6
8
10
width = 0.1 * length
Length
Hei
ght
a) b)
Fig. 5. Relationship between maximum school length and maximum school width (a) and school length and maximum school height (b) for552 schools in the Bay of Biscay which are most likely anchovy.
factors structured at the regional scale. The spatial distributionof anchovy at the mesoscale (dozen of km) displayed signifi-cant correlation with plankton communities commonly foundin river plumes and in the southern coastal areas of the Bay ofBiscay (Petitgas et al. 2006). Moreover, small pelagic speciesgenerally undergo regional scale migrations, thought to be evo-lutionary adaptations to seasonal changes in food availabil-ity or search for spawning habitats favourable for offspringsurvival (Fréon et al. 2005). On a smaller scale, their verti-cal distribution changes through life history stages as well ason a daily basis (Zwolinski et al. 2007; Orlowski 2005), andtheir internal organisation structure varies from well-structuredschools to more diffuse layers, often in conjunction with adiel activity cycle of feeding and resting (Bertrand et al. 2006;Zwolinski et al. 2007).
4.1 Vertical distributions
The vertical structure of the pelagic fish assemblage inspring in the Bay of Biscay has been described extensivelybased on single-beam echosounder data. Horse mackerel aregenerally found close to the sea floor, while anchovy are de-tached from the sea floor and migrate to the surface at night.Sardine always appear as dense schools in the whole watercolumn. When present, sprat and sardine seem to be mingledwith anchovy (Massé et al. 1996; Massé and Gerlotto 2003).No patterns in the inter-annual variation of the minimum dis-tance of schools from the seabed have been evidenced, butlarge intra-annual variations were found (Villalobos 2008). Onaverage, anchovy schools were most consistently found closeto the seabed, and also had the smallest coefficients of variation(CV) of school distance from the seabed (40–80%) comparedto horse-mackerel and sardine, whose CVs were larger (horse-mackerel 40–140%; sardine 70–410%). Villalobos (2008) sug-gests that the relative stability of anchovy school distancesmight be due to the relatively low population abundance dur-ing the study period.
In spring 2008, during the spawning period of anchovy,a scientific survey (CLASS08) was carried out in the Bay of
Biscay with R/V Thalassa for collecting multifrequency andmultibeam acoustic data. The areas sampled encompassed theshelf break (down to 250 m), a coastal area called Landes,south of the Gironde river estuary (30–110 m) and a shallowarea in southern Brittany (30–50 m). The dominant speciesvaried between areas. Pelagic fishing hauls confirmed the pres-ence of horse-mackerel in all areas except southern Brittany,where mainly sardine was caught. In the coastal Landes area,horse-mackerel was found mixed with large quantities of an-chovy. The three-dimensional information provided by theME70 allowed for the visualisation of the vertical layeringof different schools, with horse mackerel in a layer close tothe bottom in daytime, either on its own near the shelf break(Fig. 6a) or with anchovy above it in the Landes area (Fig. 6b).Anchovy generally formed ribbon-like, complex aggregativestructures (Fig. 6c). Based on 2D information, it was previ-ously thought that anchovy formed many small schools. The3D observations now indicate that the small schools might beribbon-like structures cut into pieces by single-beam 2D ob-servations, but of course also by the limits of the observationvolume of the ME70. Further, the ME70 allowed for the obser-vation of interesting behavioural features, such as the spread-ing of small pelagic schools at sunset (Fig. 6d). Changes inschool morphology and vertical position in the Bay of Biscayhave already been noted based on traditional two-dimensionalacoustic observations (Massé and Gerlotto 2003). The third di-mension adds to this understanding as it offers the possibilityto describe the vertical overlap of aggregations in more detail.
4.2 Geographic distributions
The day-time geographic distribution of anchovy in theBay of Biscay in May was found to be associated with tur-bid, nutrient-rich coastal waters in the Southern part, while thedistribution of sardine during the same period was unrelatedto water mass characteristics (Petitgas et al. 2006). As a con-sequence, the day-time geographic distribution of sardines ismore variable between years but also more widespread (Massé1996; Massé and Gerlotto 2003).

442 V.M. Trenkel et al.: Aquat. Living Resour. 22, 433–445 (2009)
)b)a
)d)c
)b)a
)d)c
)b)a
)d)c
Fig. 6. Three dimensional school structure and relationship between species in the Bay of Biscay. a) horse-mackerel early in the morning closeto sea bottom (177 m); b) horse-mackerel close to bottom and anchovy detached at noon (106 m); c) probably anchovy close to surface justafter dusk (104 m); d) dispersed small pelagic fish in the late afternoon (109 m).
The large scale distribution of pelagic species (anchovy,sardine, sprat, mackerel, horse mackerel and blue whiting) inthe Bay of Biscay was analysed using single-beam PELGASsurvey data (collected in May every year) for the years 2000-2006. The findings confirm those by Petitgas et al. (2006). Inall seven years, anchovy was found close to the coast in twoareas in the Southern part of the bay (Fig. 7a). Sprat was alsodistributed close to the coast, but in a smaller, concentratedarea in front of the Gironde estuary (Fig. 7b). The locationof large sardines (>18.5 cm) was rather widespread through-out the bay and variable between years (Fig. 7c), while smallsardines (<18.5 cm) were more common in the southern part,overlapping with anchovy (Fig. 8d). A spatial size gradientwas also found for anchovy (Fig. 8a) and mackerel (Fig. 8b),with larger individuals being distributed more offshore. Theopposite pattern was found for blue whiting, for which largerindividuals were closer to the coast in shallow water (Fig. 8c).
In a more comprehensive study using ten years of single-beam acoustic survey data during the period 1990 to 2003 inthe same area, the possible linkages between the spatial distri-bution of fish in terms of geographic position, schooling pat-terns and environmental conditions were analysed (Villalobos2008). The analysis resulted in the definition of six groups of“acoustic populations” defined by school characteristics, spa-tial distribution and assemblage structure (Gerlotto 1993). Theresults indicate that the appearance of these acoustic popula-tions is more closely linked with hydrographic characteristics(sea surface salinity, bottom temperature, depth of mixed layerand potential energy deficit) as identified by Planque et al.(2004) than with species identity.
5 Perspectives
In this paper, recent methodological progress made byIfremer in fisheries acoustics is presented even though many
4344
4546
4748
-6 -4 -2
43
0
2
4
6
a) b)
-6 -5 -4 -3 -2 -1
4344
4546
4748 c) d)
Num
bero
fyea
rs
-6 -4 -2
48
46
46
44
48
44
4344
4546
4748
-6 -4 -2-6 -4 -2
43
0
2
4
6
a) b)
-6 -5 -4 -3 -2 -1
4344
4546
4748
-6 -5 -4 -3 -2 -1
4344
4546
4748 c) d)
Num
bero
fyea
rs
-6 -4 -2-6 -4 -2
48
46
46
44
48
44
Fig. 7. Number of years where species were observed in a given loca-tion in spring in the Bay of Biscay during PELGAS acoustic surveys(2000-2006). a) anchovy, b) sprat, c) big sardine (>18.5 cm), d) smallsardine (<18.5 cm).
developments are still ongoing. The biggest step was the devel-opment of the multibeam echosounder ME70, which added aspatial dimension to acoustic investigations. The tools neededfor analysing the additional quantity of data that can now becollected are only starting to be developed. There is a need tomove from visualising the data to making quantitative anal-yses. However, the 3D images alone have already changedour view of the pelagic fish community in the Bay of Bis-cay. While previous 2D images indicated the presence of many

V.M. Trenkel et al.: Aquat. Living Resour. 22, 433–445 (2009) 443
a) b) c)
Fig. 8. Average size distribution of anchovy (a), mackerel (b), blue whiting (c), in spring in the Bay of Biscay (1983-2006, with gaps) asdetermined from pelagic trawl hauls. Circle diameter is proportional to average body size.
small schools, we now realise that these are often connectedto form more diffuse structures. As for quantitative analyses,developing 3D school descriptors (Sect. 3.4) is only the firststep. Further descriptors for non-compact schools and ribbonsare a logical next step, for example using global geostatisti-cal descriptors or landscape indices (Burgos and Horne 2008),accompanied by the development of appropriate segmentationapproaches to extract homogeneous structures (e.g., compact3D schools vs. diffuse aggregative structures). For the latterissue, simple thresholding with the same value for all beamsseems no longer satisfactory, and other approaches need to betested. This work is underway. The discriminate power of thesenew descriptors for species identification need to be evalu-ated by pursuing the approaches summarised in Section 3.5.In addition, the sensitivity of school descriptors to the po-sition of the school in the fan (depth, athwartship position)and echosounder frequency requires more in-depth investiga-tions. Preliminary results from dense herring (Clupeus haren-gus) schools in the English Channel indicate that, at least forherring, the athwartship position (±40◦ observation angle) ex-plains little of the observed variability in backscattered en-ergy, which confirms the simulation results presented by Cutterand Demer (2007). Lastly, methods for joint use of single-beam multi-frequency and multibeam data for quantitative fishbiomass estimation have to be developed. Two options can beenvisaged, which differ in the degree of integration of the dif-ferent data sources: i) biomass estimation based on data fromthe 38 kHz ER60 (traditional method) and use of other fre-quencies (70 KHz, 120 kHz and 200 kHz) and ME70 data forvisual scrutiny to aid species identification and ii) biomass esti-mation using only ME70 data and five frequencies from ER60sfor species identification in automatic or semi-automatic clas-sification methods of species or species-groups. Option i) isalready operational in 2009.
Making use of the information on the additional dimen-sion, many old but also new ecological and stock-relatedquestions can now be reinvestigated (Koslow 2009). For ex-ample, the functioning of pelagic schools could be eluci-dated by studying the relationship between school structureand school dynamics, for example by tracking schools in 3D(Trygonis et al. 2009) and relating the two to environmental
conditions on different spatial scales (Bertrand et al. 2008).Routinely quantifying school reactions to the approachingvessel might allow the correction of biomass estimates forbehaviour-induced estimation bias, at least partially. Variationsin trawl catchability are related to the spatial organisation offishes, with diffuse layers being more difficult to catch andhence potentially leading to negative bias in biomass estimatesfor those species (Villalobos 2008). The 3D information pro-vided by the ME70 could provide an index for the presenceof diffuse structures and possibly lead to a modified samplingstrategy for the location of identification hauls. Implementa-tion of an ecosystem approach to fisheries management willrequire a wealth of information, not only on the biomass of ex-ploited species but also on the relationship between predatorsand preys, on species relations in schools, on relations betweenschooling patterns and environmental conditions, etc. Acous-tics in general and the ME70 in particular are going to be anessential tool for ecosystem studies (Koslow 2009). In con-clusion, much progress has been made, but even more is stillahead.
Acknowledgements. We thank our colleges for onboard assistanceduring the scientific surveys Allegro, Pelgas08 and Class08. Partof the reported work was financially supported by the projet ITIS-ACSYS (Pôle Mer Bretagne). Hector Villalobos was supported by afellowship of the Comisión de Operación y Fomento de ActividadesAcadémicas (COFAAS).
References
Axenrot T., Didrikas T., Danielsson C., Hansson S., 2004, Diel pat-terns in pelagic fish behaviour and distribution observed from astationary, bottom-mounted, and upward-facing transducer. ICESJ. Mar. Sci. 61, 1100–1104.
Berger L., Poncelet C., Trenkel V.M., 2009, A method for reducinguncertainty in estimates of fish-school frequency response usingdata from multifrequency and multibeam echosounders. ICES J.Mar. Sci. 66, 1155–1161.
Bertrand A., Barbieri M.A., Gerlotto, F., Leiva F., Córova J.,2006, Determinism and plasticity of fish schooling behaviour as
444 V.M. Trenkel et al.: Aquat. Living Resour. 22, 433–445 (2009)
exemplified by the South Pacific jack mackerel Trachurus mur-phyi. Mar. Ecol. Prog. Ser. 311, 145–156.
Bertrand A., Gerlotto F., Bertrand S., Gutiérrez M., Alza L.,Chipollini A., Díaz E., Espinoza P., Ledesma J., Quesquén R.,Peraltilla S., Chavez F., 2008, Schooling behaviour and environ-mental forcing in relation to achoveta distribution: An analysisacross multiple spatial scales. Prog. Oceanogr. 79, 264–277.
Bourguignon S., Berger L., Scalabrin C., Fablet R., Mazauric V.,2009, Methodological developments for improved bottom detec-tion with the ME70 multibeam echosounder. ICES J. Mar. Sci.66, 1015–1022.
Brehmer P., Georgakarakos S., Josse E., Trygonis V., Dalen J., 2007,Adaptation of fisheries sonar for monitoring schools of largepelagic fish: dependence of schooling behaviour on fish findingefficiency. Aquat. Living Resour. 20, 377–384.
Burgos J.M., Horne J.K., 2007, Sensitivity analysis and parameterselection for detecting aggregations in acoustic data. ICES J. Mar.Sci. 64, 160–168.
Burgos J.M., Horne J.K., 2008, Characterization and classification ofacoustically detected fish spatial distributions. ICES J. Mar. Sci.65, 1235–1247.
Castillo J., Barbieri M.A., Gonzalez A., 1996, Relationships betweensea surface temperature, salinity and pelagic fish distribution offnorthern Chile. ICES J. Mar. Sci. 53, 139–146.
Coetzee J., 2000, Use of a shoal analysis and patch estimation system(SHAPES) to characterise sardine schools. Aquat. Living Resour.13, 1–10.
Cutter Jr. G.R., Demer D.A., 2007, Accounting for scattering direc-tivity and fish behaviour in multibeam-echsounder surveys. ICESJ. Mar. Sci. 64, 1664–1674.
Dalen J., Nedreaas K., Pedersen R., 2003, A comparative acoustic-abundance estimation of pelagic redfish (Sebastes mentella) fromhull-mounted and deep-towed acoustic systems. ICES J. Mar. Sci.60, 472–479.
De Robertis A., Hjellvik V., Williamson N.J., Wilson C.D., 2008,Silent ships do not always encounter more fish: comparison ofacoustic backscatter recorded by a noise-reduced and a conven-tional research vessel. ICES J. Mar. Sci. 65, 623–635.
Demer D.A., Renfree J.S., 2008, Variations in echosounder-transducer performance with water temperature. ICES J. Mar.Sci. 65, 1021–1035.
Diner N., Le Men R., 1983, Evaluation acoustique des stocks de pois-son pélagiques dans la partie sud du golfe de Gascogne en avril-mai 83. ICES CM 1983/H: 44.
Diner N., 1999, Correction of school geometry and density: an ap-proach based on acoustic image simulation. ICES Coop. Res.Rep. 238, 27–51.
Diner N., 2001, Correction on school geometry and density: approachbased on acoustic image simulation. Aquat. Living Resour. 14,211–222.
Doray M., Josse E., Gervain P., Reynal L., Chantrel J., 2007, Jointuse of echosounding, fishing and video techniques to assess thestructure of fish aggregations around moored Fish AggregatingDevices in Martinique (Lesser Antilles). Aquat. Living Resour.20, 357–366.
Doucet A., 1998, On sequential simulation-based methods forBayesian filtering. Signal Processing Department, University,Cambridge.
Fabi G., Sala A., 2002, An assessment of biomass and diel activity offish at an artificial reef (Adriatic Sea) using a stationary hydroa-coustic technique. ICES J. Mar. Sci. 59, 411–420.
Fablet R., Lefort R., Karoui I., Berger L., Massé J., Scalabrin C.,Boucher J.M., 2009, Classifying fish schools and estimating their
species proportions in fishery-acoustic surveys. ICES J. Mar. Sci.66, 1136–1142.
Fässler S.M.M., Santos R., García-Nuñez N., Fernandes P.G., 2007,Multifrequency backscattering properties of Atlantic herring(Clupea harengus) and Norway pout (Trisopterus esmarkii). Can.J. Fish. Aquat. Sci. 64, 362–374.
Fernandes P.G., Brierley A.S., Simmonds E.J., Millards N.W.,McPhail S.D., Armstrong F., Stevenson P., Squires M., 2000, Fishdo not avoid survey vessels. Nature 404, 35–36.
Fernandes P.G., Stevenson P., Brierley A.S., Armstrong F., SimmondsE.J., 2003, Autonomous underwater vehicles: future platformsfor fisheries acoustics. ICES J. Mar. Sci. 60, 684–691.
Foote K.G., 2006, Optimizing two targets for calibrating a broadbandmultibeam sonar. Oceans 2006 Conference, Boston MA, Vol. 1–4, pp. 1499–1502.
Fréon P., Cury P., Shannon L., Roy C., 2005, Sustainable exploita-tion of small pelagic fish stocks challenged by environmental andecosystem changes: a review. Bull. Mar. Sci. 76, 385–462.
Gerlotto F., 1993, Identification and spatial stratification of tropi-cal fish concentrations using acoustic populations. Aquat. LivingResour. 6, 243–254.
Gerlotto F., Soria M., Fréon P., 1999, From two dimensions to three:the use of multibeam sonar for a new approach in fisheries acous-tics. Can. J. Fish. Aquat. Sci. 56, 6–12.
Gerlotto F., Paramo J., 2003, The three-dimensional morphology andinternal structure of clupeid schools as observed using verticalscanning multibeam sonar. Aquat. Living Resour. 16, 113–122.
Gerlotto F., Castillo J., Saavedra A., Barbieri M.A., Espejo M., CotelP., 2004, Three-dimensional structure and avoidance behaviour ofanchovy and common sardine schools in central southern Chile.ICES J. Mar. Sci. 61, 1120–1126.
Gorska N., Ona E., Korneliussen R., 2005, Acoustic backscatteringby Atlantic mackerel as being representative of fish that lack aswimbladder, backscattering by individual fish. ICES J. Mar. Sci.62, 984–995.
Hamitouche-Djabou C., Togni S., Lecornu L., 1999, SBI Viewer: 3Dfish schools and sea bottom analysis and visualisation software.User’s Guide. AVITIS Contract FAIR CT 96-1717, Developmentrelease 3–10 June, 1999 Dpt ITI, ENST-Bretagne, Brest.
Hammond T.R., Swartzman G.L., 2001, A general procedure for es-timating the composition of fish school clusters using standardacoustic survey data. ICES J. Mar. Sci. 58, 1115–1132.
Handegard N.O., Tjøstheim, D., 2005, When fish meet a travellingvessel: examining the behaviour of gadoids using a free-floatingbuoy and acoustic split-beam tracking. Can. J. Fish. Aquat. Sci.62, 2409–2422.
Haralambous J., Georgakarakos S., 1996, Artificial neural networksas a tool for species identification of fish schools. ICES J. Mar.Sci. 53, 173–180.
ICES, 2005, Description of the ICES HAC standard data exchangeformat, Version 1.60. ICES Coop. Res. Rep. 278.
Jech J.M., Michaels W.L., 2006, A multifrequency method to classifyand evaluate fisheries acoustics data. Can. J. Fish. Aquat. Sci. 63,2225–2235.
Kloser R.J., 1996, Improved precision of acoustic surveys of ben-thopelagic fish by means of deep-towed transducer. ICES J. Mar.Sci. 53, 407–413.
Kloser R.J., Ryan T., Sakov A., Williams A., Koslow J.A., 2002,Species identification in deep water using multiple acoustic fre-quencies. Can. J. Fish. Aquat. Sci. 59, 1065–1077.
Korneliussen R., Ona E., 2003, Synthetic echograms generated fromrelative frequency response. ICES J. Mar. Sci. 60, 636–640.

V.M. Trenkel et al.: Aquat. Living Resour. 22, 433–445 (2009) 445
Korneliussen R.J., Diner N., Ona E., Berger L., Fernandes P.G.,2008, Proposals for the collection of multifrequency acousticdata. ICES J. Mar. Sci. 65, 982–994.
Koslow, J.A. 2009, The role of acoustics in ecosystem-based fisherymanagement. ICES J. Mar. Sci. 66, 966–973.
Lecornu L., Burdin V., Scalabrin C., Hamitouche C., 1998, Fishschool analysis from multibeam sonar image processing. Oceans98 Conference, Nice, pp. 587–591.
Lurton X., 2000, Swath bathymetry using phase difference:Theoretical analysis of acoustical measurement precision. IEEEJ. Ocean. Engine. 25, 351–363.
Lurton, X., 2002, An introduction to underwater acoustics: Principlesand applications. Springer Verlag.
MacLennan D.N., Copland P.J., Armstrong E., Simmonds E.J., 2004,Experiments on the discrimination of fish and seabed echoes.ICES J. Mar. Sci. 61, 201–210.
Massé J., Rouxel C., 1991, Improvement in acoustic assessmentsby discrimination of pelagic shoals with INES/MOVIES system.ICES Annual Science Conference, CM 1991/B:26.
Massé J., 1996, Acoustic observations in the Bay of Biscay: school-ing, vertical distribution, species assemblages and behaviour. Sci.Mar. 60 (Suppl. 2), 227–234.
Massé J., Koutsikopoulos C., Patty W., 1996, The structure and spatialdistribution of pelagic fish schools in multispecies clusters: anacoustic study. ICES J. Mar. Sci. 53, 155–160.
Massé J., Gerlotto F., 2003, Introducing nature in fisheries research:the use of underwater acoustics for an ecosystem approach of fishpopulation. Aquat. Living Resour. 16, 107–112.
Moreno G., Josse E., Brehmer P., Nøttestadd L., 2007, Echotraceclassification and spatial distribution of pelagic fish aggregationsaround drifting fish aggregating devices (DFAD). Aquat. LivingResour. 20, 343–356.
Ona E., Mitson R.B., 1996, Acoustic sampling and signal processingnear the seabed: the deadzone revisited. ICES J. Mar. Sci. 53,677–690.
Ona E., Godø O.R., Handegard N.O., Hjellvik V., Patel R., PedersenG., 2007, Silent research vessels are not quiet. J. Acoust. Soc.Am. 121, 145–150.
Ona E., Mazauric V., Andersen L.N., 2009, Calibration methods fortwo scientific multibeam systems. ICES J. Mar. Sci. 66, 1326–1334.
Opderbecke J., Laframboise J.-M., 2007, AUVs for oceanographicscience at IFREMER, project progress and operational feedback.Oceans 2007 Conference, Vancouver, Vol. 1–5, pp. 356–360.
Orlowski A., 2005, Experimental verification of the acoustic charac-teristics of the clupeoid diel cycle in the Baltic. ICES J. Mar. Sci.62, 1180–1190.
Patel R., Handegard N.O., Godø O.R., 2004, Behaviour of herring(Clupea harengus L.) towards an approaching autonomous un-derwater vehicle. ICES J. Mar. Sci. 61, 1044–1049.
Petitgas P., Reid D., Carrera P., Iglesias M., Georgakarakos S.,Liorzou B., Massé, J., 2001, On the relation between schools,clusters of schools, and abundance in pelagic fish stocks. ICES J.Mar. Sci. 58, 1150–2001.
Petitgas P., Massé J., Beillois P., Lebarbier E., Le Cann, A., 2003,Sampling variance of species identification in fisheries-acoustic
surveys based on automated procedures associating acoustic im-ages and trawl hauls. ICES J. Mar. Sci. 60, 437–445.
Petitgas P., Massé J., Bourriau P., Bellois P., Bergeron J.-P., DelmasD., Herbland A., Koueta N., Froidefond M., Santos, M., 2006,Hydro-plankton characteristics and their relationship with sar-dine and anchovy distributions on the French shelf of the Bayof Biscay. Sci. Mar. 70S1, 161–172.
Planque B., Lazure P., Jégou A.-M., 2004, Detecting hydrologicallandscapes over the Bay of Biscay continental shelf in spring.Climate Res. 28, 41–52.
Rigaud V., 2007, Innovation and operation with robotized underwatersystems. J. Field Robotics 24, 449–459.
Scalabrin C., Massé J., 1993, Acoustic detection of the spatial andtemporal distribution of fish shoals in the Bay of Biscay. Aquat.Living Resour. 6, 269–283.
Scalabrin C., Diner N., Weill A., Hillion A., Mouchot M.C., 1996,Narrowband acoustic identification of monospecific fish schools.ICES J. Mar. Sci. 53, 181–188.
Scalabrin C., Diner N., Veron G., Choqueuse D., Sanchez F., 2005,Autonomous bottom moored acoustic observatory for fisheriesresources monitoring. Oceans 2005 Conference, Brest, Vol. 1–2.
Scalabrin C., Marfia C., Boucher J., 2009, How much fish is hiddenin surface and bottom acoustic blind zones? ICES J. Mar. Sci. 66,1355–1363.
Simmonds E.J., MacLennan D.N., 2005, Fisheries acoustics. Theoryand practice. 2nd edition. Blackwell, Oxford.
Soria M., Bahri T., Gerlotto F., 2003, Effect of external factors (en-vironment and survey vessel) on fish school characteristics ob-served by echosounder and multibeam sonar in the MediterraneanSea. Aquat. Living Resour. 16, 145–157.
Totland A., Johansen G.O., Godø O.R., Ona E., Torkelsen T., 2009,Quantifying and reducing the surface blind zone and the seabeddead zone using new technology. ICES. Mar. Sci. 66, 1370–1376.
Trenkel V.M., Mazauric V., Berger L., 2008, The new multibeam fish-eries echosounder ME70: description and expected contributionto fisheries research. ICES J. Mar. Sci. 65, 645–655.
Trevorrow M.V., 2005, The use of moored inverted echo sounders formonitoring meso-zooplankton and fish near the ocean surface.Can. J. Fish. Aquat. Sci. 62, 1004–1018.
Trygonis V., Georgakarakos S., Simmonds E.J., 2009, An operationalsystem for automatic school identification on multi-beam sonarechoes. ICES J. Mar. Sci. 66, 935–949.
Villalobos H., 2008, Évolution de l’écosystème pélagique du golfede Gascogne pendant la période 1990-2003. Conséquencessur la capturabilité des espèces. PhD, Université de BretagneOccidentale.
Weill A., Scalabrin C., Diner N., 1993, MOVIES-B: an acoustic de-tection description software. Application to shoal species’ classi-fication. Aquat. Living Resour. 6, 255–267.
Zwolinski J., Morais A., Marques V., Stratoudakis Y., Fernandes P.G.,2007, Diel variation in the vertical distribution and schooling be-haviour of sardine (Sardina pilchardus) off Portugal. ICES J. Mar.Sci. 64, 963–972.