overview of the common core mathematics curriculum map
TRANSCRIPT

LAUSD Secondary Mathematics June 28, 2016 Draft Page 1
Los Angeles Unified School District
Division of Instruction
2016-2017 Statistics and Probability Curriculum Map
Overview of the Common Core Mathematics Curriculum Map
Introduction to the Document: Welcome to the Los Angeles Unified School District’s Common Core Mathematics Curriculum Map. The Mathematics Curriculum Map for Los
Angeles Unified School District is developed as a tool for direction and clarification. It is a living document that is interactive and web-based. There
are specific, precise links to provide readily accessible resources needed to appropriately meet the rigors of the common core state standards. The
curriculum map is intended to be a one-stop tool for teachers, administrators, parents, and other school support personnel. It provides information on
the Common Core Standards for Mathematics, assessment sample items, and suggested instructional tools organized into units providing one easy-to-
read resource.
Components of the Mathematics Curriculum Map:
The curriculum map is designed around the standards for mathematics k – 12 which are divided into two sets: Practice Standards and Content
standards. The Standards for Mathematical Practice are identical for each grade level. They are the expertise and understanding which the
mathematics educators will seek to develop in their students. These practices are also the “processes and proficiencies” to be used as instructional
“habits of mind” to be developed at all grade levels. It is critical that mathematical literacy is emphasized throughout the instructional process.
The Statistics and Probability curriculum map is grouped into five coherent units. Each unit clarifies the cluster/concept and specific standards
students are to master. In addition, the relevant Mathematical Practices and learning progressions are correlated. These sections of the curriculum
map define the big idea of the unit. These five units are summarized in the Unit Organizer which provides the overview for the year.
Instructional components are specified in:
Enduring Understandings are the key understandings/big ideas that the students will learn from the unit of study. These are statements that
communicate the learning in a way that engages students.
Essential Questions are based on enduring understandings. They are used to gain student interest in learning and are limited in number. They
promote critical or abstract thinking and have the potential of more than one “right” answer. They are connected to targeted standards and are the
framework and focus for the unit.
Standards: Targeted (content and skills to be taught and assessed) and supporting (content that is relevant to the unit but may not be assessed;
may include connections to other content areas). This includes what students have to know and be able to do (learning targets) in order to meet
the standards.
Mathematical literacy is a critical part of the instructional process, which is addressed in:
Key Vocabulary and Language Goals which clearly indicate strategies for meeting the needs of EL and SEL students

LAUSD Secondary Mathematics June 28, 2016 Draft Page 2
Planning tools provided are:
Instructional Strategies lead to enduring understandings. They are varied and rigorous instructional strategies to teach content. They are plan
experiences that reinforce and enrich the unit while connecting with the standards and assessments. Instructional strategies addresses individual
student needs, learner perspectives, integration of technology, learning styles, and multiple intelligences.
Resources and Performance Tasks offer concept lessons, tasks, and additional activities for learning.
Assessments: This is also a listing of formative and summative Assessments to guide backwards planning. Student progress in achieving targeted
standards/expected learning is evaluated. Entry-level (formative)-based on summative expectations, determine starting points for learning.
Benchmark-determine progress of learning, misconceptions, strengths/weaknesses along the learning trajectory.
Differentiation () falls into three categories:
o Front Loading: strategies to make the content more accessible to all students, including EL, SEL and students with special needs. This
defines prerequisite skills needed to be successful.
o Enrichment: activities to extend the content for all learners, as all learners can have their thinking advanced, and to support the needs of
GATE students. These are ideas to deepen the conceptual understanding for advanced learners.
o Intervention: alternative methods of teaching the standards, in which all students can have a second opportunity to connect to the
learning, based on their own learning style. They guide teachers to resources appropriate for students needing additional assistance
Using the Mathematics Curriculum Map:
The guide can be thought of as a menu. It cannot be expected that one would do every lesson and activity from the instructional resources provided.
To try to teach every lesson or use every activity would be like ordering everything on a menu for a single meal. It is not a logical option. Nor is it
possible given the number of instructional days and the quantity of resources. That is why the document is called a "Mathematics Curriculum Map"
and not a "Mathematics Pacing Plan." And, like a menu, teachers select, based on instructional data, which lessons best fit the needs of their students
– sometimes students need more time with a concept and at other times, less.
An effective way to use this guide is to review and assess mathematical concepts taught in previous grades to identify potential learning gaps. From
there, teachers would map out how much time they feel is needed to teach the concepts within the unit based on the data of their students’ needs. For
example, some classes may need more time devoted to developing expressions and equations, while another class in the same course may need more
focused time on understanding the concept of functions.
The starting point for instructional planning is the standards and how they will be assessed. By first considering how the standards will be assessed,
teachers can better select the instructional resources that best build mathematical understanding. There are hundreds of resources available, both
publisher- and teacher-created, as well as web-based, that may be used to best teach a concept or skill. Collaborative planning, both within and
among courses, is strongly encouraged in order to design effective instructional programs for students.

LAUSD Secondary Mathematics June 28, 2016 Draft Page 3
Learning Progressions:
The Common Core State Standards in mathematics were built on progressions: narrative documents describing the progression of a topic across a
number of grade levels, informed both by research on children's cognitive development and by the logical structure of mathematics. The progressions
documents can explain why standards are sequenced the way they are, point out cognitive difficulties and pedagogical solutions, and give more detail
on particularly knotty areas of the mathematics. This would be useful in teacher preparation and professional development, organizing curriculum,
and writing textbooks.
Standards for Mathematical Practice:
The Standards for Mathematical Practice describe varieties of expertise that mathematics educators at all levels should seek to develop in their
students. These practices rest on important “processes and proficiencies” with longstanding importance in mathematics education. The first of these
are the National Council of Teachers of Mathematics (NCTM) process standards of problem solving, reasoning and proof, communication,
representation, and connections. The second are the strands of mathematical proficiency specified in the National Research Council’s report Adding
It Up: adaptive reasoning, strategic competence, conceptual understanding (comprehension of mathematical concepts, operations and relations),
procedural fluency (skill in carrying out procedures flexibly, accurately, efficiently and appropriately), and productive disposition (habitual
inclination to see mathematics as sensible, useful, and worthwhile, coupled with a belief in diligence and one’s own efficacy).
The Mathematics Curriculum Map is a living document—it is neither set in stone for all time nor is it perfect. Teachers and other users are
encouraged to provide on-going feedback as to its accuracy, usability, and content. Please go to achieve.lausd.net and click on the 2016-2017
Curriculum Map link, and share your comments and suggestions. Your participation in making this instructional guide a meaningful and useful tool
for all is needed and appreciated.
he grade level Common Core State Standards-aligned Curriculum Maps of the courses in this 2016 edition of the CCSS Mathematics Curriculum Map are the result of the collective expertise of the LAUSD Secondary Mathematics Team.
The District extends its gratitude to the following Statistics and Probability curriculum map development team:
Susan Sim Kim, Firoza Kanji, Scott DePutron, April Bain, Mihran Dabagian, and Stephen Lange.
This document was developed under the auspices of the Chief Academic Officer, Division of Instruction, Dr. Frances Gipson. Particular gratitude is
extended to Philip Ogbuehi, who coordinated the 2016 edition initiative under the guidance of Derrick Chau, Director of Secondary Instruction,
Division of Instruction.
T

LAUSD Secondary Mathematics June 28, 2016 Draft Page 4
Statistics and Probability – UNIT 1
Interpreting Categorical and Quantitative Data
Introduction: Instructional time will focus on creating and interpreting visual displays of data. Students will choose appropriate visual displays, measures of
center/spread for a specific data set. They will compare data sets using summary statistics.
CLUSTER COMMON CORE STATE STANDARDS
Summarize, represent, and interpret data
on a single count or measurement
variable.
Summarize, represent, and interpret data
on two categorical and quantitative
variables.
HSS.ID.A.1*
Represent data with plots on the real number line (dot plots, histograms, and box plots).
HSS.ID.A.2*
Use statistics appropriate to the shape of the data distribution to compare center (median, mean) and spread
(interquartile range, standard deviation) of two or more different data sets.
HSS.ID.A.3*
Interpret differences in shape, center, and spread in the context of the data sets, accounting for possible effects of
extreme data points (outliers).
HSS.ID.A.4
Use the mean and standard deviation of a data set to fit it to a normal distribution and to estimate population
percentages. Recognize that there are data sets for which such a procedure is not appropriate. Use calculators,
spreadsheets, and tables to estimate areas under the normal curve.
HSS.ID.B.5
Summarize categorical data for two categories in two-way frequency tables. Interpret relative frequencies in the context
of the data (including joint, marginal, and conditional relative frequencies). Recognize possible associations and trends
in the data.
HSS.ID.B.6
Represent data on two quantitative variables on a scatter plot, and describe how the variables are related.
HSS.ID.B.6.A
Fit a function to the data; use functions fitted to data to solve problems in the context of the data. Use given functions or

LAUSD Secondary Mathematics June 28, 2016 Draft Page 5
CLUSTER COMMON CORE STATE STANDARDS
Interpret linear models.
choose a function suggested by the context. Emphasize linear, quadratic, and exponential models.
HSS.ID.B.6.B
Informally assess the fit of a function by plotting and analyzing residuals.
HSS.ID.B.6.C
Fit a linear function for a scatter plot that suggests a linear association.
HSS.ID.C.7
Interpret the slope (rate of change) and the intercept (constant term) of a linear model in the context of the data.
HSS.ID.C.8
Compute (using technology) and interpret the correlation coefficient of a linear fit.
HSS.ID.C.9
Distinguish between correlation and causation.
MATHEMATICAL PRACTICES LEARNING PROGRESSIONS
1. Make sense of problems and
persevere in solving them.
2. Reason abstractly and quantitatively.
3. Construct viable arguments and
critique the reasoning of others.
4. Model with mathematics.
5. Use appropriate tools strategically.
6. Attend to precision.
7. Look for and make use of structure.
8. Look for and express regularity in
repeated reasoning.
Statistics and Probability Progression
http://commoncoretools.me/wp-content/uploads/2012/06/ccss_progression_sp_hs_2012_04_21_bis.pdf

LAUSD Secondary Mathematics June 28, 2016 Draft Page 6
ENDURING UNDERSTANDINGS ESSENTIAL QUESTIONS KEY VOCABULARY
Students create and interpret appropriate models
of data (dotplots, stemplots, boxplots,
histograms, two-way tables, scatterplots).
Students compare shape, center, and spread for
distributions of quantitative data.
Students understand how measures of center and
spread change in response to extreme
observations/outliers.
Students standardize data using z-scores and
percentiles. Students understand the Normal
distribution and can use it to estimate population
percentages. Ex. Empirical Rule (68-95-99.7)
Students compute marginal and conditional
distributions and can mathematically justify
whether two categorical variables are
associated.
Students can describe associations between two
quantitative variables (form, direction, strength).
Students can fit a function to the data (linear,
quadratic, exponential, etc.).
Students interpret components of a line of best
fit (slope and y-intercept) and the correlation
coefficient, r.
Students understand the distinction between
correlation and causation.
How can data be expressed so that their accurate
meaning is concisely presented to a specific
audience?
How can you compare two distributions of
quantitative data utilizing shape, center, spread, and
outliers?
How do extreme observations affect summary
statistics?
In what ways does knowing the outcome of one
event affect subsequent events?
What are the patterns in data collected and how are
they useful?
What are the statistical tools that can be used to
create models, interpret data, and make predictions?
How can you explain the association between two
categorical/quantitative variables?
Does correlation imply causation? Explain why or
why not.
Average
Bar graph
Bimodal distribution
Box plot
Correlation (r)
Coefficient of determination ( Cumulative frequency distribution
Dotplot
Empirical rule
Explanatory variable
Extrapolation
Five-number summary
Frequency
Histogram
Interpolation
Interquartile range (IQR)
Linear correlation
Mean
Median
Mode
Normal curves
Normal distributions
Outlier
Parameter
Percentile
Pie chart
Population
Qualitative variable
Quantitative variable
Quartile
Range
Relative-frequency histogram
Residual
Residual plot
Resistant measure
Response variable
Sample
Scatter plot
Skewed left/right

LAUSD Secondary Mathematics June 28, 2016 Draft Page 7
Slope
Standard Deviation
Standard Normal distribution
Standard units
Statistic
Stemplot
Symmetric distribution
Uniform distribution
z-score
RESOURCES INSTRUCTIONAL STRATEGIES ASSESSMENT
Graphing calculator: Create graphs of
quantitative data
Statistical Software (Fathom Dynamic Software,
IBM SPSS Statistics, etc.)
Desmos.com: See regression tutorial
StatKey: Free resource for creating graphs:
http://lock5stat.com/statkey/
Microsoft Excel/Google sheets: Create bar
graphs, pie charts, segmented bar graphs
Rossman Chance Applet collection
(http://www.rossmanchance.com/applets/index.
html): Guess the correlation applet
https://www.amstat.org/censusatschool/: Data
resource from students around the world
Against All Odds:
https://www.learner.org/resources/series65.html
http://mathbits.com/: Tips to help with graphing
calculators
Gapminder: https://www.gapminder.org/for-
teachers/
AP Stats Monkey: This site includes a
wonderful collection of resources written by
teachers and collected by Jason Molesky.
http://apstatsmonkey.com/StatsMonkey/Statsmo
nkey.html
When asking students to describe a distribution,
students must describe the shape, outliers,
center, and spread (SOCS) of the distribution.
The acronym SOCS may help students
remember to describe each of these features.
Often times, students forget to describe data in
context of a scenario. Statistics problems are
almost always about some form of real world
data, which should be emphasized as the
students describe SOCS.
o E.g., when describing the center of the
distribution of games won by all NBA
teams last year, students should mention
that the center of the distribution
is_____ number of games won, rather
than solely the center is _____.
The effect of outliers on a set of data is very
important in the real world.
o An example that can be used would be
to provide students with 4 different test
scores: 75, 80, 70, and 95. Ask the
students to find the student’s average
test score, as well as the median,
standard deviation, and Interquartile
range. Then ask what would happen to
each summary statistic if the student
cheated on his/her next test and
received a 0. This should help them
Formative Assessment
SBAC - http://www.smarterbalanced.org/
LAUSD Interim Assessment
District assessments can be accessed through:
http://achieve.lausd.net/math
http://achieve.lausd.net/ccss
Use your Single Sign On to access the Interim
Assessments
California will be administering the Smarter
Balanced Assessment as the end of course for grades
3-8 and 11. The 11th grade assessment will include
items from all High School Common Core strands,
including Statistics and Probability. For examples,
visit the Smarter Balanced Assessment at:
http://www.smarterbalanced.org/
LAUSD Secondary Mathematics June 28, 2016 Draft Page 8
RESOURCES INSTRUCTIONAL STRATEGIES ASSESSMENT
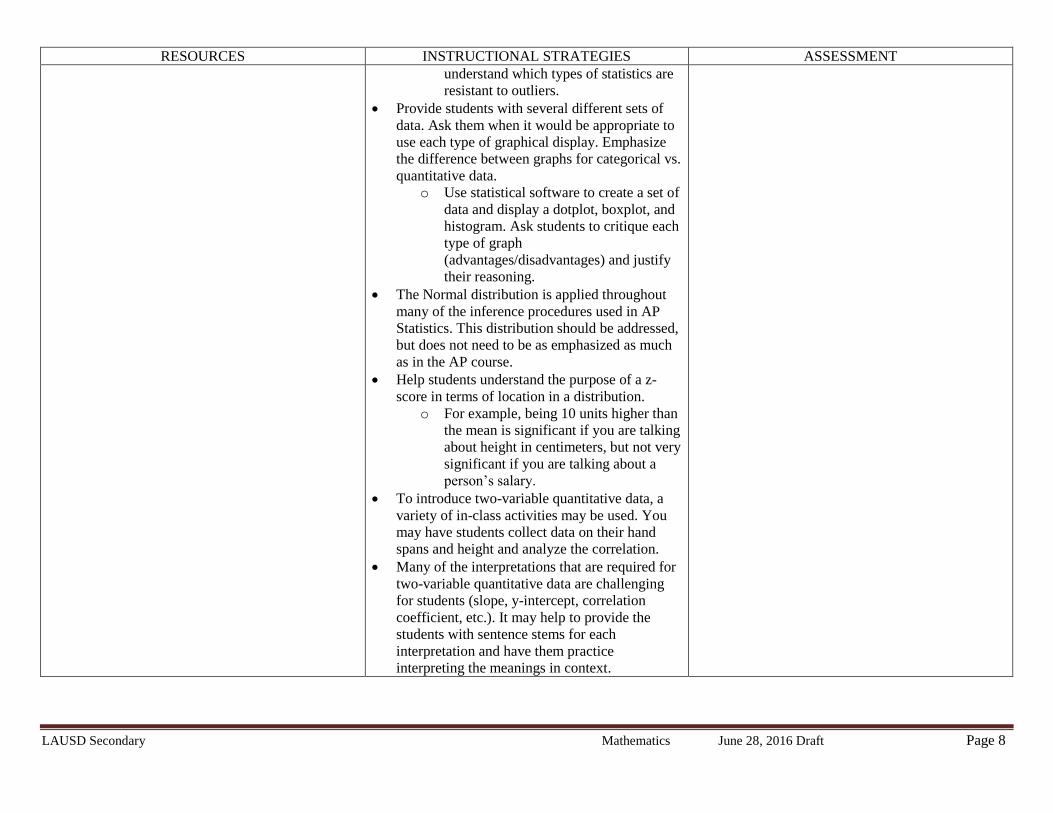
understand which types of statistics are
resistant to outliers.
Provide students with several different sets of
data. Ask them when it would be appropriate to
use each type of graphical display. Emphasize
the difference between graphs for categorical vs.
quantitative data.
o Use statistical software to create a set of
data and display a dotplot, boxplot, and
histogram. Ask students to critique each
type of graph
(advantages/disadvantages) and justify
their reasoning.
The Normal distribution is applied throughout
many of the inference procedures used in AP
Statistics. This distribution should be addressed,
but does not need to be as emphasized as much
as in the AP course.
Help students understand the purpose of a z-
score in terms of location in a distribution.
o For example, being 10 units higher than
the mean is significant if you are talking
about height in centimeters, but not very
significant if you are talking about a
person’s salary.
To introduce two-variable quantitative data, a
variety of in-class activities may be used. You
may have students collect data on their hand
spans and height and analyze the correlation.
Many of the interpretations that are required for
two-variable quantitative data are challenging
for students (slope, y-intercept, correlation
coefficient, etc.). It may help to provide the
students with sentence stems for each
interpretation and have them practice
interpreting the meanings in context.

LAUSD Secondary Mathematics June 28, 2016 Draft Page 9
LANGUAGE GOALS for low achieving, high achieving, students with disabilities and English Language Learners
Students will use comparative language when comparing the center and spread for distributions of data in context.
Example: The center for distribution 1 is higher/lower than the center for distribution 2. There is more/less variability in distribution 2 than in distribution 1.
Students will collaboratively decide which graphical display would be best suited for a specific set of data and justify orally or in writing why this graphical
display is preferred over another.
Example: I would choose (graphical display) because...
Students will interpret the slope and y-intercept of a regression equation in context.
Example: Suppose we have a data set where x = the age of a plant in months, y = the height of a plant, and the regression equation is ˆ 1.2 2.3y x .
Slope: For every additional month that passes, the predicted height of the plant will increase by 2.3 cm.
Y-intercept: For a plant that is 0 months old, the predicted height is 1.2 cm.
PERFORMANCE TASK
An AP Statistics teacher asked two of his previous classes the question, “How long does it take you to get to school?” Below are parallel boxplots summarizing
the students’ answers to this question. Compare the time it takes to get to school for the AP Stats classes in 2013 and 2014.
When asked to describe or compare distributions of data, students will be expected to describe the Shape, Outliers, Center, and Spread (SOCS) in context of the
scenario. Here is a sample answer to the question above.
Shape: The distribution of minutes to get to school for the AP stats class in 2013 is roughly symmetrical, while the distribution of minutes to get to school for the
AP stats class in 2014 is skewed to the right.
Outliers: For the class of 2013, there was one student who took 75 minutes to get to school, while in the class of 2014, there were 3 students whose times are
considered outliers (65, 90, and 95 minutes to get to school). All four of these students took unusually longer to get to school than their classmates.
** The 1.5(IQR) rule can be used to test for outliers if you are given the actual data.

LAUSD Secondary Mathematics June 28, 2016 Draft Page 10
Center: The students in the class of 2013 take longer to get to school, on average, than the students in the class of 2014 (median = 25 minutes in 2013 vs. 15 in
2014).
**Measures of center include the mean and median.
Spread: There is more variability in the distribution of minutes to get to school for the class of 2014 than for the class of 2013. Although the middle 50% of the
distributions are both spread over 20 minutes (definition of IQR), the distribution of data in the class of 2014 has a larger range (95 – 3 = 92 minutes) than the class
of 2013 (75 – 4 = 71 minutes).
**Measures of spread include IQR (Q3 – Q1), standard deviation, and range (max – min).
Here are some additional questions to ask your students (strictly about quantitative data):
What was the cost of your last ______________ (e.g. haircut)?
How many siblings/cousins/relatives do you have?
How many texts do you send per day? How many can you send per minute? (provide students with a list of messages and time them)
What is your GPA?
How old are you?
How many hours of sleep do you get? How long do you spend on homework/video games/watching Netflix/eating?
**Have the students create graphs of these topics and describe the distributions or compare different class sets of data using SOCS.
DIFFERENTIATION
UDL/ FRONT LOADING ACCELERATION INTERVENTION
Statistics and Probability:
As an opening activity, conduct an activity
in which students collect a quick set of data
from the class and analyze the mean,
median, mode, and range. Survey questions
could include: the number of letters in your
name, number of cousins versus aunts and
uncles, typical number of minutes to get to
school, primary transportation method to get
to school, shoe size.
Model a simple activity involving collecting
a quick set of data from the class and
analyzing (calculate) the mean, median,
mode, and range (e.g. the number of letters
in your first and last name).
Students could create a graphical display of
the data collected from the activity above.
Create a KWL (Know, Want to know,
Learned) chart for unit vocabulary.
Acceleration for high achieving students:
While teaching two-variable quantitative
data, encourage students to visit the site
http://www.tylervigen.com to demonstrate
that correlation does not imply causation.
Have students research other publications
that involve correlation.
Present students with Anscombe’s Quartet
to help students understand the value of
graphing data prior to calculating summary
statistics.
Present an example of Simpson’s Paradox
(2016 FRQ #6 from the AP Statistics
Exam).
Students who are having difficulty
understanding standard deviation may need to
be introduced to the idea of mean average
deviation (MAD) first. This may help students
understand the idea of average variability from
the mean more clearly.
Many of the interpretations that are required for
two-variable quantitative data are challenging
for students (slope, y-intercept, correlation
coefficient, etc.). It may help to provide the
students with sentence stems for each
interpretation and have them practice
interpreting the meanings in context.

LAUSD Secondary Mathematics June 28, 2016 Draft Page 11
Statistics and Probability – UNIT 2
Designing and Evaluating Studies
Introduction: Instructional time should focus on designing and evaluating statistical studies. Students will learn the differences between sample surveys,
observational studies, and experiments. Students will learn the consequences of bias and how to construct a study to minimize bias. In Unit 5, students will make
inferences and conclusions based on the types of studies that they have learned in this unit.
CLUSTER COMMON CORE STATE STANDARDS
Understand and evaluate statistical
studies: sample surveys, experiments,
and observational studies.
Justify conclusions from statistical
studies.
HSS.IC.A.1
Understand statistics as a process for making inferences about population parameters based on a random sample from
that population.
HSS.IC.B.3
Recognize the purposes of and differences among sample surveys, experiments, and observational studies; explain how
randomization relates to each.
HSS.IC.B.6
Evaluate reports based on data.
MATHEMATICAL PRACTICES LEARNING PROGRESSIONS
1. Make sense of problems and
persevere in solving them.
2. Reason abstractly and quantitatively.
3. Construct viable arguments and
critique the reasoning of others.
4. Model with mathematics.
5. Use appropriate tools strategically.
6. Attend to precision.
Statistics and Probability Progression
http://commoncoretools.me/wp-content/uploads/2012/06/ccss_progression_sp_hs_2012_04_21_bis.pdf

LAUSD Secondary Mathematics June 28, 2016 Draft Page 12
7. Look for and make use of structure.
8. Look for and express regularity in
repeated reasoning.
ENDURING UNDERSTANDINGS ESSENTIAL QUESTIONS KEY VOCABULARY
Students distinguish a population/parameter
from a sample/statistic.
Students recognize the purpose for different
random sampling methods (simple random
sample, stratified, cluster, etc.).
Students compare and contrast sample surveys,
observational studies, and experiments.
Students understand different experimental
designs such as blocking and matched pairs.
What is the difference between a statistic and a
parameter?
What is the best sampling method given
scenario? Justify your response.
Which types of studies allow you to conclude a
causal relationship between two variables and
why?
What are the key components of good
experimental design?
Bias
Blocking
Census
Cluster sampling
Confounding
Convenience sampling
Double-blind experiment
Individuals
Nonresponse
Placebo effect
Population data
Randomized experiment
Sample size (n)
Simple random sample
Simulation
Stratified sampling
Systematic sampling
Variable
Voluntary Response
RESOURCES INSTRUCTIONAL STRATEGIES ASSESSMENT
Graphing calculator: randint( command for
random sampling
Random.org: Create random digits
The Data and Story Library (DASL):
http://lib.stat.cmu.edu/DASL
Against All Odds:
https://www.learner.org/resources/series65.html
AP Stats Monkey: This site includes a
wonderful collection of resources written by
teachers and collected by Jason Molesky.
http://apstatsmonkey.com/StatsMonkey/Statsmo
nkey.html
Emphasize that students should not just refer to
a sampling method as biased. Students must be
able to explain why a sampling method is biased
and whether it will lead to an overestimation or
underestimation of the parameter of interest.
Show students multiple methods for creating a
simple random sample (SRS): putting slips of
paper in a hat and mixing it, using dice/coins,
using a table, and using technology (calculator
or Random.org).
Emphasize the importance of random sampling.
Have students create a graphic organizer
Formative Assessment
SBAC – http://www.smarterbalanced.org/
LAUSD Periodic Assessment
District assessments can be accessed through:
http://achieve.lausd.net/math
http://achieve.lausd.net/ccss
Use your Single Sign On to access the Interim
Assessments

LAUSD Secondary Mathematics June 28, 2016 Draft Page 13
RESOURCES INSTRUCTIONAL STRATEGIES ASSESSMENT
comparing an SRS, stratified random sample,
and cluster sample. They should compare the
advantages and disadvantages of each.
You may choose to have the students design an
experiment prior to learning about the key
principles of experimental design. For example,
ask them to design an experiment to determine
if yoga reduces stress using 100 volunteers. You
will be surprised to see how many students will
incorporate the ideas of comparative groups,
randomization, control, and replication prior to
formally learning these concepts.
Have students write a proposal in which they
will apply the full statistical investigative
process. This could be part of a year-long
project.
California will be administering the SMARTER
Balance Assessment as the end of course for grades
3-8 and 11. The 11th grade assessment will include
items from all High School Common Core strands,
including Statistics and Probability. For examples,
visit the SMARTER Balance Assessment at:
http://www.smarterbalanced.org/
LANGUAGE GOALS for low achieving, high achieving, students with disabilities and English Language Learners
Students will critique studies that have been published.
Example: Since this survey was posted online, it was subject to voluntary response bias. This could lead to an over/under-estimation of…
Students will explain orally or in writing how to incorporate randomization into a study.
Example: Obtain a list of the names of the 100 subjects and assign each subject a number from 1-100. Use a random number generator to select 50 different
numbers. The subjects who correspond to those 50 numbers will be assigned to the treatment group, and the remaining 50 subjects will be assigned to the
control group.
Students will design experiments and clearly explain orally or in writing how all principles of experimental design are incorporated.
Example: In order to determine if listening to music while studying helps improve achievement, first we will randomly assign… We will maintain control
by…

LAUSD Secondary Mathematics June 28, 2016 Draft Page 14
PERFORMANCE TASK
Does ginkgo improve memory? The law allows marketers of herbs and other natural substances to make health claims that are not supported by evidence. Brands
of ginkgo extract claim to improve memory and concentration. A randomized comparative experiment found no statistically significant evidence for such effects.
The subjects were 230 healthy volunteers over 60 years old. They were randomly assigned to ginkgo or a placebo pill (a dummy pill that looks and tastes the
same). All the subjects took a battery of tests for learning and memory before treatment started and again after six weeks. (Moore, Basic Practice of Statistics, 5e,
2009)
(a) The study was double-blind. What does this mean?
(b) Comment briefly on the extent to which results of this study can be generalized to some larger population, and the extent to which cause and effect has been
established.
(c) Explain why it is more advantageous to use 230 volunteers in this study, rather than 30.
(d) Using the random digits below (starting at line 103), choose the first four members of the ginkgo group. Explain your method.
DIFFERENTIATION
UDL/ FRONT LOADING ACCELERATION INTERVENTION
Statistics and Probability:
As an opening activity, guide students in the
design and execution of an in class
experiment (e.g. taste test of different types
of bottled water - determine a question of
interest, what variables to collect, who are
the observational units, how is it random).
Students use "common sense" to design an
experiment, then the teacher can connect
experiment vocabulary throughout the unit
back to students' original ideas).
Statistical problem solving is an
investigative process that involves four
components: formulate questions, collect
Acceleration for high achieving students:
Encourage students to find studies that have
incorporated different forms of random sampling,
including a multi-stage design. Ask them to explain
why they think that the people who planned the
study chose each method.
Help students distinguish stratified sampling from
cluster sampling: in a stratified sample, the
population is divided into strata and sample “some
from all;” whereas in a cluster sample, we divide the
population into clusters and sample “all from some.”
Make a foldable for students to write down all
of the important vocabulary in the unit, along
with their definitions/applications. Another
strategy to build understanding of vocabulary
would be to use a word wall in the classroom or
have the students create a word puzzle.
Provide graphic organizers for survey and
experimental design.

LAUSD Secondary Mathematics June 28, 2016 Draft Page 15
DIFFERENTIATION
UDL/ FRONT LOADING ACCELERATION INTERVENTION
data, analyze data, and interpret results. The
connection should be reviewed prior to
detailing all of the principles of a good
experimental design.
Make the connection between hypotheses
and conclusions in science classes and the
current unit.
As a group project, have students design and
conduct an experiment to investigate the effects of
response bias in surveys. Allow them to choose the
specific topic, but ensure that their topic can answer
at least one of the following questions (adopted from
Josh Tabor):
Can the wording of a question create
response bias?
Does providing additional information
create response bias?
Do the characteristics of the interviewer
create response bias?
Does anonymity change the responses to
sensitive questions?
Does manipulating the answer choices/order
of answer choices change the response?
Can revealing other peoples’ answers to a
question create response bias?

LAUSD Secondary Mathematics June 28, 2016 Draft Page 16
Statistics and Probability – UNIT 3
Probability Rules
Introduction: Instructional time is spent on the concepts of randomness and probability. Students will learn about the Law of Large Numbers and how to calculate
the likelihood of random events and outcomes. Students will learn about the counting principle, permutations, and combinations prior to learning how to apply the
basic rules of probability.
CLUSTER COMMON CORE STATE STANDARDS
Use the rules of probability to compute
probabilities of compound events.
Understand independence and
conditional probability and use them to
interpret data.
HSS.CP.A.1
Describe events as subsets of a sample space (the set of outcomes) using characteristics (or categories) of the outcomes,
or as unions, intersections, or complements of other events ("or," "and," "not").
HSS.CP.B.7
Apply the Addition Rule, P(A or B) = P(A) + P(B) - P(A and B), and interpret the answer in terms of the model.
HSS.CP.B.8
(+) Apply the general Multiplication Rule in a uniform probability model, P(A and B) = P(A)P(B|A) = P(B)P(A|B), and
interpret the answer in terms of the model.
HSS.CP.B.9
(+) Use permutations and combinations to compute probabilities of compound events and solve problems.
HSS.CP.A.2
Understand that two events A and B are independent if the probability of A and B occurring together is the product of
their probabilities, and use this characterization to determine if they are independent.
HSS.CP.A.3
Understand the conditional probability of A given B as P(A and B)/P(B), and interpret independence of A and B as saying
that the conditional probability of A given B is the same as the probability of A, and the conditional probability of B
given A is the same as the probability of B.
HSS.CP.A.4
Construct and interpret two-way frequency tables of data when two categories are associated with each object being

LAUSD Secondary Mathematics June 28, 2016 Draft Page 17
CLUSTER COMMON CORE STATE STANDARDS
classified. Use the two-way table as a sample space to decide if events are independent and to approximate conditional
probabilities. For example, collect data from a random sample of students in your school on their favorite subject among
math, science, and English. Estimate the probability that a randomly selected student from your school will favor science
given that the student is in tenth grade. Do the same for other subjects and compare the results.
HSS.CP.A.5
Recognize and explain the concepts of conditional probability and independence in everyday language and everyday
situations. For example, compare the chance of having lung cancer if you are a smoker with the chance of being a
smoker if you have lung cancer.
HSS.CP.B.6
Find the conditional probability of A given B as the fraction of B's outcomes that also belong to A, and interpret the
answer in terms of the model.
MATHEMATICAL PRACTICES LEARNING PROGRESSIONS
1. Make sense of problems and
persevere in solving them.
2. Reason abstractly and quantitatively.
3. Construct viable arguments and
critique the reasoning of others.
4. Model with mathematics.
5. Use appropriate tools strategically.
6. Attend to precision.
7. Look for and make use of structure.
8. Look for and express regularity in
repeated reasoning.
Statistics and Probability Progression
http://commoncoretools.me/wp-content/uploads/2012/06/ccss_progression_sp_hs_2012_04_21_bis.pdf

LAUSD Secondary Mathematics June 28, 2016 Draft Page 18
ENDURING UNDERSTANDINGS ESSENTIAL QUESTIONS KEY VOCABULARY
Students understand the concept of probability
and the Law of Large Numbers.
Students interpret probability as a long-run
relative frequency.
Students apply the counting principle,
permutations, and combinations to solve
problems.
Students understand when and how to apply the
basic probability rules.
Students understand conditional probability and
independence.
How do you apply probability rules?
How do you define the sample space for a
random phenomenon?
What is independence and how do you
determine whether given events are
independent?
What is the difference between permutations
and combinations?
How do you compute probabilities for mutually
exclusive (disjoint) or overlapping events?
How do you compute conditional probabilities?
Addition rule of probability
Combination
Complement
Conditional probability
Disjoint/Mutually exclusive events
Event
Factorial (!)
Fundamental counting principle
Independent events
Law of large numbers
Multiplication rule of probability
Permutation
Sample space
RESOURCES INSTRUCTIONAL STRATEGIES ASSESSMENT
Graphing calculators: factorials (!), nPr, cPr
Graphic Organizer such as Venn Diagram, tree
diagram, two-way tables, etc.
Geogebra applets for simulating randomness
**resource for combinations/permutations
Against All Odds:
https://www.learner.org/resources/series65.html
AP Stats Monkey: This site includes a
wonderful collection of resources written by
teachers and collected by Jason Molesky.
http://apstatsmonkey.com/StatsMonkey/Statsmo
nkey.html
Help students use Venn diagrams, tree diagram,
or two-way tables to visualize probability
calculations.
When introducing the idea of conditional
probability, display the entire two-way table and
then physically cover up the rows or columns
that are not part of the “given.” This will help
students focus on only the row or column that
represents the event that we know has occurred.
Use Venn Diagrams and formulas to
demonstrate the difference between mutually
exclusive/disjoint events and independent
events.
Formative Assessment
SBAC - http://www.smarterbalanced.org/
LAUSD Periodic Assessment
District assessments can be accessed through:
http://achieve.lausd.net/math
http://achieve.lausd.net/ccss
Use your Single Sign On to access the Interim
Assessments
California will be administering the SMARTER
Balance Assessment as the end of course for grades
3-8 and 11. The 11th grade assessment will include
items from all High School Common Core strands,
including Statistics and Probability. For examples,
visit the SMARTER Balance Assessment at:
http://www.smarterbalanced.org/.

LAUSD Secondary Mathematics June 28, 2016 Draft Page 19
LANGUAGE GOALS for low achieving, high achieving, students with disabilities and English Language Learners
Students will justify verbally or in writing whether two events are independent.
Example Stem: Justify whether ____ and _____ are independent.
Students will comprehend a written scenario and be able to apply the appropriate probability rules.
Example Stem: Given the probability of _______, what is the probability of _______.
Students will apply the general multiplication rule and interpret the answer.
Example: Find the probability of choosing two face cards from a standard deck without replacement and interpret what this probability means.
PERFORMANCE TASK
A psychologist is interested in the relationship between handedness (left or right) and IQ scores. He collected the following data from a random sample of 259 high
school students.
<55 55-<70 70-<85 85-<100 100-<115 115-<130 130-<145 >145
Left 1 2 6 25 32 15 14 3
Right 4 7 15 44 51 23 15 2
1. What is the probability that a student from this group has an IQ greater than 130?
2. What is the probability that a student has an IQ greater than 130, given that she is left-handed?
DIFFERENTIATION
UDL/ FRONT LOADING ACCELERATION INTERVENTION
Statistics and Probability:
As an opening activity, allow students to
play a game of chance. For example, Two
Dice Sum game
(http://www.mathwire.com/data/dicetoss2.ht
ml). Students will develop a strategy for
winning that can later be quantified with
probabilities.
Clearly define the difference between a
sample and a population. This is a very
important idea for students to understand
early in the unit and throughout the rest of
Acceleration for high achieving students:
Students could use Bayes’s theorem to solve
probability questions that require
“backward” in a tree diagram.
Present the birthday problem: Ask students
to predict the probability that any two
people in the class share the same birthday.
Then ask them to justify their predictions
using probabilities.
The Monte Hall problem: Discuss how
probability can be applied to making
decisions.
Students will make layered books to learn
key vocabularies related to probabilities.
Students will learn about using graphic
organizers and understand the meaning of
mutually exclusive/disjoint.
Students need to understand the conversion
between fractions and decimals.

LAUSD Secondary Mathematics June 28, 2016 Draft Page 20
DIFFERENTIATION
UDL/ FRONT LOADING ACCELERATION INTERVENTION
the course.
Review components of combinations and
permutations, specifically factorials.
Understand the meaning of statistics and
probability.
Understand vocabulary words such as
sample space, events, etc.
Students should have basic knowledge of
fractions that they learned in previous math
classes and make connection to the basic
rule of probability.

LAUSD Secondary Mathematics June 28, 2016 Draft Page 21
Statistics and Probability – UNIT 4
Using Probability to Make Decisions
Introduction: Instructional time will be spent on applying probability rules to create a probability distribution model with a main focus on discrete data sets.
Students will use these probability distribution models to make appropriate decisions.
CLUSTER COMMON CORE STATE STANDARDS
Calculate expected values and use
them to solve problems.
Use probability to evaluate outcomes
of decisions.
HSS.MD.A.1
(+) Define a random variable for a quantity of interest by assigning a numerical value to each event in a sample space;
graph the corresponding probability distribution using the same graphical displays as for data distributions.
HSS.MD.A.2
(+) Calculate the expected value of a random variable; interpret it as the mean of the probability distribution.
HSS.MD.A.3
(+) Develop a probability distribution for a random variable defined for a sample space in which theoretical probabilities
can be calculated; find the expected value.
For example, find the theoretical probability distribution for the number of correct answers obtained by guessing on all
five questions of a multiple-choice test where each question has four choices, and find the expected grade under various
grading schemes.
HSS.MD.A.4
(+) Develop a probability distribution for a random variable defined for a sample space in which probabilities are
assigned empirically; find the expected value. For example, find a current data distribution on the number of TV sets per
household in the United States, and calculate the expected number of sets per household. How many TV sets would you
expect to find in 100 randomly selected households?
HSS.MD.B.5
(+) Weigh the possible outcomes of a decision by assigning probabilities to payoff values and finding expected values.
HSS.MD.B.5.A
Find the expected payoff for a game of chance. For example, find the expected winnings from a state lottery ticket or a
LAUSD Secondary Mathematics June 28, 2016 Draft Page 22
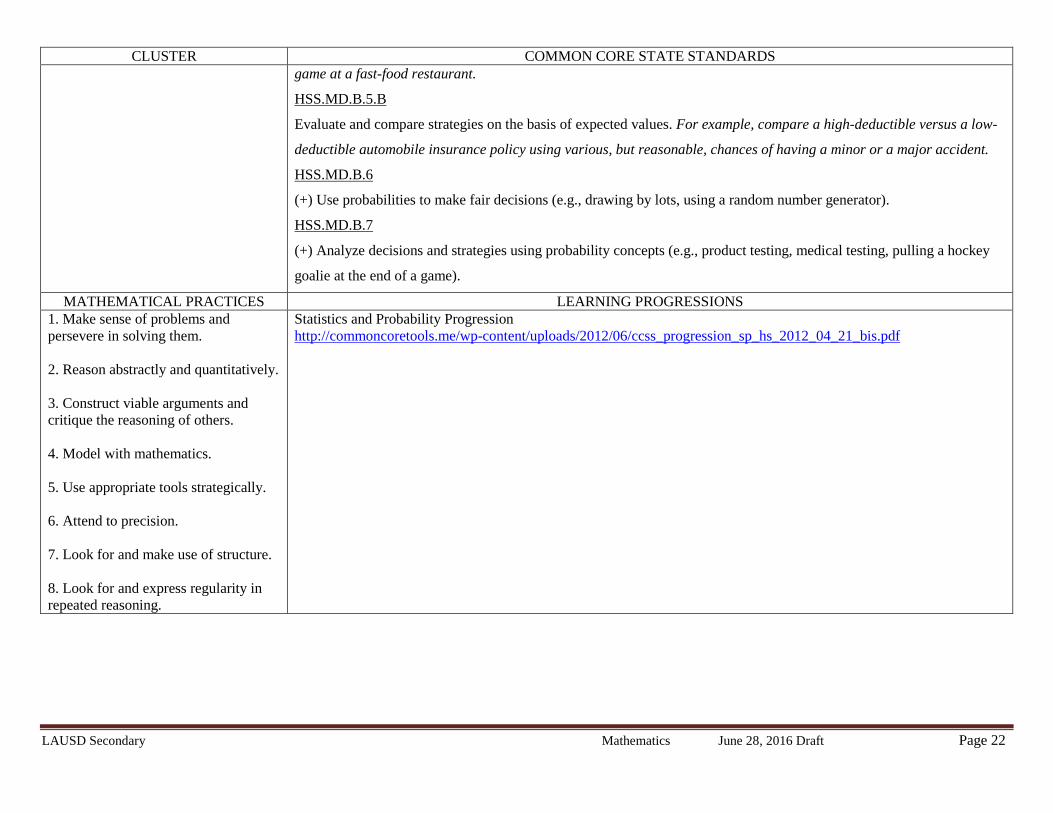
CLUSTER COMMON CORE STATE STANDARDS
game at a fast-food restaurant.
HSS.MD.B.5.B
Evaluate and compare strategies on the basis of expected values. For example, compare a high-deductible versus a low-
deductible automobile insurance policy using various, but reasonable, chances of having a minor or a major accident.
HSS.MD.B.6
(+) Use probabilities to make fair decisions (e.g., drawing by lots, using a random number generator).
HSS.MD.B.7
(+) Analyze decisions and strategies using probability concepts (e.g., product testing, medical testing, pulling a hockey
goalie at the end of a game).
MATHEMATICAL PRACTICES LEARNING PROGRESSIONS
1. Make sense of problems and
persevere in solving them.
2. Reason abstractly and quantitatively.
3. Construct viable arguments and
critique the reasoning of others.
4. Model with mathematics.
5. Use appropriate tools strategically.
6. Attend to precision.
7. Look for and make use of structure.
8. Look for and express regularity in
repeated reasoning.
Statistics and Probability Progression
http://commoncoretools.me/wp-content/uploads/2012/06/ccss_progression_sp_hs_2012_04_21_bis.pdf
LAUSD Secondary Mathematics June 28, 2016 Draft Page 23
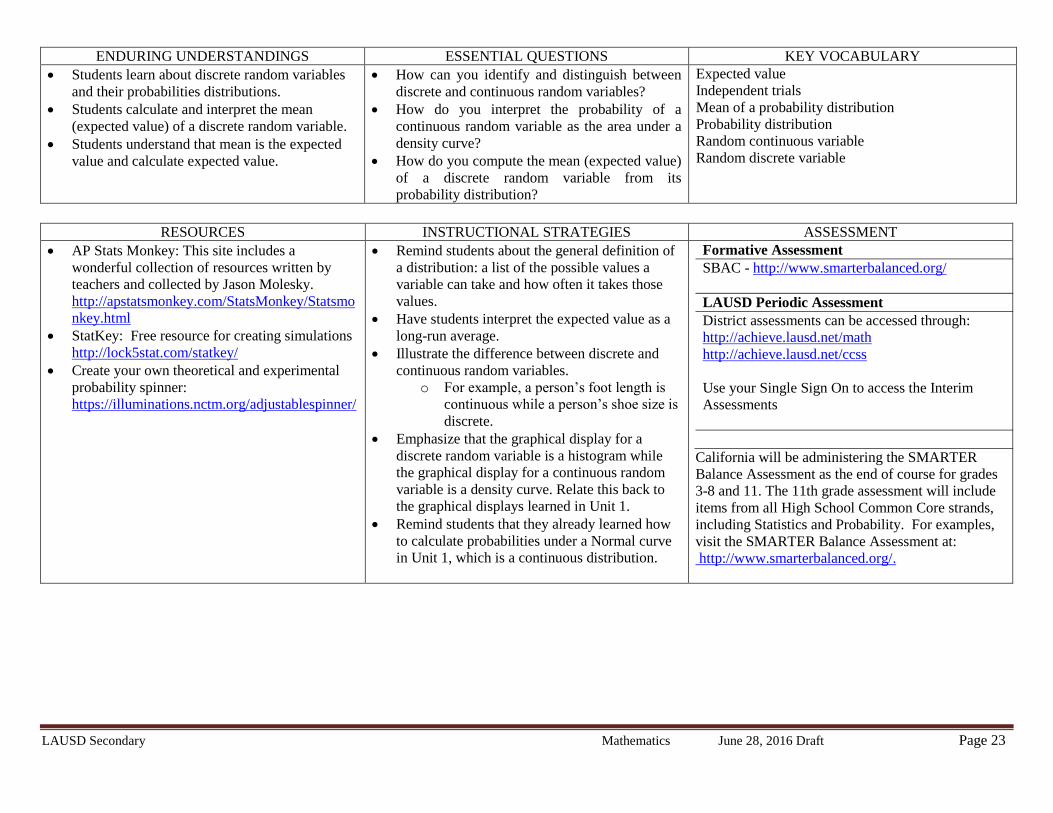
ENDURING UNDERSTANDINGS ESSENTIAL QUESTIONS KEY VOCABULARY
Students learn about discrete random variables
and their probabilities distributions.
Students calculate and interpret the mean
(expected value) of a discrete random variable.
Students understand that mean is the expected
value and calculate expected value.
How can you identify and distinguish between
discrete and continuous random variables?
How do you interpret the probability of a
continuous random variable as the area under a
density curve?
How do you compute the mean (expected value)
of a discrete random variable from its
probability distribution?
Expected value
Independent trials
Mean of a probability distribution
Probability distribution
Random continuous variable
Random discrete variable
RESOURCES INSTRUCTIONAL STRATEGIES ASSESSMENT
AP Stats Monkey: This site includes a
wonderful collection of resources written by
teachers and collected by Jason Molesky.
http://apstatsmonkey.com/StatsMonkey/Statsmo
nkey.html
StatKey: Free resource for creating simulations
http://lock5stat.com/statkey/
Create your own theoretical and experimental
probability spinner:
https://illuminations.nctm.org/adjustablespinner/
Remind students about the general definition of
a distribution: a list of the possible values a
variable can take and how often it takes those
values.
Have students interpret the expected value as a
long-run average.
Illustrate the difference between discrete and
continuous random variables.
o For example, a person’s foot length is
continuous while a person’s shoe size is
discrete.
Emphasize that the graphical display for a
discrete random variable is a histogram while
the graphical display for a continuous random
variable is a density curve. Relate this back to
the graphical displays learned in Unit 1.
Remind students that they already learned how
to calculate probabilities under a Normal curve
in Unit 1, which is a continuous distribution.
Formative Assessment
SBAC - http://www.smarterbalanced.org/
LAUSD Periodic Assessment
District assessments can be accessed through:
http://achieve.lausd.net/math
http://achieve.lausd.net/ccss
Use your Single Sign On to access the Interim
Assessments
California will be administering the SMARTER
Balance Assessment as the end of course for grades
3-8 and 11. The 11th grade assessment will include
items from all High School Common Core strands,
including Statistics and Probability. For examples,
visit the SMARTER Balance Assessment at:
http://www.smarterbalanced.org/.

LAUSD Secondary Mathematics June 28, 2016 Draft Page 24
LANGUAGE GOALS for low achieving, high achieving, students with disabilities and English Language Learners
Students will exchange ideas to determine how to calculate probabilities of events involving random variables.
Example: I think we should apply ____ principle in order to determine the correct probability.
Students will identify and interpret the expected value of a random variable.
Example: The expected value, _______, of _______ (random variable) is the long-run average value of X, distributed over a very large number of trials.
Students defend their decision by quantifying the probability and explaining in context.
Example: If I only guessed on a multiple-choice exam with ___ questions with ___ options, I would only have _____ probability of passing the exam.
PERFORMANCE TASK
In Roulette, 18 of the 38 spaces on the wheel are black. Suppose you decide to try your luck and bet $1 on black on the next 10 spins of a roulette wheel (recall
that if you win, you win $1, and if you lose, you lose $1). Let X = the number of times you hit black in 10 spins.
For each question, provide a mathematical path to your answer.
a) Find P(you win $2).
b) Find P(you lose money).
c) Find P(you win money).
DIFFERENTIATION
UDL/ FRONT LOADING ACCELERATION INTERVENTION
Statistics and Probability:
Use a simulation activity to demonstrate the
difference between an experimental and a
theoretical probability distribution.
o The website below allows you to create
your own spinner.
https://illuminations.nctm.org/adjustablespi
nner/
Review how to calculate a weighted average and
make the connection to the expected value of a
discrete random variable.
Acceleration for high achieving students:
Teach the binomial and geometric
distributions and how to calculate
probabilities using these distributions.
Teach students how to determine
whether the conditions for the Normal
approximation to a binomial
distribution are met.
Show students how to calculate the
mean (expected value) and standard
deviation for sums and differences of
independent random variables.
Re-emphasize the definition of
probability and the basic probability
rules.
Emphasize the idea of a sample space
and how listing all possible outcomes
may be helpful in creating a probability
distribution.
o e.g. Show students how to create
a sample space when rolling two
different number cubes.

LAUSD Secondary Mathematics June 28, 2016 Draft Page 25
Statistics and Probability – UNIT 5
Making Inferences and Justifying Conclusions
Introduction: Instructional time will be spent on making inferences and justifying conclusions based on simulations. Students will simulate sampling distributions
to estimate a population proportion or mean and develop the concept of margin of error. Students will use these simulated sampling distributions to make decisions
whether differences between parameters are significant.
CLUSTER COMMON CORE STATE STANDARDS
Make inferences and justify
conclusions from statistical studies.
HSS.IC.B.4
Use data from a sample survey to estimate a population mean or proportion; develop a margin of error through the use of
simulation models for random sampling.
HSS.IC.B.5
Use data from a randomized experiment to compare two treatments; use simulations to decide if differences between
parameters are significant.
MATHEMATICAL PRACTICES LEARNING PROGRESSIONS
1. Make sense of problems and
persevere in solving them.
2. Reason abstractly and quantitatively.
3. Construct viable arguments and
critique the reasoning of others.
4. Model with mathematics.
5. Use appropriate tools strategically.
6. Attend to precision.
7. Look for and make use of structure.
8. Look for and express regularity in
repeated reasoning.
Statistics and Probability Progression
http://commoncoretools.me/wp-content/uploads/2012/06/ccss_progression_sp_hs_2012_04_21_bis.pdf

LAUSD Secondary Mathematics June 28, 2016 Draft Page 26
ENDURING UNDERSTANDINGS ESSENTIAL QUESTIONS KEY VOCABULARY
Students understand simulation of random
behavior and how to simulate a sampling
distribution.
Students understand the Central Limit Theorem.
Students understand confidence intervals and
critical values.
Students construct and interpret a confidence
interval for a population proportion or a
population mean.
Students learn how to calculate and interpret the
margin of error.
Students learn to estimate a population
proportion and mean.
Students learn to write hypotheses and make
decisions based on the results of a simulation.
Students learn to interpret Type I and Type II
errors in context, and give the consequences of
each.
What is the purpose of a confidence interval?
How does the Central Limit Theorem apply to
sampling distributions?
How do you construct and interpret a confidence
interval?
What are the factors that affect the margin of
error of a confidence interval?
How do you estimate a population proportion or
a population mean?
What is the difference between a null and
alternate hypothesis?
How do you interpret a simulation in order to
make a decision about a hypothesis?
What is statistical significance?
After making a conclusion, what types of error
could be made?
How do you describe Type I and Type II errors
in context?
Alternate hypothesis
Central Limit Theorem
Confidence interval
Confidence level
Critical values
Hypothesis testing
Margin of error
Null hypothesis
P-value
Sample proportion
Sample test statistics
Sampling distributions
Standard error of the mean
Statistical significance
Type I error
Type II error
RESOURCES INSTRUCTIONAL STRATEGIES ASSESSMENT
Confidence interval applet:
http://bcs.whfreeman.com/tps5e/
StatKey (lock5stat.com/statkey): Create
sampling distributions to analyze confidence
intervals and p-values more efficiently
Statistical Reasoning in Sports, Tabor, J &
Franklin, C.
Workshop Statistics: Discovery with Data, 4th
ed., Rossman, A & Chance, B.
Statistics Through Applications, 2nd ed.,
Starnes, Yates, & Moore.
What Is Happening in This Class? (WIHIC):
Student questionnaire
http://www.chemeng.ntua.gr/courses/ped2/files/
WIHIC.pdf
Incorporate various activities into this unit.
Since the students will be making inferences
only through a simulation-based approach, be
sure to allow the students to work with data in a
hands-on manner as often as possible. For
example, you may have the students use coins,
dice, cards, or spinners to create an approximate
sampling distribution. Then, you may use
technology (Fathom, Statkey, etc.) to re-create a
sampling distribution with a large number of
trials. Students will be more likely to understand
the idea of a p-value and a margin of error after
participating in numerous hands-on simulations
in class.
When writing hypotheses, emphasize that the
null hypothesis is usually a statement of “no
Formative Assessment
SBAC - http://www.smarterbalanced.org/
LAUSD Periodic Assessment
District assessments can be accessed through:
http://achieve.lausd.net/math
http://achieve.lausd.net/ccss
Use your Single Sign On to access the Interim
Assessments
California will be administering the SMARTER
Balance Assessment as the end of course for grades
3-8 and 11. The 11th grade assessment will include

LAUSD Secondary Mathematics June 28, 2016 Draft Page 27
RESOURCES INSTRUCTIONAL STRATEGIES ASSESSMENT
Against All Odds:
https://www.learner.org/resources/series65.html
Rossman Chance Applet collection
(http://www.rossmanchance.com/applets/index.
html): Reeses Pieces Applet for sampling
distributions
AP Stats Monkey: This site includes a
wonderful collection of resources written by
teachers and collected by Jason Molesky.
http://apstatsmonkey.com/StatsMonkey/Statsmo
nkey.html
effect” or “no difference.” Also, emphasize that
the hypotheses are always stated in terms of a
parameter, not in terms of the statistic that is
collected.
A single estimate of a population parameter is
called a “point estimate” since it represents a
single point on the number line.
Help students understand that the margin of
error in a confidence interval accounts for
variability due only to random selection or
random assignment; it does not compensate for
any bias in the data collection process.
Help students make connections between the
formulas in this unit and previously learned
formulas (mean, standard deviation, z-score,
etc.).
Provide students with sentence frames to help
them interpret confidence intervals and
confidence level.
When students write the conclusion to a
simulation question, emphasize that the answer
is always an approximation.
items from all High School Common Core strands,
including Statistics and Probability. For examples,
visit the SMARTER Balance Assessment at:
http://www.smarterbalanced.org/
LAUSD Secondary Mathematics June 28, 2016 Draft Page 28
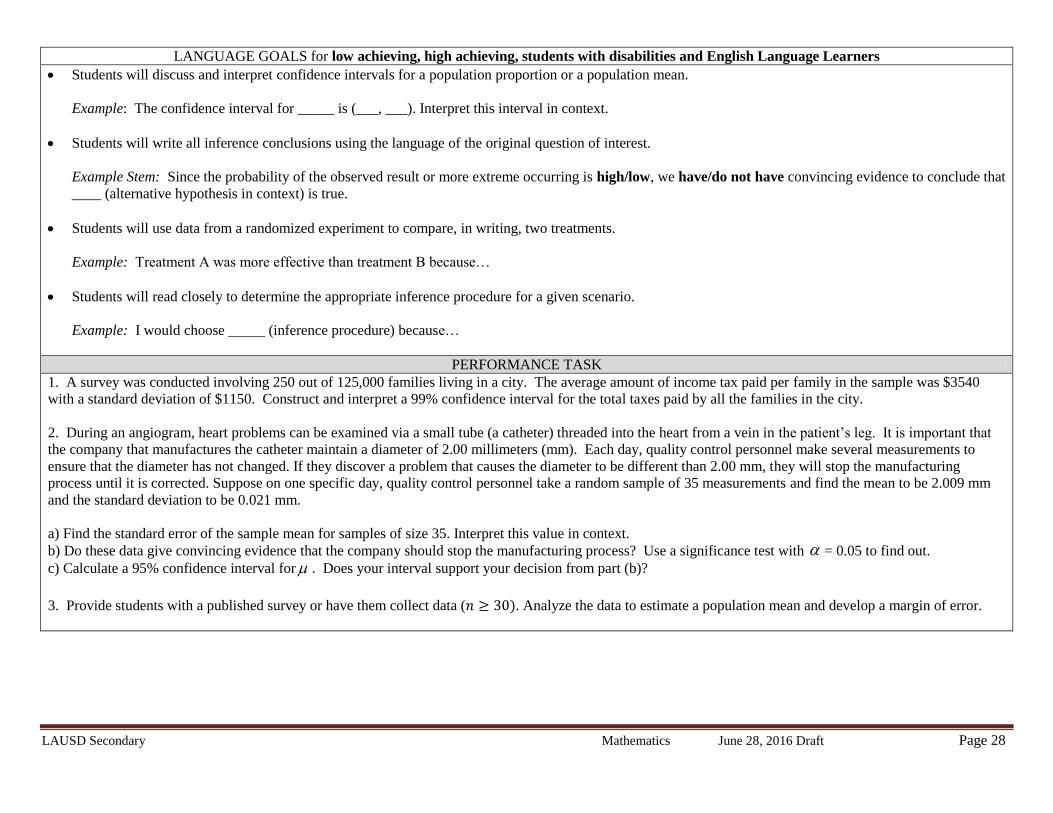
LANGUAGE GOALS for low achieving, high achieving, students with disabilities and English Language Learners
Students will discuss and interpret confidence intervals for a population proportion or a population mean.
Example: The confidence interval for _____ is (___, ___). Interpret this interval in context.
Students will write all inference conclusions using the language of the original question of interest.
Example Stem: Since the probability of the observed result or more extreme occurring is high/low, we have/do not have convincing evidence to conclude that
____ (alternative hypothesis in context) is true.
Students will use data from a randomized experiment to compare, in writing, two treatments.
Example: Treatment A was more effective than treatment B because…
Students will read closely to determine the appropriate inference procedure for a given scenario.
Example: I would choose _____ (inference procedure) because…
PERFORMANCE TASK
1. A survey was conducted involving 250 out of 125,000 families living in a city. The average amount of income tax paid per family in the sample was $3540
with a standard deviation of $1150. Construct and interpret a 99% confidence interval for the total taxes paid by all the families in the city.
2. During an angiogram, heart problems can be examined via a small tube (a catheter) threaded into the heart from a vein in the patient’s leg. It is important that
the company that manufactures the catheter maintain a diameter of 2.00 millimeters (mm). Each day, quality control personnel make several measurements to
ensure that the diameter has not changed. If they discover a problem that causes the diameter to be different than 2.00 mm, they will stop the manufacturing
process until it is corrected. Suppose on one specific day, quality control personnel take a random sample of 35 measurements and find the mean to be 2.009 mm
and the standard deviation to be 0.021 mm.
a) Find the standard error of the sample mean for samples of size 35. Interpret this value in context.
b) Do these data give convincing evidence that the company should stop the manufacturing process? Use a significance test with = 0.05 to find out.
c) Calculate a 95% confidence interval for . Does your interval support your decision from part (b)?
3. Provide students with a published survey or have them collect data ( . Analyze the data to estimate a population mean and develop a margin of error.

LAUSD Secondary Mathematics June 28, 2016 Draft Page 29
DIFFERENTIATION
UDL/ FRONT LOADING ACCELERATION INTERVENTION
Statistics and Probability:
As an opening activity to help demonstrate
the concept of sampling distributions is to
take a large population of pennies and have
the students take SRSs of size 1, 5, and 20
and find the sample mean year for each
sample. Have the students plot the
distributions on three different chart papers.
This should also help demonstrate the
Central Limit Theorem.
Review the differences between a sample
and a population, and a statistic and a
parameter.
Acceleration for high achieving students:
Students further their study in inference by
learning specific hypothesis tests (z-test, t-
test) and how to utilize a graphing calculator
to run each test.
Discuss inferences for categorical data (chi-
square) and for the slope of a regression
line.
Discuss different transformations to achieve
linearity (power, log, etc.).
Remind students that the sampling distribution
of a statistic tells us the possible values of the
statistic and how likely they are to occur.
Remind students that parameters are fixed, and
that there is nothing “special” about one
confidence interval (i.e. the one sample that was
taken may not even capture the parameter).
Emphasize that, when conducting a hypothesis
tests, an outcome that would rarely occur if a
claim were true is good evidence that the claim
is false. This may help students better
understand the idea of a significance level.
References:
1. National Governors Association Center for Best Practices, Council of Chief State School Officers. (2010). Common Core State Standards (Mathematics).
Washington D.C.: National Governors Association Center for Best Practices, Council of Chief State School Officers.
2. Mathematics Assessment Resource Service, University of Nottingham. (2007 - 2012). Mathematics Assessment Project. Retrieved from
http://map.mathshell.org/materials/index.php.
3. Smarter Balanced Assessment Consortium. (2012). Smarter Balanced Assessments. Retrieved from http://www.smarterbalanced.org/.
4. Partnership for Assessment of Readiness for College and Career. (2012). PARCC Assessments. Retrieved from http://www.parcconline.org/parcc-
assessment.
5. California Department of Education. (2013). Draft Mathematics Framework Chapters. Retrieved from
http://www.cde.ca.gov/be/cc/cd/draftmathfwchapters.asp.
6. National Council of Teachers of Mathematics (NCTM) Illuminations. (2013). Retrieved from http://illuminations.nctm.org/Weblinks.aspx.
7. Progressions for the Common Core State Standards in Mathematics (draft). Retrieved from http://commoncoretools.me/wp-
content/uploads/2012/06/ccss_progression_sp_hs_2012_04_21_bis.pdf.