overview of the phase i market ken getz tufts csdd; ciscrp october, 2010
Post on 22-Dec-2015
214 views
TRANSCRIPT

Overview of the Phase I Market
Ken GetzTufts CSDD; CISCRP
October, 2010

Agenda
• Overview of the Drug Development Landscape
• The Phase I Market
• Key Market Trends
• Optimization Opportunities
2

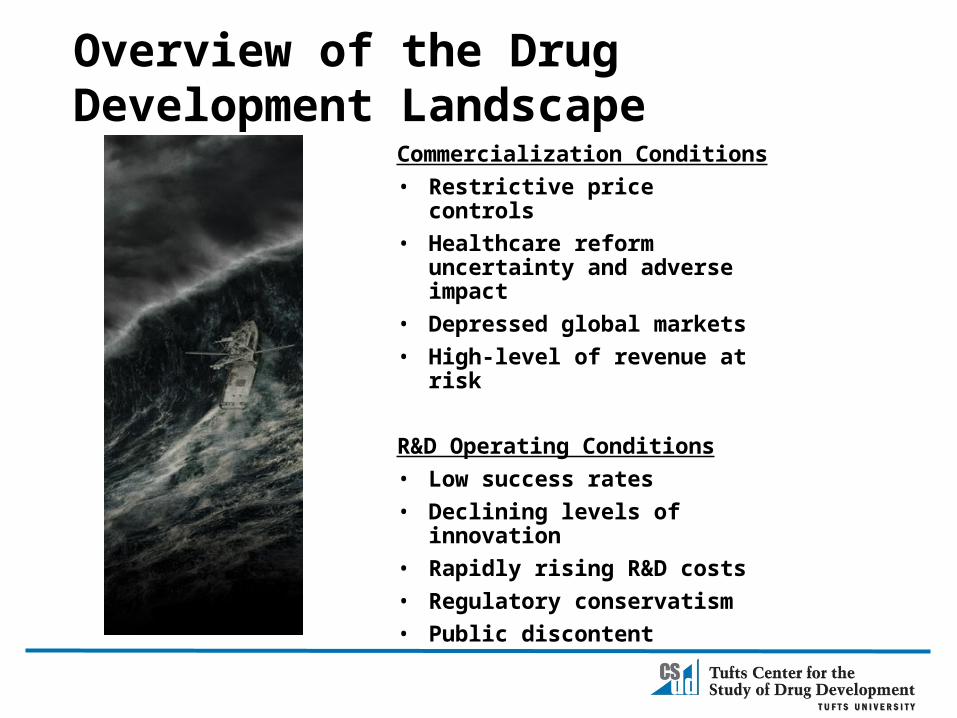
Commercialization Conditions• Restrictive price controls• Healthcare reform uncertainty
and adverse impact• Depressed global markets• High-level of revenue at risk
R&D Operating Conditions• Low success rates• Declining levels of innovation• Rapidly rising R&D costs• Regulatory conservatism• Public discontent
Overview of the Drug Development Landscape
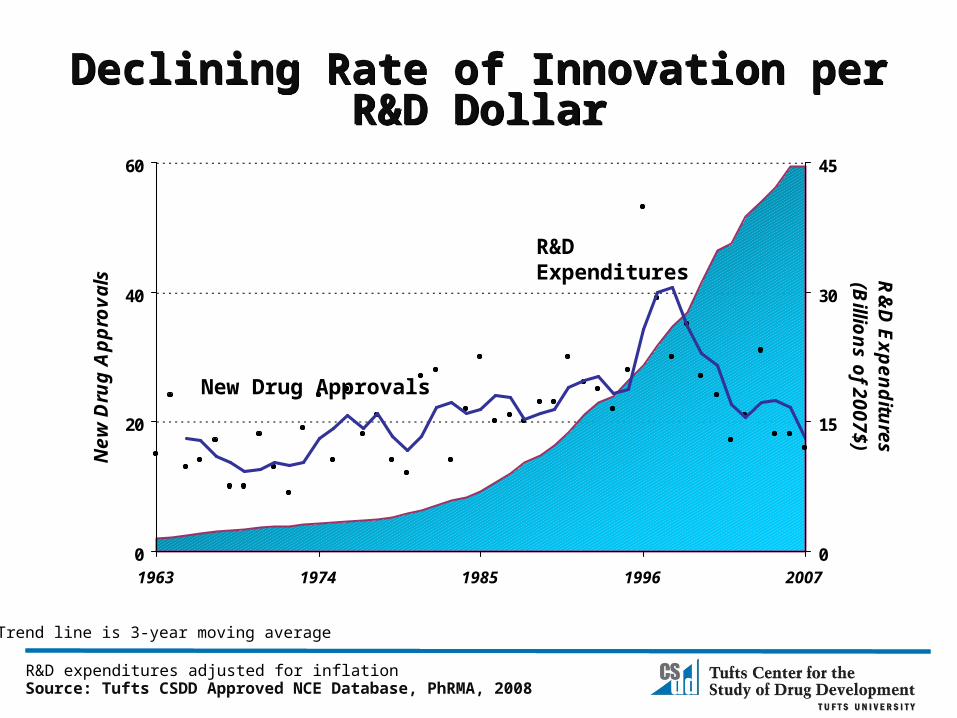
Declining Rate of Innovation per R&D DollarDeclining Rate of Innovation per R&D Dollar
0
20
40
60
1963 1974 1985 1996 2007
Ne
w D
rug
Ap
pro
va
ls
0
15
30
45
R&
D E
xp
en
ditu
res
(Billio
ns
of 2
00
7$
)
Source: Tufts CSDD Approved NCE Database, PhRMA, 2008R&D expenditures adjusted for inflation
R&D Expenditures
New Drug Approvals
* Trend line is 3-year moving average
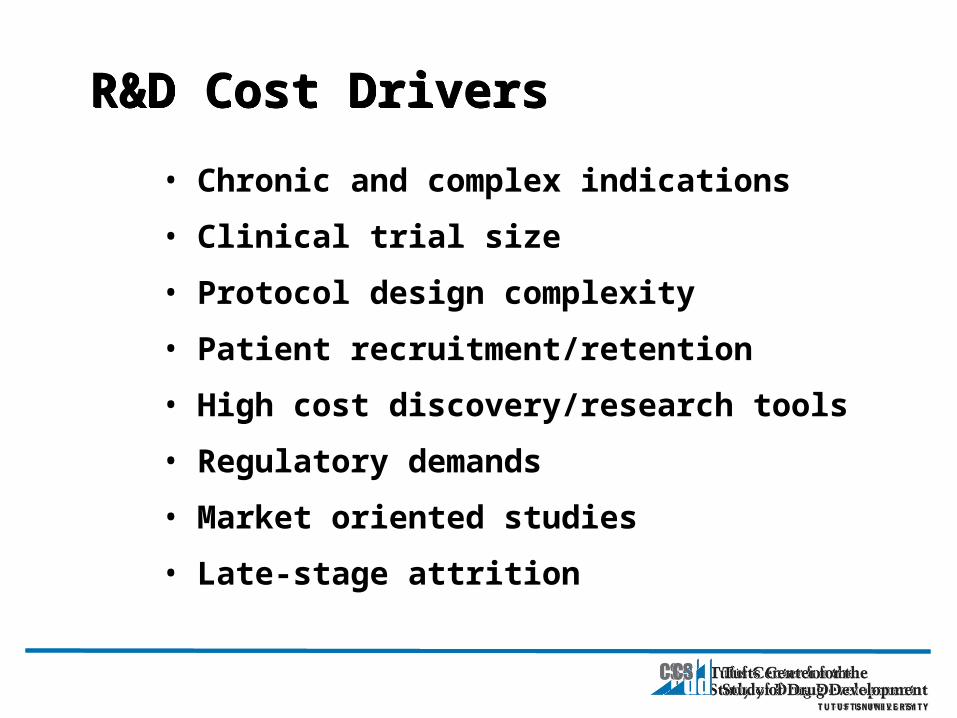
R&D Cost DriversR&D Cost Drivers
• Chronic and complex indications
• Clinical trial size
• Protocol design complexity
• Patient recruitment/retention
• High cost discovery/research tools
• Regulatory demands
• Market oriented studies
• Late-stage attrition
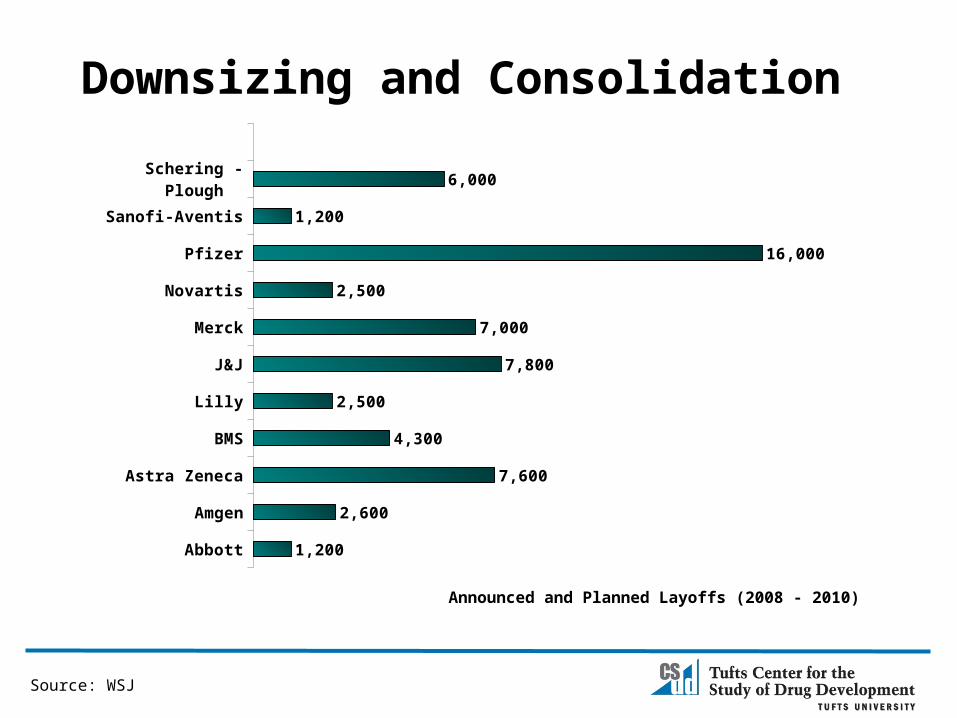
Downsizing and Consolidation
Abbott
Amgen
Astra Zeneca
BMS
Lilly
J&J
Merck
Novartis
Pfizer
Sanofi-Aventis
Schering - Plough
1,200
2,600
7,600
4,300
2,500
7,800
7,000
2,500
16,000
1,200
6,000
Source: WSJ
Announced and Planned Layoffs (2008 - 2010)
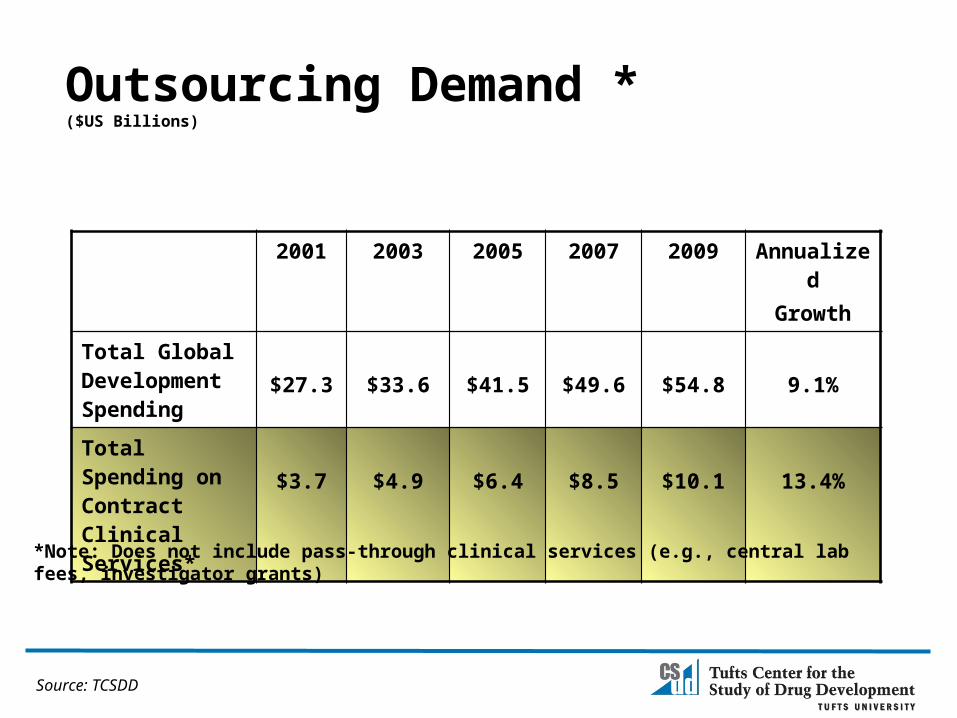
2001 2003 2005 2007 2009 AnnualizedGrowth
Total Global Development Spending
$27.3 $33.6 $41.5 $49.6 $54.8 9.1%
Total Spending on Contract Clinical Services*
$3.7 $4.9 $6.4 $8.5 $10.1 13.4%
Outsourcing Demand * ($US Billions)
*Note: Does not include pass-through clinical services (e.g., central lab fees, investigator grants)
Source: TCSDD


Distribution of FDA-Regulated Investigators
86%77%
62%53%
9%
10%
13%
14%
5%13%
25%33%
Rest of World Western Europe US-Based
* US and W European sites 50%+ more expensive
* Enroll two-thirds as many subjects as rest of world
Percent of Total1572s Filed
Sources: Tufts CSDD
20011997 2005 2009

11
Protocol Complexity
Phase I Phase II Phase III Phase IV
Unique Procedures (mean) 30.3 29.2 28.4 26.4Growth in Unique Procedures 35.10% 35.60% 42.1% 63.20%
Total Procedures (mean) 221.8 156.3 147.5 93.9Growth in Total Procedures 13.40% -1.30% 10.9% -2.4%
Total Work Burden (mean) 58.4 43.4 43.1 28.4 Growth in Total Work Burden 70.20% 32.80% 59.7% 58.10%
Note: Growth rates reflect the change in mean values of protocols in 2000-2003 and 2004-2007.
Source: Tufts CSDD

Total Global Phase I SpendingUS $ in Billions
2002 2004 2006 2008 2010P $-
$2,000,000,000
$4,000,000,000
$6,000,000,000
$8,000,000,000
$10,000,000,000
$12,000,000,000
$3,300,000,000.0
$5,800,000,000.0
$7,000,000,000.0
$10,300,000,000.0$10,500,000,000.0
Billi
ons o
f US
$
Source: Parexel Sourcebook
CAGR 15.6%
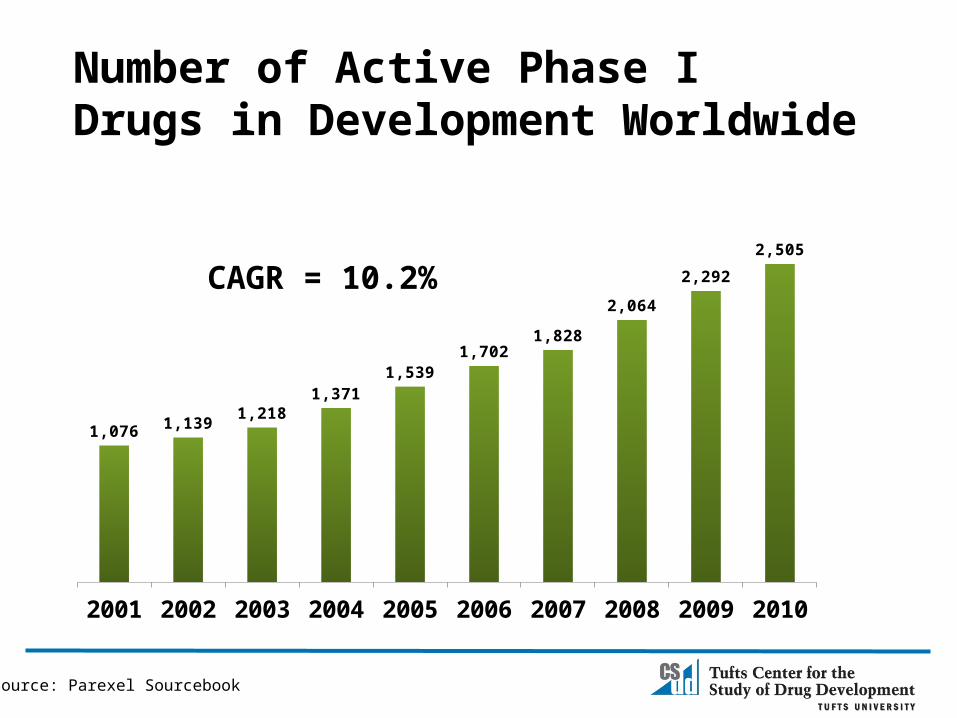
Number of Active Phase I Drugs in Development Worldwide
2001 2002 2003 2004 2005 2006 2007 2008 2009 2010
1,076 1,139 1,218
1,371 1,539
1,702 1,828
2,064
2,292
2,505
CAGR = 10.2%
Source: Parexel Sourcebook
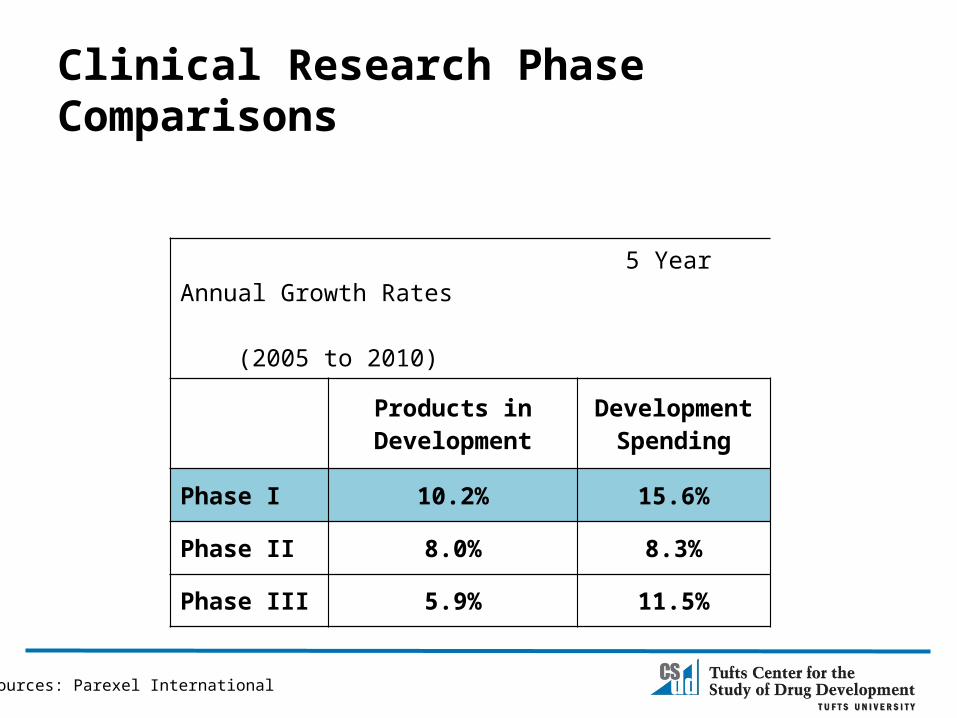
Clinical Research Phase Comparisons
5 Year Annual Growth Rates (2005 to 2010)
Products inDevelopment
Development Spending
Phase I 10.2% 15.6%
Phase II 8.0% 8.3%
Phase III 5.9% 11.5%
Sources: Parexel International

Development Pipeline by Phase
2002 2004 2006 2008 20100%
20%
40%
60%
80%
100%
34% 36% 39% 40% 42%
Phase IIIPhase IIPhase I
Source: Parexel International

Active Phase I Drugs by Major TA
Therapeutic Area 2003 2007 2010
Oncology 204 340 386
Immunologics 45 112 162
Digestive System Drugs 65 120 147
Endocrine System Drugs 57 93 115
Anti-Infectives 75 96 112
Vaccines & Antidotes 70 122 105
Cardiovascular System Drugs 45 67 83
Analgesics & Anti-Inflammatory Agents 47 99 82
Bone, Cartilage, Connective Tissue System Drugs 49 69 74
Psychotropics & Neuroleptics 36 67 60
Respiratory System Drugs 28 66 57
Dermatomucosal System Drugs 12 44 45
Motor System Drugs 18 29 28
Source: IMS R&D Focus
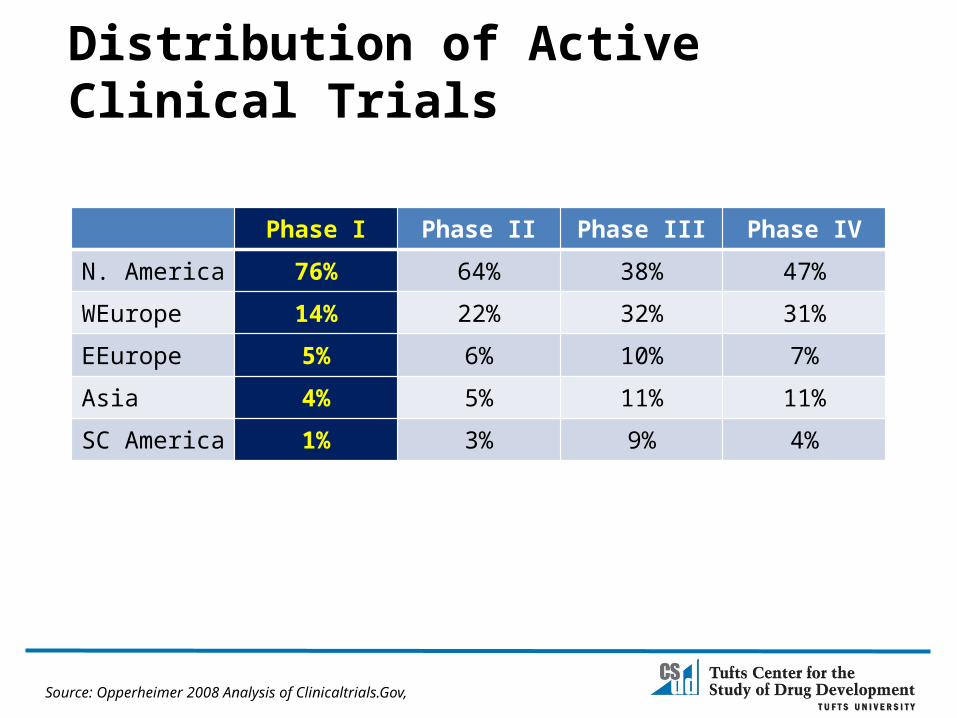
Distribution of Active Clinical Trials
Phase I Phase II Phase III Phase IV
N. America 76% 64% 38% 47%
WEurope 14% 22% 32% 31%
EEurope 5% 6% 10% 7%
Asia 4% 5% 11% 11%
SC America 1% 3% 9% 4%
Source: Opperheimer 2008 Analysis of Clinicaltrials.Gov,
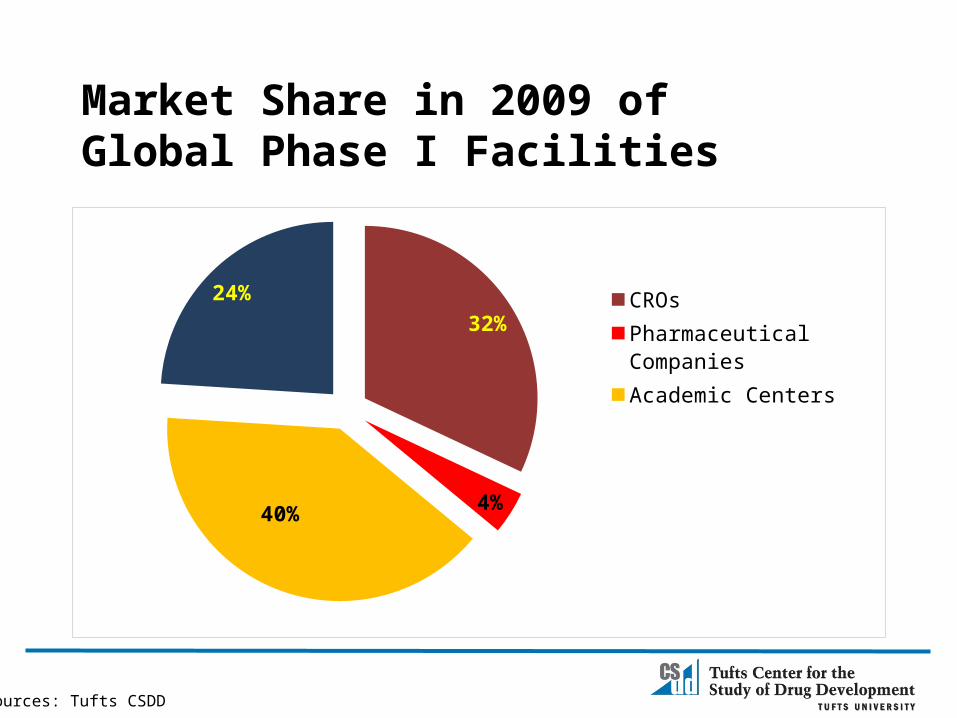
Market Share in 2009 of Global Phase I Facilities
32%
4%40%
24% CROsPharmaceutical CompaniesAcademic CentersCommunity-based sites
Sources: Tufts CSDD
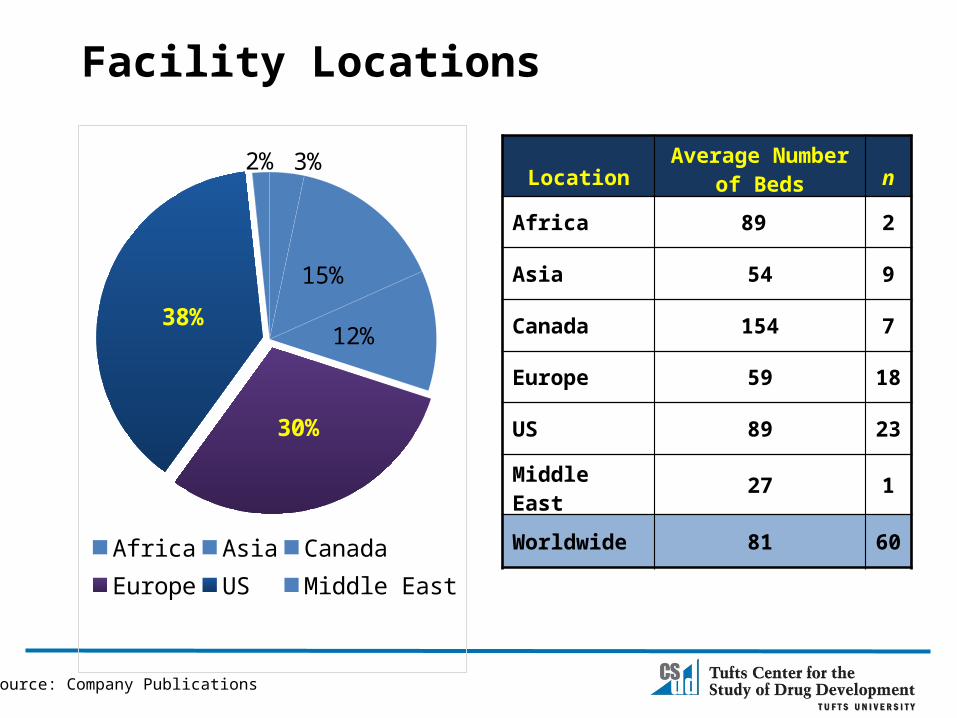
Facility Locations
3%
15%
12%
30%
38%
2%
Africa Asia CanadaEurope US Middle East
Source: Company Publications
LocationAverage Number
of Beds n
Africa 89 2
Asia 54 9
Canada 154 7
Europe 59 18
US 89 23
Middle East 27 1
Worldwide 81 60
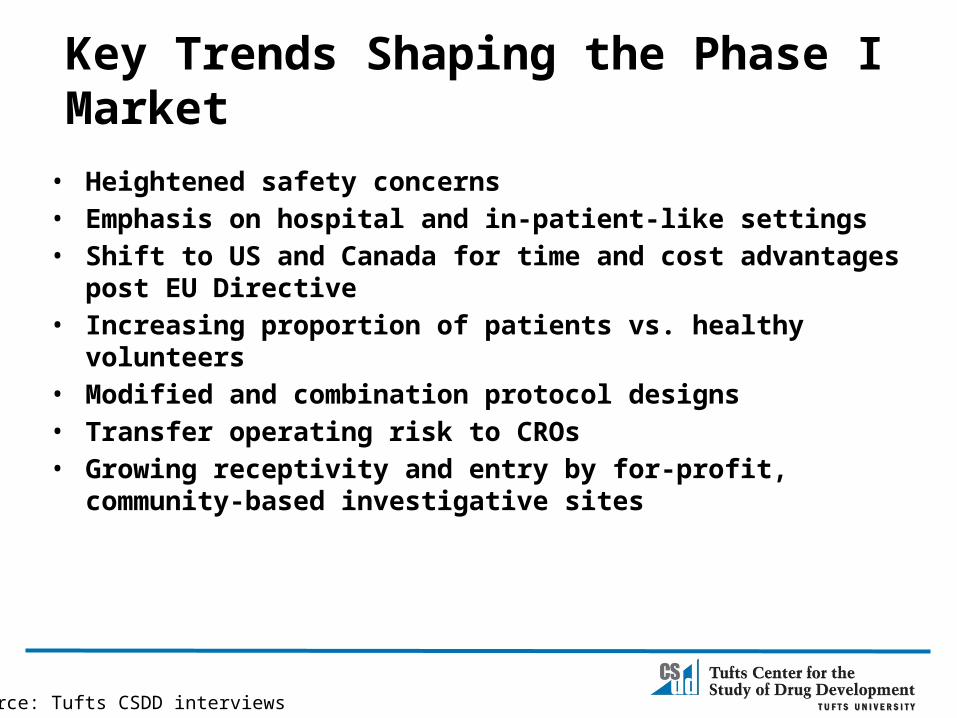
Key Trends Shaping the Phase I Market
• Heightened safety concerns• Emphasis on hospital and in-patient-like settings• Shift to US and Canada for time and cost advantages post EU Directive• Increasing proportion of patients vs. healthy volunteers• Modified and combination protocol designs• Transfer operating risk to CROs• Growing receptivity and entry by for-profit, community-based
investigative sites
Source: Tufts CSDD interviews
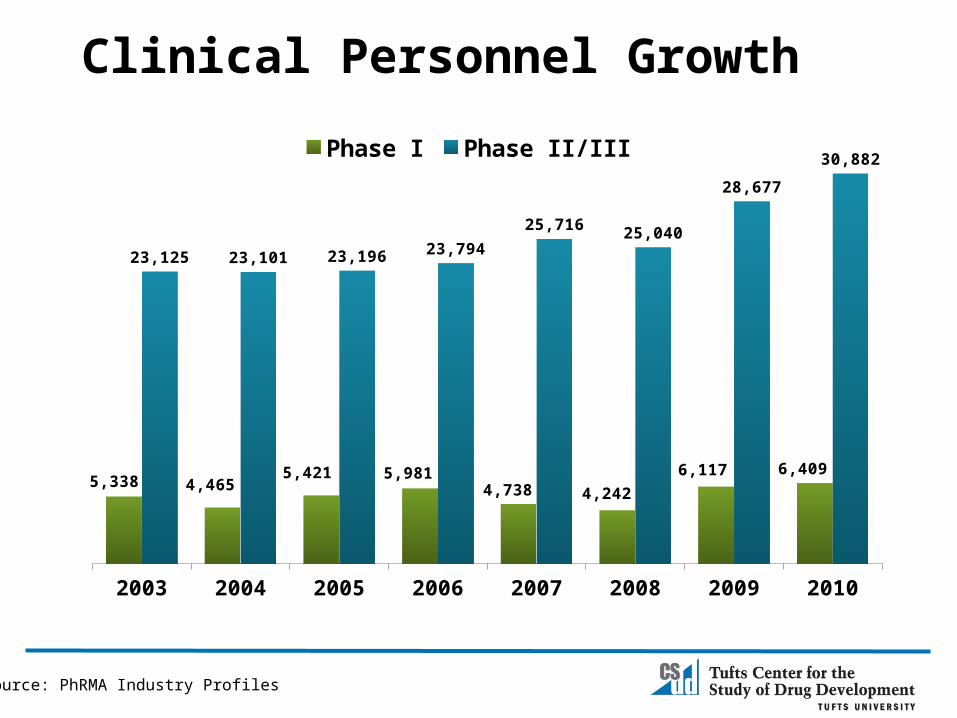
Source: PhRMA Industry Profiles
Clinical Personnel Growth
2003 2004 2005 2006 2007 2008 2009 2010
5,338 4,4655,421 5,981
4,738 4,2426,117 6,409
23,125 23,101 23,196 23,79425,716 25,040
28,677
30,882Phase I Phase II/III
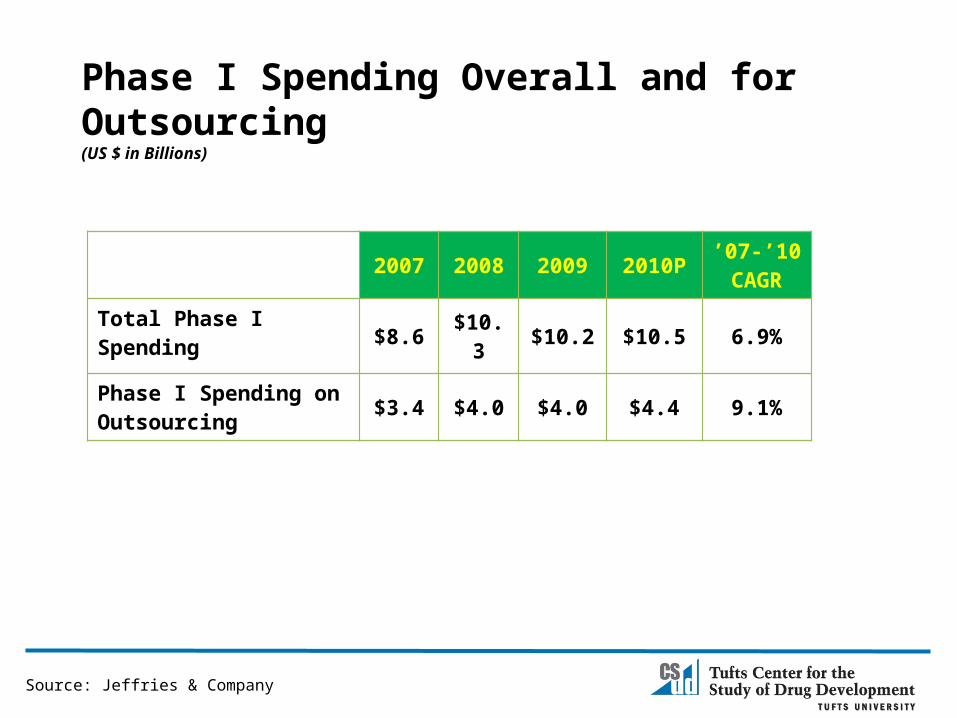
Phase I Spending Overall and for Outsourcing(US $ in Billions)
2007 2008 2009 2010P ’07-’10 CAGR
Total Phase I Spending$8.6 $10.3 $10.2 $10.5 6.9%
Phase I Spending on Outsourcing $3.4 $4.0 $4.0 $4.4 9.1%
Source: Jeffries & Company
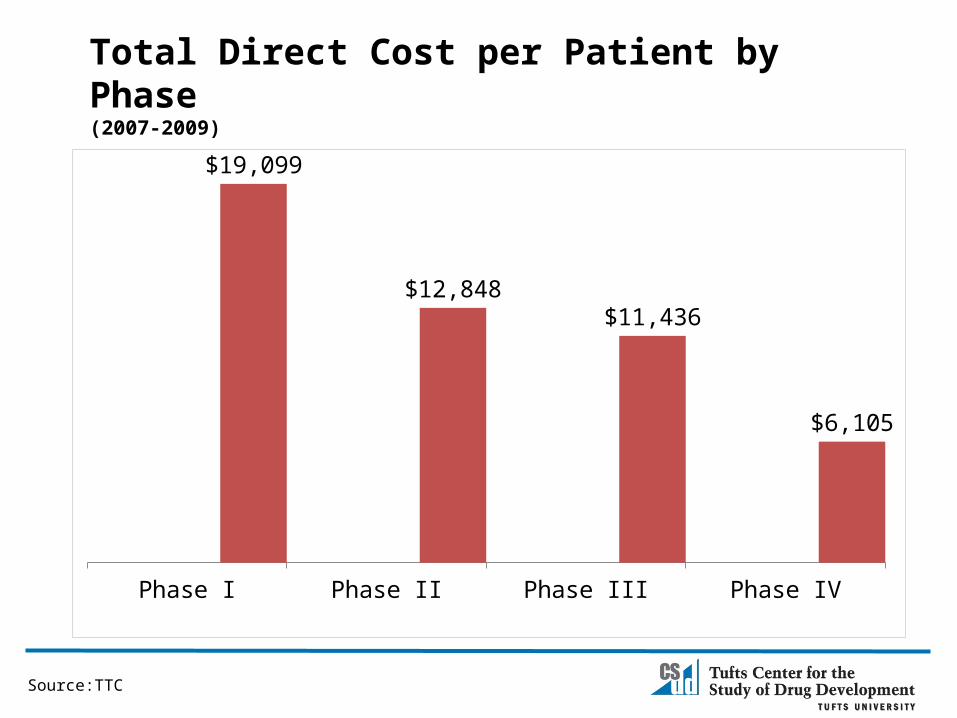
Total Direct Cost per Patient by Phase(2007-2009)
Phase I Phase II Phase III Phase IV
$19,099
$12,848 $11,436
$6,105
Source:TTC

Two Optimization Opportunities
25
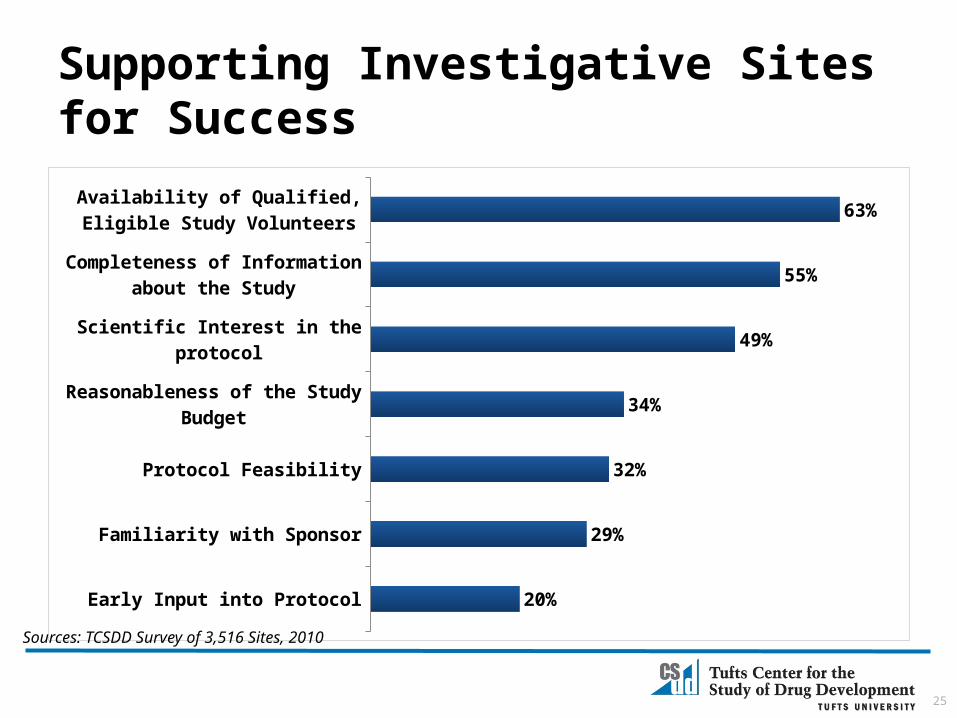
Supporting Investigative Sites for Success
Early Input into Protocol
Familiarity with Sponsor
Protocol Feasibility
Reasonableness of the Study Budget
Scientific Interest in the protocol
Completeness of Information about the Study
Availability of Qualified, Eligible Study Volunteers
20%
29%
32%
34%
49%
55%
63%
Sources: TCSDD Survey of 3,516 Sites, 2010

1991 Committee on Competitiveness
o Pharmaceutical and Biotechnology industries are national treasures
o Most innovative and productive relative to other R&D-intensive industries
o Saves lives and lowers the burden of health care costs
o Most financially healthy (robust revenue and profit)
o Major contributor to the economy
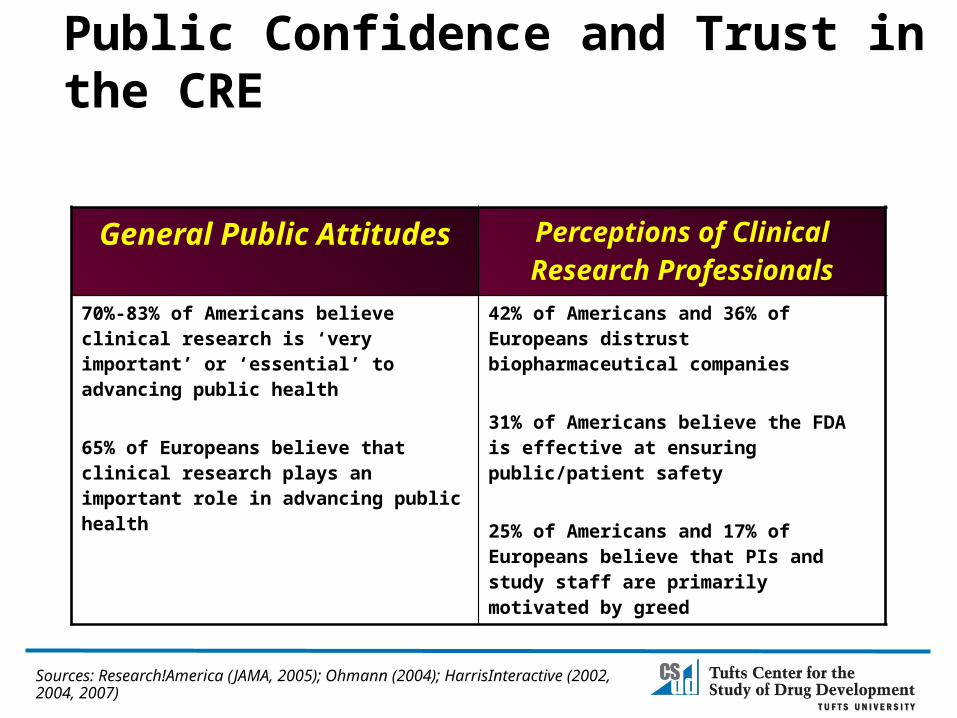
Public Confidence and Trust in the CRE
General Public Attitudes Perceptions of Clinical Research Professionals
70%-83% of Americans believe clinical research is ‘very important’ or ‘essential’ to advancing public health
65% of Europeans believe that clinical research plays an important role in advancing public health
42% of Americans and 36% of Europeans distrust biopharmaceutical companies 31% of Americans believe the FDA is effective at ensuring public/patient safety
25% of Americans and 17% of Europeans believe that PIs and study staff are primarily motivated by greed
Sources: Research!America (JAMA, 2005); Ohmann (2004); HarrisInteractive (2002, 2004, 2007)
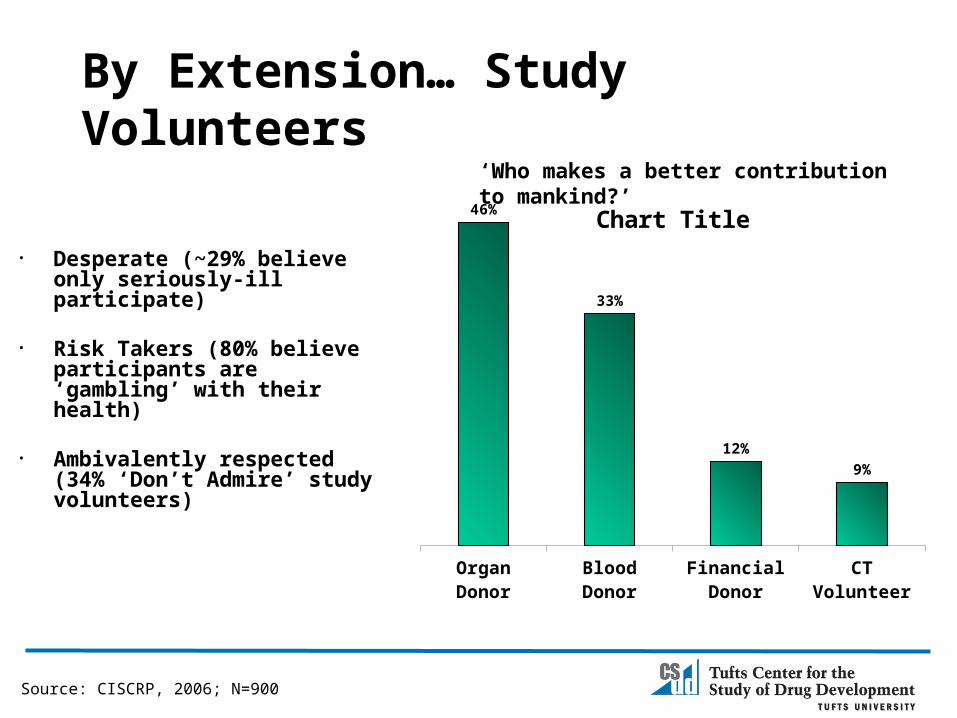
By Extension… Study Volunteers
Organ Donor Blood Donor Financial Donor
CT Volunteer
46%
33%
12%9%
Chart Title
‘Who makes a better contribution to mankind?’
Source: CISCRP, 2006; N=900
• Desperate (~29% believe only seriously-ill participate)
• Risk Takers (80% believe participants are ‘gambling’ with their health)
• Ambivalently respected (34% ‘Don’t Admire’ study volunteers)
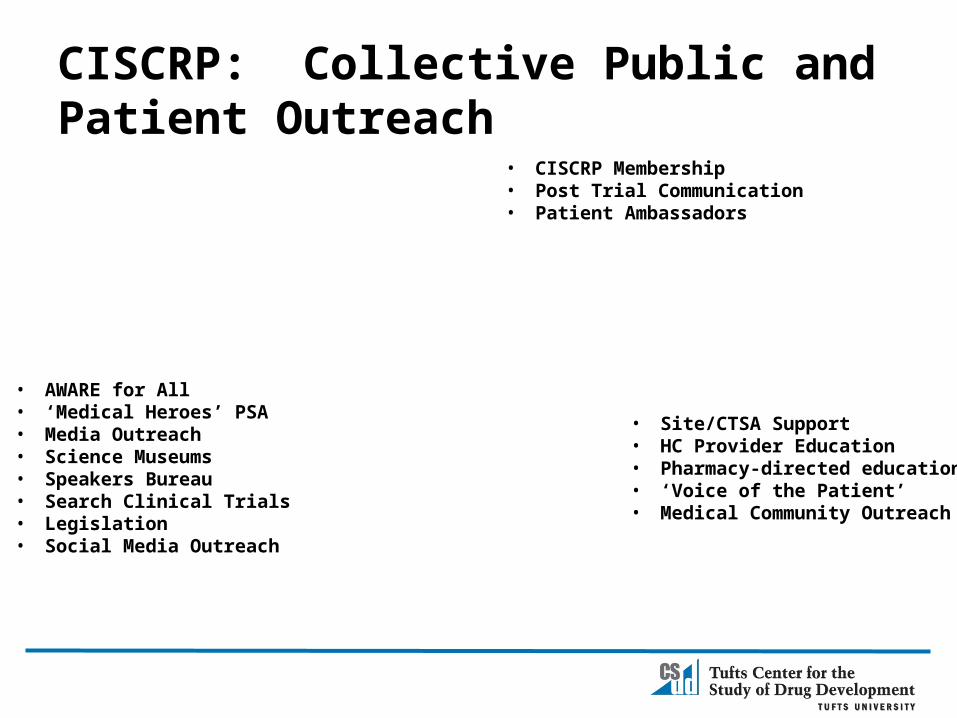
CISCRP: Collective Public and Patient Outreach
• AWARE for All• ‘Medical Heroes’ PSA• Media Outreach• Science Museums• Speakers Bureau• Search Clinical Trials• Legislation• Social Media Outreach
• CISCRP Membership• Post Trial Communication• Patient Ambassadors
• Site/CTSA Support• HC Provider Education• Pharmacy-directed education• ‘Voice of the Patient’• Medical Community Outreach
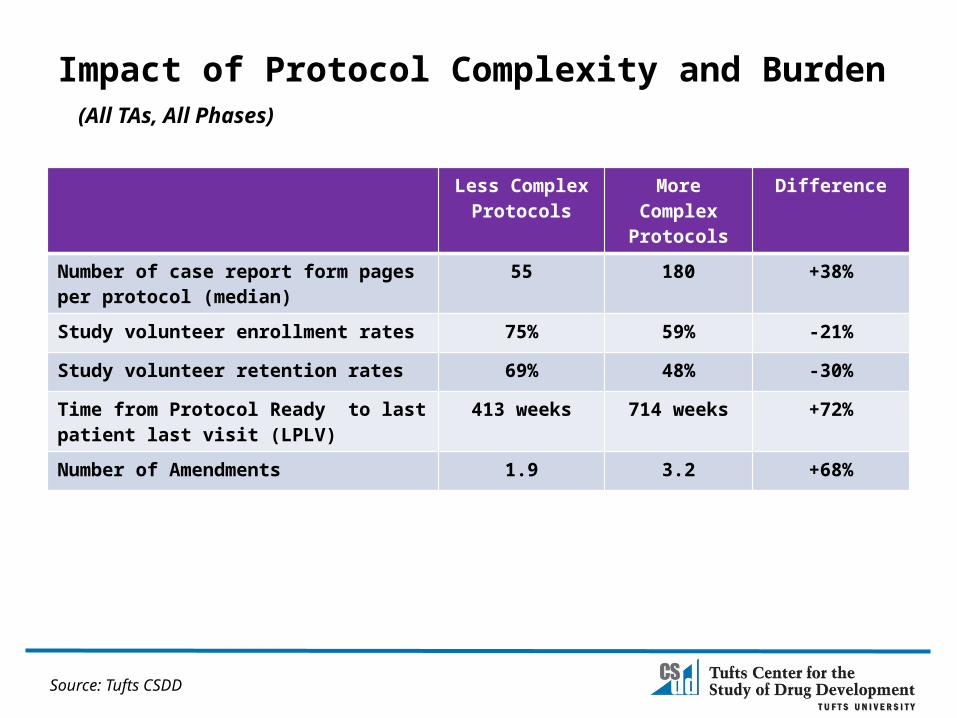
Impact of Protocol Complexity and Burden (All TAs, All Phases)
Less Complex Protocols
More Complex Protocols
Difference
Number of case report form pages per protocol (median)
55 180 +38%
Study volunteer enrollment rates 75% 59% -21%
Study volunteer retention rates 69% 48% -30%
Time from Protocol Ready to last patient last visit (LPLV)
413 weeks 714 weeks +72%
Number of Amendments 1.9 3.2 +68%
Source: Tufts CSDD
31
Conclusions
• Current drug development landscape necessitating major changes in how global clinical research will be conducted
• Phase I market an area of unprecedented change and opportunity to improve drug development performance and efficiency– Volume of activity– Economics– Structure
• Opportunities to improve Phase I success– Patient/public outreach and education– Protocol design simplification

Ken GetzSenior Research Fellow, Assistant Professor
Tufts CSDD, Tufts Medical School617-636-3487, [email protected]
Founder and Board ChairCISCRP
617-725-2750, [email protected]
THANK YOU!