overview of the united states healthcare system
TRANSCRIPT

This country spends over twice as much on health care per person as other developed countries. While the U.S. health-care system does some things well, it ranks at or near the bottom on important health outcome measures such as life expectancy, infant mortality, and adult obesity rates.2 Even though the federal government establishes the nation’s health-care goals through initiatives such as Healthy People 2020, the lack of coordination within the healthcare system means that all parts of the system are not working together to achieve these goals.3
The lack of a unified healthcare system makes it dif-ficult to provide a straightforward overview of how health-care services are delivered and financed. For example, the various players in the provision and delivery of health care include:
Educational institutions such as medical, dental, nurs-•ing, and physician assistant programs.Research organizations including private entities, pub-•lic agencies, and non-profit foundations.Private suppliers of goods and services such as hospital •equipment manufacturers, home health agencies, and uniform suppliers.Private health insurance provided through employers, •on the individual market, and, in the future, through state health exchanges.Public health insurance programs such as Medicaid, •Medicare, and Tri-Care (the Department of Defense healthcare program for members of the uniformed services and their families).
LEARNING OBJECTIVES
By the end of this chapter, you will be able to:
Identify the key players who provide and finance health care • in the United States
Identify common characteristics of the uninsured•
Understand the effect of insurance on access to care and on • health status
Identify barriers to accessing health care•
Understand concerns regarding the quality of health care • provided in the United States
Describe differences in how health care is delivered in various • countries
IntroductIonCoordinated. Efficient. Cost-effective. Goal-oriented. These are words one might use to describe a well-functioning system. Unfortunately, they are not words that are often used when discussing how healthcare services are delivered in the United States. Unlike most other developed nations, the United States does not have a unified healthcare system. Even with the pas-sage of the 2010 Patient Protection and Affordable Care Act (ACA), the first major health reform law passed in this country in nearly 50 years, the United States will continue to provide healthcare services through a patchwork of public and private insurance plans; federal, state, and local governments; and institutions and individual providers who are often uncon-nected to one other.1
The United States has never been accused of providing healthcare services in an efficient or cost-effective manner.
Overview of the United States Healthcare System
chapter 4

provided and what can be done to improve the quality of care?). It is also helpful to consider the health system choices made by this country against those made by other devel-oped countries. This chapter begins with a discussion of the concepts of finance, access, and quality and then turns to a comparative overview of how other countries have designed their healthcare systems.
HealtHcare FInanceIn 2009, the United States spent $2.5 trillion on aggregate healthcare spending, the equivalent of $8,086 per person and 17.6% of the nation’s Gross Domestic Product (GDP). Figure 4-1 shows present and projected national health expenditures as a percentage of GDP. This represents a 4% increase over 2008 spending, a relatively modest increase as compared to recent years.4 Although there has been a slowdown in spend-ing growth, national health expenditures are expected to aver-age 6.3% growth from 2009–2019 and reach 19.6% of the GDP by 2019.5 Put differently, come 2019, one-fifth of the nation’s economy will be consumed by healthcare spending. This is nothing short of staggering.
As shown in Figure 4-2, the largest portion of national healthcare spending in 2009 was on hospital services, fol-lowed by physician and clinical services. While experts dis-agree about the exact cause of healthcare spending growth,
Individual providers such as physicians, dentists, phar-•macists, and physical therapists.Institutional providers such as hospitals, community •health centers, and skilled nursing facilities.Private trade associations representing providers (e.g., •the American Medical Association, which represents physicians), institutions (e.g., the National Associa-tion of Community Health Centers), and industries (e.g., PhARMA, which represents the pharmaceutical industry).Private accreditation agencies that provide quality cer-•tifications to healthcare institutions.Consumers of healthcare goods and services.•Local, state, and federal government agencies that have •roles in delivering care, financing care, setting health policy, developing laws and regulations, and conduct-ing and funding research.
In the absence of a unified system or single government program to describe, it is easiest to understand the provision of U.S. health care through the concepts of finance (how do individuals pay for health care and how are providers reim-bursed for their services?), access (how do individuals access healthcare services and what barriers to access exist?), and quality (what is the quality of healthcare services that are
FIgure 4-1 National Health Expenditures as a Percentage of Gross Domestic Product, 1960–2020.
25
20
15
10
5
0
Per
cen
t
1960 1965 1970 1975 1980 1985 1990 1995 2000 2005 2010 2015 2020
5.2 5.97.2
8.19.1
10.4
12.513.7 13.8
15.917.7
18.9
21.3
Projected
Source: The Commonwealth Fund. Data: Centers for Medicare and Medicaid Service, The Lewin Group.
46 chapter 4 Overview of the United States Healthcare System

Health Insurance
While most people in the United States have health insurance, one of the main goals of the ACA was to decrease the num-ber of uninsured people. By 2019, it is projected that 92.7% of the population will be insured, up from the 83.3% that were insured prior to passage of the ACA.5 Having health insur-ance reduces the risk of financial ruin when expensive health services are needed and often provides coverage for preventive services at low or no cost. As discussed below in the section on healthcare access, individuals without health insurance must pay for services themselves, find services provided at no cost, or go without care.
As shown in Figure 4-3, most people in the United States are privately insured and obtain their health insur-ance through their employer. Employer-sponsored insurance plans may be self-funded (meaning employers set aside funds to pay for their employees’ health insurance claims instead of paying a premium to a health insurance carrier) or fully in-sured (meaning employers pay a premium to a private health insurance company to administer their plans and pay the healthcare claims of the employees). Another significant por-tion of the population is publically insured through Medicaid,
commonly discussed factors include spending on state-of-the-art technology and new prescription drugs, the cost of providing care for an increasing number of patients with chronic diseases, an aging population, and high administra-tive costs (while there is not one set definition of adminis-trative costs, it could cover costs for marketing, billing, and medical underwriting).6
With many ACA provisions taking effect in 2014, health-care spending is projected to grow by 9.2% that year. Private health expenditures are expected to increase by 12.8% in 2014, as an estimated 16 million previously uninsured people will sign up for health insurance through the new state health in-surance exchanges. In addition, 22 million people are expected to enroll for the first time in Medicaid or the Children’s Health Insurance Program (CHIP), resulting in projected spending growth of 17.4% for these two public programs in 2014. Medi-care’s annual projected growth rate is 6.2% from 2009–2019, which is lower than the other growth rates due to cost reduc-tions brought about by the ACA. Private out-of-pocket spend-ing is expected to decline in 2014 and then increase to 9.6% by 2018, reflecting a likely increase in patient cost-sharing as employers scale back their health plans to avoid paying taxes on high-cost insurance plans.5
FIgure 4-2 Distribution of National Health Expenditures by Type of Service, 2009.
Hospital Care 30.5%
Other Health Spending 15.9%
Other PersonalHealth Care 14.9%
Home Health Care 2.7%
Nursing Home Care 5.5%
Prescription Drugs 10.1%Physician/ClinicalServices 20.3%
Note: Other Personal Healthcare Spending includes dental and other professional health services, durable medical equipment, etc. Other Health Spending includes administration and net cost of private health insurance, public health activity, research, structures and equipment, etc.Source: Kaiser Family Foundation calculations using NHE data from Centers for Medicare and Med-icaid Services, Office of the Actuary, National Health Statistics Group, at http://www.cms.hhs.gov / NationalHealthExpendData/ (See Historical; National Health Expenditures by type of service and source of funds, CY 1960–2009; file nhe2009.zip).
HealthCare Finance 47

insurance company and/or the patient for providing services covered under the plan, may accept consumers who are enrolled in the plan, may be subject to plan quality-control measures, and will participate as necessary in plan appeals processes.
direct Services Programs
In addition to providing publically funded health insurance to certain populations through programs such as Medicare and Medicaid, federal, state, and local governments also fund numerous programs that directly provide healthcare services to vulnerable populations. Many of these programs also re-ceive private funding and donations to support their opera-tions. Direct service programs generally exist to fill gaps in the private healthcare delivery system. Examples of these types of programs include:
Federally Qualified Health Centers: Also known as •FQHCs, these centers are located in medically un-derserved areas and provide primary care services to individuals on a sliding fee scale (meaning that how much one pays for services depends on the individual’s income level). While anyone may use an FQHC, the health center patient population is made up of mostly uninsured and publically insured patients. Funding for health centers usually comes from the federal and state governments, and sometimes from local governments and private donations.
CHIP, Medicare, the Veteran’s Administration, and the De-partment of Defense. Public programs are funded and run by federal and/or state government agencies, depending on the program.
As shown in Figure 4-4, health insurers act as an in-termediary between consumers (sometimes referred to as “insureds”) and providers (which refers to both individual providers, such as physicians or nurses, as well as institu-tions, such as hospitals and community health centers). The specifics regarding eligibility for a particular insurance plan, choice of plans, how much a plan costs to enroll in or use, what benefits are covered, and how and how much providers are reimbursed varies by plan or government program. In some circumstances, providers may only accept insurance from a single plan, but often providers will accept patients from a variety of plans.
Consumers interact with health insurance companies or government programs by enrolling into an insurance plan by which they are accepted (in the case of private plans) or for which they are eligible (in the case of public programs), pro-viding payments to the insurance plan for being enrolled (ei-ther directly or through a payroll deduction), choosing which provider to see based on plan restrictions or incentives, and working with the plan if they have questions or complaints. Providers that agree to be part of a plan’s “network” (i.e., the group of providers who will see patients insured by the plan) are reimbursed a contractually agreed upon amount from the
FIgure 4-3 Health Insurance Coverage in the United States, 2009.
Uninsured 17%
Employer-SponsoredInsurance 49% Physician/Clinical
Services 17%
Uninsured 12%
Private Non-Group 5%
Note: Includes those over age 65. Medicaid/Other Public includes Medicaid, CHIP, other state programs, military-related coverage, and those enrolled in both Medicare and Medicaid (dual eligibles).Source: Kaiser Commission on Medicaid and the Uninsured and Urban Institute estimates based on the Census Bureau’s March 2010 Current Population Survey.
48 chapter 4 Overview of the United States Healthcare System
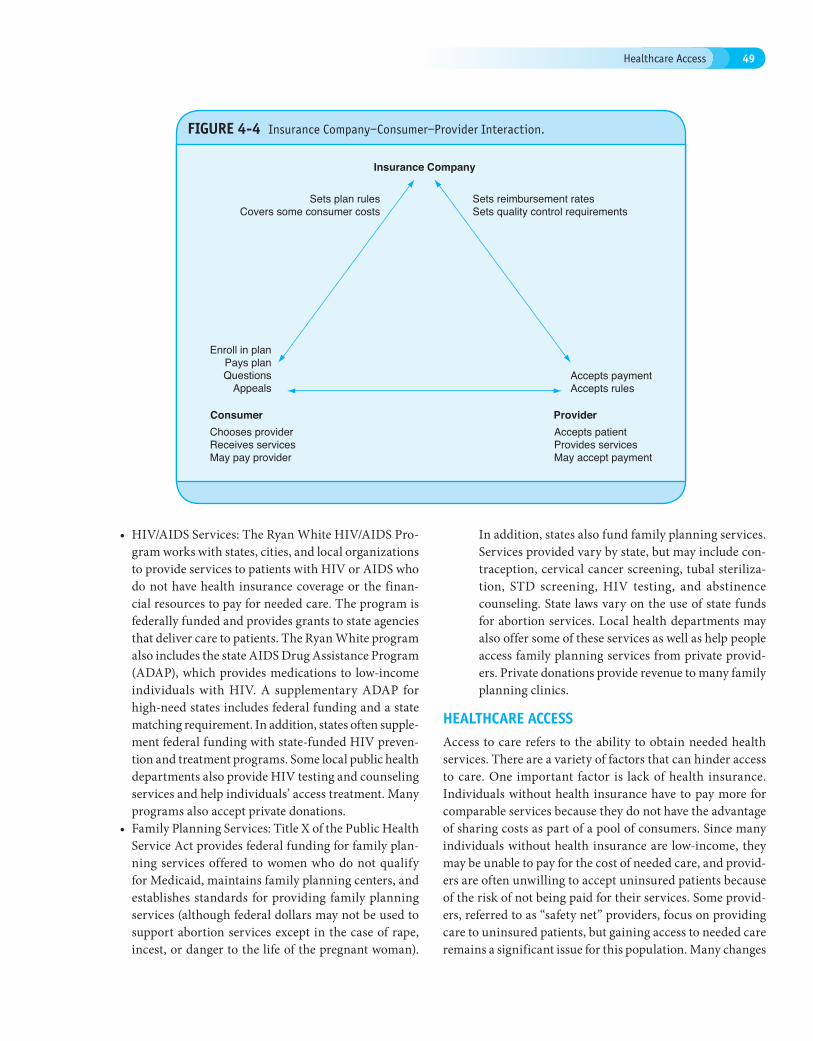
FIgure 4-4 Insurance Company–Consumer–Provider Interaction.
Insurance Company
Consumer
Accepts paymentAccepts rules
Sets reimbursement ratesSets quality control requirements
Enroll in planPays planQuestions
Appeals
Sets plan rulesCovers some consumer costs
Provider Accepts patientProvides servicesMay accept payment
Chooses providerReceives servicesMay pay provider
HIV/AIDS Services: The Ryan White HIV/AIDS Pro-•gram works with states, cities, and local organizations to provide services to patients with HIV or AIDS who do not have health insurance coverage or the finan-cial resources to pay for needed care. The program is federally funded and provides grants to state agencies that deliver care to patients. The Ryan White program also includes the state AIDS Drug Assistance Program (ADAP), which provides medications to low-income individuals with HIV. A supplementary ADAP for high-need states includes federal funding and a state matching requirement. In addition, states often supple-ment federal funding with state-funded HIV preven-tion and treatment programs. Some local public health departments also provide HIV testing and counseling services and help individuals’ access treatment. Many programs also accept private donations.Family Planning Services: Title X of the Public Health •Service Act provides federal funding for family plan-ning services offered to women who do not qualify for Medicaid, maintains family planning centers, and establishes standards for providing family planning services (although federal dollars may not be used to support abortion services except in the case of rape, incest, or danger to the life of the pregnant woman).
In addition, states also fund family planning services. Services provided vary by state, but may include con-traception, cervical cancer screening, tubal steriliza-tion, STD screening, HIV testing, and abstinence counseling. State laws vary on the use of state funds for abortion services. Local health departments may also offer some of these services as well as help people access family planning services from private provid-ers. Private donations provide revenue to many family planning clinics.
HealtHcare acceSSAccess to care refers to the ability to obtain needed health services. There are a variety of factors that can hinder access to care. One important factor is lack of health insurance. Individuals without health insurance have to pay more for comparable services because they do not have the advantage of sharing costs as part of a pool of consumers. Since many individuals without health insurance are low-income, they may be unable to pay for the cost of needed care, and provid-ers are often unwilling to accept uninsured patients because of the risk of not being paid for their services. Some provid-ers, referred to as “safety net” providers, focus on providing care to uninsured patients, but gaining access to needed care remains a significant issue for this population. Many changes
Healthcare Access 49

and affordable. Although this may be true in some cases, in most instances it is not. Furthermore, many people believe that all employers offer insurance or that those individu-als without private insurance are always eligible for public programs. As you will see, these and other assumptions are also false.
Income Level The primary reason people do not have health insurance is financial—available coverage is simply too expensive. Forty percent of the uninsured are people who earn an income below the Federal Poverty Level (FPL) and nine out of ten uninsured individuals earn less than 400% FPL (the poverty level for a family of four was $22,050 in 2010).7(p5) Given the correlation between income and being uninsured, it is not surprising that the uninsured rate among the poor is twice as high as the national average, as shown in Figure 4-5.
Employment Status Over 70% of the uninsured work or are in families with workers. Among this population, most of them (about 60%) have at least one full-time worker in the family, and a much smaller proportion have only part-time workers.7(p5) This pattern holds true even for the very poor.
taking place in 2014 as part of ACA implementation are in-tended to reduce the number of uninsured people, but even so it is important to understand the healthcare problems faced by the uninsured; before 2014, many millions of individuals will continue to be uninsured and several million will remain uninsured despite health reform. Even those with insurance face barriers to accessing care, as well. This may occur if in-dividuals are underinsured, if needed services are not covered by health insurance, if providers will not take a particular insurance plan, or if providers are not available in certain geographic area. Finally, access problems are exacerbated by provider shortages, especially in primary care fields. Many areas of the country already experience workforce shortages and the influx of newly insured individuals as a result of health reform will make this problem even more pronounced in the years to come.
the uninsured
Characteristics of the Uninsured
There are many myths relating to the uninsured. It is often assumed that the uninsured do not work or simply choose not to purchase health insurance even though it is available
FIgure 4-5 Uninsured Nonelderly vs. All Nonelderly, by Family Poverty Level, 2009.
34%
38%
18%
21%
10%
22%
29%
40%
400% +
200% – 399%
100% – 199%
Under 100%
All Nonelderly
50.0 million 264.7 million
Uninsured
Notes: Data may not total 100% due to rounding. The Federal Poverty Level for a family of four in 2009 was $22,050 (according to the U.S. Census Buerau’s poverty threshold). Family size and total family income are grouped by insurance eligibility.Source: Kaiser Commission on Medicaid and the Uninsured/Urban Institute analysis of 2010 ASEC Supplement to the CPS.
50 chapter 4 Overview of the United States Healthcare System

wage earner is a blue-collar worker are more likely to be un-insured than families whose primary wage earner is a white-collar worker.7(p17)
Age Because Medicaid and CHIP provide extensive coverage to low-income children, adults are more likely to be uninsured than children. In 2009, 7.5 million children were uninsured, compared to 43.2 million adults.10(p22–23) Approximately 30% of young adults (ages 18–24) are uninsured, which is nearly twice the rate of the general population10(p23) and which represents a trend that has remained in place since the mid-1980s.11
As young adults transition from school to the workforce, they may become ineligible for their family’s coverage for the first time, may have entry-level jobs earning too little income to afford a policy, or may work for an employer that does not offer health insurance. The ACA addresses part of this problem by requiring insurers to cover dependents (someone who relies on the primary insured for support) until age 26. Although some young adults do not consider health insurance
Forty percent of the poor uninsured has at least one worker in their family.7(p1) Workers are often uninsured because they cannot afford the cost-sharing associated with the insurance coverage offered by their employers or because they work in jobs that do not offer coverage.
From 1999 to 2009, the percentage of all companies of-fering health insurance declined from 66% to 60%.8(p38) Most employers who stop offering health insurance coverage do so because of cost, and the economic downturn between 2008 and 2010 played a major role in the decisions of many firms to drop coverage.8(p37) Furthermore, the unemployment rate jumped from 4.6% in 2007 to 10% in 2009, and job losses since 2008 have resulted in 6.9 million people losing their employer-sponsored coverage.7(pp8–9),9
Workers are more likely to be uninsured if they are em-ployed by small firms, low-paying firms, non-unionized firms, retail/sales firms, or in the agricultural, forestry, fishing, min-ing, and construction sectors. In addition, self-employed indi-viduals are often uninsured. Finally, families whose primary
FIgure 4-6 Characteristics of the Uninsured, 2009.
55– 6410%0–18
17%
19–3440%
35–5433%
251%–399% FPL, 13%400% FPL and above, 10%
100–250% FPL, 38%
<100% FPL, 49%
Part-time workers 16%
1 or more full-timeworkers 61%
No workers 23%
Age
Income
Total = 50.0 million uninsured
Work Status
The federal poverty level was $22,050 for a family of four in 2009. Data may not total 100% due to rounding. Source: KCMU/Urban Institute analysis of 2009 ASC Supplement to the CPS.
Healthcare Access 51

wage jobs, and higher rates of employment in sectors that are less likely to provide insurance.7(p6) Restrictive eligibility rules pertaining to immigrants in public programs make it diffi-cult for non-natives to obtain public coverage and, under the ACA, undocumented immigrants are not eligible for federal subsidies to assist with purchasing health insurance through the new state exchanges.
Gender Gender variations exist in both the rate and type of insurance coverage. In general, non-elderly men are more likely to be uninsured than non-elderly women. Yet, of those with insurance, men are more likely to have employer-based coverage and women are more likely to have public coverage, due to their lower average income level. This difference in public coverage rates is due, in large part, to the extensive coverage for low-income pregnant women under Medicaid.
Geography Residents of the South and West are more likely to be uninsured than residents of the North and Midwest, although in 2009, the greatest increase in the number of uninsured occurred in the Midwest.7(p7) Similarly, there are variations in the uninsured rate from state to state. These differences are based on numerous factors including racial/ethnic composition, other population characteristics, public program eligibility, and employment rates and sectors.11(p90) Although a greater number of uninsured residents live in urban areas, the likelihood of being uninsured is similar in urban and rural areas. Uninsurance is a particular problem among rural residents because they have relatively high healthcare needs—they tend to be older, poorer, and less healthy than urban residents—and there is often a provider shortage in these areas. Among the insured, rural residents rely more heavily on public programs due to their lower incomes and fewer opportunities to obtain employer-based coverage.
a priority expense because they are relatively healthy, studies have shown that cost is the primary factor in whether people in this age bracket decide to obtain coverage.11(pp73–74)
Although adults ages 55–64 are more likely to be insured than the overall population, the 10% of uninsured who fall into this age group are a cause for concern because they are medi-cally high-risk and often have declining incomes.11(p72) These adults account for two-thirds of all deaths and one-third of all hospital stays among non-elderly adults. In addition, they are more likely to report being in fair or poor health, having a chronic disease, or experiencing a disabling condition.11(p74) The disability provisions of Medicaid and Medicare and the availability of employer-based insurance keep the number of uninsured in this group relatively small, which is important because it would be very expensive for individuals in this de-mographic to purchase individual insurance policies in the private market. Figure 4-6 illustrates the characteristics of the uninsured by income, age, and work status.
Education Level Education level is also an important factor in insurance status because it is easier, for example, for college graduates to earn higher incomes and obtain jobs that provide affordable employment-based insurance as compared to less-educated individuals.11(p74) Over half of non-elderly uninsured adults do not have more than a high school education, and these individuals tend to be uninsured for longer periods of time than those with higher education levels.7(p6)
Race, Ethnicity, and Immigrant Status Although approximately half of the people who are uninsured are white, a greater proportion of minorities are uninsured. About 12% of non-Hispanic whites are uninsured, compared to 32% of Hispanics, 21% of African Americans, and 17% of Asian Americans.10(p23) This difference is only partially explained by variations in income. Minorities also have lower rates of employment-based coverage, although this is partially offset by their higher rates of public insurance coverage.11(p83) Because eligibility for public insurance coverage is generally less stable than for private coverage, this difference in type of coverage is a key public policy issue.11(p89)
Although most of the uninsured are native citizens, a higher proportion of immigrants are uninsured. Compared to the 14% of native-born citizens who are uninsured, 34% of for-eign-born residents are uninsured.10(p27) Of the foreign-born uninsured, 19% are naturalized and 46% are noncitizens.10(p27) Some of the disparity in coverage rates among U.S. native and foreign-born individuals is because non-native residents have lower rates of employer-based coverage, higher rates of low-
Box 4-1 Discussion Questions
Are the characteristics just described interrelated, or should they be addressed separately from a policy perspec-tive? If you are trying to reduce the number of uninsured, do you believe the focus should be on altering insurance programs or changing the effect of having one or more of these characteristics? Whose responsibility is it to reduce the number of uninsured? Government? The private sector? Individuals?
52 chapter 4 Overview of the United States Healthcare System

with better and timelier access to care, better chronic disease management, fewer emergency room visits, fewer lawsuits against emergency rooms, and increased cancer screenings for women.12,13 Unfortunately, the uninsured are much less likely to have a usual source of care than insured individu-als. Approximately 55% of the uninsured do not have a usual source of care, compared to 11% of publicly insured people and 10% of privately insured individuals.7(p10)
The uninsured are also less likely to follow treatment rec-ommendations and more likely to forgo care due to concerns about cost7(p10) (see Figure 4-7). In addition, the uninsured are less likely to receive preventive care and appropriate routine care for chronic conditions.7,9(p11) One result of this is that chil-dren without insurance are more likely to have developmental delays, often leading to difficulties in education and employ-ment. Also, quality of life may be lower for the uninsured due to their lower health status and anxiety about both monetary and medical problems.
Since the uninsured are less likely to obtain preventive care or treatment for specific conditions, they have a higher mortality rate overall, have a higher in-hospital mortality rate, and are more likely to be hospitalized for avoidable health problems.7(p11) Of course, without regular access to care, it is less likely that a disease will be detected early when treatment may be cheaper and more effective. For example, uninsured
The Importance of Health Insurance Coverage to Health Status
Having health insurance provides tangible health benefits. For a variety of reasons discussed in this section, having health insurance increases access to care and positively affects health outcomes. Conversely, the uninsured, who do not enjoy the benefits of health insurance, are more likely to experience ad-verse health events and a diminished health-related quality of life, and are less likely to receive care in appropriate settings or receive the professionally accepted standard of care.7(pp10–11)
Health insurance is an important factor in whether someone has a “medical home,” or consistent source of care. Having a consistent source of care is positively associated
Box 4-2 Discussion Questions
The Affordable Care Act, the 2010 health reform law, made it a priority to reduce the number of uninsured. At what point, if any, should the government step in to provide individuals with assistance to purchase insurance cover-age? Do you think such assistance should be a federal or state responsibility?
FIgure 4-7 Barriers to Health Care Among Nonelderly Adults, by Insurance Status, 2009.
No usual source of care55%
11%11%
Uninsured
Medicaid/Other public
Employer/Other private
No preventative care42%
6%6%
Went without neededcare due to cost*
26%9%
4%
Could not affordprescription drug*
27%13%
6%
Percent of adults (age 18–64) reporting
* In past 12 months.Respondents who said usual source of care was the emergency room were included among those not having a usual source of care.Source: KCMU analysis of 2009 NHIS data.
Healthcare Access 53

in the workforce stemming from the lower health status as-sociated with being uninsured. Productivity may be reduced when workers are absent or when they are not functioning at their highest level due to illness. In addition, several studies show that providing health insurance helps employers recruit better employees and that workers with health insurance are less likely to change jobs, reducing the costs of hiring and training new employees.15
the underinsured
An estimated 25 million individuals have insurance but are considered “underinsured,” a figure that increased 60% from 2003 to 2007.16 While there are disagreements about how to measure the underinsured, in general being underinsured means individuals do not have the financial means to cover the gap between what their insurance coverage pays for and the total cost of their medical bills. This problem is exacer-bated during a recession when more individuals cannot afford to pay their deductibles and co-payments. Like the uninsured, the underinsured may delay care or forgo treatment due to cost. Everyone ends up paying for the underinsured. Provid-ers attempt to shift the cost associated with the underinsured and uninsured to others who can afford to pay, including the government and insured individuals. Institutions such as hospitals may try to negotiate higher reimbursement for their services, which leads insurers to charge higher premiums to their clients to cover the additional costs.
Insurance coverage limitations
Even individuals with insurance coverage may face healthcare access problems due to coverage limitations. These limitations could include high levels of cost-sharing, reimbursement and visit caps for specific services, and service exclusions. (An-other problem—annual and lifetime dollar limits on cover-age—was eliminated by the ACA).
Cost-Sharing: A typical insurance plan includes pre-miums, deductibles, and co-payments (the latter can also be designed as co-insurance). A premium is an annual cost, typically charged monthly, for enrolling in a plan. For those with health insurance through their employer, the premium is often split between employer and employee. Figure 4-8 shows the increase in monthly premiums over the last decade. A deduct-ible is an amount the insured pays out-of-pocket before the insurance plan assists with the costs of healthcare services. There may be an annual deductible for the plan overall or separate deductibles for different types of services covered by the plan, such as in-patient care,
cancer patients are diagnosed at later stages of the disease and die earlier than insured cancer patients.14(p3) Studies have estimated that overall, having health insurance could reduce mortality rates for the uninsured by 10–15%, resulting in 18,000 fewer deaths per year.14(p3)
Ways to Assess the Cost of Being Uninsured
There are several ways to think about the costs of being un-insured. These costs include the health status costs to the uninsured individual, as discussed above; financial cost to the uninsured individual; financial cost to state and federal governments and to private insurers; financial cost to provid-ers; productivity costs from lost work time due to illness; and costs to other public priorities that cannot be funded because of the resources spent on providing care to the uninsured.
The financial burden of being uninsured is significant. Although on average the uninsured spend fewer dollars on health care than the insured, those without insurance spend a greater proportion of their overall income on medical needs. Furthermore, when the uninsured receive care, it is often more expensive because the uninsured are not receiving care as part of an insurance pool with leverage to negotiate lower rates from providers. Given their lower income, relatively high healthcare expenses, and competing needs, those with-out insurance are three times as likely as the insured to find basic necessities unaffordable due to medical bills they have accumulated.7(p12)
Costs of medical care provided by, but not fully reim-bursed to, health professionals are referred to as uncompen-sated care costs. In 2008, it was estimated that uncompensated care costs reached $57 billion in this country, with federal, state, and local spending covering 75% of the tab, mostly through “disproportionate share payments” to hospitals. Al-though hospitals provide about 60% of all uncompensated care services and receive significant government assistance, most of the uncompensated care provided by non-hospital physicians is not subsidized.7(p14)
Every dollar spent by providers, governments, and com-munities to cover uncompensated care costs is a dollar that is not spent on another public need. There are a variety of high-cost public health needs, such as battling infectious diseases like tuberculosis, engaging in emergency preparedness plan-ning, and promoting healthy behaviors. Public and private funds used to cover uncompensated care, especially when the care is more expensive than necessary because of the lack of preventive care or early interventions, are resources that are no longer available to meet the country’s other health needs.
One final cost associated with the uninsured is the cost of lower productivity. This refers to the reduced productivity
54 chapter 4 Overview of the United States Healthcare System

the other hand, charged a $1,132 deductible for the first 60 days of hospitalization in 2011. Most private insur-ance plans have a cost-sharing arrangement for hospital admissions—either a co-payment, co-insurance, or a per day fee. On average, private plans charge 18% for co-insurance, a $232 co-payment per admission, or $228 per day for hospital admissions.8(p.101) Medicare benefi-ciaries do not pay a per diem for the first 60 days in a hospital, but then pay $283 per day for the next three months.17 This fee increases for longer stays.
Reimbursement and Visit Caps: Insurance plans may limit the amount they will reimburse for a specific service during the year, with patients responsible for costs that exceed dollar amount limits. In addition, plans may limit the number of times a patient may see a certain type of provider during the year. Visit caps vary by insurance plan. For example, the Blue Cross Blue Shield Standard PPO option for the Fed-eral Employee Health Benefit Plan (FEHBP) limits physical, occupational, and speech therapy to 75 visits per year and chiropractic services to one office visit and 12 spinal manipulations per year.18 The Kaiser Permanente Standard HMO option for the FEHBP limits annual outpatient physical therapy to 30 office
out-patient care, and prescription drug coverage. Co-payments refer to a specific dollar amount that patients pay when they receive services or drugs. For example, one might have a $15 co-payment to see a primary care provider for an office visit. Co-insurance refers to a percentage of service cost that patients pay when they receive services or drugs. For example, an insured might have a 20% co-insurance requirement to see a primary care provider for an office visit. If the visit cost $150, a 20% co-insurance requirement would cost $30. Co-payment and co-insurance amounts may vary depending on the service received.
Cost-sharing requirements can vary widely by plan and plan type. Some plans do not have general deduct-ibles, and for those with general deductibles the amount varies significantly. For example, in 2010 the average deductible for a single worker in a high-deductible health plan was $1,093, while the average for a single worker in a Health Maintenance Organization plan was $610.8(p98) An increasing number of plans have deductibles of $1,000 or more (see Figure 4-9).
Variation also exists for service-specific deductibles. For the few private plans with an in-patient hospital de-ductible, the average amount is $723.8(p.101) Medicare, on
FIgure 4-8 Average Annual Worker and Employer Contributions to Premiums and Total Premiums for Family Coverage, 1999–2010.
1999 $4,247$1,543 Worker contribution
Employer contribution2000 $4,819$1,619
2001 $5,269$1,787
2002 $5,866$2,137
2003 $6,657$2,412
2004 $7,289$2,661
2005 $8,167$2,713
2006 $8,508$2,973
2007 $8,824$3,281
2008 $9,325$3,354
2009 $9,860$3,515
2010 $9,773$3,997
$0 $2,000 $4,000 $6,000 $8,000 $10,000 $12,000 $14,000
* Estimate is statistically different from estimate for the previous year shown (p <.05).Source: Kaiser/HRET Survey of Employer-Sponsored Health Benefits, 1999–2010.
Healthcare Access 55

FIgure 4-9 Percentage of Covered Workers Enrolled in a Plan with a General Annual Deductible of $1,000 or More for Single Coverage, By Firm Size, 2006–2010.
All small firms (3–199 workers)
All firms
All large firms (200–more workers)
50%
40%
30%
20%
10%
0%
2006
16%
21%
35%
40%
46%
10%
12%
18%
22%
27%
6% 8%
9%
13%
17%
2007 2008 2008 2010
*Estimate is statistically different from estimate for the previous year shown (p <.05).Note: These estimates include workers enrolled in HDHP/SO and other plan types. Because we do not collect information on the attributes of conventional plans, to be conservative, we assumed that workers in conventional plans do not have a deductible of $1,000 or more. Because of the low enrollment in conventional plans, the impact of this assumption is minimal. Average general annual health plan deductibles for PPOs, POS plans, and HDHP/SOs are for in-network services. Source: Kaiser/HRET Survey of Employer-Sponsored Health Benefits, 2006–2010.
visits or 60 consecutive days per condition, outpatient speech therapy to 90 consecutive days per condition, and skilled nursing facility care to 100 days.19 Once a patient reaches these limits, the insurance plan will not cover additional visits and the patient would have to pay the entire cost of a visit out-of-pocket.
Service Exclusions: Health insurance plans may also partially or fully exclude certain types of services from coverage altogether. For example, the Kaiser FEHBP Standard HMO plan only covers high-dose chemo-therapy associated with bone marrow transplants for specified organ and tissue transplants and covers sur-gical treatment for morbid obesity only if certain con-ditions are met. Examples of services not covered at all by the plan include: long-term, cognitive, or voca-tional rehabilitative therapy; cosmetic surgery; private duty hospice nursing; and transportation other than by ambulance.19
Coverage for abortion and family planning services is also limited in many instances. Federal funds may be used for
abortion services only in cases of rape, incest, or to save the life of the pregnant woman, and four states limit private plan abortion coverage to cases when the woman’s life would be in danger if the pregnancy were carried to term.20 As of January 2011, 28 states required insurance plans to cover the full range of contraceptive drugs, but 20 of those states exempted select employers and insurers and two states excluded emergency contraception from the mandate.21 Since the ACA was passed, 15 states have enacted legislation barring abortion coverage by plans in their state exchange.22 As discussed in more detail elsewhere, abortion coverage remains limited under the ACA and it is not yet clear what requirements, if any, plans will have to follow regarding contraceptive coverage.
Safety net Providers
Securing access to care can be difficult for those without comprehensive private insurance. For the uninsured, the high cost of care is often a deterrent to seeking care. For those with public coverage, it is often difficult to find a provider willing to accept their insurance due to the low reimbursement rates and administrative burdens associated with participating in
56 chapter 4 Overview of the United States Healthcare System
to public hospitals and health centers, which provide a wider range of services.23(pp63–65)
Safety net providers receive funding from a variety of sources, but they often struggle financially. Medicaid is the single largest funding stream for both public hospitals and health centers, accounting for over one-third of their rev-enue.24,25 Federal grants to health centers are intended to cover the cost of caring for the uninsured; however, this grant funding has not kept pace with the cost of provided care. In 2007, federal dollars paid for only 48% of the cost of treating the uninsured, a decrease of 10% since 2001.7(p15) In addition, payment from private insurance is unreliable due to the high-cost-sharing plans held by many privately insured, low-income individuals. Furthermore, Medicare payments to health cen-ters are capped under federal law at an amount that does not match the growth in healthcare spending.
Public hospitals face a similarly difficult economic pic-ture. Many public hospital services are not fully reimbursed because payments made by individuals or insurers do not match the cost of care. Even though NAPH members ac-counted for only 2% of the nation’s acute care hospitals in 2009, they delivered 20% of the uncompensated care pro-vided by hospitals that year.26(pxi) Like health centers, public hospitals receive funds to cover low-income patients, in-cluding Medicaid disproportionate share payments (DSH), state and local subsidies, and other revenues such as sales tax and tobacco settlement funds.25 In 2009, DSH payments accounted for 22% of NAPH members’ uncompensated care costs, but these payments were reduced under health reform.26(pxi) State and local payments covered 33% of their uncompensated care costs, but the budget deficits faced by many states are likely to result in fewer funds provided to public hospitals.26(pxi)
For all the positive work accomplished by safety net pro-viders, they cannot solve all healthcare problems for vulner-able populations. Safety net patients may lack continuity of care, whether because they cannot see the same provider at each visit or because they have to go to numerous sites or through various programs to receive all the care they need. Even though safety net providers serve millions of patients every year, there are not enough providers in enough places to satisfy the need for their services. While the ACA included an infusion of funds to safety net providers, they also will serve an influx of newly insured patients. Health centers re-ceived $11 billion under the ACA and expect to double their patient load to 40 million people by 2015.27 And, as noted earlier, many safety net providers are underfunded and con-stantly struggling to meet the complex needs of their patient population.
these programs. For these patients and the underinsured, the “healthcare safety net” exists.
The healthcare safety net refers to providers who serve disproportionately high numbers of uninsured, underinsured, and publicly insured patients. Although there is no formal designation indicating that one is a safety net provider, the Institute of Medicine (IOM) defines the healthcare safety net as “[t]hose providers that organize and deliver a significant level of health care and other related services to uninsured, Medicaid, and other vulnerable populations.”23(p21) Accord-ing to the IOM, “core” safety net providers are those who serve vulnerable populations and have a policy of providing services regardless of patients’ ability to pay.23(p21) Some safety net providers have a legal requirement to provide care to the underserved, while others do so as a matter of principle.
Who are safety net providers? It is a difficult question to answer because there is no true safety net “system.” Safety net providers can be anyone or any entity providing health care to the uninsured and other vulnerable populations, whether community or teaching hospitals, private health professionals, school-based health clinics, or others. Those providers that fit the narrower definition of “core” safety net providers include some public and private hospitals, community health centers, family planning clinics, and public health agencies that have a mission to provide access to care for vulnerable popula-tions. Safety net provider patient loads are mostly composed of people who are poor, on Medicaid, or uninsured, and are members of racial and ethnic minority groups. For example, in 2009, 92% of health center patients had incomes at or below 200% FPL, 75% were on Medicaid or uninsured, and 60% were racial or ethnic minorities.24,25 Of the National Association of Public Hospital (NAPH) member hospital patients, in 2009, 57% were on Medicaid or uninsured and 58% were racial or ethnic minorities.26
Community health centers provide comprehensive pri-mary medical care services, culturally sensitive care, and enabling services such as transportation, outreach, and trans-lation that make it easier for patients to access services. Many health centers also provide dental, mental health, and phar-macy services. Because health centers are not focused on specialty care, public hospitals are often the sole source of spe-cialty care for uninsured and underserved populations.25(p4) In addition, public hospitals provide traditional healthcare services, diagnostic services, outpatient pharmacies, and highly specialized trauma care, burn care, and emergency services.25(p2) Although not all local government health de-partments provide direct care, many do. Local health depart-ments often specialize in caring for specific populations, such as individuals with HIV or drug dependency, as compared
Healthcare Access 57

the number of uninsured will exacerbate the provider short-age because people are more likely to seek care when they have insurance. For example, demand for physician services would be expected to rise by 25% if universal coverage were achieved.28
One of the main concerns with the healthcare workforce is a shortage of primary care providers. Sixty million people are already “medically disenfranchised,” meaning they lack adequate access to primary care due to a provider shortages.29 In 2008, only 35% of physicians and 37% of physician assis-tants practiced primary care. Only half of the advanced nurse practitioners work in an ambulatory care setting, and not all of them are in the primary care field.30 These shortages reflect a waning desire among medical and nursing students to become primary care providers; between 1997 and 2005, graduates of programs in the United States choosing a primary care residency dropped by 50%.31 The long work hours, increased demands (particularly administrative demands associated with insurance companies), and comparatively low pay for primary care providers are sending future practitioners to other fields (see Figure 4-10). For example, one study showed that, over a lifetime, a cardiologist will make $2.7 million more than a primary care physician.32 An increasing number of graduates are going into specialty fields, accounting for three-quarters of the growth in total per capita physicians from 1980–1999.33(p15)
While fewer graduates are turning to primary care, de-mand for primary care services is expected to increase in the next several years. Prior to the passage of the ACA, it was estimated that the United States would already have 21,000 fewer primary care physicians than necessary by 2015.34 The primary care shortage is expected to increase after the ACA is implemented, as it is estimated to add 32 million newly insured individuals who are likely to seek care.
Furthermore, the population is aging, with the popula-tion over age 65 projected to increase from 13% in 2010 to 20% in 2020.35 Elderly patients are heavy users of healthcare services. Even though older patients made up about 12% of the population in 2008, they accounted for over 45% of all primary care office visits that year.36 Furthermore, geriatric training is lacking among primary care providers. Only 3 of the top 145 medical schools have a full geriatric department and less than 3% of all medical students take at least one class in geriatrics.37
In addition to provider shortages, access problems may exist because providers are not distributed evenly throughout the country. For example, many states have a poor distribu-tion of children’s doctors. Nearly one million children live in areas without local doctors, with Mississippi having the
The problems facing the uninsured and the stressors on the healthcare safety net highlight the inadequacies of the current “system” of providing health care, and many of these problems will remain even after the ACA is implemented. Given the country’s patchwork of programs and plans, deci-sions made in one area can significantly affect another. For example, if Medicaid reimbursement rates are cut or program eligibility is reduced, safety net providers will have a difficult time keeping their doors open while, simultaneously, more patients will become uninsured and seek care from safety net providers. If more people choose high-deductible private insurance plans that they cannot easily afford, individuals may go without needed services or safety net providers will end up providing an increasing amount of uncompensated care. If employers decide to reduce or end coverage or increase employee cost-sharing, previously insured people may fall into the ranks of the uninsured. As a result, safety net providers and their patients are affected by many policies that are not directed at them, but still greatly impact their ability to pro-vide or access care.
Workforce Issues
Problems accessing care may also occur due to provider short-ages and an uneven distribution of providers throughout the country. This problem affects both the uninsured and the insured alike. If a provider is not available to take you as a pa-tient, it matters little if you have an insurance plan that would cover the cost of your care. Of course, if a provider shortage is so great that those with insurance are turned away, the unin-sured will have an even harder time accessing care.
Overall, it is estimated that this country will have 200,000 fewer physicians and 1 million fewer nurses than necessary by 2020. Already the nursing shortage has reached 400,000, with many unfilled jobs in nursing homes and hospitals. Reducing
Box 4-3 Discussion Questions
Safety net providers mostly serve uninsured and publicly insured low-income patients. Many of the safety net pro-vider features you just read about are in place to assist these patients in accessing health care. Instead of pursuing universal coverage, would it be an equally good strategy to expand the number of safety net providers? Are there reasons for both safety net providers and health insurance to exist? How does having insurance relate to accessing care?
58 chapter 4 Overview of the United States Healthcare System

FIgure 4-10 Percent Change Between 1998 and 2006 in the Percentage of U.S. Medical School Graduates Filling Residency Positions in Various Specialties.
160
140
40
20
0
–20
120
100
80
60
–40
–60
Per
cen
t
Fam
liy p
racti
ce
Inte
rnal
med
icine
(inclu
des p
rimar
y car
e)
Obste
trics
—Gyn
ecolo
gy
Pediat
rics
Gener
al su
rger
y
Derm
atolo
gy
Emer
genc
y med
icine
Diagno
stic r
adiol
ogy
Patho
logy
Anesth
esiol
ogy
–51
–18 –16–8 –4
718
34
122
150
Data are from the National Resident Matching Program.Source: Woo B. Becoming a physician—primary care, the best job in medicine? N Engl J Med. 2006;355(9):864–866.
highest percentage of children (42%) in low-supply areas. States as diverse as Arkansas, Oklahoma, Maine, and Idaho also have many children without adequate access to primary care. Conversely, Washington, DC and Delaware have no children in low-supply areas and Maryland, Wisconsin, and Washington state generally have very few children who could not gain access to a pediatrician.38
As shown in Figures 4-11 and 4-12, rural areas are par-ticularly susceptible to provider shortages, which is a press-ing problem because individuals who live in rural areas are more likely to be sicker, older, and poorer than their urban counterparts. While 19% of the population lives in rural areas, only 11% of physicians practice in those parts of the country. Family practice doctors are the ones most likely to practice in rural areas, accounting for two-thirds of the physicians in smaller rural locales.39 Rural areas also have a shortage of other types of providers such as dentists, registered nurses,
nurse practitioners, and physician assistants, who are key to providing primary care services.40,41 The high vacancy rates for various positions in community health centers, which are located in medically underserved areas, illustrate the work-force problem facing many communities.
Shortages also exist within the public health workforce. The public health workforce has been defined to include any-one who is providing one of the 10 essential public health functions, regardless of whether their employer is a govern-ment agency, not-for-profit organization, private for-profit entity, or some other type of organization.42 The public health workforce includes professions such as public health physi-cians and nurses, epidemiologists, health educators, and ad-ministrators. This workforce has been shrinking and about one-quarter of the public health workforce employed by the government is eligible to retire in 2012. It is estimated that by 2020, the United States will have a shortfall of 250,000 public
Healthcare Access 59

FIgure 4-11 Patient Care Physician to Population Ratios by Urban/Rural Status, 2005.
250
200
150
100
50
0
Phy
sici
ans
per
100
,000
po
pu
lati
on
Urban Totalrural
Largerural
Smallrural
Isolatedsmallrural
26.4 33.3 32.4 40.1 26.6
209.6
113.2146.9
99.2
52.3
Total physicians
Family medicine physicians
Source: Rosenblatt RA, Frederick MC, Lishner DM, Doescher MP. The future of family medicine and implications for rural primary care physi-cian supply. 2010. WWAMI Rural Health Research Center. Available at http://depts.washington.edu/uwrhrc/uploads/RHRC%20FR125% 20Rosenblatt.pdf.
FIgure 4-12 Primary Care Physician Vacancy Rates at Health Centers, 2004.
30%
20%
10%
0
Per
cen
t
Total
13.3
30.8
9.1 8.8
22.6
Rural
15.7
26.6
8.8
14.1
25.1
Urban
12.1
19.0
9.27.4
21.5
Family physicians/general practitioner
OBGYN
Internist
Pediatrician
Psychiatrist
Source: Rosenblatt R, Andrilla H, Curtin T, and Hart G. “Shortages of Medical Personnel at Community Health Centers.” 2006. JAMA, Vol. 295, No. 9: 1042–1049.
health workers, and schools of public health would have to train three times as many public health students as normal from 2008–2019 to prevent a shortage of this magnitude.43
The ACA contains a number of provisions intended to ad-dress some of the more pressing healthcare and public health workforce issues. These provisions:
Increase funding for community health centers.•Increase funding for the National Health Service Corps, •which provides scholarships and loan repayments to students who agree to become primary care providers and work in medically underserved communities.Increase funding for physician assistant and nurse •practitioner training.Provide new funding to establish nurse-practitioner-•led clinics.Provide new funding for states to plan and imple-•ment innovative strategies to boost their primary care workforce.Establish a National Health Care Workforce Commis-•sion to coordinate federal workforce efforts and bolster data collection and analysis.Establish teaching health centers.•Provide payments for primary care residencies in •community-based ambulatory care centers.
60 chapter 4 Overview of the United States Healthcare System

In 2001, the Institute of Medicine (IOM) released Cross-ing the Quality Chasm: A New Health System for the 21st Century, which represented nothing less than an urgent call to redesign the healthcare system to improve the quality of care provided.47 The IOM attributes our inability to provide consistent, high-quality health care to a number of factors, including: the growing complexity of health care, includ-ing quickly developing technological advancements; an in-ability to meet rapid changes; shortcomings in safely using new technology and applying new knowledge to practice; increased longevity among the population, which carries concerns relating to treating chronic conditions in a system better designed to address episodic, acute care needs; and a fragmented delivery system that lacks coordination, lead-ing to poor use of information and gaps in care.47(pp2–4) In its call to redesign the healthcare system to improve qual-ity, the IOM focuses on six areas of improvement: safety, efficacy, patient-centeredness, timeliness, efficiency, and equity.47(p43)
Safety. In a safe healthcare system, patients should not be endangered when receiving care that is intended to help them, and healthcare workers should not be harmed by their chosen profession.47(p44) In an earlier report, To Err is Human, the IOM found that deaths due to medical errors in hospitals could be as high as 98,000 annually and cost up to $29 billion, over half of which is attributable to healthcare costs.48(pp1–2) A safe healthcare system also means that standards of care should not decline at different times of the day or week or when a patient is transferred from one provider to another. In addition, safety requires that patients and their families are fully informed and participate in their care to the extent they wish to do so.47(p45)
Efficacy. While scientific evidence regarding a particu-lar treatment’s effectiveness is not always available, an effective healthcare system should use evidence-based treatments whenever possible. This includes avoid-ing the underuse of effective care and the overuse of ineffective care.47(p47) Evidence-based medicine is not limited to findings from randomized clinical trials, but may use results from a variety of research designs. To promote the use of evidenced-based medicine, health-care providers and institutions should improve their data collection and analysis capabilities so it is possible to monitor results of care provided.47(p48)
Patient-Centeredness. A patient-centered healthcare system is sensitive to the needs, values, and prefer-ences of each patient, includes smooth transitions and close coordination among providers, provides complete
Box 4-4 Discussion Questions
In addition to relatively low pay and long hours, some future practitioners are avoiding careers in primary care because these providers often lack the respect of their peers and others in society. Do you believe primary care providers are less respected than specialists? If so, why? Primary care providers are often respected in other coun-tries. What can be done to improve the standing of primary care providers in the United States?
increase the number of Graduate Medical Education •slots available to primary providers by redistributing unused slots.promote residency training in outpatient settings;•provide grants to training institutions to promote ca-•reers in the healthcare sector; andincrease reimbursement for primary care providers •under Medicare and Medicaid.
HealtHcare QualItyIt is well documented that the United States spends more on health care than most other developed countries (the $8,086 per person spending in the United States is more than two-and-a-half times the average of other developed countries),44 yet frequently the care provided does not result in good health outcomes. While the United States does some things very well, such as screening for and treating cancer, the country lags on measures relating to primary care services. For example, the United States ranked 30th in infant mortality in 2005, the last year such rankings were available, and has much higher hospital admission rates for complications due to asthma and diabetes as compared to other developed countries.44,45
Researchers and policymakers have highlighted the need to improve the quality of care provided in this country. A 2003 landmark study raised many quality concerns, including findings that patients only received the appropriate medical care 55% of the time and that patients were much more likely not to receive appropriate services than to receive potentially harmful care.46 The lack of appropriate care was seen across medical conditions, similarly affecting treatments relating to preventive care, acute care, and for chronic diseases.46(p2641) The degree to which patients received appropriate care var-ied greatly. For example, only 10% of patients with alcohol dependence received the standard of care, as opposed to 78% of those with senile cataracts.46(2641)
Healthcare Quality 61

the number of patients who do not receive appropriate care, and the high number of medical errors make it clear that the quality of healthcare services provided can be improved.
In addition, significant geographic variations in the pro-vision of healthcare services suggest a lack of efficiency in the system; however, this is a complicated issue to understand and solve. For example, the Dartmouth Atlas Project has studied regional variations in healthcare practices and spending for several decades. Even after controlling for level of illness and prices paid for services, researchers have found a two-fold difference in Medicare spending in the country.
Furthermore, higher spending areas are not associated with better quality of care, more patient satisfaction, better access to care, more effective care, or improved outcomes.51 Instead, both health system capacity and local practice styles appear to be key factors in geographic variations in cost. In one study, other researchers found that expenses associ-ated with high-cost beneficiaries were related to their health needs, rather than physician-, practice-, or market-related factors.52 Even so, there was a modest association between less fragmented markets and lower costs, and between a higher concentration of for-profit providers and higher costs.52(p21) In addition, geographic variation was difficult to assess because 20% of Medicare beneficiaries receive care across census divisions and those patients were often high-cost beneficiaries.52(p20) As policymakers try to improve quality of care in the United States, they will have to untangle diffi-cult questions of why some parts of the country spend more on services than others.
information and education at a level and in a language patients can understand, involves the patient’s fam-ily and friends according to the patient’s wishes and, to the extent possible, reduces physical discomfort experienced by patients during care.47(pp49–50) A lan-guage or cultural barrier may be a significant hurdle to receiving high quality and patient-centered care. One in six Americans speak a language other than English at home.49 Individuals with language barriers are less likely to adhere to medication regimes, have a usual source of care, and understand their diagnosis and treatment, and are more likely to leave a hospital against a provider’s advice and miss follow-up appoint-ments. While use of interpreters can improve a patient’s quality of care, when friends or family members serve as interpreters, there is greater risk that the interpreter will misunderstand or omit a provider’s questions, and that embarrassing symptoms will be omitted by the patient.49(p2) Similarly, cultural differences between provider and patient can result in patients receiving less than optimal care. Cultural differences can define how healthcare information is received, whether a problem is perceived as a healthcare issue, how patients express symptoms and concerns, and what type of treatment is most appropriate. As a result, healthcare organizations should ensure that patients receive care that is both linguistically and culturally appropriate.50
Timeliness. A high-quality healthcare system will pro-vide care in a timely manner. Currently, U.S. patients experience long waits when making appointments, sitting in doctors’ offices, standing in hallways before receiving procedures, waiting for test results, seek-ing care at Emergency Departments, and appealing billing errors.47(p51) These can take an emotional as well as physical toll if medical problems would have been caught earlier with more timely care. Timeliness problems also affect providers because of difficulties in obtaining vital information and delays that result when consulting specialists. In addition, lengthy waits are the result of a system that is not efficient and does not respect the needs of its consumers.47(p51)
Efficiency. An efficient healthcare system makes the best use of its resources and obtains the most value per dol-lar spent on healthcare goods and services. The unco-ordinated and fragmented U.S. system is wasteful when it provides low quality care and creates higher than necessary administrative and production costs.47(p52) As indicated previously, the high level of spending and poor outcomes relating to preventable conditions,
Box 4-5 Discussion Questions
Unfortunately, evidence is not available to support the effectiveness or cost–benefit of every procedure or drug. How should policymakers and providers make decisions when faced with a dearth of evidence? Do you prefer a more cautious approach that does not approve procedures or drugs until evidence is available or a more aggressive ap-proach that encourages experimentation and use of treat-ments that appear to be effective? What about medical care for children, who are generally excluded from clinical and research trials for ethical reasons? When, if ever, is it appropriate for insurers to cover or the government to pay for treatments that are not proven effective?
62 chapter 4 Overview of the United States Healthcare System

bypass surgery, and use dialysis or receive a kidney transplant even when controlling for factors such as age, insurance status, income level, and co-morbidities. Not surprisingly, African-Americans also have higher mortality rates than their white counterparts.55(pp2–3) Hispanics experience similar disparities. As compared to white Americans, Hispanics are more likely to be uninsured, have late or no prenatal care, and suffer from stroke, obesity, chronic liver disease, diabetes, asthma, and certain cancers.56,57
The IOM has called for sweeping changes to the health-care system to address the numerous ways in which the quality of care could be improved. While the ACA makes significant changes to the healthcare system, the law is focused more on improving access than quality or the delivery system. Many of the law’s quality improvement provisions are pilot programs and demonstration projects that may eventually result in significant changes—or fall to the wayside once they expire. None of the quality improvements tasks the IOM calls for will be simple to achieve and, at times, they seem to have conflicting goals. For example, making the healthcare system patient-centered may not always result in enhanced efficiency. Furthermore, the IOM’s proposed changes would require increased resources at a time when the United States is
The nation also spends close to one-third of healthcare expenditures on administration.53 As shown in Figure 4-13, this high level of administrative spending dwarfs that of other countries.54(p934) Extensive use of private insurers, who often have high administrative costs relative to public insurance programs, as well as the use of multiple insurers instead of a single-payer system, result in high administrative costs in the United States.
Equity. An equitable healthcare system provides essential health benefits to all people and includes universal ac-cess to care. Equity can be considered on an individual level and on a population level.47(p53) While the ACA should improve individual access to services by reduc-ing the number of uninsured, insurance alone is not sufficient to ensure access to care. The care itself still must be accessible (providers are willing to accept you as a patient), affordable, and available (sufficient pro-viders are available). Population-level equity refers to reducing healthcare disparities among subgroups. In the United States, racial and ethnic minority groups generally receive lower quality care and fewer routine preventive procedures than white people. African-Americans are less likely than whites to receive ap-propriate cardiac medication, undergo necessary artery
FIgure 4-13 High U.S. Insurance Overhead: Insurance-Related Administrative Costs.
$600
$400
$300
$200
$100
$0
$500
US
* 2006
F SWIZ NETH GER CAN AUS* OECDMedian
516
Fragmented payers + complexity = high transaction cost and overhead costs— McKinsey estimates adds $90 billion per year*
Insurance and providers— Variation in benefits; lack of coherence in payment— Time and people expense for doctors/hospitals
247220
198 191
140
86 76
Source: The Commonwealth Fund. Data: McKinsey Global Institute, Accounting for the Costs of U.S. Health Care: A New Look at Why Americans Spend More (New York: McKinsey, Nov. 2008).
Healthcare Quality 63

There are three types of healthcare systems often found in other countries: (1) a national health insurance system which is publically financed, but in which care is provided by private practitioners (e.g., Canada); (2) a national health system which is publically financed and where care is pro-vided by government employees or contractors (e.g., Great Britain); and (3) a socialized insurance system that is financed through mandatory contributions by employers and employ-ees and in which care is delivered by private practitioners (e.g., Germany).58(p22) Of course, variations exist within these types of systems in terms of the role of the central government, the presence of private insurance, the way the healthcare system is financed, and how care is administered by providers and accessed by patients. While comparing the systems in the three countries used as examples above does not cover all
facing record deficits and unsustainable healthcare spending levels. Improving the quality of the healthcare system is an enormous challenge and one that is likely to be on the nation’s agenda for years to come.
comParatIve HealtH SyStemSA review of the U.S. healthcare system and a discussion of its flaws often leads one to ask: How do other countries deliver health care and do they do a better job? Since the United States spends more overall and more per person on health care comparatively speaking, perhaps there are lessons to learn from other countries (see Figure 4-14). While there are many problems with healthcare delivery in the United States, it is also true that each type of healthcare system has its ad-vantages and drawbacks.
FIgure 4-14 International Comparison of Spending on Health, 1980–2008.
8000
7000
6000
5000
4000
3000
2000
1000
Average spending on health per capita ($US PPP)
0%
1980
1981
1982
1983
1984
1985
1986
1987
1988
1989
1990
1991
1992
1993
1994
1995
1996
1997
1998
1999
2000
2001
2002
2003
2004
2005
2006
2007
2008
United StatesNorwaySwitzerlandCanadaNetherlandsGermanyFranceDenmarkAustraliaSwedenUnited KingdomNew Zealand
16
14
12
10
8
6
4
2
Total expenditures on healthas percent of GDP
0
1980
1981
1982
1983
1984
1985
1986
1987
1988
1989
1990
1991
1992
1993
1994
1995
1996
1997
1998
1999
2000
2001
2002
2003
2004
2005
2006
2007
2008
Source: The Commonwealth Fund. Data: OECD Health Data 2010 (June 2010).
64 chapter 4 Overview of the United States Healthcare System

taBle 4-1 A Comparison of Health Systems Across Four Countries
United States Canada Great Britain Germany
System Type No unified system National health insurance
National health system Socialized health insurance
Universal Coverage Near universal after ACA implemented
Yes Yes Yes
Role of Private Insurance Significant Supplemental to Medicare
Minimal Minimal
Financing Private payments and tax revenue
Mostly tax revenue (federal, provincial, territorial)
All federal income tax revenue
Mandatory employer and employee contributions to national health fund
Hospital Reimbursement Varies by payor (DRGa, FFSb, capitation, per diem)
Global budget Global budget DRG
Physician Reimbursement
Fee schedule or capitation Negotiated fees with provinces/territories
Salary or capitation Negotiated fees with funds
a = Diagnostic Related Group (payment based on bundle of services needed for diagnosis)b = Fee For Service (payment per service rendered)
possible permutations of how healthcare systems are designed, it provides an overview of the choices made by policy makers in different countries (see Table 4-1).
a national Health Insurance System: canada
Canada’s healthcare system is called Medicare. Prior to es-tablishing the Medicare program in 1968, Canada provided insurance in a manner that was similar to the United States, with private plans offering coverage to many, even while mil-lions remained uninsured. Incremental changes were made to the Canadian healthcare system until the Medical Care Act of 1968 established Medicare’s framework. The act included three primary changes to the healthcare system: (1) univer-sal insurance coverage with medically necessary services provided free of charge; (2) a central regulatory authority overseeing hospitals; and (3) governmental power to negotiate reimbursement rates for physicians.
Canada’s healthcare system is largely decentralized, with Canada’s provinces and territories responsible for setting up their own delivery system. As such, Canada’s Medicare system is a collection of single-payer systems governed by the provinces and territories, with the central government
taking a more limited role. The provinces and territories set their own policies regarding many healthcare and other social issues, administer their own individual single-payer systems, reimburse hospitals directly or through regional health authorities, and negotiate physician fees schedules with provincial medical associations. Provinces and territo-ries use regional health authorities as their primary payor of healthcare services. While funding methods vary by location, regional health authorities have the ability to tailor funds in a way that best serves the needs of their population. The federal government has responsibility for specific health areas such as prescription drugs, public health, and health research, as well as for providing care to certain populations (e.g., veterans and indigenous peoples).59(p2)
Financing for health benefits varies by benefit type. Hos-pital services, physician services, and public health services are financed through public taxation. Certain services, in-cluding prescription drugs, home care, and institutional care, are financed through a combination of public taxation and private insurance coverage. Other goods and services, such as dental and vision care, over-the-counter drugs, and alterna-tive medicines are only covered through private insurance. In general, private insurance is used to cover goods and services
Comparative Health Systems 65
delivery of hospital care and are also responsible for monitor-ing quality of care and using resources efficiently. They also employ a large proportion of NHS workers, including nurses, doctors, midwives, pharmacists, and others.61
NHS is the largest publically financed national health system in the world. The 2010–2011 budget of £102 billion is financed primarily through general tax revenues, with most of the rest of the funds coming through Social Secu-rity contributions.61(p9) While most residents receive their care through NHS, private insurance is also available. Ap-proximately 10% of residents have private health insurance, which provides the same benefits as the NHS but allows for reduced waiting times and access to higher quality care in some cases.59(p33),62 Those with private insurance tend to have a higher socioeconomic status than individuals covered by NHS.59(p33)
Most physicians and nurses are private practitioners who work for NHS as independent contractors, not salaried em-ployees, while NHS owns the hospitals and hospital staff are salaried employees. Patients select a general practitioner (GP) in their service area and this provider is the gateway to NHS services. Almost everyone (99%) has a registered GP and 90% of all patient contact is with this provider.59(p33) Services are provided free of charge, except for specific services des-ignated by law.
a Socialized Insurance System: germany
In 1883, Germany’s Otto von Bismarck created the first healthcare system in the world. He viewed a strong health and pension system as a way to build a superior nation, earn support from Germany’s working class, and undermine any attempts by Germany’s socialist party to gain power. The central government is responsible for setting health policy and regulating the Social Health Insurance System (SHIS). German healthcare policy emphasizes solidarity, the idea that all should have equal access to health care regardless of abil-ity to pay.59(p12) Germany’s legislature has passed two major health reform bills in recent years. In 2007, the goals of health reform were to mandate universal coverage, improve medical care, modernize sickness funds, and reform the health fund. Germany’s 2010 health reform law adjusted insurance levies, reduced the power of pharmaceutical companies to set prices, and cut costs.59(p11), 63
SHIS is composed of a collection of non-profit regional sickness funds with a standard benefit package that includes inpatient services, outpatient services, medications, reha-bilitation therapy, and dental benefits.59(p15) The funds are
not provided by Medicare; six provinces go so far as to prohibit private insurance companies from competing based on price or access time for Medicare-covered benefits.59(p3)
Tax revenue from the provincial, territorial, and federal governments pay for 70% of total Medicare expenditures, while private insurance reimbursement accounts for 12% of costs, patient out-of-pocket payments cover 15%, and various sources account for the final 3%.59(p3) Healthcare spending is expected to reach C$192 billion in 2010, with the government paying C$135 billion and private insurance and out-of-pocket payments responsible for most of the remaining expenditures. The provinces and territories spend an average of 39% of their budgets on healthcare services, but healthcare spending varies considerably across the country. For example, Alberta spends C$6,266 per person, compared to Quebec’s C$5,096 per person costs.60
In addition to paying for care, regional health authorities also organize the delivery of care. They hire staff at most acute care facilities and contract for some ambulatory care services. General practitioners and specialists work on a fee-for-service arrangement and generally work in either the public program or private practice, but not both.59(p4) While fee-for-service payments account for most of physicians’ income, hospi-tals rely on global budgets allocated by the regional health authorities.
a national Health System: great Britain
Great Britain’s healthcare system was designed by Sir William Beveridge as part of a social reconstruction plan after World War II. The National Health Services Act of 1946 created the National Health Service (NHS), a centrally run healthcare system that provides universal insurance coverage to all resi-dents of Great Britain. It was designed based on the principle that the government is responsible for providing equal access to comprehensive health care that is generally free at the point of service.59(p31)
The central government has a significant role in the NHS. It sets national health policies and priorities, establishes which benefits are covered, and controls an overall pool of funds that is distributed to 10 regional health authorities to man-age healthcare services and disburse funds in their service area.59(p31) Health care is delivered through a variety of trusts that cover services such as primary care, mental healthcare, acute care, and ambulance services. Primary care trusts work with local health and social services agencies to assure the community’s needs are being met, and these trusts account for over 80% of the NHS budget. Acute care trusts manage the
66 chapter 4 Overview of the United States Healthcare System

may levy an additional premium capped at 1% of individual gross income, but if the plan imposes the additional premium, individuals are immediately free to change plans.59(p14)
the Importance of Health Insurance design
Reviewing the healthcare systems of four countries—the United States, Canada, Great Britain, and Germany—shows how varied healthcare systems are around the world. Differ-ences exist regarding the role of government, the ability to purchase private insurance, cost-sharing requirements, and how the system is financed. Even countries that share the same general type of system have variations based on their specific culture, politics, and needs. How a system is designed matters in terms of access to care, financing, and patient satisfaction. A survey in 11 countries asked residents about their experience with their country’s healthcare system.64 What issues were primary concerns and how different residents fared within a system varied by country (see Figures 4-15 to 4-18).
Affordability was a key issue in the United States. Of those surveyed, U.S. residents were the most concerned about being able to afford health care in the event of an illness, most likely to have not received care due to cost, most likely to have spent at least $1,000 out-of-pocket on health care, and most likely to have had serious problems paying for care.64(pp2326–2327) Resi-dents of Great Britain were least likely to be worried about costs and German residents rarely spent $1,000 on health care.64(p2327) On the other hand, access to care was generally quicker for Americans and Germans compared to Canadians and the British. While residents of Great Britain indicated quick access to primary care providers, they experienced longer waits for specialty care and elective surgery, although their wait times have decreased in recent years.64(p2328) Varia-tions also exist regarding the complexity of dealing with the insurance system and with patient satisfaction. Residents of the United States and Germany were more likely to spend time on insurance paperwork and disputes with insurance companies, while it was rare for British residents to make similar complaints.64(p2330)
Even though most countries in the survey have univer-sal or near-universal coverage, low-income individuals still report more problems with health care than their wealthier counterparts. In every country, low-income residents were more likely to be in poor health and more concerned about affording health care than higher income residents, with the United States showing the widest gap in experience by income level.64(p2331) Residents of Great Britain were the only ones who did not report access-related barriers by income level. Also, low-income residents in the United States and Canada
organized around industry or geography and are responsible for managing healthcare services. Germans must enroll in sickness funds or obtain coverage through private insurance. Some populations are required to be under SHIS, including individuals who earn less than $60,000 per year or are pen-sioners, students, unemployed, disabled, poor, and homeless, and funds may not refuse to cover them and physicians may not refuse to treat them.59(p15) Germans who earn over $60,000 per year for three consecutive years or who are self-employed may choose to opt out of SHIS and purchase private coverage. About 10% of the population opts out of SHIS. In addition, approximately 20% of Germans choose to purchase private insurance to supplement their SHIS benefit plan.54(p2325)
Health care is provided in the public and private sectors. Both public and private providers deliver inpatient hospital care. Sickness funds finance most inpatient hospital care, with state governments covering a small percentage of those costs. Hospitals are reimbursed based on a diagnostic-related group methodology.59(p14) Physicians and other ambulatory care pro-viders deliver care through the private sector, although most physicians are authorized SHIS providers. Regional associa-tions negotiate contracts on behalf of their members and the resources are split into primary care and specialty care funds, with individual providers reimbursed per services provided based on a relative value scale.59(p14)
Sickness funds are financed through employer and em-ployee contributions as well as federal subsidies. Under the 2007 health reform law, individuals and employers each pay a flat rate to the funds and are responsible for cost-sharing when receiving care. If patients are unable to pay their pre-miums, the welfare system covers the costs. Sickness funds distribute money to insurance plans on a capitated basis with rates risk-adjusted based on age, sex, and disease status.59(p13) Well-run funds with excess resources have the choice of re-mitting money to insureds or providing additional benefits not covered by the standard package. Funds that run a deficit
Box 4-6 Discussion Questions
Do you prefer one of these health systems to the others? Why or why not? Are there features that you think should be incorporated into the U.S. healthcare system? Are there reasons why certain features might be difficult to incorpo-rate into the U.S. healthcare system?
Comparative Health Systems 67

FIgure 4-15 Out-of-Pocket Medical Costs in the Past Year, in U.S. Dollars.
100
75
50
25
0
Per
cen
t$200 or less
AUSCAN FR
GERNETH NZ
NORSW
ESW
IZ UK US
35
5147
41 39
61
33
50
20
76
31
100
75
50
25
0
Per
cen
t
$1,000 or more
AUSCAN FR
GERNETH NZ
NORSW
ESW
IZ UK US
21
124
8 9 7
16
2
25
1
35
Source: 2010 Commonwealth Fund International Health Policy Survey in Eleven Countries.
68 chapter 4 Overview of the United States Healthcare System

FIgure 4-16 Access to Doctor or Nurse When Sick or Needed Care.
100
75
50
25
0
Per
cen
t
Same- or next-day appointment
AUSCAN FR
GERNETH NZ
NORSW
ESW
IZ UK US
65
45
6266
7278
45
57
93
70
57
100
75
50
25
0
Per
cen
t
Waited six days of more
AUSCAN FR
GERNETH NZ
NORSW
ESW
IZ UK US
14
33
17 16
5 5
2825
28
19
* Base: Answered questionSource: 2010 Commonwealth Fund International Health Policy Survey in Eleven Countries.
Comparative Health Systems 69

FIgure 4-17 Cost-Related Access Problems in the Past Year, by Income.
75
50
25
0
Per
cen
t ex
per
ien
ces
at le
ast
on
eo
f th
ree
pro
ble
ms
AUSCAN FR
GERNETH NZ
NORSW
ESW
IZ UK US
126
8
17
38
4 57
4
202218 17
27
13 15
21
14 12
4
39
Above-average income
Below-average income
Note: Percentages adjusted based on logistic regression to control for health status, age, and—in the U.S.—insurance status.* Indicates significant within-country differences with below-average income (p <0.05).** Did not fill/skipped prescription, did not visit doctor with medical problem, and/or did not get recommended care.Source: 2010 Commonwealth Fund International Health Policy Survey in Eleven Countries.
FIgure 4-18 Waited Two Months or Longer for Specialist Appointment, by Income.
75
50
25
0
Per
cen
t
AUSCAN FR
GERNETH NZ
NORSW
ESW
IZ UK US
26
40
29
8
15 14
3532
7
8
7
31
45
30
9
24 26
3531
3
28
10
Above-average income
Below-average income
Note: Percentages adjusted based on logistic regression to control for health status, age, and—in the U.S.—insurance status.* Indicates significant within-country differences with below-average income (p <0.05).Source: 2010 Commonwealth Fund International Health Policy Survey in Eleven Countries.
70 chapter 4 Overview of the United States Healthcare System

14. Institute of Medicine. Hidden Costs, Value Lost: Uninsurance in America. Washington, DC: National Academy Press; 2003.
15. Families USA. Paying a premium: the added cost of care for the unin-sured. 2005. Available at http://www.familiesusa.org/resources/publications /reports/paying-a-premium.html. Accessed July 18, 2011.
16. Kavilanz, PB. Uninsured Americans: cost to you. March 5, 2009. CNN Money. Available at http://money.cnn.com/2009/03/05/news / economy /healthcare_underinsured/. Accessed July 18, 2011.
17. Medicare.gov. Medicare premium and co-insurance rates for 2011. Available at https://questions.medicare.gov/app/answers/detail/a_id/2305 /~/medicare-premiums-and-coinsurance-rates-for-2011. Accessed Febru-ary 8, 2011.
18. Blue Cross Blue Shield Federal Employee Program. Standard option medical benefits. Available at http://www.fepblue.org/benefitplans /standard-option/medical-benefits.jsp. Accessed February 8, 2011.
19. US Office of Personnel Management. Plan Brochure—Kaiser Foun-dation Health Plan of the Mid-Atlantic States. Available at http://www.opm .gov/insure/health/planinfo/2011/brochures/73-047.pdf. Accessed Febru-ary 8, 2011.
20. Guttmacher Institute. An Overview of Abortion Laws. Washing-ton, DC: Guttmacher Institute. Available at http://www.guttmacher.org / statecenter/spibs/spib_OAL.pdf. Accessed February 8, 2011.
21. Guttmacher Institute. Insurance Coverage of Contraceptives. Wash-ington, DC: Guttmacher Institute. Available at http://www.guttmacher.org /statecenter/spibs/spib_ICC.pdf. Accessed February 8, 2011.
22. Cartwright-Smith L. Update: abortion coverage. Health Reform GPS. Available at http://www.healthreformgps.org/resources/update-abortion-coverage/. Accessed July 19, 2011.
23. Institute of Medicine. America’s Health Care Safety Net: Intact but Endangered. Washington, DC: National Academy Press; 2000.
24. National Association of Community Health Centers. America’s health centers—fact sheet. 2010. Available at http://www.nachc.com/client /America’s%20Health%20Centers%20updated%2009%2010.pdf. Accessed February 1, 2011.
25. Regenstein M, Huang J. Stresses to the safety net: the public hospital perspective. Kaiser Family Foundation; 2005. Available at http://www.kff .org/medicaid/7329.cfm. Accessed July 19, 2011.
26. National Association of Public Hospitals and Health Systems. America’s public hospitals and health systems, 2009: Results of NAPH an-nual hospital characteristics survey. Available at http://www.naph.org /Main-Menu-Category/Our-Work/Safety-Net-Financing/Characteristics-Report/2009-Public-Hospital-Financial-Characteristics-.aspx?FT=.pdf. Ac-cessed February 22, 2011.
27. National Association of Community Health Centers. Expanding health centers under health reform: doubling patient capacity and bringing down costs. Available at http://www.nachc.com/client/HCR_New_Patients _Final.pdf. Accessed June 28, 2011.
28. Center for American Progress. Closing the health care workforce gap. Available at http://www.americanprogress.org/issues/2010/01/health _workforce.html. Accessed February 11, 2011.
29. National Association of Community Health Centers. Primary care access: An essential building block of health reform. 2009. Available at http://www.nachc.com/client/documents/pressreleases/PrimaryCareAccessRPT .pdf. Accessed February 11, 2011.
30. Iglehart JK. Despite tight budgets, boosting US health workforce may be policy that is ‘just right.’ Health Affairs. 2011;30(2):191–192.
31. Bodenheimer T. Primary care—will it survive? New Eng J Med. 2006;355(9):861–864. Available at http://www.nejm.org/doi/full/10.1056 /NEJMp068155. Accessed July 19, 2011.
32. Vaughn BT, DeVrieze SR, Reed SD, Schulman KA. Can we close the income and wealth gap between specialists and primary care physicians? Health Affairs. 2010;933–940,936.
were more likely to experience longer waiting times than low-income residents in Germany and Great Britain.
concluSIonThis wide-ranging review of the U.S. healthcare system was intended to provide readers with a general sense of how health care is accessed, financed, and administered in this country. Understanding the various players in the healthcare system, from providers to researchers to policymakers, is crucial to being able to participate in debates over current issues in health policy and law. While the U.S. system excels on many fronts, it falls short in many areas relating to access, quality, and efficiency. Perhaps policymakers in this country could learn lessons from successes abroad, but the United States has a unique political environment and it is clear there is no silver bullet that will solve all the problems we face. Specific health policy and law concerns will be described in much greater detail elsewhere, providing a foundation to tackle the many problems that will confront the country in the years ahead.
reFerenceS 1. Pub L No. 111-148, the Patient Protection and Affordable Care
Act. 2. Chartset for Health at a Glance 2009. OECD Web site. Available at
http://www.oecd.org/document/11/0,3746,en_2649_37407_16502667_1 _1 _1_37407,00.html. Accessed January 25, 2011.
3. HealthyPeople.gov home page. Available at http://www . healthy people.gov/2020/default.aspx. Accessed January 25, 2011.
4. Centers for Medicare and Medicaid Services. National health ex-penditures 2009 highlights. Available at https://www.cms.gov / National HealthExpendData/downloads/highlights.pdf. Accessed January 25, 2011.
5. Centers for Medicare and Medicaid Services. National health expen-diture projections 2009–2019. Available at https://www.cms.gov /National HealthExpendData/downloads/NHEProjections2009to2019.pdf. Accessed January 25, 2011.
6. Kaiser Family Foundation. US health care costs background brief. 2010. Available at http://www.kaiseredu.org/Issue-Modules/US-Health-Care-Costs/Background-Brief.aspx. Accessed January 25, 2011.
7. Kaiser Family Foundation. The uninsured: a primer—key facts about Americans without insurance. 2010. Available at: http://www.kff.org / uninsured /upload/7451-06.pdf. Accessed January 6, 2011.
8. Kaiser Family Foundation and Health Research and Educational Trust. Employer health benefits. 2010. Available at: http://ehbs.kff.org /pdf/2010/8085.pdf. Accessed February 1, 2011.
9. Holahan J, Garrett B. Rising unemployment, Medicaid, and the unin-sured. 2009. Available at http://www.kff.org/uninsured/7850.cfm. Accessed February 1, 2011.
10. U.S. Bureau of the Census. Income, Poverty, and Health Insurance Coverage in the United States: 2009. Washington, DC: Bureau of the U.S. Census; 2010.
11. Institute of Medicine. Coverage Matters: Insurance and Health Care. Washington, DC: National Academy Press; 2001.
12. Starfield B, Shi L. The medical home, access to care, and insurance: a review of evidence. Pediatrics. 2004;113:1493–1498.
13. Lambrew J, DeFriese G, Carey, T et al. The effects of having a regular doctor on access to primary care. Med Care. 1996;34:1493–1498.
References 71
50. Office of Minority Health. National standards for culturally and linguistically appropriate services in health care. 2001. Available at http://minorityhealth.hhs.gov/assets/pdf/checked/finalreport.pdf. Accessed Feb-ruary 18, 2011.
51. Dartmouth Atlas Project. Health care spending, quality, and out-comes: more isn’t always better. 2009. Available at http://www.dartmouth atlas .org/downloads/reports/Spending_Brief_022709.pdf. Accessed Feb-ruary 18, 2011.
52. Reschovsky JD, Hadley J, Saiontz-Martinez CB, Boukus ER. Follow-ing the money: factors associated with the cost of treating high-cost Medicare beneficiaries. Health Serv Res. 2010;1–25. Available at http://www.hschange .com/CONTENT/1185/1185.pdf. Accessed February 22, 2011.
53. Wooldhandler S, Campbell T, Himmelstein DU. Costs of health care administration in the US and Canada. New Engl J Med. 2003;349:768–775.
54. Bodenheimer T. High and rising health care costs, Part 2: techno-logical innovation. Ann Internal Med. 2005;142:932–937.
55. Institute of Medicine. Unequal Treatment: Confronting Racial and Ethnic Disparities in Health Care. Washington, DC: National Academics of Sciences; 2003, 2–3.
56. Centers for Disease Control and Prevention. Highlights in minority health and health disparities. 2010. Available at http://www.cdc.gov/omhd /Highlights/2010/HSeptOct10.html. Accessed February 18, 2011.
57. Centers for Disease Control and Prevention. MMR Weekly Report—Health disparities experienced by Hispanics, United States. 2004. Available at http://www.cdc.gov/mmwr/preview/mmwrhtml/mm5340a1.htm. Accessed February 18, 2011.
58. Shi L, Singh DA. Delivering Health Care in America: A Systems Ap-proach. 4th ed. Boston, MA: Jones and Bartlett Publishers; 2008.
59. Schabloski AK. Health care systems around the world. Insure the uninsured project. 2008. Available at http://www.itup.org/Reports/Fresh% 20Thinking/Health_Care_Systems_Around_World.pdf. Accessed July 19, 2011.
60. Canadian Institute for Health Information. Health care spending to reach $192 billion this year. Available at http://www.cihi.ca/CIHI-ext-portal/internet/en/Document/spending+and+health+workforce/spending/RELEASE_28OCT10. Accessed March 2, 2011.
61. National Audit Office. Briefing for the House of Commons Health Select Committee—Health Resource Allocation. London, England: 2010. Available at http://www.nao.org.uk/publications/1011/health_resource _ allocation.aspx. Accessed March 2, 2011.
62. HealthCare Economist. April 23, 2008. Available at http://health care-economist.com/2008/04/23/health-care-around-the-world-great- britain/. Accessed March 2, 2011.
63. Kirschbaum E. Germany passes unpopular health reform. Reuters. November 12, 2010. Available at http://www.reuters.com/article/2010/11/12/us- germany-health care-reform-idUSTRE6AB3TL20101112. Accessed March 4, 2011.
64. Schoen C, Osborne R, Doty MM, Pierson R, Applebaum S. How health insurance design affects access to care and costs, by income, in eleven countries. Health Affairs. 2010;29(12):2323–2334.
33. National Association of Community Health Centers. Access denied: A look at America’s medically disenfranchised. 2007. Available at http://www .nachc.com/access-reports.cfm. Accessed July 19, 2011.
34. National Conference of State Legislatures. Primary care workforce. Available at http://www.ncsl.org/default.aspx?tabid=21702. Accessed Feb-ruary 11, 2011.
35. U.S. Census. National population projections, 2008. Available at http://www.census.gov/population/www/projections/summarytables.html. Accessed February 11, 2011.
36. Centers for Disease Control and Prevention. NCHS data brief: Popu-lation aging and the use of office-based physician services. Available at http://www.cdc.gov/nchs/data/databriefs/db41.htm#ref1. Accessed February 11, 2011.
37. O’Neill G, Barry PP. Training physicians in geriatric care: Re-sponding to critical need. Public Policy and Aging Report. 2000;13(2):17–21. Available at http://www.agingsociety.org/agingsociety/pdf/trainging.pdf . Accessed February 11, 2011.
38. Many children lack doctor, study finds. New York Times. December 19, 2010. Available at http://www.nytimes.com/2010/12/20/us/20doctors .html. Accessed February 15, 2011.
39. Rosenblatt RA, Chen FM, Lishner DM, Doescher MP. The future of family medicine and implications of future rural primary care physi-cian supply. Rural Health Research Center. 2010. Available at http://depts .washington.edu/uwrhrc/uploads/RHRC_FR125_Rosenblatt.pdf. Accessed February 15, 2011.
40. Florell ML. Rural health care workforce: opportunities to improve care delivery. Center for Rural Affairs. 2009. Available at http://files.cfra.org/pdf /Health care_Workforce.pdf. Accessed February 15, 2011.
41. United States faces dentist shortage. Canadian Med Assoc J. 2009;181(11):E253–E254.
42. US Department of Health and Human Services. The public health workforce: an agenda for the 21st century. Available at http://www.health .gov/phfunctions/pubhlth.pdf. Accessed February 15, 2011.
43. Association of Schools of Public Health. Confronting the public health workforce crisis. 2008. Available at http://www.asph.org/UserFiles /WorkforceShortage2008Final.pdf. Accessed February 15, 2011.
44. Organisation for Economic Co-operation and Development. OECD health at a glance, 2009: key findings for the United States. Available at http://www.oecd.org/document/21/0,3746,en_2649_37407_44219221_1_1_1_37407,00.html. Accessed February 15, 2011.
45. Centers for Disease Control and Prevention. NCHS Data Brief. Behind international rankings of infant mortality: how the United States compares with Europe. 2009. Available at http://www.cdc.gov/nchs/data /databriefs/db23.htm. Accessed February 15, 2011.
46. McGlynn EA, Asch SM, Adams J. The quality of health care delivered to adults in the United States. New Engl J Med. 2003;348:2635–2645.
47. Institute of Medicine. Crossing the Quality Chasm: A New Health System for the 21st Century. Washington, DC: National Academy of Sci-ences; 2001.
48. Institute of Medicine. To Err is Human: Building a Safer Health Care System. Washington, DC: National Academy of Sciences; 2000.
49. Speaking Together. Addressing language barriers in health care: what’s at stake. 2007. Available at http://www.rwjf.org/files/research / stissuebriefmarch07.pdf. Accessed February 18, 2011.
72 chapter 4 Overview of the United States Healthcare System