overview of uml diagrams
DESCRIPTION
UML DiagTRANSCRIPT

Training Material

December 6, 2009
Overview of UML Diagrams
ISU Name: Hi Tech
Name of the project: Numonyx
Name of the author: Alok
Kumar Suman
Date Created:
2nd
Jan, 2010
December 6, 2009
What is UML
UML stands for Unified Modeling Language. This object- oriented system of notation has evolved from the work of Grady Booch, James Rumbaugh, Ivar Jacobson, and the Rational Software Corporation.

December 6, 2009
Types of UML Diagrams
UML defines mainly nine types of diagrams. These are-
• Class (package) Diagrams• Object Diagrams• Use case Diagrams• Sequence Diagrams• Collaboration Diagrams• State chart Diagrams• Activity Diagrams• Component Diagrams• Deployment Diagrams

December 6, 2009
Class (package) Diagrams
Class diagrams are the backbone of almost every object oriented method, including UML. They describe the static structure of a system.
The class diagram shows how the different entities (people, things, and data) relate to each other; in other words, it shows the static structures of the system.

December 6, 2009
Basic Class Diagram Symbols and Notations(1)
Classes
Illustrate classes with rectangles divided into compartments. Place the name of the class in the first partition (centered, bolded, and capitalized), list the attributes in the second partition, and write operations into the third.
December 6, 2009
Basic Class Diagram Symbols and Notations(2)
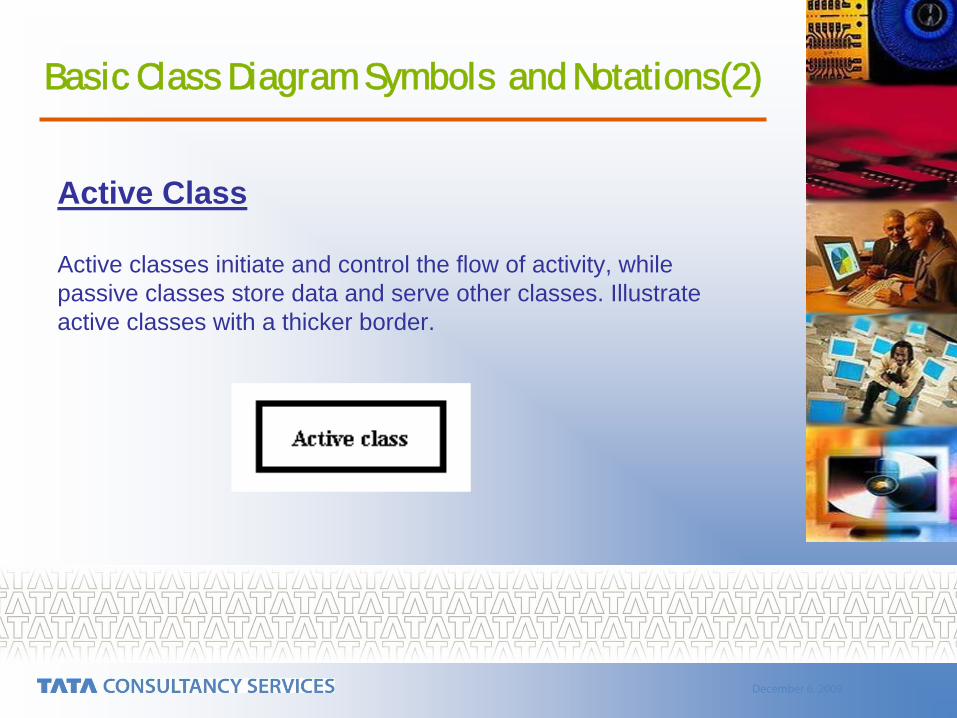
Active Class
Active classes initiate and control the flow of activity, while passive classes store data and serve other classes. Illustrate active classes with a thicker border.

December 6, 2009
Basic Class Diagram Symbols and Notations(3)
Visibility
Private visibility hides information from anything outside theclass partition. Public visibility allows all other classes toview the marked information. Protected visibility allows childclasses to access information they inherited from a parentclass.
December 6, 2009
Basic Class Diagram Symbols and Notations(4)
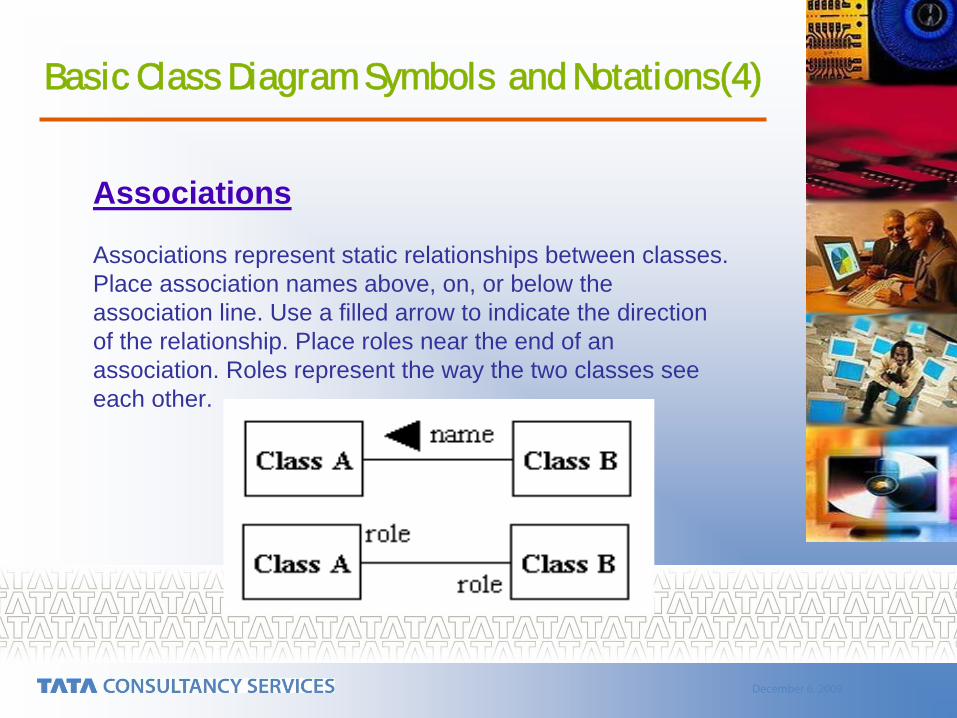
Associations
Associations represent static relationships between classes. Place association names above, on, or below the association line. Use a filled arrow to indicate the direction of the relationship. Place roles near the end of an association. Roles represent the way the two classes see each other.

December 6, 2009
Basic Class Diagram Symbols and Notations(5)
Multiplicity(Cardinality)
Place multiplicity notations near the ends of an association. These symbols indicate the number of instances of one class linked to one instance of the other class. For example, one company will have one or more employees, but each employee works for one company only.

December 6, 2009
Basic Class Diagram Symbols and Notations(6)
Constraint
Place constraints inside curly braces {}.
December 6, 2009
Basic Class Diagram Symbols and Notations(7)
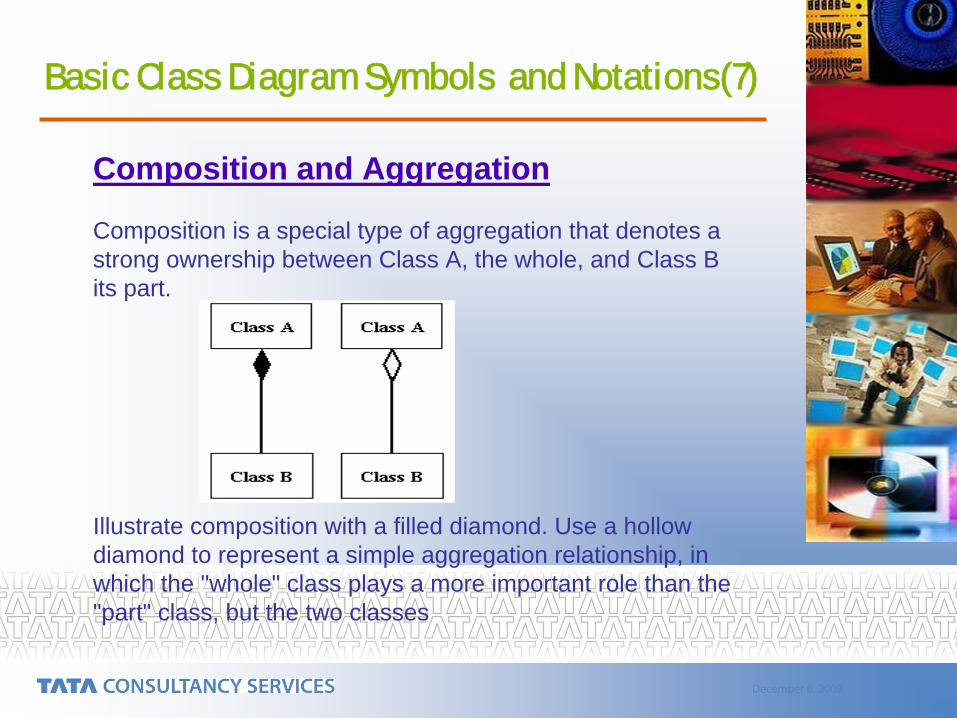
Composition and Aggregation
Composition is a special type of aggregation that denotes a strong ownership between Class A, the whole, and Class Bits part.
Illustrate composition with a filled diamond. Use a hollow diamond to represent a simple aggregation relationship, in which the "whole" class plays a more important role than the "part" class, but the two classes

December 6, 2009
Basic Class Diagram Symbols and Notations(8)
Generalization
Generalization is another name for inheritance or an "is a" relationship. It refers to a relationship between two classes where one class is a specialized version of another. For example, Honda is a type of car. So the class Honda would have a generalization relationship with the class car.

December 6, 2009
Points to be Noted
In real life coding examples, the difference between inheritance and aggregation can be confusing. If you have an aggregation relationship, the aggregate (the whole) can access only the PUBLIC functions of the part class. On the other hand, inheritance allows the inheriting class to access both the PUBLIC and PROTECTED functions of the super class.
Generalization will have "is a" relationship & Aggregation will have “has a” relationship.

December 6, 2009
Package Diagrams
Package diagrams are a subset of class diagrams.
Package to diagrams organize the elements of a system into related groups minimize dependencies among them.

December 6, 2009
Basic Package Diagram Symbols and Notations(1)
Packages
Use a tabbed folder to illustrate packages. Write the nameof the package on the tab or inside the folder. Similar to classes, you can also list the attributes of a package.
December 6, 2009
Basic Package Diagram Symbols and Notations(2)
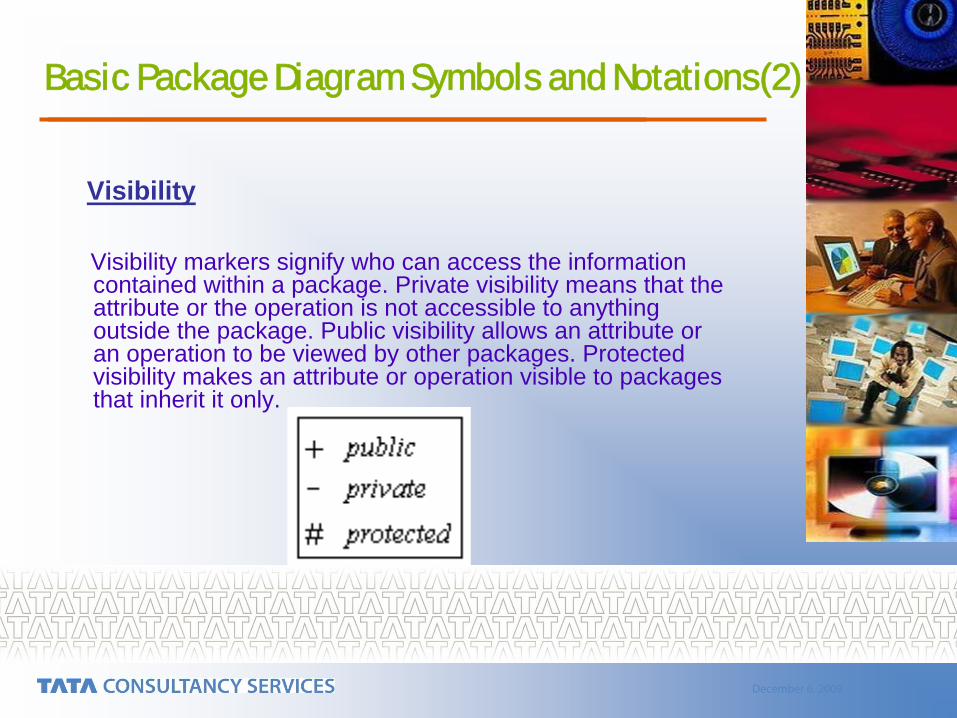
Visibility
Visibility markers signify who can access the information contained within a package. Private visibility means that the attribute or the operation is not accessible to anything outside the package. Public visibility allows an attribute or an operation to be viewed by other packages. Protected visibility makes an attribute or operation visible to packages that inherit it only.

December 6, 2009
Basic Package Diagram Symbols and Notations(3)
Dependency
Dependency defines a relationship in which changes to one package will affect another package. Importing is a type of dependency that grants one package access to the contents of another package.
December 6, 2009
Object Diagrams
Object diagrams are also closely linked to class diagrams. Just as an object is an instance of a class, an object diagram could be viewed as an instance of a class diagram. Object diagrams describe the static structure of a system at a particular time andthey are used to test the accuracy of class diagrams.

December 6, 2009
Basic Object Diagram Symbols and Notations(1)
Object names
Each object is represented as a rectangle, which contains the name of the object and its class underlined and separated by a colon.

December 6, 2009
Basic Object Diagram Symbols and Notations(2)
Object attributes
As with classes, you can list object attributes in a separate compartment. However, unlike classes, object attributes must have values assigned to them.

December 6, 2009
Basic Object Diagram Symbols and Notations(3)
Active object
Objects that control action flow are called active objects.Illustrate these objects with a thicker border.

December 6, 2009
Basic Object Diagram Symbols and Notations(4)
Multiplicity
One can illustrate multiple objects as one symbol if the attributes of the individual objects are not important.

December 6, 2009
Basic Object Diagram Symbols and Notations(5)
Links
Links are instances of associations. You can draw a link usingthe lines used in class diagrams.

December 6, 2009
Basic Object Diagram Symbols and Notations(6)
Self-linked
Objects that fulfill more than one role can be self-linked. Forexample, if Mark, an administrative assistant, also fulfilled the role of a marketing assistant, and the two positions are linked,Mark's instance of the two classes will be self-linked.

December 6, 2009
Use Case Diagrams
Use case diagrams model the functionality of system using actors and use cases . Use cases are services or functions provided by the system to its users.A use case illustrates a unit of functionality provided by the system.The main purpose of the use-case diagram is to help development teams visualize the functional requirements of a system, including the relationship of "actors" (human beings who will interact with the system) to essential processes, as well as the relationships among different use cases.

December 6, 2009
Basic Use Case Diagram Symbols and Notations(1)
System
Draw your system's boundaries using a rectangle that containsuse cases. Place actors outside the system's boundaries..
December 6, 2009
Basic Use Case Diagram Symbols and Notations(2)
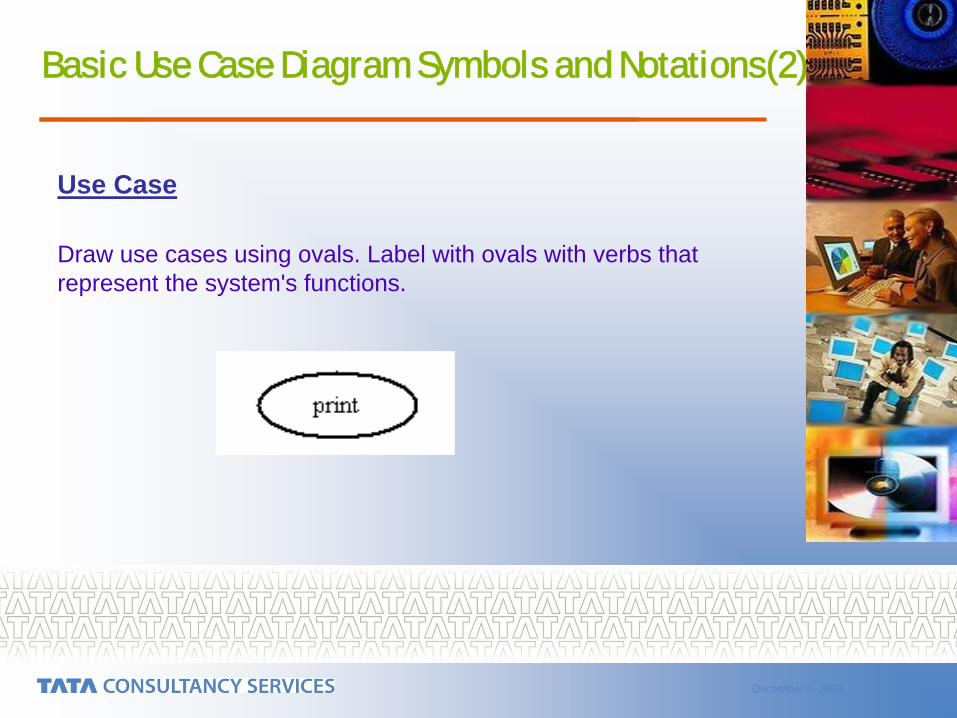
Use Case
Draw use cases using ovals. Label with ovals with verbs thatrepresent the system's functions.

December 6, 2009
Basic Use Case Diagram Symbols and Notations(3)
Actors
Actors are the users of a system. When one system is the actorof another system, label the actor system with the actor stereotype.
December 6, 2009
Basic Use Case Diagram Symbols and Notations(4)
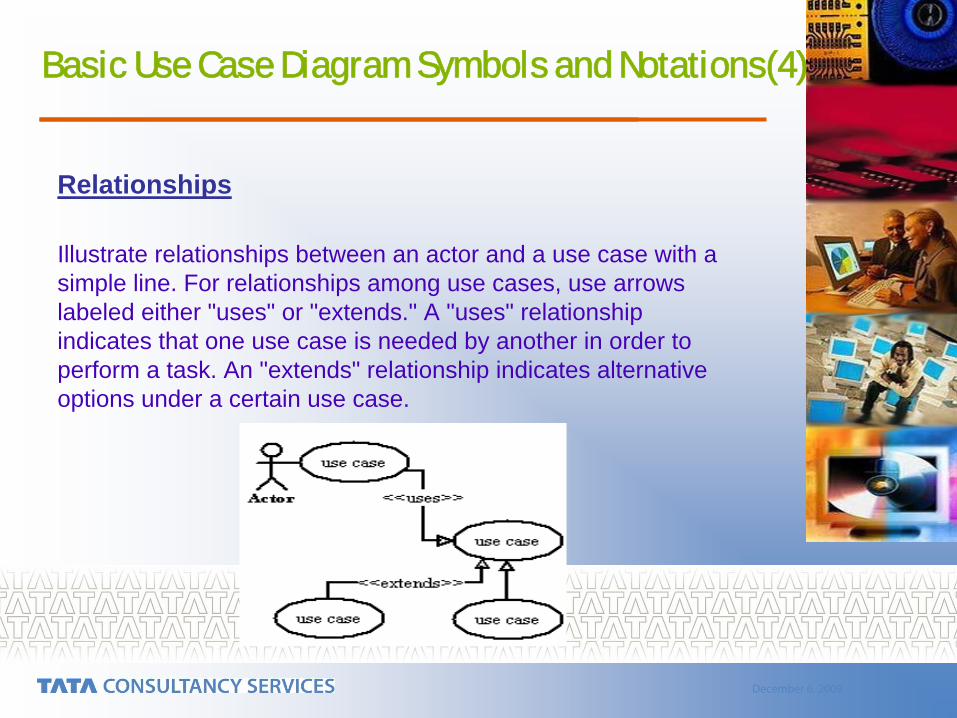
Relationships
Illustrate relationships between an actor and a use case with a simple line. For relationships among use cases, use arrows labeled either "uses" or "extends." A "uses" relationship indicates that one use case is needed by another in order to perform a task. An "extends" relationship indicates alternative options under a certain use case.

December 6, 2009
Sequence Diagrams
Sequence diagrams describe interactions among classes in terms of an exchange of messages over time.
A sequence diagram has two dimensions: The vertical dimension shows the sequence of messages/calls in the time order that they occur; the horizontal dimension shows the object instances to which the messages are sent.

December 6, 2009
Basic Sequence Diagram Symbols and Notations(1)
Class roles
Class roles describe the way an object will behave in context. Use the UML object symbol to illustrate class roles, but don't list object attributes.

December 6, 2009
Basic Sequence Diagram Symbols and Notations(2)
Activation
Activation boxes represent the time an object needs to complete a task.
December 6, 2009
Basic Sequence Diagram Symbols and Notations(3)
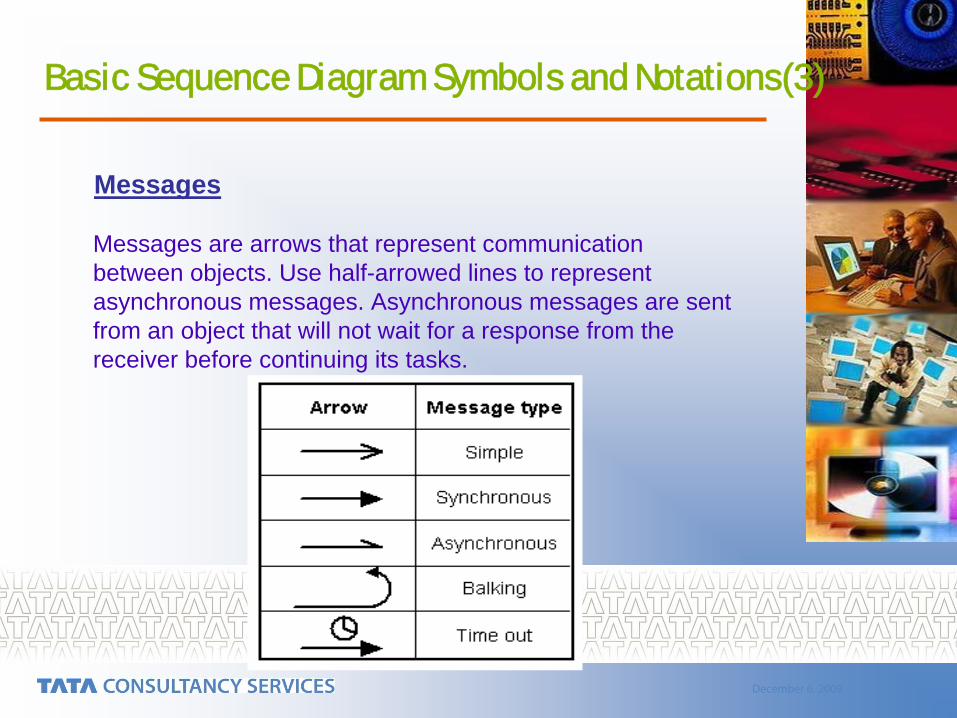
Messages
Messages are arrows that represent communicationbetween objects. Use half-arrowed lines to represent asynchronous messages. Asynchronous messages are sent from an object that will not wait for a response from the receiver before continuing its tasks.
December 6, 2009
Basic Sequence Diagram Symbols and Notations(4)
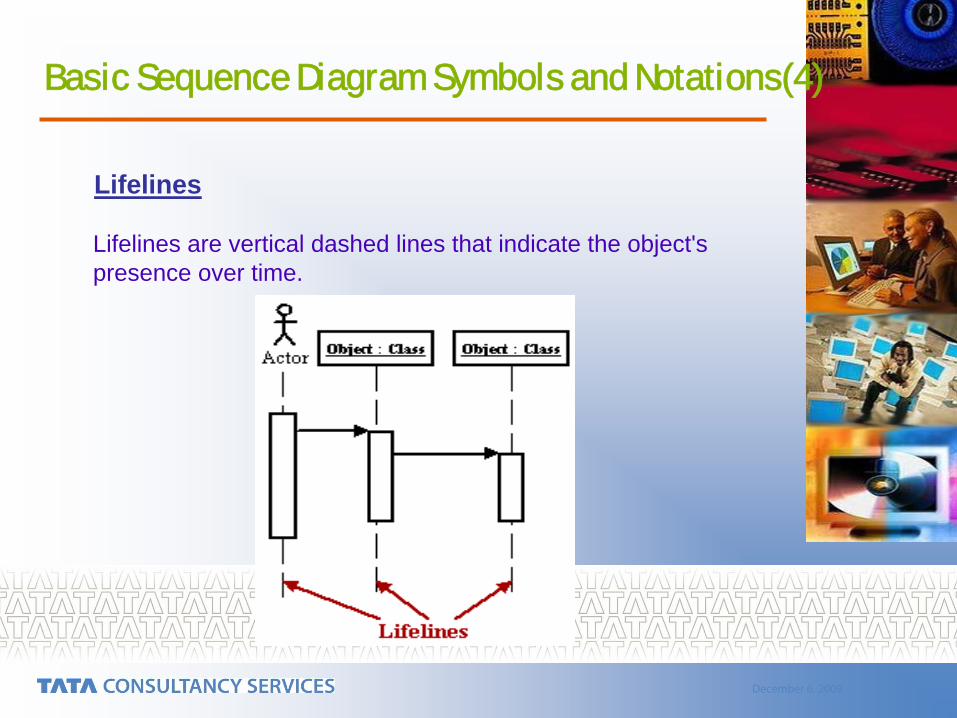
Lifelines
Lifelines are vertical dashed lines that indicate the object'spresence over time.

December 6, 2009
Basic Sequence Diagram Symbols and Notations(5)
Destroying Objects
Objects can be terminated early using an arrow labeled "< < destroy > >" that points to an X.

December 6, 2009
Basic Sequence Diagram Symbols and Notations(6)
Loops
A repetition or loop within a sequence diagram is depicted as a rectangle. Place the condition for exiting the loop at the bottom left corner in square brackets [ ].
December 6, 2009
Collaboration Diagrams
A collaboration diagram describes interactions among objects in terms of sequenced messagesCollaboration diagrams represent a combination of information taken from class, sequence and use case diagrams describing both the static structure and dynamic behavior of a system.
December 6, 2009
Basic Collaboration Diagram Symbols and Notations(1)
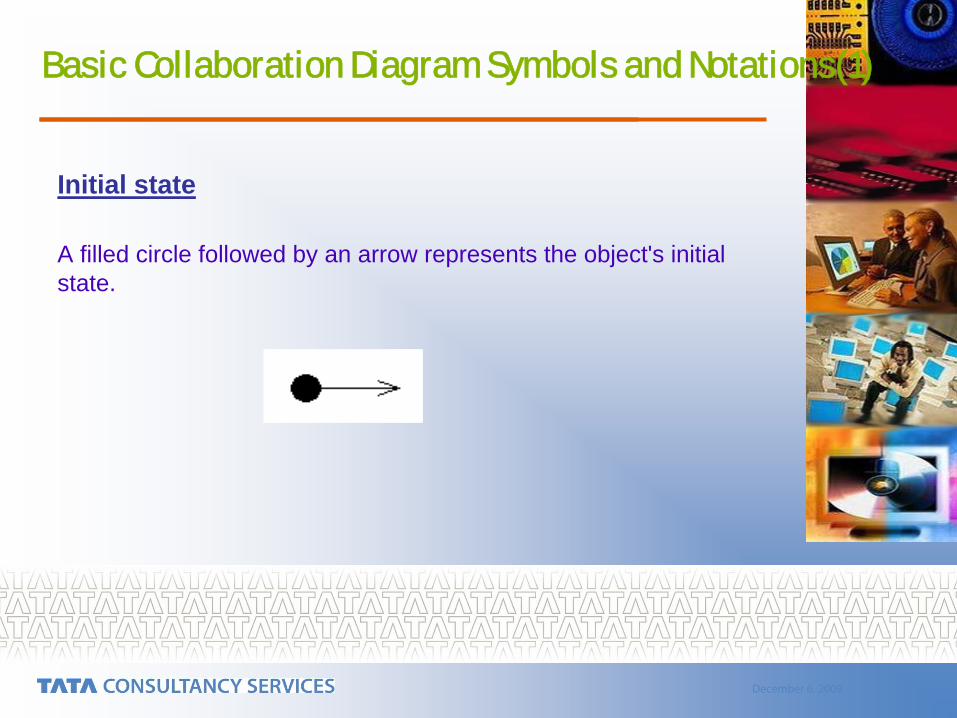
Initial state
A filled circle followed by an arrow represents the object's initial state.

December 6, 2009
Basic Collaboration Diagram Symbols and Notations(2)
Final State
An arrow pointing to a filled circle nested inside another circle represents the object's final state. ..

December 6, 2009
Basic Collaboration Diagram Symbols and Notations(3)
Synchronization and Splitting of Control
A short heavy bar with two transitions entering it represents asynchronization of control. A short heavy bar with twotransitions leaving it represents a splitting of control that creates multiple states.

December 6, 2009
Basic Collaboration Diagram Symbols and Notations(4)
Class Roles
Class roles describe how objects behave. Use the UML object symbol to illustrate class roles, but don't list object attributes.

December 6, 2009
Basic Collaboration Diagram Symbols and Notations(5)
Association Roles
Association roles describe how an association will behave given a particular situation. You can draw association roles using simple lines labeled with stereotypes. .

December 6, 2009
Basic Collaboration Diagram Symbols and Notations(6)
Messages
Unlike sequence diagrams, collaboration diagrams do not have an explicit way to denote time and instead number messages in order of execution. Sequence numbering can become nested using the Dewey decimal system. For example, nested messages under the first message are labeled 1.1, 1.2, 1.3, and so on. A condition for a message is usually placed in square brackets immediately following the sequence number. Use a * after the sequence number to indicate a loop.
December 6, 2009
State Chart Diagrams
A state chart diagram shows the behavior of classes in response to external stimuli. This diagram models the dynamic flow of control from state to state within a system.
The state chart diagram models the different states that a class can be in and how that class transitions from state to state. It can be argued that every class has a state, but that every class shouldn't have a state chart diagram.
December 6, 2009
Basic State Chart Diagram Symbols and Notations(1)
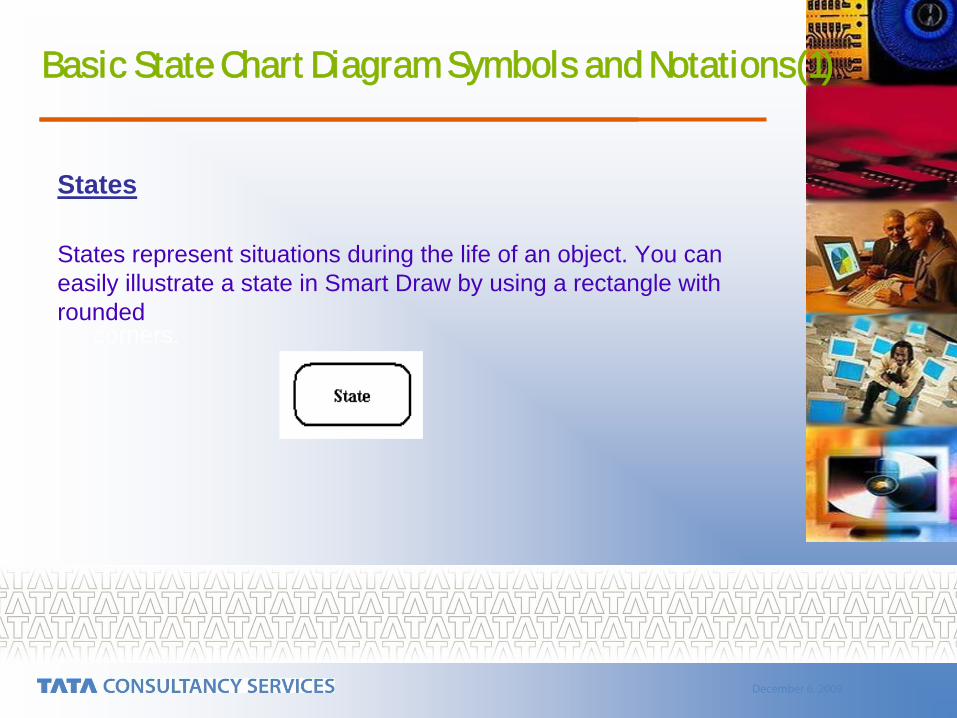
States
States represent situations during the life of an object. You can easily illustrate a state in Smart Draw by using a rectangle with rounded
corners.
December 6, 2009
Basic State Chart Diagram Symbols and Notations(2)
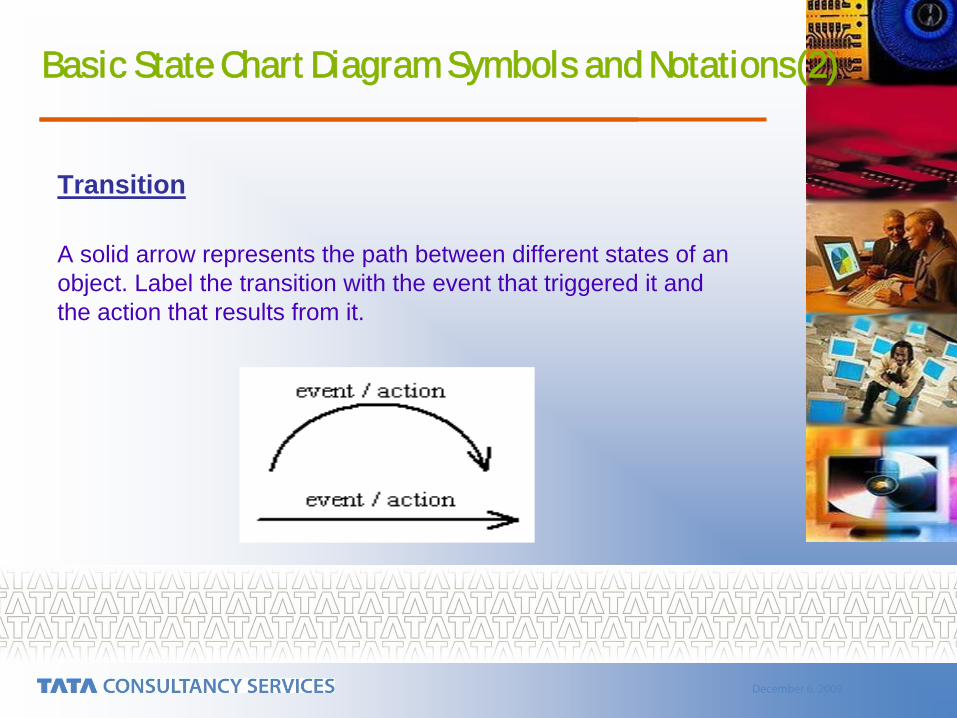
Transition
A solid arrow represents the path between different states of anobject. Label the transition with the event that triggered it and the action that results from it.

December 6, 2009
Activity Diagrams
An activity diagram illustrates the dynamic nature of a system by modeling the flow of control from activity to activity. An activity represents an operation on some class in the system that results in a change in the state of the system.Activity diagrams show the procedural flow of control between two or more class objects while processing an activity.Activity diagrams are best used to model higher-level processes, such as how the company is currently doing business, or how it would like to do business.
December 6, 2009
Note:-
An activity diagram is a special kind of state chart diagram, it uses some of the same modeling conventions.Typically, activity diagrams are used to model workflow or business processes and internal operation.
December 6, 2009
Basic Activity Diagram Symbols and Notations(1)
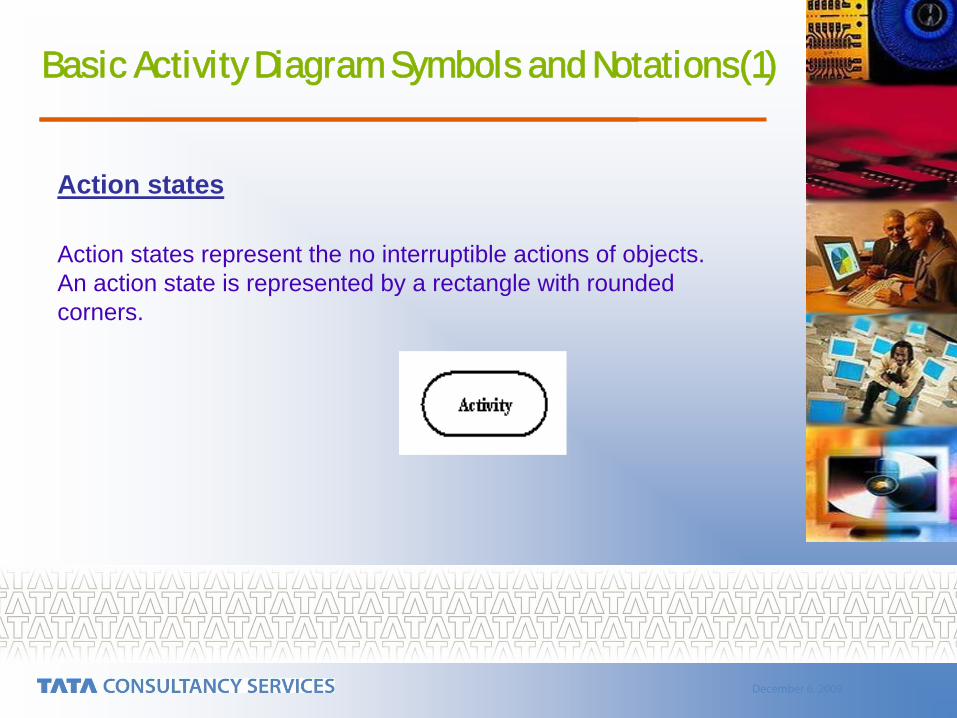
Action states
Action states represent the no interruptible actions of objects.An action state is represented by a rectangle with rounded corners.
December 6, 2009
Basic Activity Diagram Symbols and Notations(2)
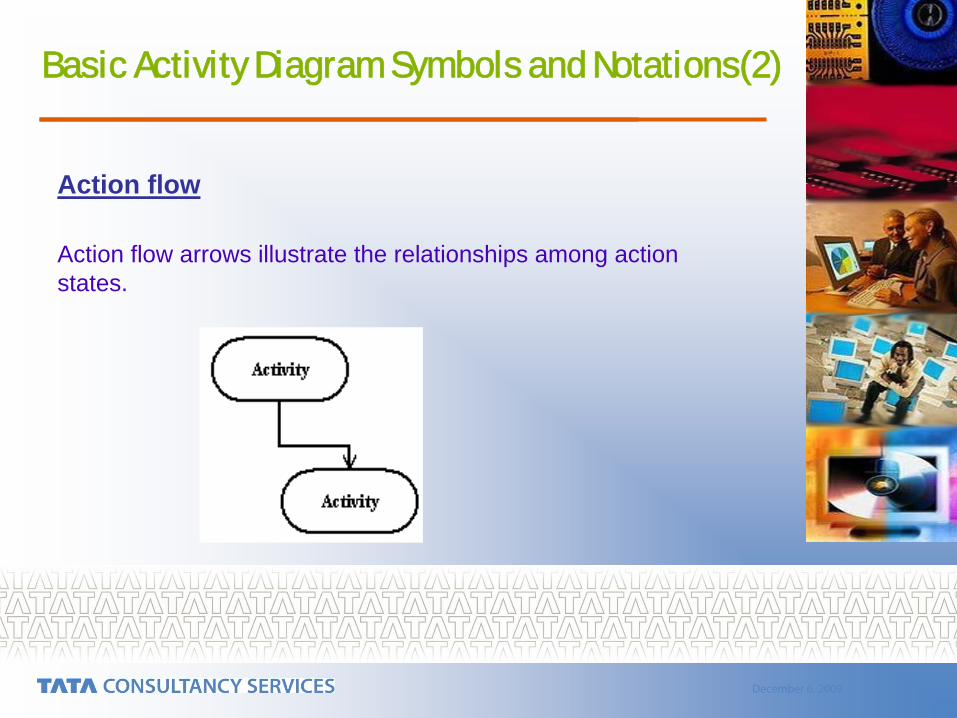
Action flow
Action flow arrows illustrate the relationships among action states.

December 6, 2009
Basic Activity Diagram Symbols and Notations(3)
Object Flow
An Object flow refers to the creation and modification of objects by activities. An object flow arrow from an action to an object means that the action creates or influences the object. An object flow arrow from an object to an action indicates that theaction state uses the object.

December 6, 2009
Basic Activity Diagram Symbols and Notations(4)
Branching
A diamond represents a decision with alternate paths. The outgoing alternates should be labeled with a condition or guard expression. You can also label one of the paths "else."

December 6, 2009
Basic Activity Diagram Symbols and Notations(5)
Synchronization
A synchronization bar helps illustrate parallel transitions. Synchronization is also called forking and joining.

December 6, 2009
Component Diagrams
A component diagram describes the organization of the physical components in a system. A component diagram provides a physical view of the system. Its purpose is to show the dependencies that the software has on the other software components (e.g., software libraries) in the system.

December 6, 2009
Basic Component Diagram Symbols and Notations(1)
Component
A component is a physical building block of the system. It is represented as a rectangle with tabs.

December 6, 2009
Basic Component Diagram Symbols and Notations(2)
Interface
An interface describes a group of operations used or created by components.

December 6, 2009
Basic Component Diagram Symbols and Notations(3)
Dependencies
One can draw dependencies among components using dashed arrows.

December 6, 2009
Deployment Diagrams
Deployment diagrams depict the physical resources in a system including nodes, components, and connections.The deployment diagram shows how a system will be physically deployed in the hardware environment.Its purpose is to show where the different components of the system will physically run and how they will communicate with each other.

December 6, 2009
Basic Deployment Diagram Symbols and Notations(1)
Node
A node is a physical resource that executes code components

December 6, 2009
Basic Deployment Diagram Symbols and Notations(2)
Association
Association refers to a physical connection between nodes, such as Ethernet.
December 6, 2009
Basic Component Diagram Symbols and Notations(3)
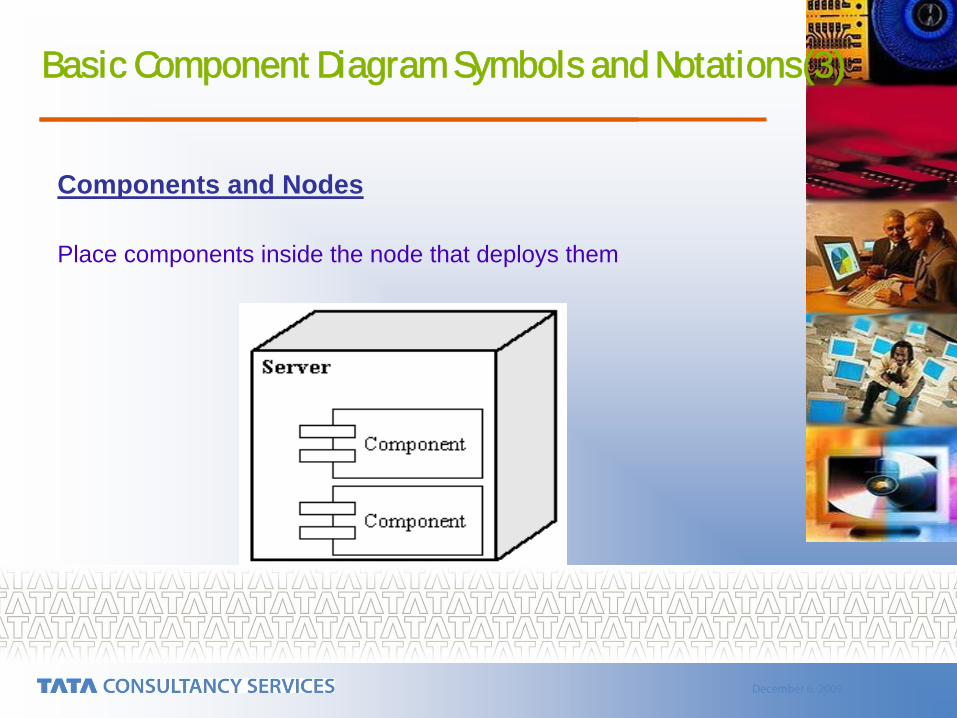
Components and Nodes
Place components inside the node that deploys them

December 6, 2009
Thank You