overview of upstream industry
DESCRIPTION
GTHGFTRANSCRIPT

Overview of Upstream Industry
Additional Lecture

Outline
• Oil & Gas Industry – Overview of Upstream Sector
• A Glimpse of Unconventional Gas

1
2
3
4
5 6 7
8 9
10
Major Oil Producers
Vide – Price Waterhouse Cooper

1
2 3
4
5
6
7 8
9
Major Gas Producers
Vide – Price Waterhouse Cooper

Indonesia – Top 5 Players
Total Indonesie Chevron ExxonMobil ConocoPhillips British Petroleum
International
Pertamina
MedcoEnergi
Energi Mega Persada Star Energy BOB Bumi Siak Pusako
Domestic

Oil & Gas Industry
Production
Pipelines
Exploration
& Production
Shipment EXPORT UPSTREAM
LNG / LPG Plant
Oil / Gas
REFINERY
Gasoline Station
TRANSPORTATION
DOWN STREAM
Fuel
End Users
Fuel
Distribution
Fertilizer / Electricity

Upstream – Business Process
Exploration – searching for new oil / gas
• Seismic Survey / Prospecting
• Exploration Drilling
Exploitation – oil / gas production
• Development Drilling
• Processing Facilities
• Gathering Stations
Transportation – to delivery point
• Pipelines
• Truck, Barge, Ship (OIL / CNG / LNG)
8 – 10
Years

Page 8
• Onshore
• Offshore
• Transition Zone
Seismic Acquisition & Processing
• Regional mapping
• Prospecting Interpretation
& Mapping
• Drilling wildcat well Exploration
Drilling
• 3D Seismic
• Delineation Drilling Appraisals
Exploration Activities

Page 9
Seismic is the Tool to “see”
Subsurface 2D Seismic
3D Seismic

• Fault traps
• Stratigraphic: – Reservoir pinch-out
– Unconformity
• Combination
Page 10
Various Types of Hydrocarbon “Traps”
Anticline

Associated Gas Non-Associated Gas
Oil & Gas Gas
Oil Reservoir
Oil

Prospect Mapping – best location for drilling

Exploration
Drilling

Exploration Success followed by
Appraisals
• Onshore
• Offshore
• Transition Zone
Seismic Acquisition & Processing
• Regional mapping
• Prospecting
Interpretation & Mapping
• Drilling wildcat well
Exploration Drilling
SUCCESSFUL
WILDCAT
DRILLING
Appraisals • 3D Seismic – better definition of
reservoir
• Delineation Drilling

Exploration Discoveries according to BPMigas
• BEWARE!
• Exploration wells
means wildcat and
appraisal wells
• This does not
show volumes of
discoveries
http://en.indonesiafinancetoday.com/read/28376/Oil-and-Gas-Explorations-Sunk-Cost-Reached-
US-2.4-B-in-2012

Development Phase – Drilling – Processing Facilities – Gathering Station

Cluster System

Gas Processing Sequence
Gas to pipeline
LPG
19 JMA
24803
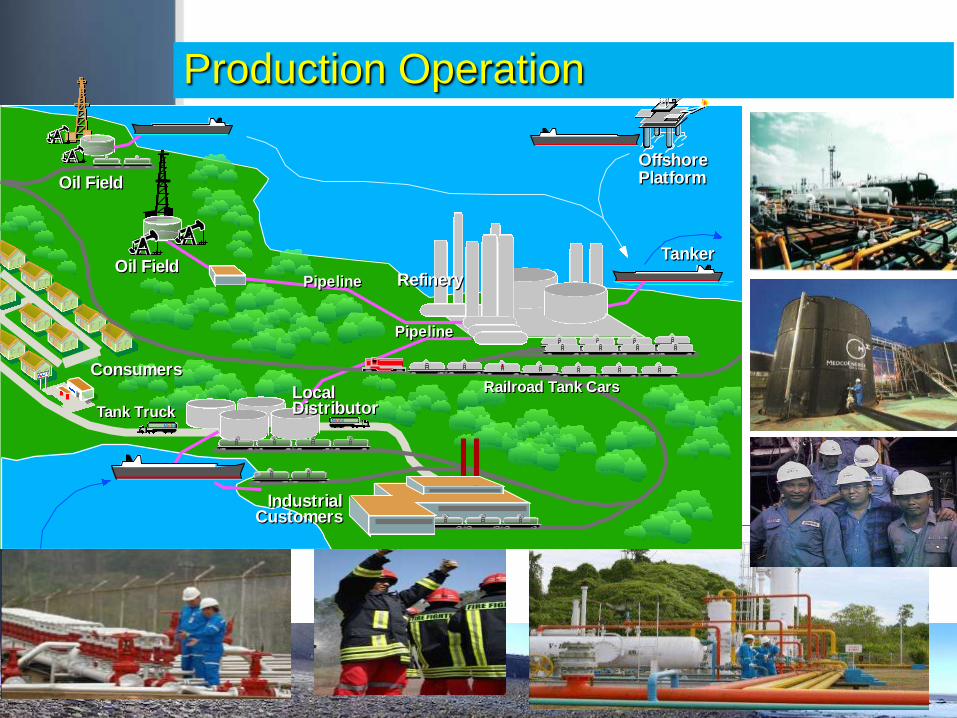
Transporting PetroleumTransporting Petroleum
Oil FieldOil Field
Oil FieldOil FieldPipelinePipeline RefineryRefinery
PipelinePipeline
Railroad Tank CarsRailroad Tank Cars
Mobil
Tank TruckTank Truck
ConsumersConsumers
Industrial Customers
Industrial Customers
Local DistributorLocal Distributor
Mobil
TankerTanker
Offshore PlatformOffshore Platform
Production Operation

Oil Field Maturity • Primary Recovery Phase (10%-35% RF)
– Natural Flow
– Artificial Lift
• Secondary Recovery Phase (up to 50% RF)
– Introduction of Additional Energy to The Reservoir to Push-
out The Fluid
• Enhanced Recovery Phase (up to 80% RF)
– Introduction Of Thermal, Chemicals, Microbe to The
Reservoir
RF = Recovery Factor
Gas Recovery Factor ≈ 60 - 85%

0
200
400
600
800
1.000
1.200
1.400
1.600
1.800
1965 1970 1975 1980 1985 1990 1995 2000 2005 2010
Production
Consumption
Indonesia – Oil Production versus
Consumption (000 bbls/day)
Source - BP
Since 2004 Indonesia
is net oil importer

Indonesia – Oil Reserves (MMBO - million barrels)
0
2.000
4.000
6.000
8.000
10.000
12.000
2001 2003 2005 2007 2009 2011
Proven
Potential
Source - PWC
R/P = 11.1 Years

Indonesia – Gas Production versus
Consumption (billion cubic meters /day)
0
10
20
30
40
50
60
70
80
90
1970 1975 1980 1985 1990 1995 2000 2005 2010
Production
Consumption
Source - BP

Indonesia – Gas Reserves (TCF – trillion cubic feet)
Source - PWC
0
20
40
60
80
100
120
140
160
180
200
2001 2002 2003 2004 2005 2006 2007 2008 2009 2010 2011 2012
Proven
Potential
R/P = 41.2 Years

Unconventional Gas
• Tight Gas Sands
• Coal Bed Methane (Coal Seam
Gas)
• Shale Gas
• Underground Coal Gasification
(UCG)

Unconventional Gas

Underground Coal Gasification

Thank You for
Your Kind Attention