overview of vaccine preventable disease (vpd) … · 8/7/2012 · national center for immunization...
TRANSCRIPT

Sandra W. Roush, MT, MPH Surveillance Officer, CDC/NCIRD
August 7, 2012
NCHS 2012 National Conference on Health Statistics
Overview of Vaccine Preventable Disease (VPD) Surveillance in the United States
National Center for Immunization and Respiratory Diseases Overview of Vaccine Preventable Disease (VPD) Surveillance in the US

Presentation Objectives
Discuss:
• Purpose of vaccine-preventable disease (VPD) surveillance
• Types of surveillance data collected • Surveillance systems/methods • Support for VPD surveillance

Purpose of vaccine-preventable disease (VPD) surveillance
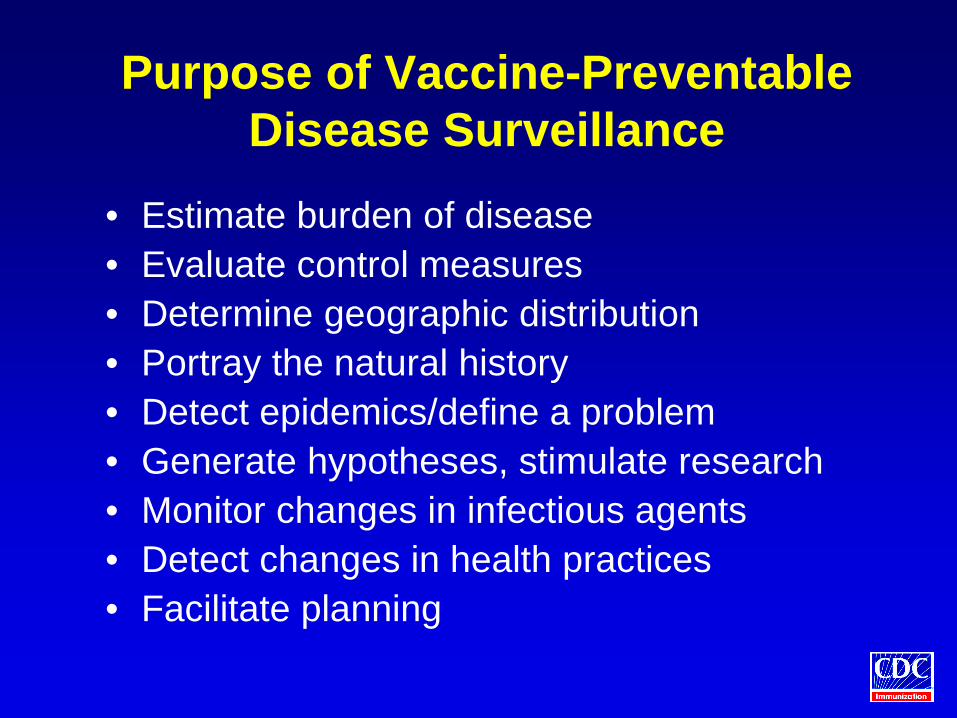
Purpose of Vaccine-Preventable Disease Surveillance
• Estimate burden of disease • Evaluate control measures • Determine geographic distribution • Portray the natural history • Detect epidemics/define a problem • Generate hypotheses, stimulate research • Monitor changes in infectious agents • Detect changes in health practices • Facilitate planning

Comparison of 20th Century Annual Morbidity and Current Morbidity: Vaccine-Preventable Diseases
Disease 20th Century
Annual Morbidity† 2011
Reported Cases † † Percent
Decrease
Smallpox 29,005 0 100% Diphtheria 21,053 0 100% Measles 530,217 212 > 99% Mumps 162,344 370 > 99% Pertussis 200,752 15,216 92% Polio (paralytic) 16,316 0 100% Rubella 47,745 4 > 99% Congenital Rubella Syndrome 152 0 100% Tetanus 580 9 98% Haemophilus influenzae 20,000 8* > 99% †Source: JAMA. 2007;298(18):2155-2163 † † Source: CDC. MMWR January 6, 2012;60(51);1762-1775. (provisional 2011 data) * Haemophilus influenzae type b (Hib) < 5 years of age. An additional 14 cases of Hib are estimated to have occurred among the 237 reports of Hi (< 5 years of age) with unknown serotype.

Comparison of Pre-Vaccine Era Estimated Annual Morbidity with Current Estimate: Vaccine-Preventable
Diseases
Disease Pre-Vaccine Era Annual Estimate
2010 Estimate
Percent Decrease
Hepatitis A 117,333 † 7,138 94% Hepatitis B (acute) 66,232 † 9,428 86% Pneumococcus (invasive)
all ages 63,067 † 39,500 # 37% < 5 years of age 16,069 † 4,400## 73% Rotavirus (hospitalizations,
< 3 years of age) Varicella
62,500 † †
4,085,120 †
2,500###
281,873
96%
93%
† Source: JAMA. 2007;298(18):2155-2163 †† Source: CDC. MMWR. February 6, 2009 / 58(RR02);1-25 # Source: CDC. Active Bacterial Core surveillance Provisional Report; S. pneumoniae 2010. http://www.cdc.gov/abcs/reports-findings/survreports/spneu09.htmll ## Source: 2010 (provisional) Active Bacterial Core surveillance ### Source: New Vaccine Surveillance Network (unpublished)
Types of VPD surveillance data collected
0
50,000
100,000
150,000
200,000
250,000
300,000
1922 1930 1940 1950 1960 1970 1980 1990 2000 2010
Num
ber o
f cas
es
Year
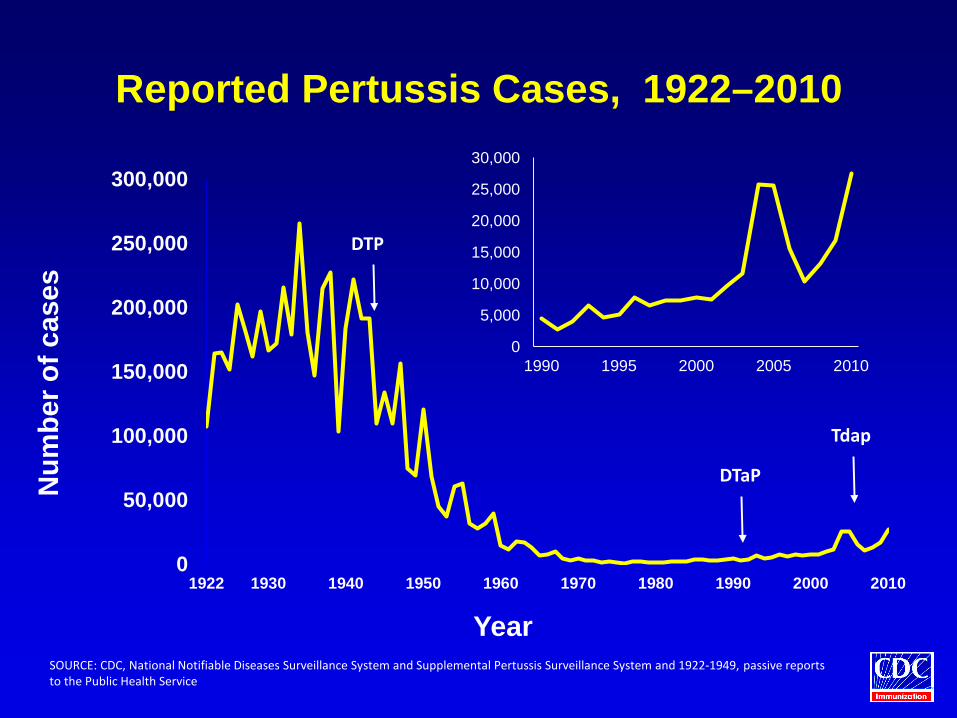
Reported Pertussis Cases, 1922–2010
DTP
0
5,000
10,000
15,000
20,000
25,000
30,000
1990 1995 2000 2005 2010
Tdap
DTaP
SOURCE: CDC, National Notifiable Diseases Surveillance System and Supplemental Pertussis Surveillance System and 1922-1949, passive reports to the Public Health Service

Reported Pertussis Cases by Diagnosis± 1990-2010
0
5000
10000
15000
20000
25000
30000
1990 1995 2000 2005 2010
Num
ber o
f Cas
es
Year
UnknownSero+(MA)Epi-linkedDFAPCRCulture
±Data collection for PCR and Epi-Link began in 1995 Source: CDC, National Notifiable Diseases Surveillance System and Supplemental Pertussis Surveillance System, 2010

Measles Cases, United States, 1962-2011
0
100,000
200,000
300,000
400,000
500,000
600,000
1960 1970 1980 1990 2000 2010
Num
ber o
f cas
es
Year
1989 – 2nd Dose Recommended
0
5,000
10,000
15,000
20,000
25,000
30,000
1985 1990 1995 2000 2005 2010
1963 Vaccine
Licensed 1989-1991
Resurgence
1993 Vaccines for
Children Program
2000 Elimination
Declared

Measles, United States, 2001-2011 Importations by WHO Region
0
10
20
30
40
50
60
70
80
2001 2002 2003 2004 2005 2006 2007 2008 2009 2010 2011
Num
ber o
f Cas
es
Year
UnknownWestern Pacific(WPR)South East Asian(SEAR)European(EUR)Eastern Mediterranean(EMR)African(AFR)American(AMR)
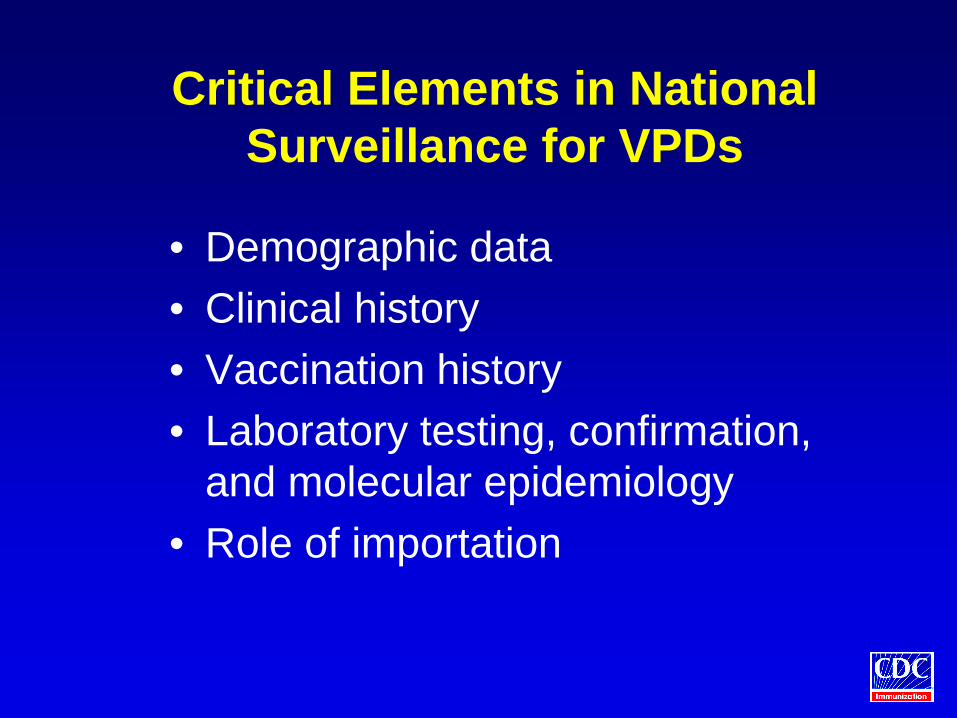
Critical Elements in National Surveillance for VPDs
• Demographic data • Clinical history • Vaccination history • Laboratory testing, confirmation,
and molecular epidemiology • Role of importation

Surveillance systems/methods

VPD Surveillance Data Sources in the U.S. • State-based national passive surveillance
(National Notifiable Disease Surveillance System - NNDSS)
• Sentinel sites with active surveillance • Administrative data reviews (hospital
discharge data and other resources) • Special studies for specific diseases or
conditions • Laboratory-based studies

NNDSS: Case Reporting and Case Notification in the U.S.
Local Health Department
State Health Department
Laboratory reporting
Health Care Provider reporting
CDC • 50 states
• 64 grantees
• > 3,000 counties
notification
States’ Participation in National VPD Surveillance
• List of nationally notifiable diseases from the Council of State and Territorial Epidemiologists (CSTE), with individual state implementation
• Case definitions determined by CSTE, to improve specificity and enhance comparability of cases (suspect, probable, confirmed)
• Laboratory support from Association of Public Health Laboratories (APHL)

National VPD Surveillance Data in the U.S.
• Reporting completeness varies (10%-90%) • Limited federal funding is available specifically
for surveillance • Number of case reports changes related to
disease incidence, but also due to testing technology, state laws, provider awareness

Support for vaccine-preventable disease (VPD) surveillance

Federal Assistance for VPD Surveillance
• Immunization program grant/cooperative agreement and special projects
• Technical assistance – Consultation and epidemiologic response – Standards of practice: Manual for the
Surveillance of Vaccine-Preventable Diseases http://www.cdc.gov/vaccines/pubs/surv-manual/ and Immunization Program Operations Manual
• Laboratory support

Federal Assistance for VPD Surveillance, continued
• Information dissemination – Weekly/annual MMWR surveillance
summaries – Manuscripts and other venues
• Electronic data transmission, including demographic and epidemiologic case information (NETSS, NEDSS)
• Monitoring national surveillance indicators (imported cases, laboratory confirmation, timeliness, completeness, and others)