overview & outlook for p/c insurance focus on michigan markets insurance institute of michigan...
TRANSCRIPT

Overview & Outlook for P/C Insurance
Focus on Michigan MarketsInsurance Institute of Michigan
Boyne Falls, MIJune 19, 2007
Robert P. Hartwig, Ph.D., CPCU, President & Chief EconomistInsurance Information Institute 110 William Street New York, NY 10038
Tel: (212) 346-5520 Fax: (212) 732-1916 [email protected] www.iii.org

Presentation Outline• P/C Profit Overview—2006, A Cyclical Peak
Michigan Markets Overview
• Underwriting Trends: Unsustainable?• Premium Growth: Approaching a Standstill• Pricing: Competitive Pressures Mounting• Capital & Capacity: UnderleveragedROE Pressure• Catastrophe Loss Management
What is the Appropriate Role for Government?
• Reinsurance Summary• Financial Strength & Ratings• Investments: Less Bang for the Buck• Tort System: Great News for a Change (Mostly)• Legislative & Regulatory Update• Q&A

P/C PROFIT:An Historical Perspective
Profits in 2006 ReachedTheir Cyclical Peak

P/C Net Income After Taxes1991-2006 ($ Millions)*
$14,178
$5,840
$19,316
$10,870
$20,598$24,404
$36,819
$30,773
$21,865
-$6,970
$3,046
$30,029
$63,695
$44,155
$20,559
$38,501
-$10,000
$0
$10,000
$20,000
$30,000
$40,000
$50,000
$60,000
$70,000
91 92 93 94 95 96 97 98 99 00 01 02 03 04 05 06
*ROE figures are GAAP; 1Return on avg. Surplus.Sources: A.M. Best, ISO, Insurance Information Inst.
2001 ROE = -1.2%2002 ROE = 2.2%2003 ROE = 8.9%2004 ROE = 9.4%2005 ROE= 10.5%2006 ROAS1 = 14.0%
Though up in 2006, insurer profits are highly volatile (2001 was the industry’s worst year ever). ROEs
generally fall below that of most other industries.

-5%
0%
5%
10%
15%
20%
US P/C Insurers All US Industries
ROE: P/C vs. All Industries 1987–2008E
*2007-08 P/C insurer ROEs are I.I.I. estimates.Source: Insurance Information Institute; Fortune
Andrew Northridge
Hugo Lowest CAT losses in 15 years
Sept. 11
4 Hurricanes
Katrina, Rita, Wilma
P/C profitability is cyclical, volatile and vulnerable

-5%
0%
5%
10%
15%
20%
25%
75 76 77 78 79 80 81 82 83 84 85 86 87 88 89 90 91 92 93 94 95 96 97 98 99 00 01 02 03 04 05 0607
F08
F
Profitability Peaks & Troughs in the P/C Insurance Industry, 1975 – 2008F
*2007-08 P/C insurer ROEs are I.I.I. estimates.Source: Insurance Information Institute; ISO, A.M. Best.
1975: 2.4%
1977:19.0% 1987:17.3%
1997:11.6%
2006:14.0%
1984: 1.8% 1992: 4.5% 2001: -1.2%
10 Years
10 Years 9 Years

Insurance & Reinsurance Stocks: Slow Start in 2007 in P/C, Reins.
10.11%
7.03%
5.77%
1.68%
2.58%
12.86%
6.70%
0.0% 2.0% 4.0% 6.0% 8.0% 10.0% 12.0% 14.0%
S&P 500
Life/Health
Reinsurers
P/C
All Insurers
Multiline
Brokers
Source: SNL Securities, Standard & Poor’s, Insurance Information Institute
Total YTD Returns Through June 15, 2007
P/C insurance, reinsurance stocks lagging on soft market
concerns and worries over 2007 hurricane season

Top Industries by ROE: P/C Insurers Still Underperformed in 2006*
30.7%30.3%
26.4%24.6%
24.2%22.6%
21.8%21.5%
20.9%20.9%
20.5%19.6%19.4%19.1%
14.9%15.4%
31.8%
0% 5% 10% 15% 20% 25% 30% 35%
Oil & Gas Equip., ServicesPetroleum Refining
MetalsFood Services
Household & Pers. ProductsPharmaceuticals
Industrial & Farm EquipmentMining & Crude Oil Prod.
Aerospace & DefenseChemicalsSecurities
Food Consumer Prod.Medical Prod. & Equip.
Specialty RetailersHomebuilders
P/C Insurers (Stock)All Industries: 500 Median
*Excludes #1 ranked Airline category at 65.1% due to special one-time bankruptcy-related factors.Source: Fortune, April 30, 2007 edition; Insurance Information Institute
P/C insurer profitability in 2006 ranked 30th out of 50
industry groups despite renewed
profitabilityP/C insurers
underperformed the All Industry median for the 19th consecutive
year

Advertising Expenditures by P/C Insurance Industry, 1999-2005
$ Billions
$1.736 $1.737 $1.803$1.708
$2.975
$2.111
$1.882
$1.5
$1.7
$1.9
$2.1
$2.3
$2.5
$2.7
$2.9
$3.1
99 00 01 02 03 04 05Source: Insurance Information Institute from consolidated P/C Annual Statement data.
Ad spending by P/C insurers is at a record high, signaling
increased competition

MICHIGAN MARKETS
Growth & Profitability Overview

-5%
0%
5%
10%
15%
20%
25%
93 94 95 96 97 98 99 0 01 02 03 04 05
Michigan US
Growth in Direct Written Premiums: Michigan and US
Source: Insurance Information Institute; NAIC.
Decline in premiums in MI was marginal (-0.50%) in 2004-5 while US was down 2.5%

-5%
0%
5%
10%
15%
20%
25%
91 92 93 94 95 96 97 98 99 00 01 02 03 04 05
US P/C Insurers All US Industries Michigan
ROE: P/C (US & MI) vs. All Industries, 1991–2005*
Source: Insurance Information Institute; NAIC, Fortune. *Latest available.
MI has recently under-performed US P/C insurers.

ROE for Major Commercial Lines in Michigan, 1994 - 2005
5.9%
9.8%
-1.0
%
-0.7
%
2.6%
-8.5
%
1.1%
16.6
%
18.8
%
11.5
%
1.3%
6.3%
10.9
%
26.6
%
-1.7
%
13.8
%
12.2
%
14.2
%
6.6%9.
1%
7.2%
-0.1
%
6.1%
5.2%
-15%
-5%
5%
15%
25%
35%
45%
1994 1995 1996 1997 1998 1999 2000 2001 2002 2003 2004 2005
Commercial Multi-Peril
Commercial Auto
Source: NAIC
Commercial Auto and CMP rebounded in
Michigan in recent years

ROE for Personal Linesin Michigan, 1994 - 2005
12.1% 13.8%
4.7%2.7%
-3.5%
6.1%
-2.2%-4.9%
-29.1%
13.5%
21.4%24.7%
7.2%10.7%
9.0%
-4.1%-5.8%-8.6%
3.3%
-9.3%-14.5%
-6.2%
0.8%
-4.9%
-40%
-30%
-20%
-10%
0%
10%
20%
30%
1994 1995 1996 1997 1998 1999 2000 2001 2002 2003 2004 2005
Personal Auto
Homeowners
Source: NAIC
12-Year Average:
Auto: 4.2% Home: -1.2%

Rates of Return on Net Worth for Homeowners Ins: US vs. MI
Source: NAIC, Insurance Information Institute
-1.7%3.6%
12.4%
5.4% 3.8%
0.8%
-8.6%
-14.5%-9.3%
-29.1%
3.3%
13.5%
21.4%
3.7%
-4.2%-2.8%
1.4%
9.7%
-7.2%
5.4%
-4.9%-4.9%
24.7%
-6.2%
-40%
-30%
-20%
-10%
0%
10%
20%
30%
1994 1995 1996 1997 1998 1999 2000 2001 2002 2003 2004 2005
US
Michigan
Averages: 1994 to 2005
US HO Insurance = 2.46%
Michigan HO Insurance = -1.2%
Will coastal insurers reallocate resources to Midwest/Plains?

Rates of Return on Net Worth for Pvt. Passenger Auto: US vs. MI
Source: NAIC, Insurance Information Institute
11.4% 11.6% 12.1%10.1%
13.3%
11.0%
12.1%10.7%
4.7%
-5.8%-4.1% -3.5%
6.1%
-2.2%2.2%
12.4%
4.1%
9.4%
2.0%
7.7%7.2%
13.8%
2.7%
9.0%
-12%
-7%
-2%
3%
8%
13%
18%
1994 1995 1996 1997 1998 1999 2000 2001 2002 2003 2004 2005
USMichigan
Averages: 1994 to 2005
US PPA Insurance = +8.94%
Michigan PPA Insurance = +4.2%

Rates of Return on Net Worth for Workers Comp: US vs. MI
Source: NAIC, Insurance Information Institute
14.4% 14.3%12.4%
8.8%10.1% 9.6%
17.2%18.6%
11.2%
7.8%9.2%
14.1%
17.6%
11.4%
6.0%
12.8%
2.4%
6.9%
0.2%
4.5%
12.2%
22.7%
13.0%15.8%
-5%
0%
5%
10%
15%
20%
25%
1994 1995 1996 1997 1998 1999 2000 2001 2002 2003 2004 2005
USMichigan
Averages: 1994 to 2005
US WC Insurance = +8.5%
Michigan WC Insurance = +14.2%

Rates of Return on Net Worth for Comm. M-P: US vs. MI
Source: NAIC, Insurance Information Institute
3.7%
7.5% 8.8%5.7%
5.9%
-8.5%
-1.7%
13.8%16.6%
18.8%
26.6%
5.2%3.5% 6.7%
8.9%7.4%
11.2%
-5.5%
1.6%-1.0%
2.6%
9.8%
1.1%-0.7%
-15%
-10%
-5%
0%
5%
10%
15%
20%
25%
30%
1994 1995 1996 1997 1998 1999 2000 2001 2002 2003 2004 2005
USMichigan
Averages: 1994 to 2005
US Comm. M-P Insurance = +5.4%
Michigan Comm. M-P Insurance = +6.9%

Rates of Return on Net Worth for Comm. Auto: US vs. MI
Source: NAIC, Insurance Information Institute
10.1% 9.7%
13.7%11.5%
6.3%5.2%
14.2%14.0%
7.0% 3.9%
1.5%
7.6%
3.5%
10.1%
1.0%
0.1%
10.9%12.2%
-0.1%
6.6%
1.3%
9.1%
6.1%
7.2%
-5%
0%
5%
10%
15%
20%
1994 1995 1996 1997 1998 1999 2000 2001 2002 2003 2004 2005
USMichigan
Averages: 1994 to 2005
US Comm. Auto Insurance = +6.9%
Michigan Comm. Auto Insurance = +7.5%

PP AUTO: 10yr Avg Return on Equity, MI & Nearby States
4.5%
9.0%
10.0%
2.5%
8.4%
9.3%
10.7%
8.8%
0% 2% 4% 6% 8% 10% 12%
Ohio
Indiana
US
Michigan
Wisconsin
Illinois
Iowa
Kentucky
Source: NAIC, Insurance Information Institute
1996-2005

HOME: 10yr Avg Return on Equity, MI & Nearby States
-7.1%
-14.0%
-3.9%
0.5%
-1.2%
-5.2%
2.8%
-0.6%
-15% -10% -5% 0% 5%
Ohio
US
Indiana
Michigan
Wisconsin
Illinois
Iowa
Kentucky
Source: NAIC, Insurance Information Institute
1996-2005

WC: 10yr Avg Return on Equity, MI & Nearby States
5.9%
6.6%
7.2%
13.1%
7.4%
12.6%
6.5%
0% 5% 10% 15%
Indiana
US
Michigan
Wisconsin
Illinois
Iowa
Kentucky
Source: NAIC, Insurance Information Institute
1996-2005

UNDERWRITING
Extremely Strong 2006, Momentum for 2007/08

90
95
100
105
110
115
120
70
71
72
73
74
75
76
77
78
79
80
81
82
83
84
85
86
87
88
89
90
91
92
93
94
95
96
97
98
99
00
01
02
03
04
05
06
07
F0
8F
Combined Ratios
1970s: 100.3
1980s: 109.2
1990s: 107.8
2000s: 102.4*
Sources: A.M. Best; ISO, III *Through 2008E; 103.6 through 2006 actual.
P/C Insurance Combined Ratio, 1970-2008F

115.8
107.4
100.198.3
100.7
92.4
98.696.6
90
100
110
120
01 02 03 04 05 06 07F 08F
P/C Insurance Combined Ratio, 2001-2008F
Sources: A.M. Best; ISO, III. *Estimates/forecasts based on III’s 2007 Early Bird survey.
2005 figure benefited from heavy use of reinsurance which lowered net losses
2006 produced the best underwriting result
since the 91.2 combined ratio in 1949
As recently as 2001, insurers were paying out nearly $1.16 for
every dollar they earned in premiums
2007/8 deterioration due primarily to falling rates, but results still strong assuming
normal CAT activity

87.6
91.2
92.1 92.3 92.4 92.493.1 93.1 93.3
93.0
85
86
87
88
89
90
91
92
93
94
1949 1948 1943 1937 1935 2006 1950 1939 1953 1936
Ten Lowest P/C Insurance Combined Ratios Since 1920
Sources: Insurance Information Institute research from A.M. Best data.
The 2006 combined ratio of 92.4 was the best since the 87.6 combined in 1949
The industry’s best underwriting years are associated with
periods of low interest rates

-55-50-45-40-35-30-25-20-15-10-505
101520253035
75
76
77
78
79
80
81
82
83
84
85
86
87
88
89
90
91
92
93
94
95
96
97
98
99
00
01
02
03
04
05
06
Underwriting Gain (Loss)1975-2006
Source: A.M. Best, Insurance Information Institute
$ B
illi
ons
Insurers earned an underwriting profit of $31.2 billion in 2006, the largest ever but only
the second since 1978. Despite the 2006 underwriting profit, the cumulative
underwriting deficit since 1975 is $419 billion.

110.
3
110.
2
107.
6
103.
9
109.
7
112.
3
111.
1
122.
3
110.
2
102.
5
105.
1
94
102.
0
112.
5
85
90
95
100
105
110
115
120
125
93 94 95 96 97 98 99 00 01 02 03 04 05 06F
Commercial Lines Combined Ratio, 1993-2006E*
Source: A.M. Best; Insurance Information Institute .
Outside CAT-affected lines, commercial
insurance is doing fairly well. Caution is
required in underwriting long-
tail commercial lines.
2006 results will benefited from relatively disciplined underwriting
and low CAT losses
Commercial coverages have exhibited extreme variability. Are current
results anomalous?

103.
9
104.
5
103.
5
104.
9
99.8 10
2.7
104.
5
109.
9
110.
9
105.
3
98.4
94.3 96
.4
91.0
85
90
95
100
105
110
115
93 94 95 96 97 98 99 00 01 02 03 04 05 06F
Personal LinesCombined Ratio, 1993-2006E
Source: A.M. Best; Insurance Information Institute.
A very strong 2006 resulted from favorable frequency & severity
trends and low CAT activity

$1
0.8
$2
2.7
$1
3.9
$9
.9
$8
.0
$5
.0
$2.0$0.4
2.41.9
1.1
0.4
6.5
3.63.5
0.1
$0
$5
$10
$15
$20
$25
2000 2001 2002 2003 2004 2005E 2006E 2007E
Re
se
rve
De
ve
lop
me
nt
($B
)
0
1
2
3
4
5
6
7
Co
mb
ine
d R
ati
o P
oin
ts
PY Reserve Development Combined Ratio Points
Impact of Reserve Changes on Combined Ratio
Source: A.M. Best, Lehman Brothers for years 2005E-2007F
Reserve adequacy has improved substantially
PREMIUM GROWTH
Deceleration in 2006, Even Slower in 2007

-10%
-5%
0%
5%
10%
15%
20%
25%
19
70
19
71
19
72
19
73
19
74
19
75
19
76
19
77
19
78
19
79
19
80
19
81
19
82
19
83
19
84
19
85
19
86
19
87
19
88
19
89
19
90
19
91
19
92
19
93
19
94
19
95
19
96
19
97
19
98
19
99
20
00
20
01
20
02
20
03
20
04
20
05
20
06
20
07
F2
00
8F
20
09
F2
01
0F
Note: Shaded areas denote hard market periods.Source: A.M. Best, Insurance Information Institute
Strength of Recent Hard Markets by NWP Growth*
1975-78 1984-87 2001-04
*2007-10 figures are III forecasts/estimates. 2005 growth of 0.4% equates to 1.8% after adjustment for a special one-time transaction between one company and its foreign parent. 2006-2008 figures from III Groundhog Survey.
2006-2010 (post-Katrina) period could resemble 1993-97
(post-Andrew)
2005: biggest real drop in premium since early 1980s
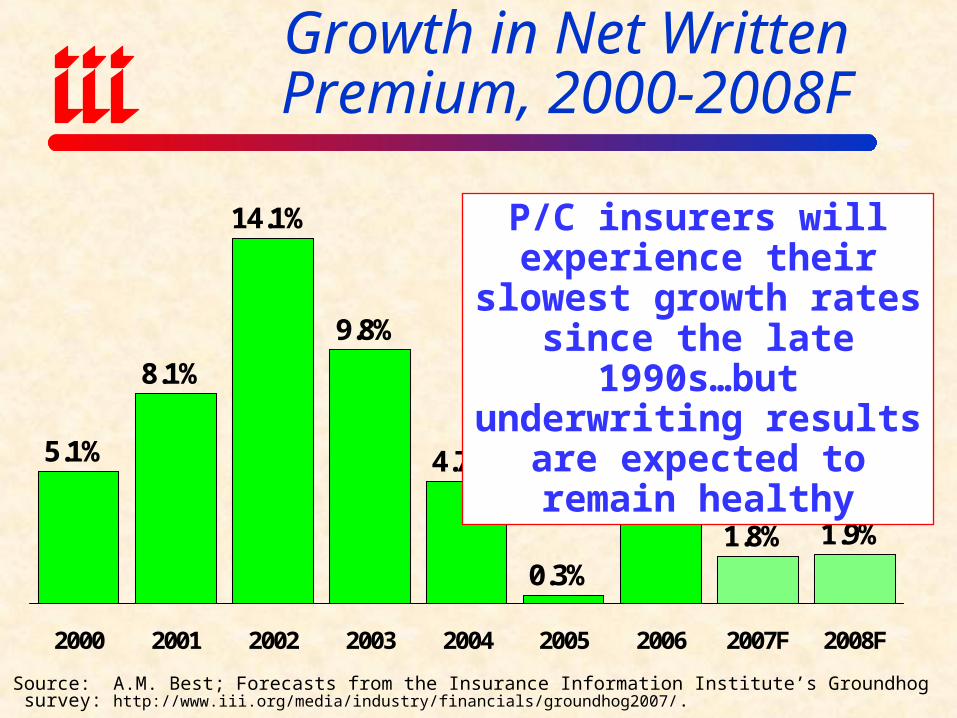
Growth in Net Written Premium, 2000-2008F
Source: A.M. Best; Forecasts from the Insurance Information Institute’s Groundhog survey: http://www.iii.org/media/industry/financials/groundhog2007/.
5.1%
8.1%
14.1%
9.8%
4.7%
0.3%
4.3%
1.8% 1.9%
2000 2001 2002 2003 2004 2005 2006 2007F 2008F
P/C insurers will experience their slowest growth rates since the late 1990s…but underwriting results are
expected to remain healthy

PRICING
Under Pressure in 2007

$651 $6
68 $691 $7
05
$703
$685
$690 $7
24
$780 $8
23 $851
$847
$838
$847
$600
$650
$700
$750
$800
$850
$900
$950
94 95 96 97 98 99 00 01 02 03 04 05* 06* 07*
Average Expenditures on Auto Insurance
*Insurance Information Institute Estimates/ForecastsSource: NAIC, Insurance Information Institute
Countrywide auto insurance expenditures
are expected to fall 0.5% in 2007, the first drop
since 1999
Lower underlying frequency and modest
severity are keeping auto insurance costs in check

Average Homeowners Insurance Expenditure, Selected States, 2004*
Source: NAIC; Insurance Information Institute. *Latest available.
$1,3
62
$1,0
74
$991
$929
$907
$767
$729
$726
$659
$636
$615
$575
$523
$483
$448
$0
$200
$400
$600
$800
$1,000
$1,200
$1,400
$1,600
TX LA OK FL MS MN US MI IL IN KY IA OH WI ID
5 most expensive states are mostly coastal
Most Midwest states have below average home insurance costs.
OH ranks 45th and WI 49th
ID, UT are the least expensive

$418$440 $455
$481 $488 $508$536
$593
$668
$729
$868
$787$835
$400$450$500$550$600$650$700$750$800$850$900
95 96 97 98 99 00 01 02 03 04 05* 06* 07*
Average Expenditures on Homeowners Insurance**
*Insurance Information Institute Estimates/Forecasts**Excludes cost of flood and earthquake coverage.Source: NAIC, Insurance Information Institute
Countrywide home insurance expenditures rose an estimated 6% in 2006, 4% in 2007
Homeowners in non-CAT zones will see
smaller increases, but larger in CAT zones
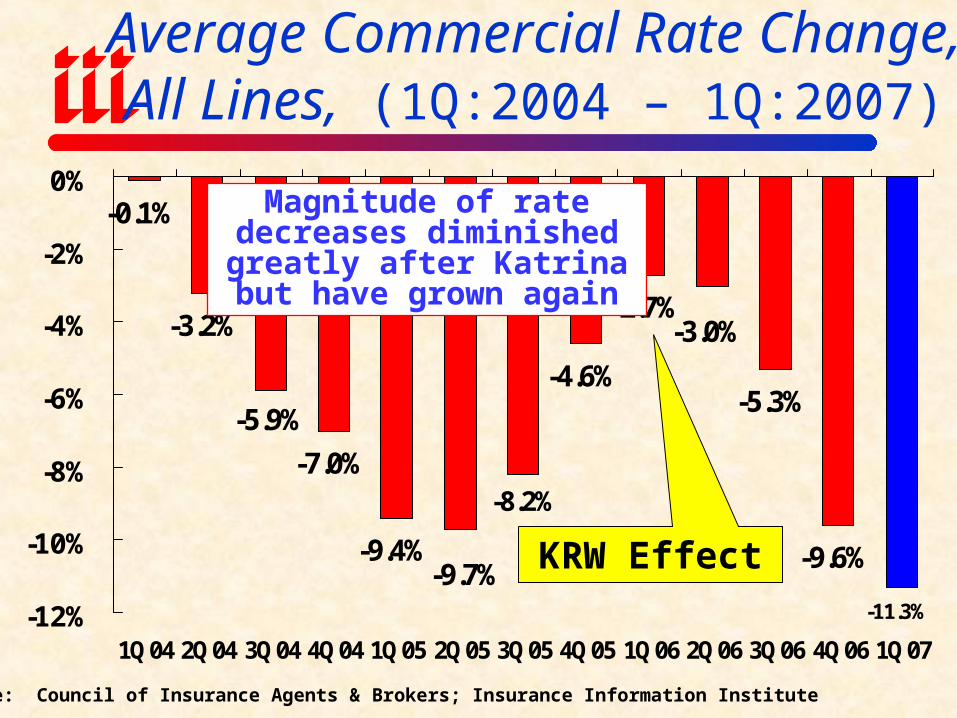
Average Commercial Rate Change,All Lines, (1Q:2004 – 1Q:2007)
-0.1%
-3.2%
-7.0%
-9.4%
-4.6%
-2.7%
-5.3%
-9.6%
-3.0%
-9.7%-11.3%
-5.9%
-8.2%
-12%
-10%
-8%
-6%
-4%
-2%
0%
1Q04 2Q04 3Q04 4Q04 1Q05 2Q05 3Q05 4Q05 1Q06 2Q06 3Q06 4Q06 1Q07
Source: Council of Insurance Agents & Brokers; Insurance Information Institute
Magnitude of rate decreases diminished greatly after
Katrina but have grown again
KRW Effect

Average Commercial Rate Change by Line: 4Q99 – 1Q07
Source: Council of Insurance Agents & Brokers
Commercial accounts trended downward from early 2004 to mid-2005
though that trend moderated post-Katrina

Percent of Commercial Accounts Renewing w/Positive Rate Changes, 2nd Qtr. 2006
71%
48%
28%21%
63%
32%
21%
12% 10%
35%
0%
10%
20%
30%
40%
50%
60%
70%
80%
Southeast Southwest Pacific NW Northeast Midwest
Commercial Property Business Interruption
Source: Council of Insurance Agents and Brokers
Largest increases for Commercial Property & Business Interruption are in the Southeast, smallest in Midwest

Percent of Commercial Accounts Renewing w/Positive Rate Changes, 1st Qtr. 2007
11% 9%
0% 0%
8% 5%9%
0% 0%
9%
0%
10%
20%
30%
40%
50%
60%
70%
80%
Southeast Southwest Pacific NW Northeast Midwest
Commercial Property Business Interruption
Source: Council of Insurance Agents and Brokers
Commercial Property & Business Interruption
increases are disappearing in the
Southeast; Completely gone in the Midwest &
Northeast
“Soft” market seemed to hit Midwest about 1 year before the rest of the US

CAPACITY/SURPLUS
The Industry in Underleveraged

$0
$50
$100
$150
$200
$250
$300
$350
$400
$450
$500
$550
7576777879808182838485868788899091929394959697989900010203040506
U.S. Policyholder Surplus: 1975-2006
Source: A.M. Best, ISO, Insurance Information Institute.
$ B
illi
ons
“Surplus” is a measure of underwriting capacity. It is analogous to “Owners Equity” or “Net Worth” in non-insurance organizations
Capacity as of 12/31/06 was $487.1B (est.), 14.4% above year-
end 2005, 71% above its 2002 trough and 46% above its 1999
peak.Foreign reinsurance and residual market
mechanisms absorbed 45% of 2005 CAT
losses of $62.1B

Annual Catastrophe Bond Transactions Volume, 1997-2006
$966.9
$1,729.8
$4,693.4
$1,991.1
$1,142.8$1,219.5$846.1$984.8
$1,139.0
$633.0
$0$500
$1,000$1,500
$2,000$2,500$3,000
$3,500$4,000
$4,500$5,000
97 98 99 00 01 02 03 04 05 06
Ris
k C
apita
l Iss
ues
($ M
ill)
02
46
81012
1416
1820
Nu
mb
er o
f Iss
uan
ces
Risk Capital Issued Number of Issuances
Source: MMC Securities and Guy Carpenter; Insurance Information Institute.
Catastrophe bond issuance has soared in the wake of Hurricanes
Katrina and the hurricane seasons of 2004/2005

MERGER & ACQUISITION
Few Catalysts for Major P/C Consolidation

P/C Insurance-Related M&A Activity, 1988-2006
$2,4
35
$5,1
00
$19,
118
$40,
032
$1,2
49
$486
$20,
353
$425
$9,2
64
$35,
221
$55,825
$30,
873
$8,0
59
$11,
534
$1,8
82
$3,4
50
$2,7
80
$5,1
37
$5,6
38
$0
$10,000
$20,000
$30,000
$40,000
$50,000
$60,000
88 89 90 91 92 93 94 95 96 97 98 99 00 01 02 03 04 05 06
Tran
sact
ion
Val
ue ($
Mill
)
0
20
40
60
80
100
120
140
Num
ber o
f Tra
nsac
tions
Transaction Values Number of Transactions
*Announced May 7 and June 11, respectively.
Source: Conning Research & Consulting.
IN 2007, Liberty Mutual acquired Ohio Casualty
for $2.7B, D.E. Shaw acquired James River for
$575 million*
No model for successful
consolidation has emerged

INVESTMENT IRONY
Markets & Interest Rates Up, Returns Flat

Property/Casualty Insurance Industry Investment Gain*
$ Billions
$35.4
$42.8$47.2
$52.3
$44.4
$36.0
$45.3$48.9
$59.4$55.7$56.9
$51.9
$57.9
$0
$10
$20
$30
$40
$50
$60
94 95 96 97 98 99 00 01 02 03 04 05** 06*Investment gains consist primarily of interest, stock dividends and realized capital gains and losses. 2006 figure consists of $52.3B net investment income and $3.4B realized investment gain. **2005 figure includes special one-time dividend of $3.2B. Source: ISO; Insurance Information Institute.
Investment gains fell in 2006 and are now only
comparable to gains seen in the late 1990s

CATASTROPHICLOSS
Insurers Accused of Crying Wolf Over Cats

U.S. Insured Catastrophe Losses*$7
.5
$2.7
$4.7
$22.
9
$5.5 $1
6.9
$8.3
$7.4
$2.6 $1
0.1
$8.3
$4.6
$26.
5
$5.9 $1
2.9 $2
7.5
$1.2
$100
.0
$61.
9
$9.2
$0
$20
$40
$60
$80
$100
$120
89 90 91 92 93 94 95 96 97 98 99 00 01 02 03 04 05 06
07Q
1
20??
*Excludes $4B-$6b offshore energy losses from Hurricanes Katrina & Rita. Note: 2001 figure includes $20.3B for 9/11 losses reported through 12/31/01. Includes only business and personal property claims, business interruption and auto claims. Non-prop/BI losses = $12.2B.Source: Property Claims Service/ISO; Insurance Information Institute
$ Billions
2006 was a welcome respite. 2005 was by far the worst
year ever for insured catastrophe losses in the US, but the worst has yet to come.
$100 Billion CAT year is coming soon

U.S. Catastrophe Losses 2006: States With Largest Losses ($ Millions)
*ISO defines a catastrophe event as an event causing $25 million or more in insured property losses.
Source: ISO; Insurance Information Institute
$601$688
$873$878
$1,500
$0
$200
$400
$600
$800
$1,000
$1,200
$1,400
$1,600
Indiana Missouri Tennessee Texas Kansas
SURPRISE!! Indiana led the US with $1.5 billion in
insured CAT losses in 2006
Some 33 catastrophe events* in 34 states cost insurers an estimated $8.8bn in 2006, compared with $61.9bn in 2005. Cat losses in the following five states -- totaling $4.5bn -- represent half the
total catastrophe losses for the year.

Number of Tornadoes,1985 – 2006p
1071 12
16
941
1376
1819
1254 13
33
1132
1133
856
702
65676
5
684
1297
1173
1082 12
34
1173
1148
1424
1345
0
200
400
600
800
1,000
1,200
1,400
1,600
1,800
2,000
85 86 87 88 89 90 91 92 93 94 95 96 97 98 99 00 01 02 03 04 05 06p
Source: US Dept. of Commerce, Storm Prediction Center, National Weather Service; Ins. Info. Inst.
There are usually more than 1,000 confirmed tornadoes each year in the US. They accounted for about 25% of
catastrophe losses since 1985

Inflation-Adjusted U.S. Insured Catastrophe Losses By Cause of Loss,
1986-2005¹
Utility Disruption0.1%
Terrorism7.7%
All Tropical
Cyclones3
47.5%
Tornadoes2
24.5%
Water Damage0.1%
Civil Disorders0.4%
Fire6
2.3%
Wind/Hail/Flood5
2.8%
Earthquakes4
6.7%
Winter Storms7.8%
Source: Insurance Services Office (ISO)..
1 Catastrophes are all events causing direct insured losses to property of $25 million or more in 2005 dollars. Catastrophe threshold changed from $5 million to $25 million beginning in 1997. Adjusted for inflation by the III.2 Excludes snow. 3 Includes hurricanes and tropical storms. 4 Includes other geologic events such as volcanic eruptions and other earth movement. 5 Does not include flood damage covered by the federally administered National Flood Insurance Program. 6 Includes wildland fires.
Insured disaster losses totaled $289.1 billion from
1984-2005 (in 2005 dollars). Tropical systems accounted for nearly half of all CAT losses from 1986-2005, up
from 27.1% from 1984-2003.

Hurricane Katrina Claim Status on Storm’s 1st Anniversary*
In Process, 3%
Mediation/ Litigation, 2%
Settled, 95%
95% of the 1.2 million homeowners insurance claims in
Louisiana & Mississippi were
settled by Katrina’s 1st anniversary of Katrina, with just
2% in dispute
*Hurricane Katrina made its north Gulf coast landfall August 29, 2005.Source: Insurance Information Institute survey, August 2006.

Total Value of Insured Coastal Exposure (2004, $ Billions)
$1,901.6$740.0
$662.4$505.8
$404.9$209.3
$148.8$129.7$117.2$105.3
$75.9$73.0
$46.4$45.6$44.7$43.8
$12.1
$1,937.3
$0 $500 $1,000 $1,500 $2,000 $2,500
FloridaNew York
TexasMassachusetts
New JerseyConnecticut
LouisianaS. Carolina
VirginiaMaine
North CarolinaAlabamaGeorgia
DelawareNew Hampshire
MississippiRhode Island
Maryland
Source: AIR Worldwide
Florida & New York lead the way for insured coastal
property at more than $1.9 trillion each.
CAT losses will drive or influence much of industry’s
legislative agenda

REINSURANCE MARKETS
Big Risk, Big Reward orBig Government?

Share of Losses Paid by Reinsurers, by Disaster*
30%25%
60%
20%
45%
0%
10%
20%
30%
40%
50%
60%
70%
Hurricane Hugo(1989)
Hurricane Andrew(1992)
Sept. 11 TerrorAttack (2001)
2004 HurricaneLosses
2005 HurricaneLosses
*Excludes losses paid by the Florida Hurricane Catastrophe Fund, a FL-only windstorm reinsurer, which was established in 1994 after Hurricane Andrew. FHCF payments to insurers are estimated at $3.85 billion for 2004 and $4.5 billion for 2005.Sources: Wharton Risk Center, Disaster Insurance Project; Insurance Information Institute.
Reinsurance is playing an increasingly
important role in the financing of mega-CATs; Reins. Costs
are skyrocketing

Ratio of Reinsurer Loss & Underwriting Expense to Premiums Written, 1985-2006
1.1
0
1.0
8
1.1
0
1.0
3
1.0
2
1.0
6 1.1
4
1.1
3
1.1
7
1.0
1 1.0
6
1.2
6
0.9
5
1.3
9
1.2
1
1.0
6
1.0
7
1.0
7
1.0
9 1.1
8
1.0
7 1.0
8
0.8
0.9
1.0
1.1
1.2
1.3
1.4
1.5
85 86 87 88 89 90 91 92 93 94 95 96 97 98 99 00 01 02 03 04 05 06
Lo
ss
& L
AE
Ra
tio
Source: Reinsurance Association of America.
Despite the respite in 2006, reinsurers paid an average of $1.11 in loss and expense
for every $1 in written premium since 1985

FINANCIAL STRENGTH &
RATINGS Industry Has Weathered
the Storms Well

Reasons for US P/C Insurer Impairments, 1969-2005
*Includes overstatement of assets.
Source: A.M. Best: P/C Impairments Hit Near-Term Lows Despite Surging Hurricane Activity, Special Report, Nov. 2005;
Catastrophe Losses8.6%
Alleged Fraud11.4%
Deficient Loss
Reserves/In-adequate Pricing62.8%
Affiliate Problems
8.6%
Rapid Growth
8.6%
2003-2005 1969-2005
Deficient reserves,
CAT losses are more important factors in
recent years
Reinsurance Failure3.5%
Rapid Growth16.5%
Misc.9.2%
Affiliate Problems
5.6%
Sig. Change in Business
4.6%
Deficient Loss
Reserves/In-adequate Pricing38.2%
Investment Problems*
7.3%
Alleged Fraud8.6%
Catastrophe Losses6.5%

P/C Insurer Impairments,1969-2006
815
127
11 934
913 12
199
16 14 1336
4931
3449 49
5460
5841
2915
1231
18 1949 50
4735
1813 15
0
10
20
30
40
50
60
70
69 70 71 72 73 74 75 76 77 78 79 80 81 82 83 84 85 86 87 88 89 90 91 92 93 94 95 96 97 98 99 00 01 02 03 04 05 06
The number of impairments varies significantly over the p/c insurance cycle,
with peaks occurring well into hard markets
Source: A.M. Best; Insurance Information Institute

STATE RESIDUAL MARKETS
How Big is Too Big?

Florida Citizens Exposure to Loss (Billions of Dollars)
Source: PIPSO; Insurance Information Institute
408.8
$210.6$206.7$195.5
$154.6
$0
$50
$100
$150
$200
$250
$300
$350
$400
$450
2002 2003 2004 2005 2006
Exposure to loss in Florida Citizens nearly doubled in 2006

Major Residual Market Plan Estimated Deficits 2004/2005 (Millions of Dollars)
* MWUA est. deficit for 2005 comprises $545m in assessments plus $50m in Federal Aid.Source: Insurance Information Institute
-$516
-$1,425
-$1,770
-$954
-$595 *
-$2,000-$1,800-$1,600-$1,400-$1,200-$1,000
-$800-$600-$400-$200
$0
Florida HurricaneCatastrophe Fund
(FHCF) Florida Citizens Louisiana Citizens
Mississippi WindstormUnderwriting
Association (MWUA)
2004 2005
Hurricane Katrina pushed all of the residual market property plans in
affected states into deficits for 2005, following an already record hurricane loss year in 2004

What Role Should the Federal Government
Play in Insuring Against Natural Disaster Risks?

Comprehensive National Catastrophe Plan Schematic
Personal Disaster Account
Private Insurance
State Regional Catastrophe Fund
National Catastrophe Contract Program
Source: NAIC, Natural Catastrophe Risk: Creating a Comprehensive National Plan, Dec. 1, 2005; Insurance Information. Inst.
State Attachment
1:50 Event
1:500 Event

Legislation has been introduced and ideas
espoused by ProtectingAmerica.org will likely get a more
thorough airing in 2007/8

FLORIDA’S APPROACH TO
MANAGING HURRICANE RISK
Does it Add Up?

Pre- vs. Post-Event in FL for 2007 Hurricane Season
$12.
4
$15.
0
$17.
6
$25.
8
$9.9
$14.
6
$24.
1
$31.
4
$34.
5
$37.
4
$54.
2
$10.9$10.4$10.1$0
$10
$20
$30
$40
$50
$60
$70
$80
$90
1-in-20 1-in-30 1-in-50 1-in-70 1-in-85 1-in-100 1-in-250
Pre-Event Funding Post-Event Funding (Assessments & Bonds)
Bil
lion
s
Total = $20.0 Billion
Notes: Pre-event funding includes funds available to Citizens, FHCF and private carriers plus contingent funding available through private reinsurance to pay claims in 2007. Post-event funding is on a present value basis and does not includefinancing costs. Probabilities are expressed as “odds of a single storm of this magnitude or greater happening in 2007.”Source: Tillinghast Towers Perrin, Study of Recent Legislative Changes to Florida’s Property Insurance Mechanisms, 3/07.
$35.0B
$25.0B
$43.8B $49.5B
$55.0B
$80.0BThere is a very significant likelihood of major, multi-year assessments in 2007

Average Annual Assessment per Household, 1-in-100 Year Event in 2007
Source: Tillinghast Towers Perrin, Study of Recent Legislative Changes to Florida’s Property Insurance Mechanisms, 3/07.
The average Florida household will pay $8,699 over 30 years in assessments if a 1-in-100 year
event strikes in 2007. Assessments could rise if additional storms hit
in 2007 or beyond.

Savings vs. Costs by Region: Neither Equitable nor Proportionate
TALLAHASSEEAverage Savings: $20
Cost of 1-in-30 Storm: $2,000Cost is 100 times avg. savings
TAMPAAverage Savings: $100
Cost of 1-in-30 Storm: $2,300Cost is 23 times avg. savings
ORLANDO
Average Savings: $30
Cost of 1-in-30 Storm: $2,075
Cost is 69 times avg. savings
MIAMI
Average Savings: $1,120
Cost of 1-in-30 Storm: $3,375
Cost is 3 times avg. savings
STATEWIDE AVERAGEAverage Savings: $265
Cost of 1-in-30 Storm: $2,550Cost is 10 times avg. savings
Source: Tillinghast Towers Perrin, Study of Recent Legislative Changes to Florida’s Property Insurance Mechanisms, 3/07.

29% 25% 30%
22% 34% 31%
0%
10%
20%
30%
40%
50%
60%
70%
Coastal Counties Interior Counties Noncoastal States
Very unfair
Somewhat Unfair
Source: Insurance Research Council
Public Attitude Monitor 2006: Unfairness of Taxpayer Subsidies
Most non-coastal dwellers believe taxpayer subsidies for coastal property owners are unfair
Coastal States
KEY LINES
Discipline Will Remain (Mostly) Intact in 2007

Private Passenger Auto

101.7101.3101.3101.0
99.5
101.1
103.5
109.5
107.9
104.2
98.4
94.395.1
93.0
90
95
100
105
110
93 94 95 96 97 98 99 00 01 02 03 04 05 06F
Private Passenger Auto Combined Ratio
Average Combined 1993 to 2005= 101.4
Most auto insurers have shown sig-nificant improvements in underwriting
performance since mid-2002
Sources: A.M. Best; III
PPA is the profit juggernaut of the p/c
insurance industry today

Homeowners Insurance

117.7
158.4
113.6118.4
112.7
121.7
101.0
108.2111.4
121.7
109.3
98.294.4
100.3
93
113.0109.4
90
100
110
120
130
140
150
160
90 91 92 93 94 95 96 97 98 99 00 01 02 03 04 05 06F
Homeowners Insurance Combined Ratio
Average 1990 to 2005= 113.1
Insurers have paid out an average of $1.13 in losses for every dollar earned
in premiums over the past 16 years
Sources: A.M. Best; III

COMMERCIAL MULTI-PERIL & COMMERCIAL
AUTO

119.0
119.8
108.5
125.0
113.1
115.0
121.0
116.2
116.1
104.9
101.9
100.7
116.8
113.6
115.3
122.4
115.0
117.0
97.3
89.0
97.7
93.8
80
85
90
95
100
105
110
115
120
125
130
95 96 97 98 99 00 01 02 03 04 05
CMP-Liability
CMP-Non-Liability
Commercial Multi-Peril Combined (Liability vs. Non-Liability Portion)
Liab. Combined 1995 to 2004 = 114.6
Non-Liab. Combined = 107.1
Sources: A.M. Best; III
CMP- has improved recently

112.
1
112
113 11
5.9 12
0.5
120.
1
106.
6
99.4
96.6
93.396
.7
102.
2
99.0
99.7
99.0
103.
6
102.
3
95.9
92.1
87.1 90
.7
122.5
80
85
90
95
100
105
110
115
120
125
95 96 97 98 99 00 01 02 03 04 05
Comm Auto Liab Comm Auto PD
Commercial Auto Liability& PD Combined Ratios
Average Combined: Liability = 110.2
PD = 97.1
Sources: A.M. Best; III
Commercial Auto has improved dramatically

WORKERS COMPENSATION
OPERATING ENVIRONMENT

Workers Comp Calendar Year vs. Ultimate Accident Year – Private Carriers
101
97
111
110
107
103
97
101 10
6
119
131
140
135
123
88 87 87
100
101 10
7 115 11
8 122
97
104
96
80
90
100
110
120
130
140
1994 1995 1996 1997 1998 1999 2000 2001 2002 2003 2004 2005 2006p
Calendar Year Accident Year
Percent
p Preliminary AY figure. Accident Year data is evaluated as of 12/31/2006 and developed to ultimateSource: Calendar Years 1994-2005, A.M. Best Aggregates & Averages; Calendar Year 2006p and Accident Years 1994-2006pbased on NCCI Annual Statement Analysis.Includes dividends to policyholders
Workers Comp Combined Ratios, 1994-2006P

Lost-Time Claims
-4.2 -4.4
-6.9
-4.5 -4.1 -3.9
-6.8
-9.2
0.3
-6.5
-4.5
0.5
-3.9
-2.3
-4.5
-6.6
-10
-8
-6
-4
-2
0
2
91 92 93 94 95 96 97 98 99 00 01 02 03 04 05 06p
Cumulative Change of –52.1%since 1991 means that lost work
time claims have been cut by more than half
Accident Year
Percent Change
Workers Comp Lost-TimeClaim Frequency (% Change)
2003p: Preliminary based on data valued as of 12/31/20061991-2005: Based on data through 12/31/2005, developed to ultimateBased on the states where NCCI provides ratemaking servicesExcludes the effects of deductible policiesSource: NCCI

IndemnityClaim Cost (000s)
Lost-Time Claims
$9.9 $9.6 $9.4 $9.8 $10.0$10.6
$11.4$12.4
$13.6
$15.1$16.5$16.9
$17.7$18.0$18.6
$19.6
$5
$7
$9
$11
$13
$15
$17
$19
91 92 93 94 95 96 97 98 99 00 01 02 03 04 05 06p
Annual Change 1991–1996: +1.2%Annual Change 1997–2005: +6.6%
2005p: Preliminary based on data valued as of 12/31/20061991-2005: Based on data through 12/31/2005, developed to ultimateBased on the states where NCCI provides ratemaking servicesExcludes the effects of deductible policiesSource: NCCI
Accident Year
Workers Comp Indemnity Claims Costs Have Accelerated, 1993-2006p
Cumulative Change = +108.5%(1993-2006p)
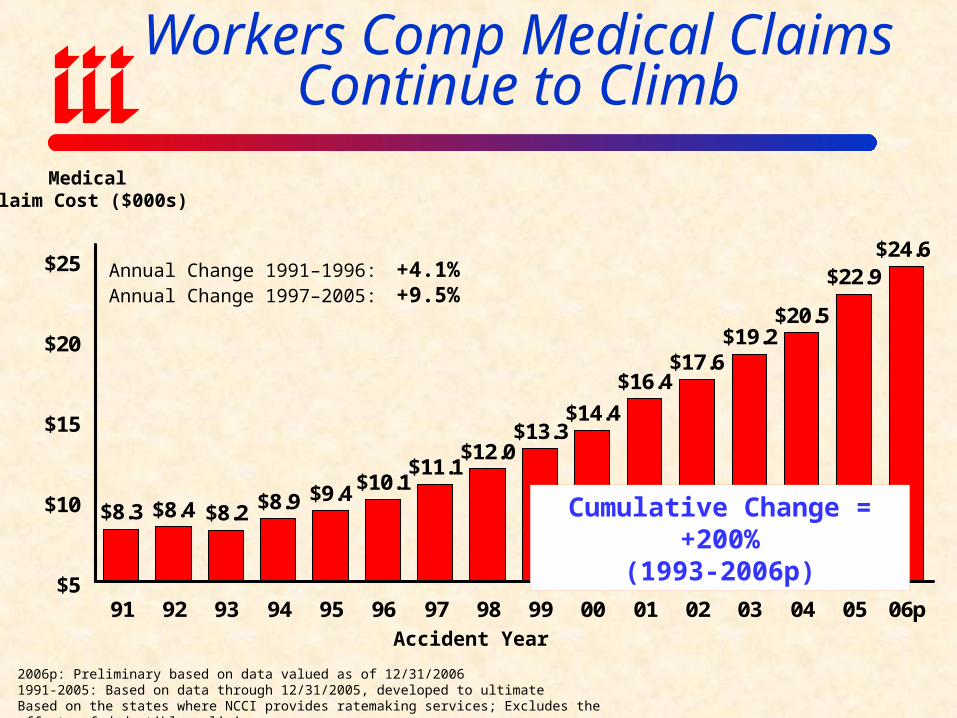
$8.3 $8.4 $8.2 $8.9 $9.4 $10.1$11.1
$12.0$13.3
$14.4
$16.4$17.6
$19.2$20.5
$22.9$24.6
$5
$10
$15
$20
$25
91 92 93 94 95 96 97 98 99 00 01 02 03 04 05 06p
Annual Change 1991–1996: +4.1%Annual Change 1997–2005: +9.5%
Accident Year
MedicalClaim Cost ($000s)
2006p: Preliminary based on data valued as of 12/31/20061991-2005: Based on data through 12/31/2005, developed to ultimateBased on the states where NCCI provides ratemaking services; Excludes the effects of deductible policies
Workers Comp Medical Claims Continue to Climb
Cumulative Change = +200%(1993-2006p)

Med Costs Share of Total Costs is Increasing Steadily
Indemnity55%
Medical45%
Source: NCCI (based on states where NCCI provides ratemaking services).
Indemnity52%
Medical48%
Indemnity41%
Medical59%1986
1996
2006p

Legal Liability & Tort Environment
Definitely Improving ButNot Out of the Woods

Personal, Commercial & Self (Un) Insured Tort Costs*
$17.0$49.6 $58.7
$95.2
$17.1
$51.0$70.9
$86.7
$5.2
$20.4
$30.0
$49.4
$0
$50
$100
$150
$200
$250
1980 1990 2000 2005
Commercial Lines Personal Lines Self (Un)Insured
Bil
lion
s
Total = $39.3 Billion
*Excludes medical malpracticeSource: Tillinghast-Towers Perrin, 2006 Update on US Tort Cost Trends.
Total = $121.0 Billion
Total = $159.6 Billion
Total = $231.3 Billion

Tort System Costs,2000-2008F
$179
$233$246
$270
$295
$260
$261
$261
$205
1.82%2.03%
2.22% 2.22%
2.04%2.09% 2.03%2.05%
2.24%
$100
$120
$140
$160
$180
$200
$220
$240
$260
$280
$300
00 01 02 03 04 05 06E 07F 08F
Tor
t S
yste
m C
osts
0.0%
0.5%
1.0%
1.5%
2.0%
2.5%
Tor
t C
osts
as
% o
f G
DP
Tort Sytem Costs Tort Costs as % of GDP
After a period of rapid escalation, tort system costs as % of GDP are now falling
Source: Tillinghast-Towers Perrin, 2006 Update on US Tort Cost Trends;2006 is III estimate.
REGULATORY UPDATE
Busy Year for Insurersin Washington

Federal Legislative UpdateFederal Terrorism Reinsurance (TRIA)• TRIA expires 12/31/07. The current federal program offers $100 billion of
coverage subject to a $27.5B industry aggregate retention.
• New Democratic Congress (with Committee chairs from urban Northeast states) predisposed to extend. Despite resistance/lackluster Administration support TRIA will likely extended for a multi-year period, perhaps 6-8 but potentially as long as 15 years (last extension in 2005 was for 2 years)
• Potential changes include extensions of coverage for domestic terrorism losses
(not included currently), and a lower industry retention for nuclear, biological, chemical, or radiological (NBCR) attacks. There could possibly be a modestly higher industry retention for non-NBCR losses, and it needs to be resolved whether liability and group life losses will be covered.
• Original hope for first-half 2007 extension have faded. Now looking at fall or even 11th-hour extension as in 2005.
Sources: Lehman Brothers, Insurance Information Institute

Federal Legislative Update
Natural Disaster Coverage• Some insurers are pushing for federal catastrophic risk fund coverage in the
wake of billions of dollars of losses suffered by insurers from the 2004-2005 hurricane seasons.
• Legislative relief addressing property/casualty insurers’ exposure to natural catastrophes, such as the creation of state and federal catastrophe funds, has been advocated by insurers include Allstate and State Farm recently. However, there is active opposition many other insurers and all reinsurers.
• There are supporters in Congress, mostly from CAT-prone states. Skeptics in Congress believe such a plan would be a burden on taxpayers like the NFIP and that the private sector can do a better job. Unlike TRIA, the industry is not unified on this issue.
• Allowing insurers to establish tax free reserves for future catastrophe losses has also been proposed, but Congress has not yet indicated much support.
Sources: Lehman Brothers, Insurance Information Institute

Federal Legislative UpdateMcCarran-Ferguson Insurance Antitrust Exemption• Under McCarran-Ferguson Act of 1945, insurers have limited immunity under
federal anti-trust laws allowing insurers to pool past claims information to develop accurate (actuarially credible) rates.
• Very low level of understanding of M-F in Washington
• Certain legislators threaten to revoke McCarran-Ferguson because of alleged collusion in the wake of Hurricane Katrina. However, the view among some Washington insiders is that such a move would hurt small insurers with less resources rather than the large insurers perhaps being targeted. The current bills designed to revoke McCarran-Ferguson are S.618 and H.R. 1081.
• The government appointed Antitrust Modernization Commission in an April 2007 report strongly encouraged Congress to re-examine the McCarran-Ferguson Act. Notably, 4 of the commissions 12 members called for a full repeal of the law.
Sources: Lehman Brothers, Insurance Info. Institute

Insurance Information Institute On-Line
If you would like a copy of this presentation, please give me your business card with e-mail address