overweight and obesity in michigan: surveillance … 1. obesity overweight and obesity in michigan...
TRANSCRIPT
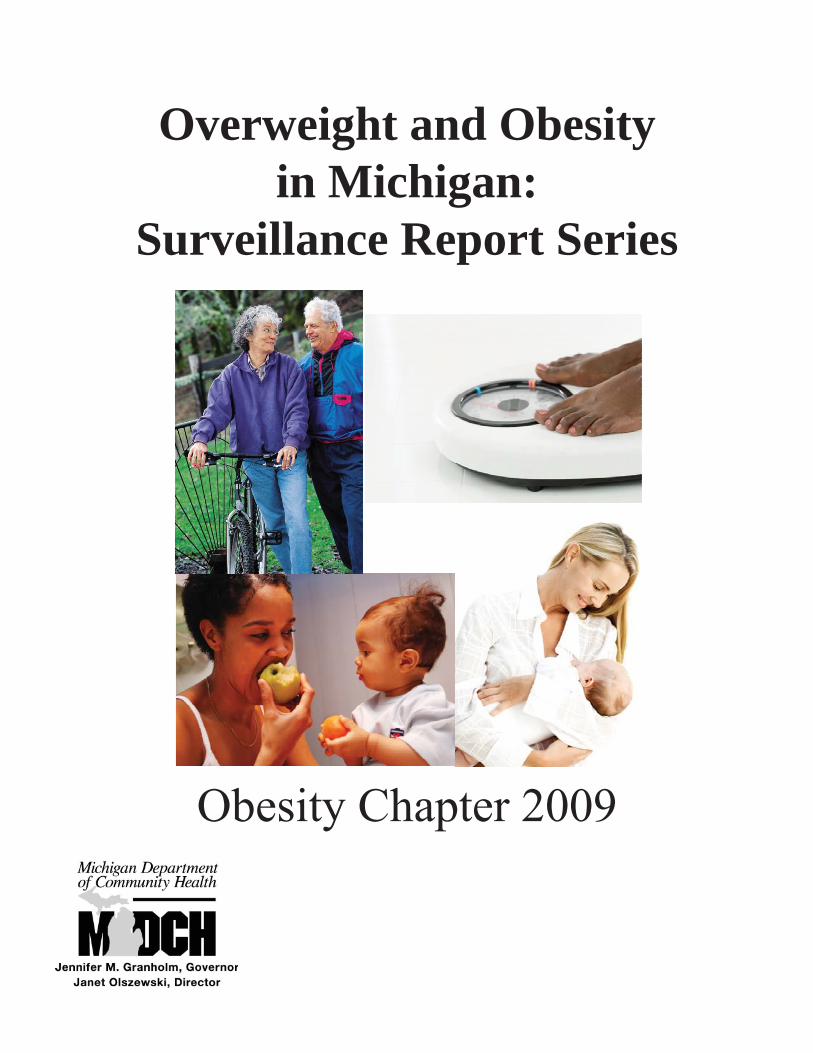
Overweight and Obesity in Michigan:
Surveillance Report Series
Obesity Chapter 2009
Michigan’s CDC funded Nutrition, Physical Activity and Obesity Program is in the process of developing the “Overweight and Obesity in Michigan” surveillance report. The report will contain four chapters, Physical Activity, Nutrition, Breastfeeding and Obesity. Each chapter will be released individually with the fi nal report completed and released by the summer of 2009.
The third released chapter, Obesity, contains surveillance data on prevalence of overweight and obesity in adults, youth and children and health complications associated with obesity (adults).
Permission is granted for the reproduction of this publication provided that the reproductions contain appropriate reference to the source.
Suggested citation: BE Anderson, SK Lyon-Callo, SE Monje, MD Boivin, G Imes. Overweight and Obesity in Michigan: Surveillance Report Series 2009. Lansing, MI: Michigan Department of Community Health, Bureau of Epidemiology, Chronic Disease Epidemiology Section.
This report was supported by Grant/Cooperative Agreement Number 1U58DP001386-01 from the Centers for Disease Control and Prevention (CDC). Its contents are solely the responsibility of the authors and do not necessarily represent the offi cial views of the CDC.
The maps in this report were made possible by a grant from the Division of Heart Disease and Stroke, Centers for Disease Control and Prevention through the National Association of Chronic Disease Directors.
Produced June 2009

Chapter 1. Obesity Overweight and Obesity in Michigan
Michigan Department of Community Health, 2009
Contributors:Beth Anderson, MPHSarah Lyon-Callo, MA, MSSarah Monje, MPH, RDGwendoline Imes, MS, RD
Introduction:Overweight and obesity can be caused by a combination of genetic, metabolic, behavioral, environmental, cultural, and socioeconomic infl uences. Behavioral and environmental factors contribute largely to overweight and obesity and provide the greatest opportunity for interventions designed for prevention and treatment. Healthy eating and physical activity are two important behaviors in preventing and treating overweight and obesity and are extremely helpful in maintaining weight loss.1
Key Findings:Adults:
Obesity in Michigan has risen 21.8% among adults from 2001 to 2008.• Michigan had the 8th highest prevalence rate of obesity in the United States in 2008.• In 2008, 65.3% of Michigan adults were either overweight or obese; 35.2% were overweight and • an additional 30.1% were obese.Blacks had a signifi cantly higher obesity rate (39.8%) than whites (28.8%).• Obese adults had a higher prevalence of arthritis, high blood pressure, high cholesterol, asthma, • coronary heart disease, stroke, heart attack, diabetes and inadequate sleep compared with non-obese adults.Obese adults also reported the highest prevalence of poor life satisfaction, poor general health, • poor physical health, poor mental health and activity limitations compared with non-obese adults.
Youth:In 2007, 28.9% of Michigan youth, grades 9 through 12, were either overweight or obese; 16.5% • were overweight and an additional 12.4% were obese.Black youth had a higher obesity rate (18.5%) compared with white youth (11.2%).•
3
Chapter 1. Obesity Overweight and Obesity in Michigan
Michigan Department of Community Health, 2009
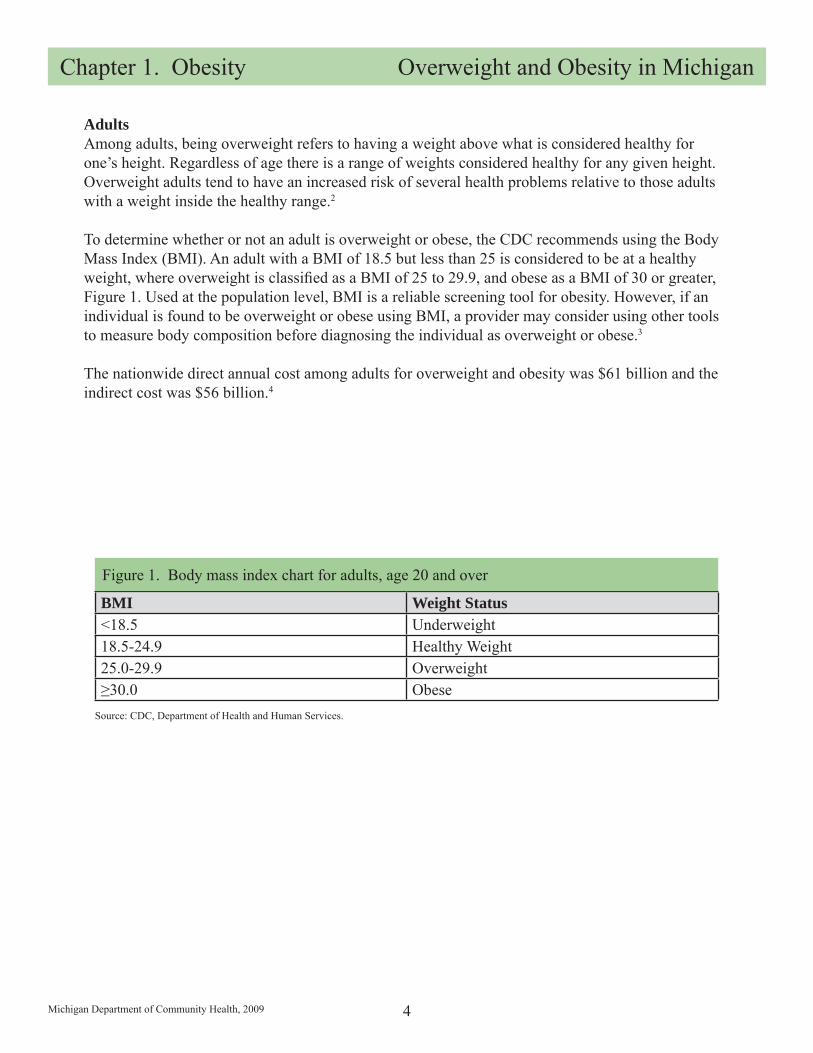
AdultsAmong adults, being overweight refers to having a weight above what is considered healthy for one’s height. Regardless of age there is a range of weights considered healthy for any given height. Overweight adults tend to have an increased risk of several health problems relative to those adults with a weight inside the healthy range.2
To determine whether or not an adult is overweight or obese, the CDC recommends using the Body Mass Index (BMI). An adult with a BMI of 18.5 but less than 25 is considered to be at a healthy weight, where overweight is classifi ed as a BMI of 25 to 29.9, and obese as a BMI of 30 or greater, Figure 1. Used at the population level, BMI is a reliable screening tool for obesity. However, if an individual is found to be overweight or obese using BMI, a provider may consider using other tools to measure body composition before diagnosing the individual as overweight or obese.3
The nationwide direct annual cost among adults for overweight and obesity was $61 billion and the indirect cost was $56 billion.4
BMI Weight Status<18.5 Underweight18.5-24.9 Healthy Weight25.0-29.9 Overweight≥30.0 Obese
Figure 1. Body mass index chart for adults, age 20 and over
Source: CDC, Department of Health and Human Services.
4
Chapter 1. Obesity Overweight and Obesity in Michigan
Michigan Department of Community Health, 2009
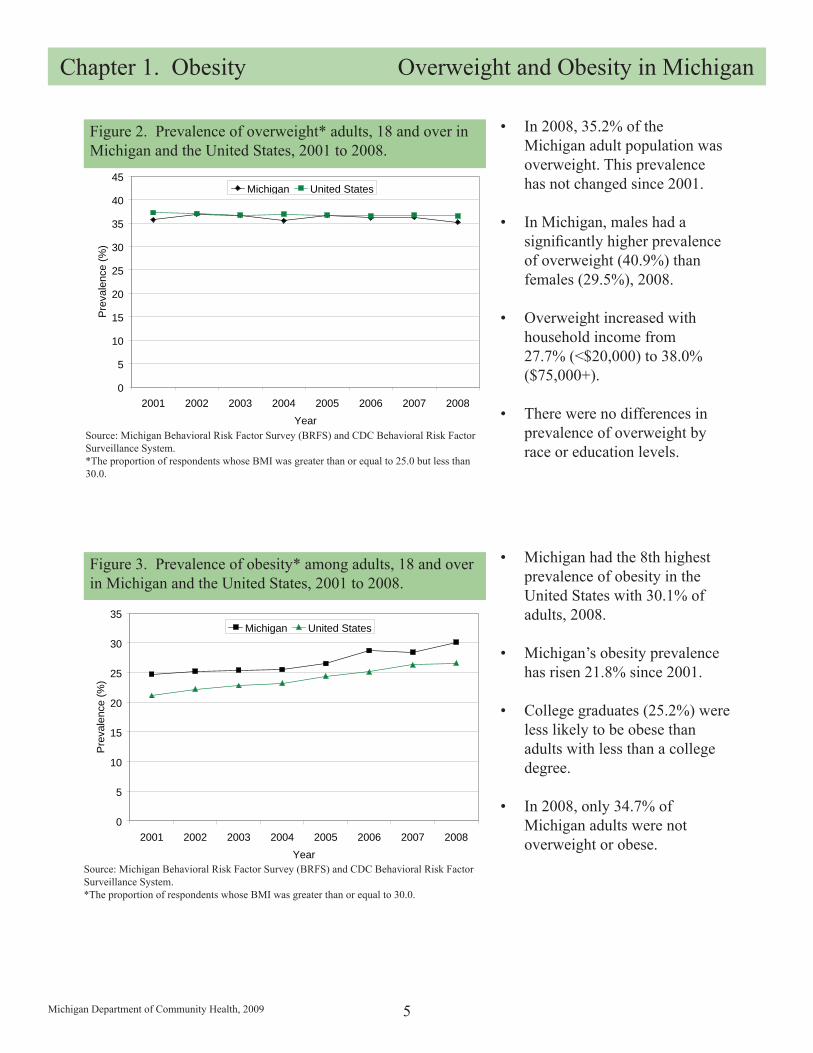
Figure 3. Prevalence of obesity* among adults, 18 and over in Michigan and the United States, 2001 to 2008.
0
5
10
15
20
25
30
35
2001 2002 2003 2004 2005 2006 2007 2008Year
Prev
alen
ce (%
)
Michigan United States
Michigan had the 8th highest • prevalence of obesity in the United States with 30.1% of adults, 2008.
Michigan’s obesity prevalence • has risen 21.8% since 2001.
College graduates (25.2%) were • less likely to be obese than adults with less than a college degree.
In 2008, only 34.7% of • Michigan adults were not overweight or obese.
Source: Michigan Behavioral Risk Factor Survey (BRFS) and CDC Behavioral Risk Factor Surveillance System.*The proportion of respondents whose BMI was greater than or equal to 30.0.
Figure 2. Prevalence of overweight* adults, 18 and over in Michigan and the United States, 2001 to 2008.
0
5
10
15
20
25
30
35
40
45
2001 2002 2003 2004 2005 2006 2007 2008Year
Prev
alen
ce (%
)
Michigan United States
Source: Michigan Behavioral Risk Factor Survey (BRFS) and CDC Behavioral Risk Factor Surveillance System. *The proportion of respondents whose BMI was greater than or equal to 25.0 but less than 30.0.
In 2008, 35.2% of the • Michigan adult population was overweight. This prevalence has not changed since 2001.
In Michigan, males had a • signifi cantly higher prevalence of overweight (40.9%) than females (29.5%), 2008.
Overweight increased with • household income from 27.7% (<$20,000) to 38.0% ($75,000+).
There were no differences in • prevalence of overweight by race or education levels.
5
Chapter 1. Obesity Overweight and Obesity in Michigan
Michigan Department of Community Health, 2009
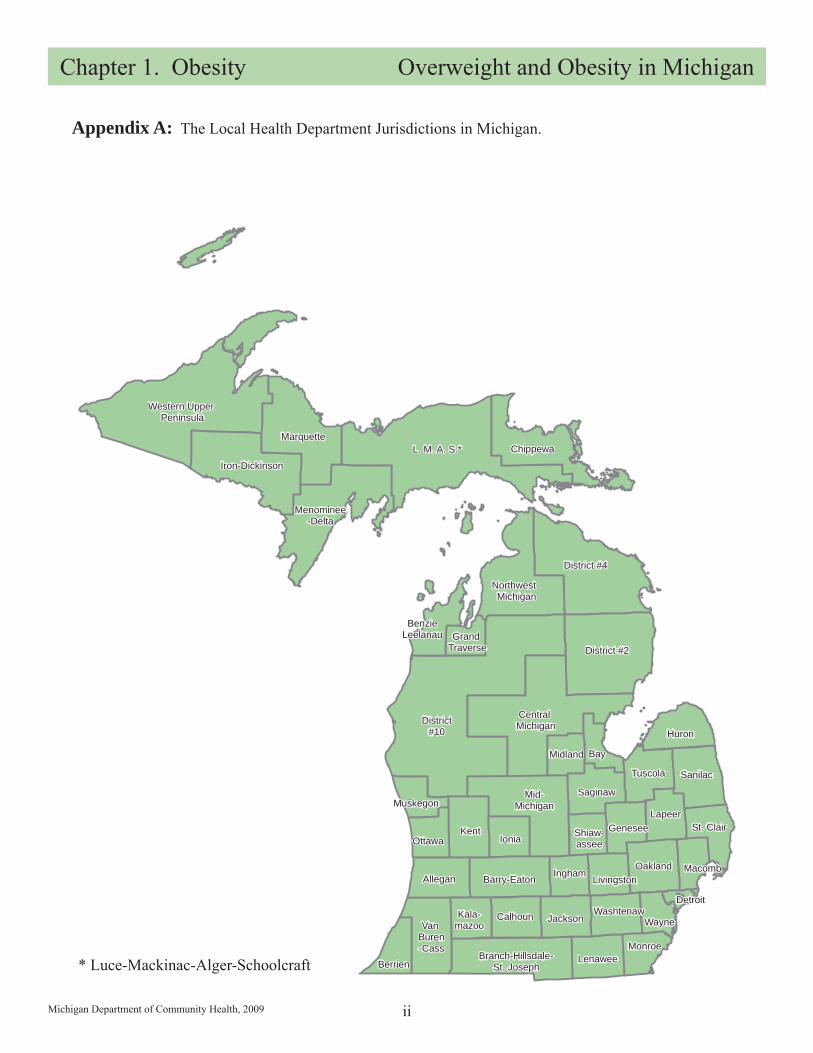
% BMI >2558.3 - 61.661.7 - 63.964.0 - 67.767.8 - 76.7County
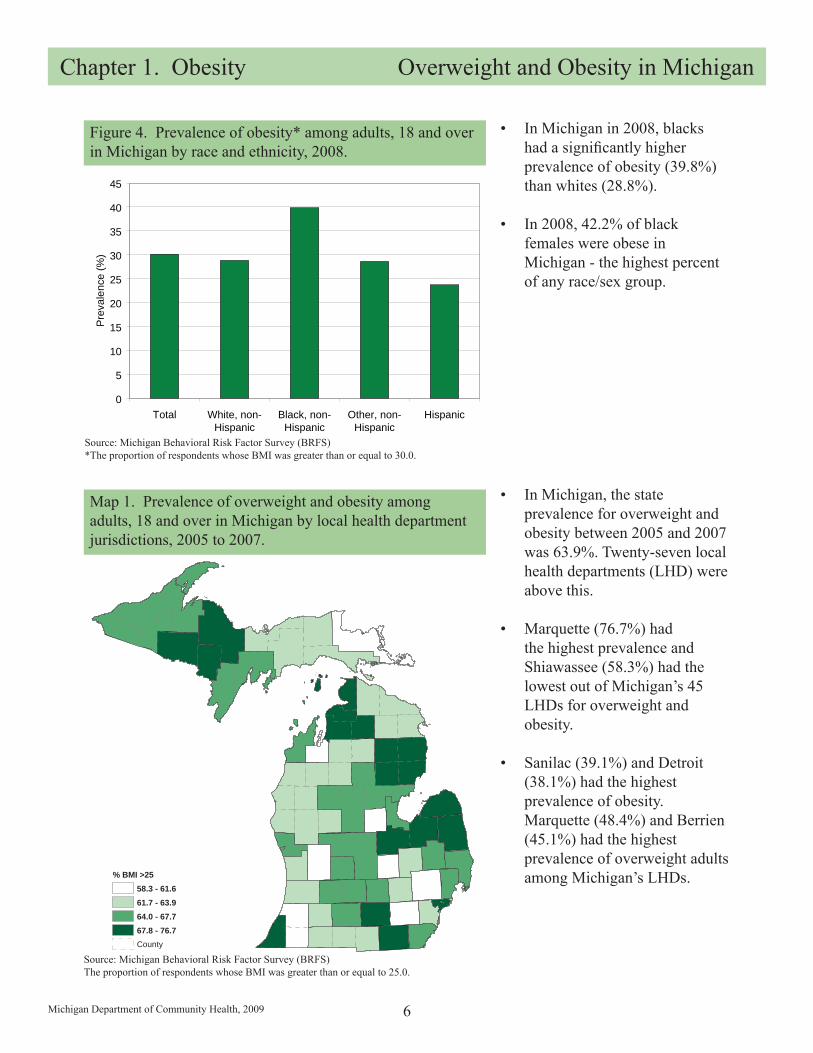
Map 1. Prevalence of overweight and obesity among adults, 18 and over in Michigan by local health department jurisdictions, 2005 to 2007.
In Michigan, the state • prevalence for overweight and obesity between 2005 and 2007 was 63.9%. Twenty-seven local health departments (LHD) were above this.
Marquette (76.7%) had • the highest prevalence and Shiawassee (58.3%) had the lowest out of Michigan’s 45 LHDs for overweight and obesity.
Sanilac (39.1%) and Detroit • (38.1%) had the highest prevalence of obesity. Marquette (48.4%) and Berrien (45.1%) had the highest prevalence of overweight adults among Michigan’s LHDs.
Source: Michigan Behavioral Risk Factor Survey (BRFS)The proportion of respondents whose BMI was greater than or equal to 25.0.
Figure 4. Prevalence of obesity* among adults, 18 and over in Michigan by race and ethnicity, 2008.
0
5
10
15
20
25
30
35
40
45
Total White, non-Hispanic
Black, non-Hispanic
Other, non-Hispanic
Hispanic
Prev
alen
ce (%
)
Source: Michigan Behavioral Risk Factor Survey (BRFS)*The proportion of respondents whose BMI was greater than or equal to 30.0.
In Michigan in 2008, blacks • had a signifi cantly higher prevalence of obesity (39.8%) than whites (28.8%).
In 2008, 42.2% of black • females were obese in Michigan - the highest percent of any race/sex group.
6
Chapter 1. Obesity Overweight and Obesity in Michigan
Michigan Department of Community Health, 2009
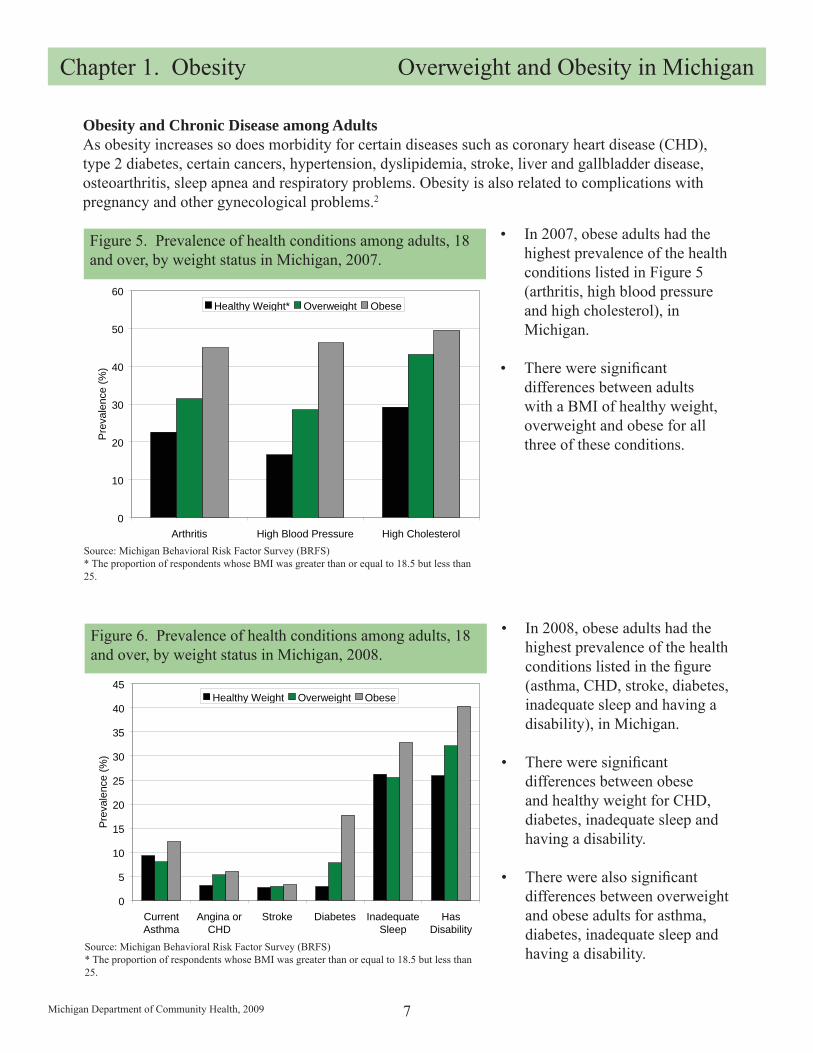
Figure 5. Prevalence of health conditions among adults, 18 and over, by weight status in Michigan, 2007.
Figure 6. Prevalence of health conditions among adults, 18 and over, by weight status in Michigan, 2008.
In 2008, obese adults had the • highest prevalence of the health conditions listed in the fi gure (asthma, CHD, stroke, diabetes, inadequate sleep and having a disability), in Michigan.
There were signifi cant • differences between obese and healthy weight for CHD, diabetes, inadequate sleep and having a disability.
There were also signifi cant • differences between overweight and obese adults for asthma, diabetes, inadequate sleep and having a disability.Source: Michigan Behavioral Risk Factor Survey (BRFS)
* The proportion of respondents whose BMI was greater than or equal to 18.5 but less than 25.
Source: Michigan Behavioral Risk Factor Survey (BRFS)* The proportion of respondents whose BMI was greater than or equal to 18.5 but less than 25.
In 2007, obese adults had the • highest prevalence of the health conditions listed in Figure 5 (arthritis, high blood pressure and high cholesterol), in Michigan.
There were signifi cant • differences between adults with a BMI of healthy weight, overweight and obese for all three of these conditions.
Obesity and Chronic Disease among AdultsAs obesity increases so does morbidity for certain diseases such as coronary heart disease (CHD), type 2 diabetes, certain cancers, hypertension, dyslipidemia, stroke, liver and gallbladder disease, osteoarthritis, sleep apnea and respiratory problems. Obesity is also related to complications with pregnancy and other gynecological problems.2
7
0
5
10
15
20
25
30
35
40
45
CurrentAsthma
Angina orCHD
Stroke Diabetes InadequateSleep
HasDisability
Prev
alen
ce (%
)
Healthy Weight Overweight Obese
0
10
20
30
40
50
60
Arthritis High Blood Pressure High Cholesterol
Prev
alen
ce (%
)
Healthy Weight* Overweight Obese
Chapter 1. Obesity Overweight and Obesity in Michigan
Michigan Department of Community Health, 2009
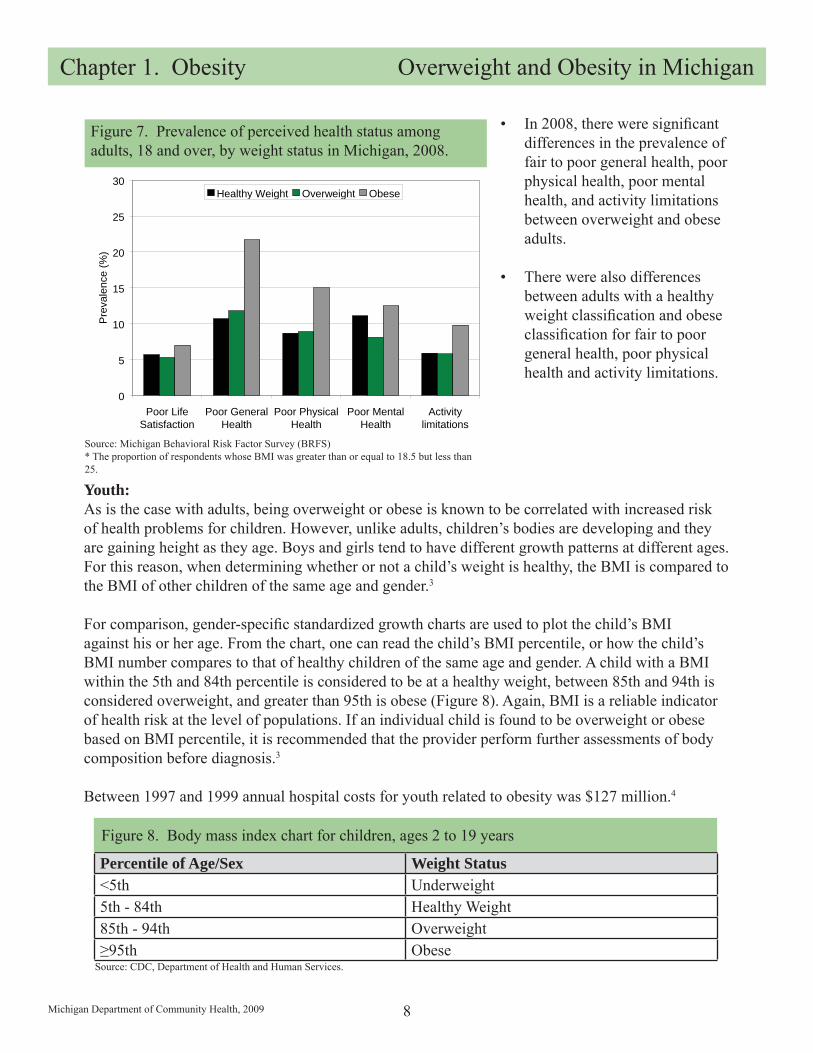
Youth:As is the case with adults, being overweight or obese is known to be correlated with increased risk of health problems for children. However, unlike adults, children’s bodies are developing and they are gaining height as they age. Boys and girls tend to have different growth patterns at different ages. For this reason, when determining whether or not a child’s weight is healthy, the BMI is compared to the BMI of other children of the same age and gender.3
For comparison, gender-specifi c standardized growth charts are used to plot the child’s BMI against his or her age. From the chart, one can read the child’s BMI percentile, or how the child’s BMI number compares to that of healthy children of the same age and gender. A child with a BMI within the 5th and 84th percentile is considered to be at a healthy weight, between 85th and 94th is considered overweight, and greater than 95th is obese (Figure 8). Again, BMI is a reliable indicator of health risk at the level of populations. If an individual child is found to be overweight or obese based on BMI percentile, it is recommended that the provider perform further assessments of body composition before diagnosis.3
Between 1997 and 1999 annual hospital costs for youth related to obesity was $127 million.4
Figure 7. Prevalence of perceived health status among adults, 18 and over, by weight status in Michigan, 2008.
Source: Michigan Behavioral Risk Factor Survey (BRFS)* The proportion of respondents whose BMI was greater than or equal to 18.5 but less than 25.
In 2008, there were signifi cant • differences in the prevalence of fair to poor general health, poor physical health, poor mental health, and activity limitations between overweight and obese adults.
There were also differences • between adults with a healthy weight classifi cation and obese classifi cation for fair to poor general health, poor physical health and activity limitations.
Percentile of Age/Sex Weight Status<5th Underweight5th - 84th Healthy Weight85th - 94th Overweight≥95th Obese
Figure 8. Body mass index chart for children, ages 2 to 19 years
8
0
5
10
15
20
25
30
Poor LifeSatisfaction
Poor GeneralHealth
Poor PhysicalHealth
Poor MentalHealth
Activitylimitations
Prev
alen
ce (%
)
Healthy Weight Overweight Obese
Source: CDC, Department of Health and Human Services.
Chapter 1. Obesity Overweight and Obesity in Michigan
Michigan Department of Community Health, 2009
0
2
4
6
8
10
12
14
1999 2001 2003 2005 2007Year
Perc
ent (
%)
Michigan United States
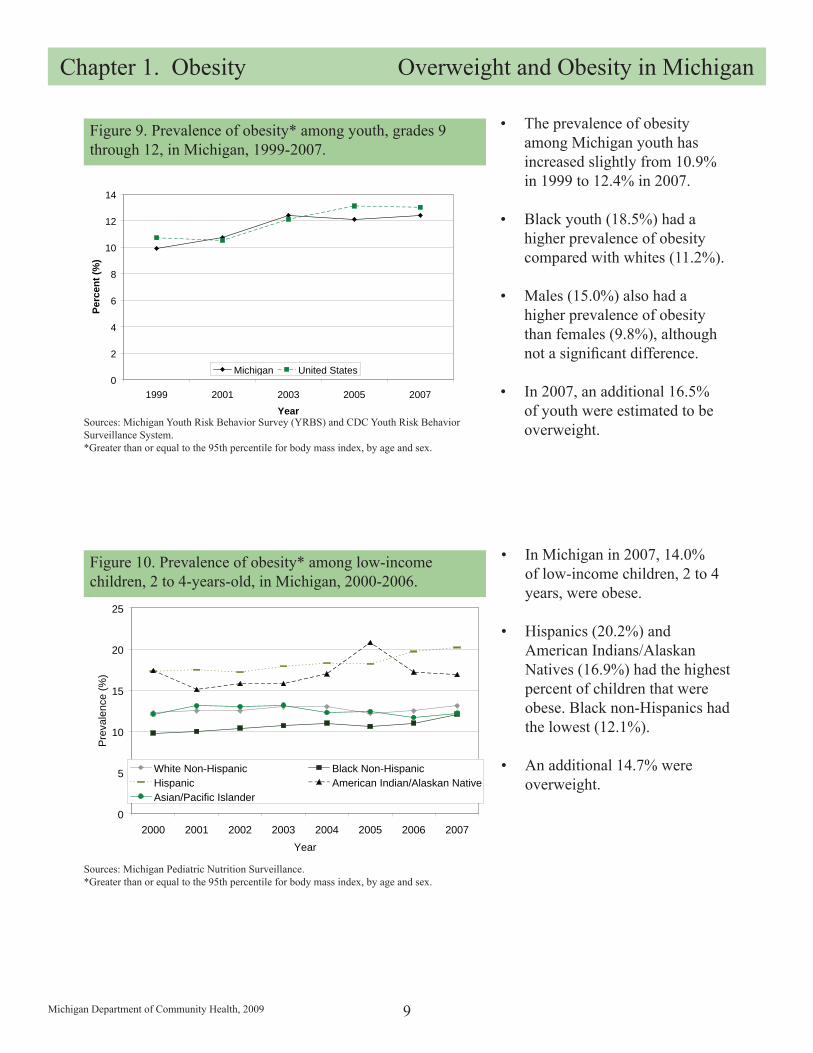
Figure 9. Prevalence of obesity* among youth, grades 9 through 12, in Michigan, 1999-2007.
The prevalence of obesity • among Michigan youth has increased slightly from 10.9% in 1999 to 12.4% in 2007.
Black youth (18.5%) had a • higher prevalence of obesity compared with whites (11.2%).
Males (15.0%) also had a • higher prevalence of obesity than females (9.8%), although not a signifi cant difference.
In 2007, an additional 16.5% • of youth were estimated to be overweight.Sources: Michigan Youth Risk Behavior Survey (YRBS) and CDC Youth Risk Behavior
Surveillance System.*Greater than or equal to the 95th percentile for body mass index, by age and sex.
Figure 10. Prevalence of obesity* among low-income children, 2 to 4-years-old, in Michigan, 2000-2006.
Sources: Michigan Pediatric Nutrition Surveillance.*Greater than or equal to the 95th percentile for body mass index, by age and sex.
In Michigan in 2007, 14.0% • of low-income children, 2 to 4 years, were obese.
Hispanics (20.2%) and • American Indians/Alaskan Natives (16.9%) had the highest percent of children that were obese. Black non-Hispanics had the lowest (12.1%).
An additional 14.7% were • overweight.
9
0
5
10
15
20
25
2000 2001 2002 2003 2004 2005 2006 2007Year
Prev
alen
ce (%
)
White Non-Hispanic Black Non-HispanicHispanic American Indian/Alaskan NativeAsian/Pacific Islander
Chapter 1. Obesity Overweight and Obesity in Michigan
Michigan Department of Community Health, 2009 i
Table of AppendicesAppendix A: A map of Michigan showing the local health department jurisdictions ............................... iiAppendix B: Overweight and obesity prevalence rates for Michigan adults, 2005 to 2007 .................... iiiAppendix C: The Healthy People 2010 goals related to obesity. ............................................................. ivAppendix D: List of abbreviations. ............................................................................................................ vAppendix E: Methods. .............................................................................................................................. vi Appendix F: Data sources. ...................................................................................................................... viiAppendix G: References ........................................................................................................................... iv
Chapter 1. Obesity Overweight and Obesity in Michigan
Michigan Department of Community Health, 2009
District#10
L. M. A. S.*
District #2
District #4
Central Michigan
Kent
Marquette
Western Upper Peninsula
Mid-Michigan
Chippewa
Huron
Iron-Dickinson
Sanilac
Menominee-Delta
Ionia
Bay
AlleganOakland
Tuscola
Barry-Eaton
Saginaw
Lapeer
Northwest Michigan
St. Clair
JacksonCalhoun
Lenawee
Ottawa
Berrien
Ingham
Monroe
Genesee
Van Buren-Cass
Midland
Wayne
Branch-Hillsdale-St. Joseph
Macomb
Kala-mazoo
Muskegon
BenzieLeelanau Grand
Traverse
DetroitWashtenaw
Livingston
Shiaw-assee
Appendix A: The Local Health Department Jurisdictions in Michigan.
* Luce-Mackinac-Alger-Schoolcraft
ii
Chapter 1. Obesity Overweight and Obesity in Michigan
Michigan Department of Community Health, 2009
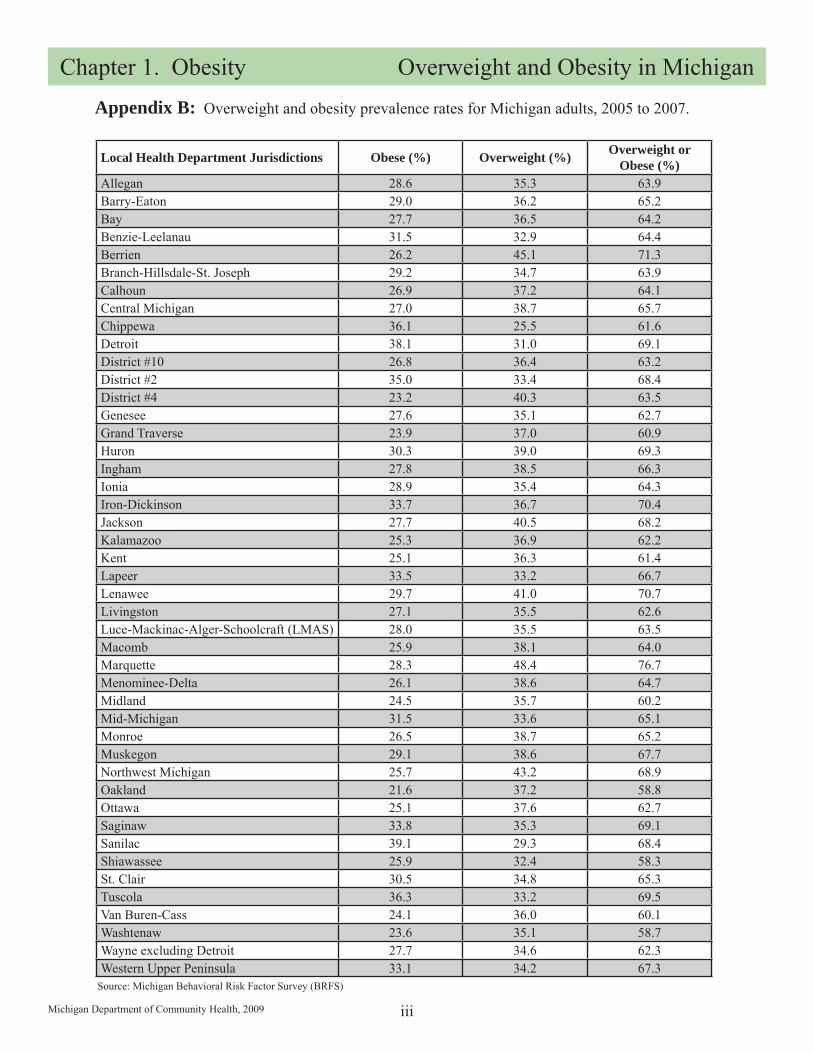
Local Health Department Jurisdictions Obese (%) Overweight (%) Overweight or Obese (%)
Allegan 28.6 35.3 63.9Barry-Eaton 29.0 36.2 65.2Bay 27.7 36.5 64.2Benzie-Leelanau 31.5 32.9 64.4Berrien 26.2 45.1 71.3Branch-Hillsdale-St. Joseph 29.2 34.7 63.9Calhoun 26.9 37.2 64.1Central Michigan 27.0 38.7 65.7Chippewa 36.1 25.5 61.6Detroit 38.1 31.0 69.1District #10 26.8 36.4 63.2District #2 35.0 33.4 68.4District #4 23.2 40.3 63.5Genesee 27.6 35.1 62.7Grand Traverse 23.9 37.0 60.9Huron 30.3 39.0 69.3Ingham 27.8 38.5 66.3Ionia 28.9 35.4 64.3Iron-Dickinson 33.7 36.7 70.4Jackson 27.7 40.5 68.2Kalamazoo 25.3 36.9 62.2Kent 25.1 36.3 61.4Lapeer 33.5 33.2 66.7Lenawee 29.7 41.0 70.7Livingston 27.1 35.5 62.6Luce-Mackinac-Alger-Schoolcraft (LMAS) 28.0 35.5 63.5Macomb 25.9 38.1 64.0Marquette 28.3 48.4 76.7Menominee-Delta 26.1 38.6 64.7Midland 24.5 35.7 60.2Mid-Michigan 31.5 33.6 65.1Monroe 26.5 38.7 65.2Muskegon 29.1 38.6 67.7Northwest Michigan 25.7 43.2 68.9Oakland 21.6 37.2 58.8Ottawa 25.1 37.6 62.7Saginaw 33.8 35.3 69.1Sanilac 39.1 29.3 68.4Shiawassee 25.9 32.4 58.3St. Clair 30.5 34.8 65.3Tuscola 36.3 33.2 69.5Van Buren-Cass 24.1 36.0 60.1Washtenaw 23.6 35.1 58.7Wayne excluding Detroit 27.7 34.6 62.3Western Upper Peninsula 33.1 34.2 67.3
Appendix B: Overweight and obesity prevalence rates for Michigan adults, 2005 to 2007.
Source: Michigan Behavioral Risk Factor Survey (BRFS)
iii
Chapter 1. Obesity Overweight and Obesity in Michigan
Michigan Department of Community Health, 2009
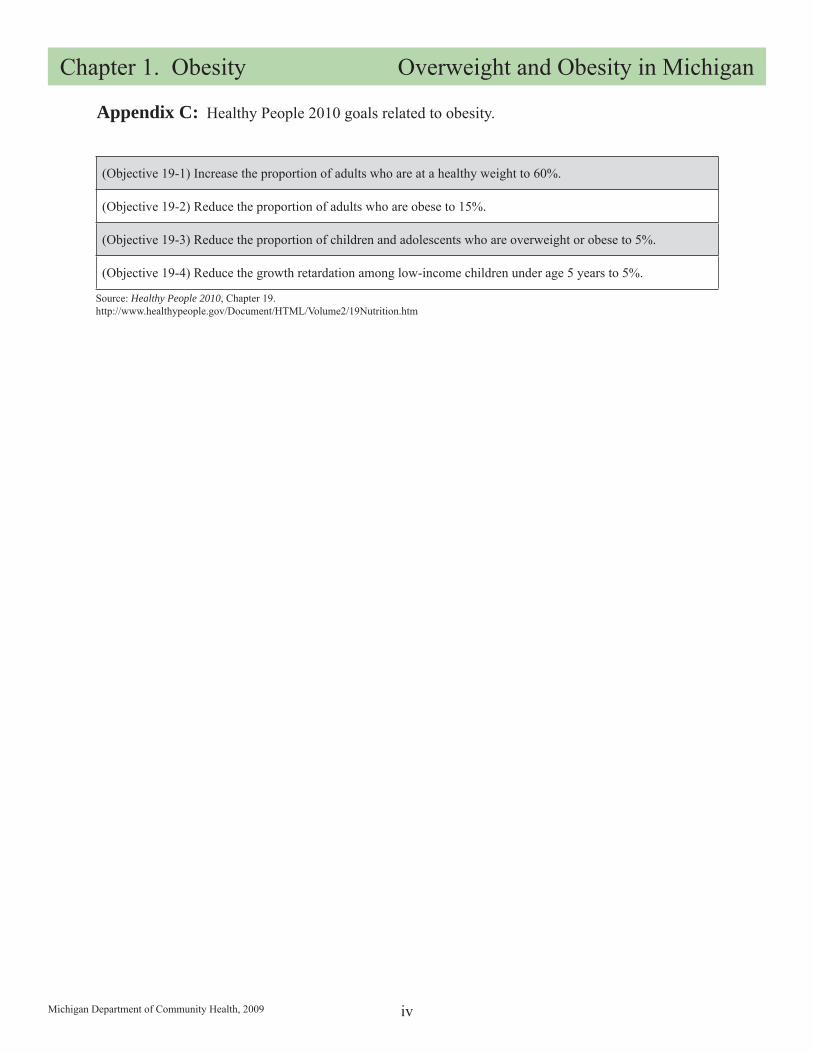
(Objective 19-1) Increase the proportion of adults who are at a healthy weight to 60%.
(Objective 19-2) Reduce the proportion of adults who are obese to 15%.
(Objective 19-3) Reduce the proportion of children and adolescents who are overweight or obese to 5%.
(Objective 19-4) Reduce the growth retardation among low-income children under age 5 years to 5%.
Appendix C: Healthy People 2010 goals related to obesity.
Source: Healthy People 2010, Chapter 19.http://www.healthypeople.gov/Document/HTML/Volume2/19Nutrition.htm
iv
Chapter 1. Obesity Overweight and Obesity in Michigan
Michigan Department of Community Health, 2009
BMI ..................... Body Mass IndexBRFS ................... Behavioral Risk Factor SurveyCDC .................... Centers for Disease Control and PreventionCHD .................... Coronary Heart DiseaseLHD .................... Local Health DepartmentL.M.A.S. ............. Luce-Mackinac-Alger-SchoolcraftMDCH................. Michigan Department of Community HealthPedNSS ............... Pediatric Nutrition Surveillance SystemWIC ..................... Women, Infants and ChildrenYRBS .................. Youth Risk Behavior Survey
Appendix D: List of abbreviations.
v
Chapter 1. Obesity Overweight and Obesity in Michigan
Michigan Department of Community Health, 2009
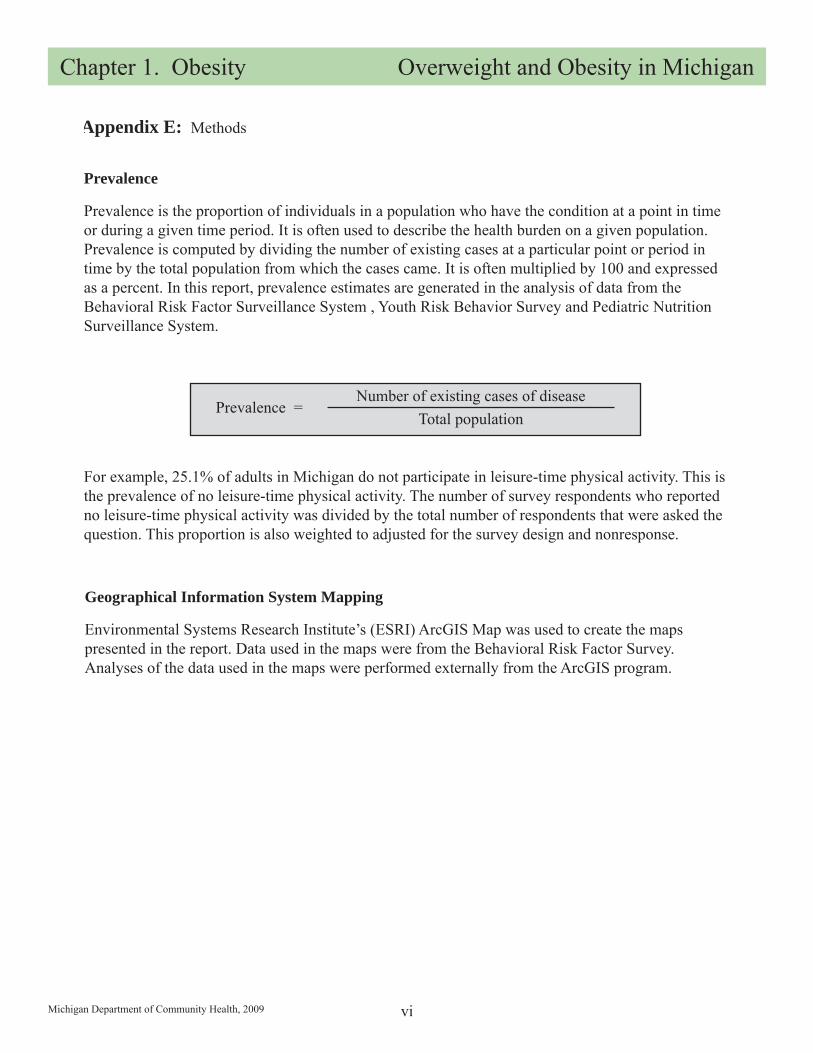
Appendix E: Methods
Prevalence =Number of existing cases of disease
Total population
Prevalence
Prevalence is the proportion of individuals in a population who have the condition at a point in time or during a given time period. It is often used to describe the health burden on a given population. Prevalence is computed by dividing the number of existing cases at a particular point or period in time by the total population from which the cases came. It is often multiplied by 100 and expressed as a percent. In this report, prevalence estimates are generated in the analysis of data from the Behavioral Risk Factor Surveillance System , Youth Risk Behavior Survey and Pediatric Nutrition Surveillance System.
For example, 25.1% of adults in Michigan do not participate in leisure-time physical activity. This is the prevalence of no leisure-time physical activity. The number of survey respondents who reported no leisure-time physical activity was divided by the total number of respondents that were asked the question. This proportion is also weighted to adjusted for the survey design and nonresponse.
Geographical Information System Mapping
Environmental Systems Research Institute’s (ESRI) ArcGIS Map was used to create the maps presented in the report. Data used in the maps were from the Behavioral Risk Factor Survey. Analyses of the data used in the maps were performed externally from the ArcGIS program.
vi
Chapter 1. Obesity Overweight and Obesity in Michigan
Michigan Department of Community Health, 2009
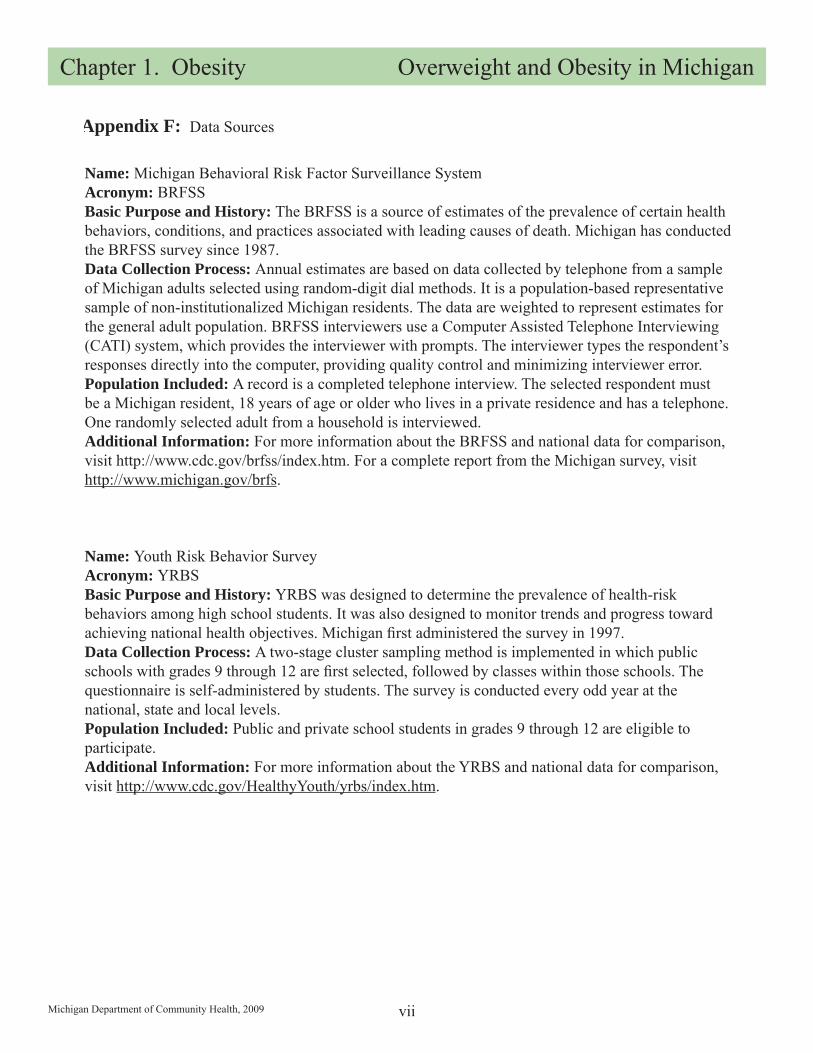
Name: Michigan Behavioral Risk Factor Surveillance SystemAcronym: BRFSSBasic Purpose and History: The BRFSS is a source of estimates of the prevalence of certain health behaviors, conditions, and practices associated with leading causes of death. Michigan has conducted the BRFSS survey since 1987. Data Collection Process: Annual estimates are based on data collected by telephone from a sample of Michigan adults selected using random-digit dial methods. It is a population-based representative sample of non-institutionalized Michigan residents. The data are weighted to represent estimates for the general adult population. BRFSS interviewers use a Computer Assisted Telephone Interviewing (CATI) system, which provides the interviewer with prompts. The interviewer types the respondent’s responses directly into the computer, providing quality control and minimizing interviewer error.Population Included: A record is a completed telephone interview. The selected respondent must be a Michigan resident, 18 years of age or older who lives in a private residence and has a telephone. One randomly selected adult from a household is interviewed.Additional Information: For more information about the BRFSS and national data for comparison, visit http://www.cdc.gov/brfss/index.htm. For a complete report from the Michigan survey, visit http://www.michigan.gov/brfs.
Name: Youth Risk Behavior SurveyAcronym: YRBSBasic Purpose and History: YRBS was designed to determine the prevalence of health-risk behaviors among high school students. It was also designed to monitor trends and progress toward achieving national health objectives. Michigan fi rst administered the survey in 1997. Data Collection Process: A two-stage cluster sampling method is implemented in which public schools with grades 9 through 12 are fi rst selected, followed by classes within those schools. The questionnaire is self-administered by students. The survey is conducted every odd year at the national, state and local levels.Population Included: Public and private school students in grades 9 through 12 are eligible to participate.Additional Information: For more information about the YRBS and national data for comparison, visit http://www.cdc.gov/HealthyYouth/yrbs/index.htm.
Appendix F: Data Sources
vii
Chapter 1. Obesity Overweight and Obesity in Michigan
Michigan Department of Community Health, 2009
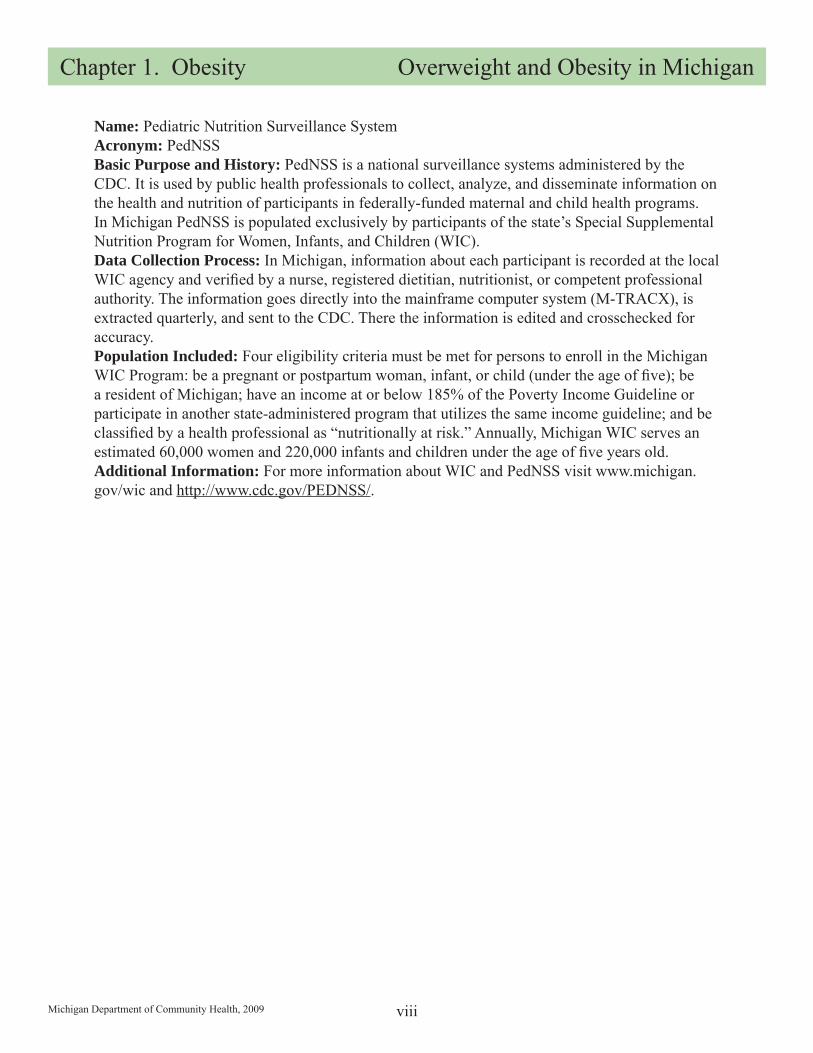
Name: Pediatric Nutrition Surveillance System Acronym: PedNSSBasic Purpose and History: PedNSS is a national surveillance systems administered by the CDC. It is used by public health professionals to collect, analyze, and disseminate information on the health and nutrition of participants in federally-funded maternal and child health programs. In Michigan PedNSS is populated exclusively by participants of the state’s Special Supplemental Nutrition Program for Women, Infants, and Children (WIC). Data Collection Process: In Michigan, information about each participant is recorded at the local WIC agency and verifi ed by a nurse, registered dietitian, nutritionist, or competent professional authority. The information goes directly into the mainframe computer system (M-TRACX), is extracted quarterly, and sent to the CDC. There the information is edited and crosschecked for accuracy. Population Included: Four eligibility criteria must be met for persons to enroll in the Michigan WIC Program: be a pregnant or postpartum woman, infant, or child (under the age of fi ve); be a resident of Michigan; have an income at or below 185% of the Poverty Income Guideline or participate in another state-administered program that utilizes the same income guideline; and be classifi ed by a health professional as “nutritionally at risk.” Annually, Michigan WIC serves an estimated 60,000 women and 220,000 infants and children under the age of fi ve years old. Additional Information: For more information about WIC and PedNSS visit www.michigan.gov/wic and http://www.cdc.gov/PEDNSS/.
viii
Chapter 1. Obesity Overweight and Obesity in Michigan
Michigan Department of Community Health, 2009 ix
Appendix G: References
1. U.S. Department of Health and Human Services. “The Surgeon General’s call to action to prevent and decrease overweight and obesity”. U.S. Department of Health and Human Services, Public Health Service, Offi ce of the Surgeon General; 2001.2. Centers for Disease Control and Prevention. Division of Nutrition Physical Activity and Obesity. http://www.cdc.gov/nccdphp/dnpa/index.html3. Department of Health and Human Services and Centers for Disease Control and Prevention. “Body Mass Index.” http://www.cdc.gov/nccdphp/dnpa/bmi/.4. American Heart Association. “Heart Disease and Stroke Statistics – 2008 Update.” Dallas, Texas: American Heart Association. 2008, American Heart Association.
MDCH is an equal opportunity employer, service and program provider.