ownership structure and the public private equity … · ownership structure and the public /...
TRANSCRIPT

Ownership Structure and The Public / Private Equity
Choice*
Emma Schultz Garry Twite† Research School of Finance, Actuarial
Studies and Applied Statistics Department of Finance
University of Melbourne Australian National University Carlton, VIC 3010, Australia Canberra, ACT 0200, Australia [email protected]
May 5, 2015
* This paper has benefited from the useful comments and suggestions provided by Andres Almazan, Aydogan Alti, Fernando Anjos, Jonathan Cohn, Carole Comerton-Forde, Neil Fargher, Jay Hartzell, Jacquelyn Humphrey, Wai-Man (Raymond) Liu, Spencer Martin, Phong Ngo, Clemens Sialm, Gloria Tian, Sheridan Titman, Geoff Warren and seminar participants at the Australian National University, Monash University, University of Newcastle and University of Texas at Austin. † Corresponding author, Department of Finance, Faculty of Business & Economics, The University of Melbourne, Carlton, VIC 3010, Australia; email: [email protected]; phone: +61 3 9035 6172; fax: +61 3 8344 1900.

2
Ownership Structure and The Public / Private Equity Choice
Abstract
We take advantage of both the relatively high concentration of insider ownership in
Australian firms, absent the dominance of founding families, and the widespread issuance
of non-tradable rights to examine the heterogeneous influence of insider and monitor
shareholders on the firm’s public/private choice. By focusing on determinants of the
underwriting arrangements in these issues, we highlight monitoring demand, not control
dilution avoidance, as the key driver of the public/private choice in a general setting
where firms are controlled by non-founding insiders. Importantly, the nature of this
demand is shown to depend on pre-issue ownership concentration: While firms with low
pre-issue monitor concentration use private placements as a means of acquiring
additional monitoring, those with higher concentration use private placements to
substitute insiders for monitors, reducing the level of independent oversight.
JEL: G32
Keywords: Equity Issuance, Private/Public Choice, Insiders, Monitors, Rights Issues

1
1. Introduction
The vast majority of firms will, at some stage, have insufficient internal funding to
finance both ongoing operations and growth investments. At this point, firms turn to
external sources to help overcome their funding shortfall and, to the extent they issue
equity, face a choice between making a public issue1 or private placement (“the
public/private choice”). In this paper, we examine the influence of ownership structure
on this public/private choice. In particular, we consider the tradeoff between the demand
for enhanced monitoring and the avoidance of control dilution by insiders, focusing on
determinants of the underwriting decisions made in relation to non-tradable rights issues
to provide evidence in this regard. As pro-rata allocations made to existing shareholders,
the choice regarding participation in non-renounceable issues rests solely with
shareholders who, in the absence of tradability, can only opt out of a given issue by
letting the rights expire. Consequently, the placement of unsubscribed shares can only be
undertaken by either the underwriter or management, meaning the underwriting decision
is the sole determinant of whether unsubscribed shares are placed privately or publicly.2
By choosing to underwrite the issue, managers transfer responsibility for placing
unsubscribed shares to the underwriting firm, equivalent to a firm commitment offering.
Conversely, by electing not to underwrite a non-tradable issue, managers retain the right
1 Empirical evidence suggests that firms exhibit clear preferences for particular methods of public issuance (Eckbo et al, 2007). Specifically, while most U.S. firms obtain equity financing via firm commitment underwritten seasoned equity offerings (“SEOs”), rights offerings (both standby underwritten and uninsured) continue to be the dominant issuance method in other regions including Australasia and Europe (Eckbo, 2008; and, Massa et al, 2013). Rights issues see current shareholders given a short-term option or “right” to purchase new shares on a pro-rata basis, invariably at a discount to their current market value. 2 This is contrast to SEOs and tradable rights offers, where issues are made to the public from the outset or can be accessed by the public via the purchase of tradable rights, respectively, and are therefore fundamentally public in nature regardless of underwriting arrangements.
2
to place unsubscribed shares with investors of their choosing, that is they choose to make
a private placement.
We build on the existing literature by providing evidence on whether the
observation that family-controlled firms seek to avoid control dilution when issuing
equity (Cronqvist and Nilsson, 2005) extends to the more general setting of firms
controlled by non-founding insiders. Exploring the role of ownership structure in equity
issues made by Australian listed firms allows us to take advantage of their relatively high
concentration of insider ownership, absent the dominance of founding families (Glassop,
2009; Mroczkowski and Tanewski, 2007; and, Masulis et al, 2011), and their use of an
issue type not widely adopted elsewhere, namely the non-tradable rights issue.3
Moreover, studying whether both insider and monitor shareholder ownership affect the
underwriting decisions made in relation to these issues allows us to acknowledge the
heterogeneity of these two shareholder groups as well as the tradeoff made between the
demand for increased monitoring and a desire to avoid control dilution when making
seasoned equity offerings.
We report two main results. Firstly, monitoring demand, not control dilution
avoidance, is the key driver of the public/private choice, with firms having larger and
more concentrated pre-issue monitor shareholdings being more likely to privately place
unsubscribed shares via non-underwritten non-tradable rights issues. However, post-
issue ownership changes for firms electing to make private placements show the nature of
3 The Australian equity market is characterised by both tradable and non-tradable rights issues (referred to as renounceable and non-renounceable issues, respectively, in the Australian context). These issuance methods differ fundamentally in their treatment of the entitlements of current shareholders who elect not to participate in the offer. While current shareholders are able to sell tradable rights, shareholders who do not wish to participate in a non-tradable issue must simply allow the offer to expire. Notwithstanding these differences, tradable and non-tradable issues do not differ materially in terms of their disclosure requirements or the lack of a limit on the maximum allowed level of issue discount.

3
this demand varies markedly with firms’ pre-issue monitor ownership concentration. In
particular, companies with low pre-issue monitor concentration exhibit a positive demand
for monitoring, using private placements as a means of purchase additional oversight of
managers. In contrast, firms with higher pre-issue monitor concentration use these issues
to substitute inside for monitor concentration and, in doing so, reduce the likelihood of
outside shareholder oversight of managers.
Overall, our results highlight monitoring demand, not control dilution avoidance,
as the key driver of the public/private choice in the more general setting of firms
controlled by non-founding insiders. These findings are in stark contrast to those
documented in relation to family-controlled firms, where control dilution avoidance is a
primary determinant of the public-private choice (Cronqvist and Nilsson, 2005).
Importantly, our findings stem from investor-level classification of each type of
owner as monitors or insiders and a research design which mitigate measurement issues
in previous studies stemming from the comparison of fundamentally different issue
methods. With respect to the former, we define monitors to include institutional
shareholders identified within the existing literature to be effective in monitoring the
activities of management4 and individual outsiders whose time-series pattern of
significant ownership in multiple listed firms suggest they behave like professional
investors that are most likely independent of management and, thus, to closely monitor
managerial actions. Conversely, as the name suggests, insiders are the officers and
4Institutional investors include superannuation and pension funds, which have a dominant position within the Australian market. During our sample period, superannuation and pension funds represented 63% of all institutional invested funds, with the residual being equally divided between mutual funds and life insurance. As noted previously, Cremers and Nair (2005) argue that pension funds face fewer conflicts of interest than other institutional investors and they tend to be effective in monitoring the activities of management.

4
directors of the firm they own shares in. Classification is undertaken for each individual
shareholder and also gauges the size and concentration of their shareholdings at the time
the non-tradable offer is made. By studying how both groups affect both the
public/private choice and the outcome of a private placement, we not only acknowledge
their heterogeneity but also recognize the tradeoff made between the demand for
increased monitoring and a desire to avoid control dilution when making seasoned equity
offerings. In focusing on both size and concentration, we employ a more robust measure
of monitoring and control than advanced previously (see, for example, Wu, 2004).
Finally, in terms of research design, existing public/private choice studies
invariably confound issuance method and underwriting decisions, comparing seasoned
equity offerings or tradable rights issues, both underwritten and non-underwritten, with
private placements (see, for example, Wu, 2004; Eckbo and Norli, 2005; and, Cronqvist
and Nilsson, 2005). In contrast, we focus on a single corporate decision, namely the
underwriting choice, made in relation to otherwise identical methods of equity raising
and, in doing so, minimize confounding issues.,
The remainder of the paper is organized as follows. Section 2 describes institutional
structure underlying Australian equity issues during the period of this study. Section 3
introduces our methodology. Section 4 describes the sample. Section 5 presents our
results and Section 6 draws some conclusions.
2. The Australian Institutional Landscape
Rights issues are the dominant method of seasoned equity issuance in Australasia (Eckbo,
2008; and, Massa et al, 2013). Their popularity in Australia can, at least in part, be

5
explained by the Australian Securities Exchange (“the ASX”) listing rules. Specifically,
while ASX Listing Rule 7.1 limits the size of seasoned offerings that can be made
without prior shareholder approval to 15% of issued capital, Exemption 1 renders certain
specific issuance methods, including rights offers, exempt from these limitations. This
method of issuance is made even more attractive by the relatively relaxed disclosure
requirements attached to them as a pro-rata offer type.
Rights issues conducted on the ASX can either be tradable, allowing shareholders
who do not wish to exercise their right to participate in the pro-rata offer to trade this
entitlement on the ASX, or non-tradable. Shareholders not wishing to take up rights in a
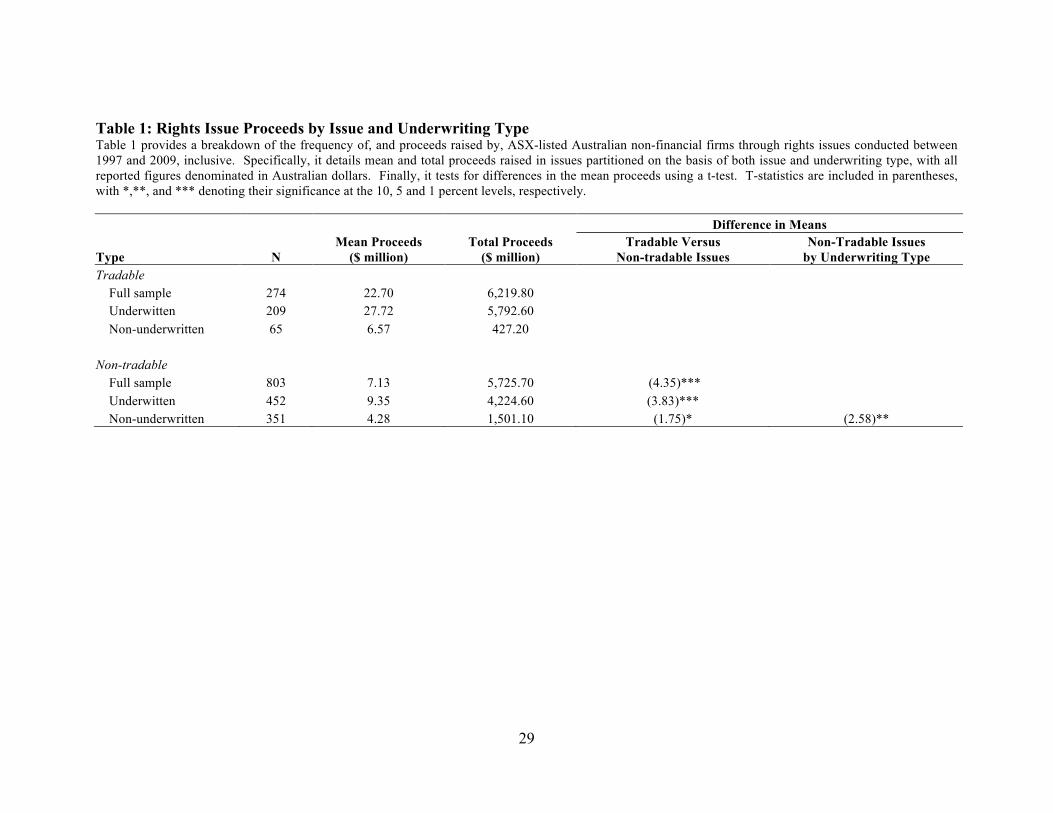
non-tradable issue simply leave their offer to expire. Table 1 provides a breakdown of
rights issues conducted by ASX-listed Australian firms in the period 1997 to 2009,
inclusive, detailing both the frequency of, and proceeds raised by, issues during this
period. Examination of the table reveals that, while non-tradable rights issues were far
more common during our sample period, they were smaller in size: Although there were
803 (274) non-tradable (tradable) issues conducted over the period, they only raised an
average of $7.13 million ($22.70 million) for the issuing firm. Further, as a cautionary
note, non-tradable issues tend to be undertaken by smaller, less-levered firms. More
specifically, total assets (leverage5) for firms undertaking tradable versus non-tradable
issues averaged $121.29 million (0.1898) and $30.06 million (0.0829), respectively.
Despite first impressions, we conjecture that transaction costs incurred by the
issuing company do not vary markedly based on rights issue tradability. In particular,
disclosure requirements are identical for both issue types, and there is no limit imposed
on the maximum permissible issue discount in either case. Indeed, it is for these reasons 5 Measured as the book value of debt over the market value of the firm.
6
that the use of non-tradable rights issues in Australia is so widespread. Further, to the
extent tradable rights are traded on the ASX, and incur additional listing fees for the
issuing firms, they are only traded for very short periods,6 with lapsed rights sold via a
bookbuilding at the conclusion of the trading period. Thus, the incremental transaction
costs for tradable rights issues are minimal.
Three underwriting arrangements are utilized by firms participating in non-tradable
rights issues, namely standby underwriting, best-efforts underwriting and non-
underwriting. The key distinction between standby underwriting and non-underwriting
lies in the right to allocate unsubscribed shares. In the case of standby underwriting, the
underwriter purchases the unsubscribed shares from the firm before placing them. As the
proceeds of standby underwritten offerings are guaranteed by the underwriter and
responsibility for the placement of unsubscribed shares rests with them, these issues are
equivalent to firm commitment offerings. In contrast, non-underwritten issues see
management maintain responsibility for the placement of unsubscribed shares, playing a
significant role in identifying the investors who receive the unsubscribed portion of
shares.7 Best-efforts underwriting differ from standby underwriting agreements in that,
while the underwriter agrees to assist management in both promoting the issue and
allocating unsubscribed shares, they do not agree to purchase the unsubscribed shares
from the issuing firm. For this reason, we classify best-efforts agreements as non-
underwritten issues.8
6 Increasingly, tradable issues are completed on an accelerated basis and, thus, do not involve any exchange trading of rights at all. 7 Within our sample all firms raised the full amount sought exante, either via enforcing the underwriting agreement or private placement. 8 We test the robustness of our results to this classification in Section 5.3.

7
Table 1 highlights the dominance of underwritten non-tradable rights issues in our
sample, with approximately 56% of non-tradable issues conducted in this manner.
[Table 1 about here]
3. Methodology
In examining the determinants of the public/private choice, we consider the relationship
between the likelihood of a firm undertaking a private placement in the form of an non-
underwritten non-tradable rights issue and pre-issue concentration of both monitors’ and
insiders’ ownership as well as insiders’ pre-issue control margin. Thereafter, we consider
changes in ownership concentration measures following the successful completion of the
offering.
3.1 Explanatory Variables
3.1.1 Monitoring Demand
Private placements see large bundles of shares allocated to a small number of investors.
Given empirical evidence that the incentive of shareholders to monitor management
differs based on their independence (Yermack, 1996) and the magnitude of their holdings
relative to those of other shareholders (Fiss, 2006), concentrated independent
shareholders should be best incentivized to monitor the actions of management (see, for
example, Shleifer and Vishny, 1986; and, Wruck, 1989). Therefore, it follows that firms

8
wishing to increase the monitoring of management will use private placements to affect
an increase in the concentration of independent shareholdings.9
We define monitoring shareholders to include managed funds, superannuation,
pension funds and other financial firms identified within the existing literature to be
effective in monitoring the activities of management (see, for example, Cremers and
Nair, 2005) together with individual outsiders whose time-series pattern of significant
ownership in multiple listed firms suggests they behave like professional investors that
are most likely to be independent of management, and, thus, to closely monitor
managerial actions. With respect to the latter, we include shareholders who are not
officers or directors of by the firm and with holdings of at least 5% of the firm’s total
shares in at least 5 firms in any year and/or in a given firm for at least 5 years. We
measure the size and concentration of monitors’ shareholdings using a Herfindahl
measure (“Monitor Herfindahl”) calculated as:
Where Monitor Herfindahli,t is the Herfindahl measure of the size and
concentration of monitor ownership in firm i at the end of the reporting year immediately
preceding the pro-rata issue, t; and, Shareholdingj,i,t is the shareholding of monitor j in
9 Wu (2004) uses data on SEOs conducted by a sample of high-technology post-IPO firms to document a decrease in the blockholdings of shareholders following private placements. Although Wu (2004) selects these firms to ensure a sample with high levels of information asymmetry, evidence suggests that they are also more likely to be subject to financial constraint and / or financial distress (see, for example, Brophy et al, 2009; and, Chaplinsky and Haushalter, 2010). This, in turn, will reduce the importance of monitoring as a motive for the firms undertaking a private placement.
2
, ,,
1, ,
1
nj i t
i t nj
j i tj
ShareholdingMonitor Herfindahl
Shareholding=
=
⎛ ⎞⎜ ⎟⎜ ⎟=⎜ ⎟⎜ ⎟⎝ ⎠
∑∑

9
firm i at this time. With a demand for enhanced monitoring, we expect that the Monitor
Herfindahl will increase following a private placement in the form of a non-underwritten
non-tradable rights issue, Nonunderwritten. Where Nonunderwritten is an indicator
variable equal to one if a rights issue is both non-tradable and non-underwritten, and zero
otherwise.
3.1.2 Control Dilution Avoidance
To the extent that seasoned equity offerings see shares placed with outsiders, they
threaten the private benefits insiders can extract from the firm. Thus, to the extent they
are able, insiders will ensure that new shares are placed privately and in a way that
ensures control dilution does not ensue. Consistent with this conjecture, Cronqvist and
Nilsson (2005) document dilution avoidance as an important determinant of the
private/public choice, with family controlled firms shying away from issuance methods
where this is mostly likely to occur. We extend Cronqvist and Nilsson’s (2005) analysis
to study control dilution avoidance by non-founding insiders in a market characterized by
relatively high concentration of insider ownership where family firms are not the
dominant organizational form (Glassop, 2009; Mroczkowski and Tanewski, 2007; and,
Masulis et al, 2011). In doing so, we argue that these shareholders will be averse to
equity issues which have the potential to adversely affect their control by reducing their
level of ownership concentration, introducing a new blockholder who may monitor their
actions and / or increasing the monitoring activity being undertaken by existing owners.
In our experiment, the potential for such control dilution arises when the underwriter is
responsible for allocating the unsubscribed shares in an underwritten non-tradable issue,

10
as they purchase any unsubscribed shares from the firm prior to placing them.
Conversely, non-underwritten non-tradable issues allow management to place
unsubscribed shares with a party of their choosing.
While we believe insiders’ preference for non-underwritten non-tradable issues
will exist regardless of their level of pre-issue ownership, the extent to which insiders can
avoid control dilution by influencing with whom shares are placed depends critically on
both the size and concentration of their ownership at the time equity is placed.
Specifically, the higher and more concentrated their ownership before the issue, the better
placed they are to ensure issuance methods with the potential to dilute their control are
avoided. That is, the more concentrated pre-issue insider ownership is, the more likely
the firm will undertake a private placement. As with monitor ownership, we measure the
size and concentration of insider holdings with a Herfindahl measure (Inside Herfindahl),
and expect that firms with high pre-issue values of this metric will seek to preserve or
enhance the status quo via these private placements. More specifically, with the
avoidance of control dilution, we expect that Inside Herfindahl (Monitor Herfindahl) will
not decrease (increase) following the completion of a non-underwritten non-tradable
rights issue, Nonunderwritten, in these cases.
In addition, we recognize that the extent to which insiders can avoid control
dilution by influencing with whom shares are placed also depends on the size of their
control margin at the time equity is placed. Specifically, the larger their control margin,
the better placed they are to ensure issuance methods with the potential to dilute their
control are avoided. We measure the control margin as the difference between total
11
insider ownership and total monitor ownership divided by the ownership of the firms’ top
20 shareholders (Insider Control Margin).
3.2 Firm Characteristics Existing literature documents a positive relationship between the level of information
asymmetry faced by a firm and the likelihood it will undertake a private placement,
arguing concentrated private investors are most likely to incur the cost associated with
learning about such firms (see, for example, Hertzel and Smith, 1993; Chemmanur and
Fulghieri, 1999; Wu, 2004; Cronqvist and Nilsson, 2005; and, Gomes and Phillips, 2006).
We control for information asymmetry by including various proxies in our
regressions. Measures previously employed as information asymmetry proxies are
varied but are commonly related to analyst coverage or activity (see, for example, Wu,
2004; and, Gomes and Phillips, 2007). As our sample is characterized by a relatively low
level of, and low cross-sectional variation in, analyst coverage, we utilise other measures
of information asymmetry. Specifically, consistent with Wu (2004), we include bid-ask
spread, defining our measure as the 12-month average of the daily time-weighted average
bid-ask spread (Spread). In addition, consistent with Wu (2004) and Cronqvist and
Nilsson (2005), we employ an age-based measure, equal to the natural logarithm of the
years since incorporation (ln(Age)), in testing. Based on existing evidence, we expect
information asymmetry costs to result in a negative (positive) relationship between
12
ln(Age) (Spread) and whether the firm undertakes a private placement in the form of a
non-underwritten non-tradable rights issue (Nonunderwritten).10
We also include characteristics which the existing literature (Wu, 2004, Cronqvist
and Nilsson, 2005, Gomes and Phillips, 2007, Balachandran et al, 2008) identifies as
affecting the firm’s relative need for, and supply of, funding in the reporting year
immediately preceding their pro-rata issue and, thus, their likelihood of opting for the
issuance method with the greatest chance of raising the requisite monies. Specifically,
with respect to the former, we control for: Size, measured as the natural logarithm of total
assets (ln(Assets)); Growth prospects, measured as the market value of equity scaled by
the book value of equity (Price/Book); and, Capital expenditure, or the ratio of capital
expenditure to total assets (Capex). We control for firms’ supply of funds by including
measures of their: Liquid assets, defined as ratio of cash and marketable securities to total
assets (Cash); Leverage, or the book value of their total debt divided by the sum of the
book value of total debt and the market value of common stock outstanding (Leverage)11;
Profitability, or the ratio of earnings before interest, taxes, depreciation and
amortization12 scaled by total assets (EBITDA); and, Financial constraint, measured using
an indicator variable equal to one if a firm is in the top tertile when firms are ranked by
10 As detailed in Section 5.3, robustness testing also sees us employ both the number of analysts following the firm and an indicator variable equal to one if the firm is followed by one or more analysts as alternative proxies for information asymmetry. 11 Ursel (2006) reports the use of rights issues in the US as largely confined to financially distressed firms. While these findings suggest a potential financial distress bias in our sample, we argue it is unlikely given the widespread use of rights issues in Australia. Regardless, we control for financial distress by including financial leverage in our regressions. 12 We use this in preference to earnings before interest and taxation, EBIT, which has the potential to be distorted by large depreciation charges likely made by the numerous capital-intensive mining firms included in our sample.
13
leverage and it did not pay a cash dividend during the year, and zero otherwise
(Constraint)13.
Finally, similar to Cronqvist and Nilsson (2005), we include an expected take-up
measure in modeling to control for the predicted negative relationship between a rights
offering’s adverse selection costs and the estimated rate of shareholder participation at a
given level of undervaluation (Eckbo and Masulis, 1992). Our expected take-up measure
(Take-up) is equal to the fitted value obtained by regressing the ratio of proceeds raised to
funds sought through the issue (Proceeds), against the percentage discount offered on
shares purchased under the rights issue relative to the market price current at the time of
the announcement of the issue (Discount), shareholdings of the firms’ Top 20 owners
(Top Ownership) and the natural logarithm of the market value of equity (ln(MktCap)).
3.3 Pre-Issue Ownership and the Public/Private Choice
We employ a logistic regression to examine the relationship between the levels of pre-
issue monitor and insider concentration as well as the insider control margin and whether
firms decide to undertake a private placement in the form of a non-underwritten non-
tradable rights issue (Nonunderwritten), fitting a model of the following form:
𝑁𝑜𝑛𝑢𝑛𝑑𝑒𝑟𝑤𝑟𝑖𝑡𝑡𝑒𝑛!,! = 𝛼 + 𝛽𝑀𝑜𝑛𝑖𝑡𝑜𝑟 𝐻𝑒𝑟𝑓𝑖𝑛𝑑𝑎ℎ𝑙!,!!! + 𝛿𝐼𝑛𝑠𝑖𝑑𝑒𝑟 𝐻𝑒𝑟𝑓𝑖𝑛𝑑𝑎ℎ𝑙!,!!! + 𝜃𝐼𝑛𝑠𝑖𝑑𝑒𝑟 𝐶𝑜𝑛𝑡𝑟𝑜𝑙 𝑀𝑎𝑟𝑔𝑖𝑛!,!!! + 𝛾𝐹𝑖𝑟𝑚 𝐿𝑒𝑣𝑒𝑙 𝐶𝑜𝑛𝑡𝑟𝑜𝑙𝑠!,!!! + 𝜗𝐼𝑛𝑑𝑢𝑠𝑡𝑟𝑦 𝐷𝑢𝑚𝑚𝑖𝑒𝑠!,!!! + 𝜀!,!
Where Firm Level Controlsi,t-1 are vectors comprising our information asymmetry
proxies and firm-level accounting variables as previously defined, and Industry 13 As per note 11, we also include an estimate of financial constraint in response to the findings documented by Ursel (2006).

14
Dummiesi,t-1 is a 1-digit industry membership indicator variable. All variables are
measured in the year before the rights issue is announced.
3.4 Changes in Ownership Concentration
We study post-issue changes in the size and concentration of both monitor and insider
shareholdings, considering whether these changes differ systematically by underwriting
type. More specifically, defining the year a firm undertakes a rights issue as t, we first
perform a t-test of differences in the mean changes in both monitor ownership
concentration (ΔMonitor Herfindahl) and insider ownership concentration (ΔInside
Herfindahl) for underwritten versus non-underwritten non-tradable issues between years
t-1 and t+1. If firms use private placements to purchase additional monitoring, we would
expect the mean change in monitor ownership concentration for non-underwritten non-
tradable issues to be significantly larger than for underwritten non-tradable issues.
Conversely, a significantly larger (smaller) mean change in insider (monitor) ownership
concentration for non-underwritten issues relative to underwritten issues would be
consistent with the avoidance of control dilution.
Next we narrow our focus to non-underwritten non-tradable rights issues,
examining whether the tradeoff between the demand for monitoring and the avoidance of
control dilution differs based on the level of pre-issue ownership concentration. To the
extent that private placements are drive by a demand for monitoring, we would expect
that firms with low pre-issue monitor ownership concentration would experience a
significant increase in this concentration as a result of the issue.
15
4. Data
Our sample comprises all rights issues announced by ASX-listed Australian non-financial
firms between 1997 and 2009, inclusive.14 To better understand the dimensions along
which non-tradable offers differ from their tradable equivalents, we also include details
of the latter. We exclude issues made by financial firms, or those with a 1-digit Standard
Industry Classification (“SIC”) code equal to 6, from our sample given fundamental
differences in their operations and regulation. Details of our issues of interest are sourced
from Thomson Reuters SDC Platinum. Thereafter, we source details of Top 20
shareholdings for firms making non-tradable issues from the annual reports available via
Connect4. We categorize shareholders included in these lists as insiders if they are
officers and directors of the issuing firm and monitors if their identity or cross-sectional
and time-series pattern of ownership suggests they will likely monitor the actions of
management. Accounting and share price data for issuing firms are then obtained from
Thomson Reuters Worldscope and Thomson Reuters Datastream, respectively. All
explanatory variables are winsorized at the 0.25th and 99.75th percentiles.
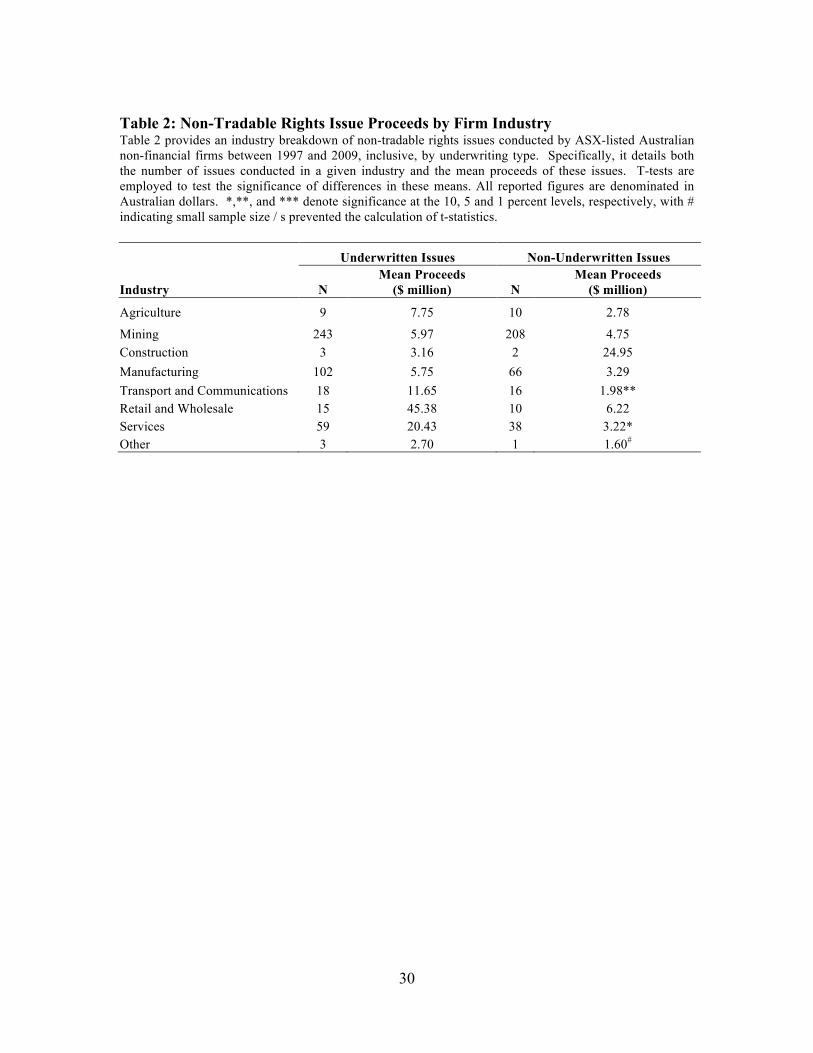
Our final sample comprises 803 non-tradable rights issues made by 562 unique
firms.15 As noted previously, 462 (351) of these issues are underwritten (non-
underwritten). Table 2 provides an industry breakdown of the sample of non-tradable
rights issues by underwriting type. Examination of this table yields two conclusions.
14 Cronqvist and Nilsson (2005) remove all rights issues that have a private placement attached to them. Unfortunately, our data sources do not permit the identification and, thus, exclusion of these issues from testing. While we acknowledge the noise these issues introduce, their inclusion in our sample only biases against us finding a significant result for the role of monitoring in the public/private choice. Thus, any significant result we do find is particularly strong. 15 While visual examination suggests an increase in the annual number announced after 2000 in our sample, subsequent investigation confirms this is increase is the result of improved coverage by our chosen databases rather than any changes in regulation. Moreover, with this exception, we observe no clear time-series pattern in the number of issues made.

16
Firstly, for a given industry, non-underwritten non-tradable issues are invariably smaller
and less frequent than underwritten non-tradable issues; and, Secondly, the weighting of
industries for issuing firms is reasonably representative of the market overall. One
notable exception is mining firms, who are slightly over-represented in our sample.
[Table 2 about here]
17
5. Results
Using our sample of non-tradable rights issues, we use two distinct but complementary
approaches to test our predictions regarding the public/private choice. Specifically, we
first consider the relationship between the pre-issue level of ownership concentration, the
insider control margin and the likelihood the firm undertakes a private placement.
Thereafter, we consider post-issue changes in ownership concentration to better
understand the outcomes of making such a placement.
5.1 Pre-Issue Ownership Concentration, the Insider Control Margin and the
Public/Private Choice
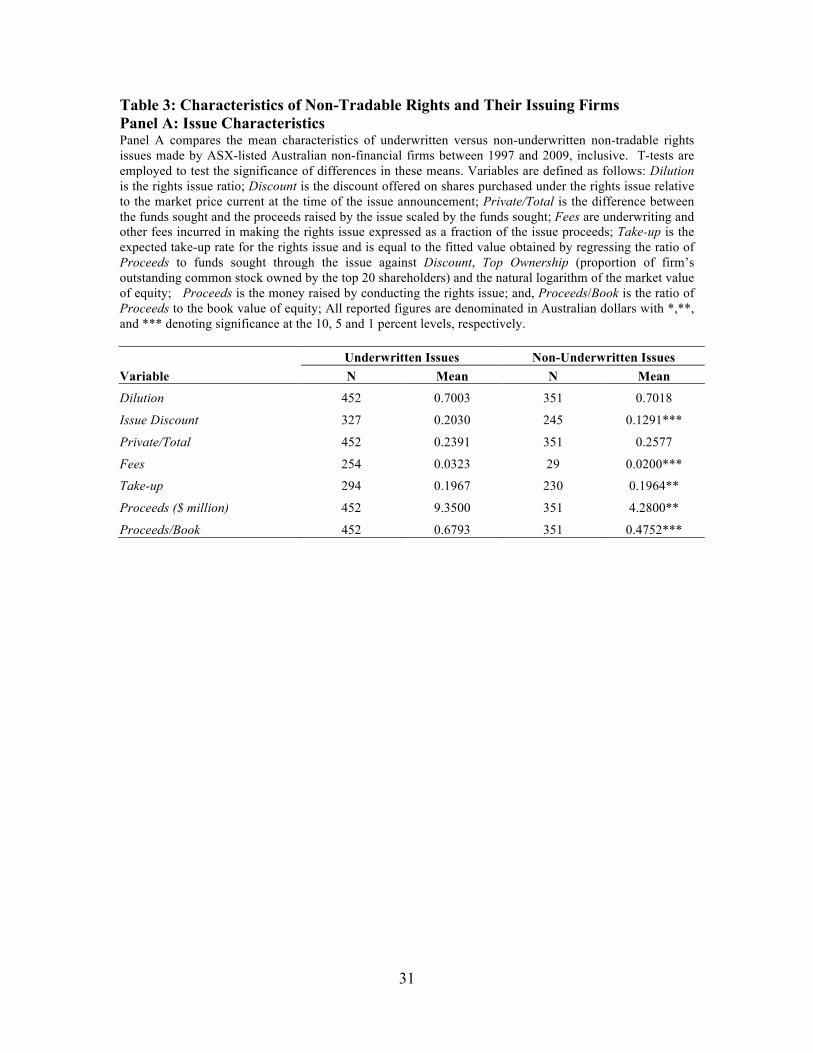
Panel A of Table 3 focuses on mean issue characteristics by underwriting type, also
presenting the results of tests for differences in these means. Results suggest that both
proceeds and expected take-up rates are smaller for non-underwritten than underwritten
issues. The fact the issue discount is smaller for non-underwritten non-tradable issues is
consistent with firms using these issues as de-facto private placements. The lower the
discount, the less subscribed the issues will be and, thus, the greater the proportion of
shares that can be placed at the discretion of company management.
Panel B of Table 3 reports mean firm-level, rather than issue-level, characteristics
of issuing firms. It is clear that non-underwritten issues are undertaken by smaller
capital-intensive firms. However, there is no evidence of a statistically significant
difference in information asymmetry between firms making underwritten versus non-
underwritten issues. Further, irrespective of whether the issue is underwritten, we observe

18
higher levels of insider and monitor ownership, together with the level of holdings of the
top 20 shareholders.
Examination of Panel B of Table 3 reveals two interesting features of the data.
Firstly, irrespective of whether the issue is underwritten, monitor shareholders hold a
higher fraction of the firm than insiders and, hence, the insider control margin is negative.
Secondly, results show that the concentration of monitor shareholdings is also higher than
the concentration of insider shareholdings. Interestingly, the pre-issue concentration of
monitor shareholdings and insider control margin are also higher in those firms
undertaking non-underwritten non-tradable issues. In contrast, there is no evidence of a
statistically significant difference in the pre-issue concentration of insider shareholdings
in firms making underwritten versus non-underwritten issues. Taken together, these two
results provide preliminary evidence that the demand for monitoring, rather the desire to
avoid control dilution, drives the public/private choice.
[Table 3 about here]
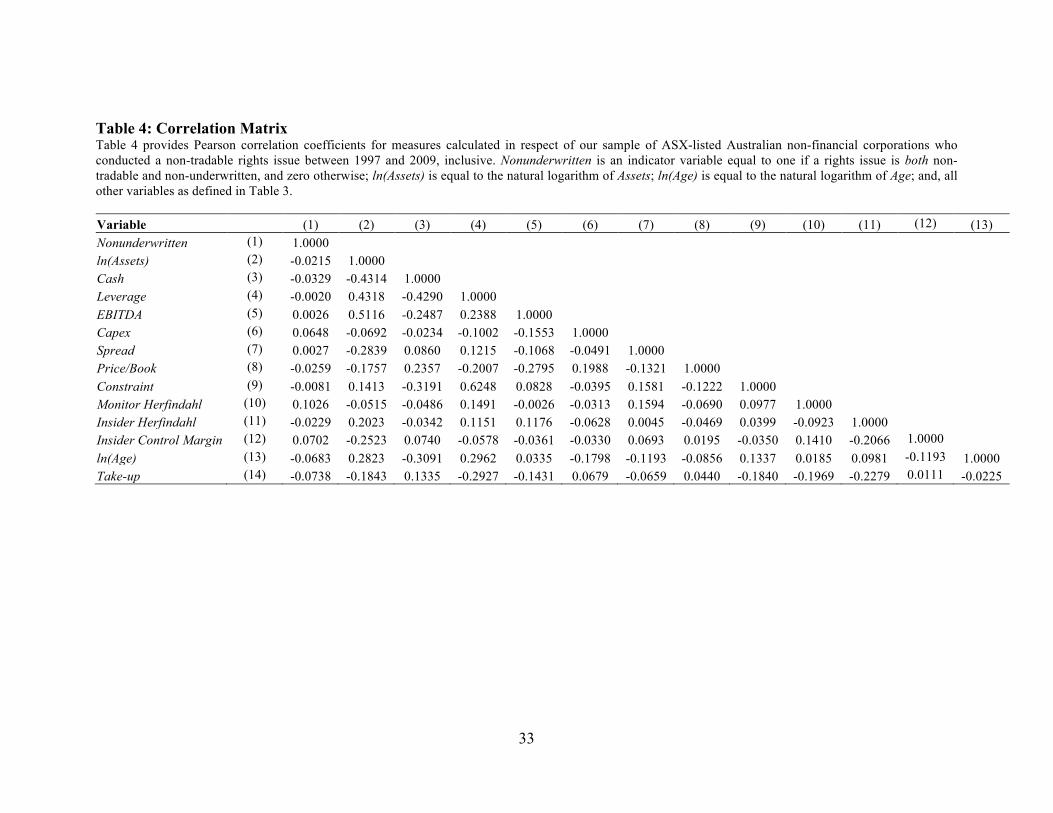
The role played by the demand for monitoring in shaping firms’ decisions to raise
equity publicly versus privately is further supported by the Pearson correlation
coefficients reported in Table 4, which suggest that the underwriting choice is influenced
by the size and concentration of pre-issue monitor shareholdings as well as the insider
control margin. More specifically, higher values of both Monitor Herfindahl and Insider
Control Margin are associated with non-underwritten non-tradable issues, that is, private
placements.

19
Table 4 also confirms our proposed regression analysis is unlikely to be plagued
by collinearity problems. In particular, while we observe the expected correlation
between firm level control variables, our variables of interest (Inside Herfindahl, Monitor
Herfindahl and Insider Control Margin) are not highly correlated with each other.
[Table 4 about here]
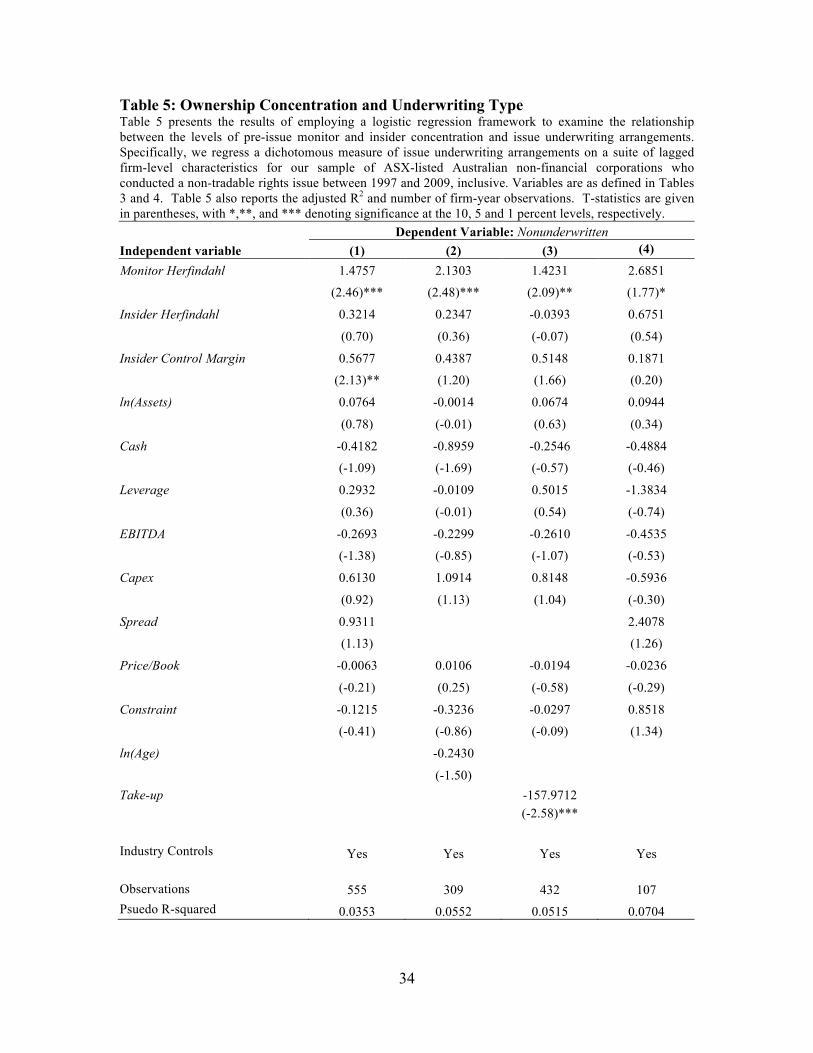
Table 5 presents regressions that estimate the relationship between the levels of
pre-issue monitor and insider concentration as well as the insider control margin and the
public/private choice whilst controlling for information asymmetry and other firm-level
characteristics known to influence both the equity issuance and underwriting decisions. In
all regressions we measure the levels of pre-issue ownership concentration as Monitor
Herfindahl and Insider Herfindahl, while the level of insider control is measured as
Insider Control Margin. Columns 1 and 2 differ in the measure of information
asymmetry they employ: In Column 1 we measure information asymmetry as Spread,
while Column 2 measures it as ln(Age). Column 3 presents the results for a regression
that includes the expected take-up rate, Take-Up, as an explanatory variable. Finally,
Column 4 replicates the regression presented in Column 1 for the subsample of firms
with both Insider Herfindahl greater than the sample mean and Insider Control Margin
greater than zero, that is, a controlling interest held by a small number of insiders.
The results presented in Table 5 confirm that the size and concentration of pre-
issue monitor shareholdings strongly influences the choice of underwriting in non-
tradable issues. In particular, a higher Monitor Herfindahl is associated with the choice of

20
a non-underwritten issue, that is, a private placement. This result persists regardless of
our model specification. In contrast to the existing literature (Cronqvist and Nilsson,
2005), we find no support for the influence of pre-issue insider ownership concentration,
defined to include non-founding insiders, in affecting the public/private choice.
Moreover, while we find weak support for the level of the insider control margin
influencing the choice of underwriting in non-tradable issues, with a higher Insider
Control Margin associated with the choice of a private placement in the form of a non-
underwritten issue in our first model this result does not persist across all our model
specifications. Instead, the result is statistically insignificant in all but the regression
reported in Column 1, including for the subsample of firms with a controlling interest
held by a small number of insiders (Column 4). Instead, for this subsample of firms,
where insiders have the potential to control the firm, we find no support for either pre-
issue insider ownership concentration or control influencing the choice to undertake a
private placement.
[Table 5 about here]
In summary, our strongest finding suggest that firms with larger and more
concentrated pre-issue monitor shareholdings are more likely to allocate unsubscribed
shares via a private placement. Therefore, our findings thus far are consistent with the
conjecture that in the more general setting of firms controlled by non-‐founding
insiders private placements are primarily driven by a demand for monitoring rather than
avoiding control dilution.

21
5.2 Post Issue Changes in Ownership Concentration
We next examine the change in both monitor and insider shareholding concentration
around both non-underwritten non-tradable rights issues (private placements) and
underwritten non-tradable issues (public issues). The results of tests for differences in the
mean change in ownership concentration classified by underwriting type are presented in
Panel A of Table 6. These results reveal a significantly larger post-issue increase in
monitor ownership concentration levels for firms undertaking private placements as
opposed to firms undertaking private public issues. Notwithstanding this, the post-issue
changes in insider ownership concentration do not differ materially based on
underwriting type. Taken together, these findings suggest that the average firm uses
private placements to acquire enhanced monitoring rather than avoid control dilution.
For firms having chosen to undertake a private placement, it remains an open
question as to the effect of the tradeoff between the demand for monitoring and the
avoidance of control dilution on the outcome of the private placement. For this reason
we narrow our focus to examine the relationship between pre-issue ownership
concentration levels and changes in these levels post-issue. Specifically, we rank firms
who undertook non-underwritten non-tradable rights issues based on their pre-issue levels
of monitor ownership concentration, defining firms falling into the first (fourth) quartile
as having low (high) pre-issue ownership concentration. Thereafter, we test whether the
mean post-issue change in both monitor and insider ownership concentration differs for
firms with low versus high pre-issue monitor concentration levels. The results of this
testing are presented in Panel B of Table 6, and provide further evidence consistent with

22
monitoring demand driving the choice to undertake a private placement. Specifically, we
find that monitor concentration increases for firms with low pre-issue concentration
levels. In stark contrast, firms with high pre-issue levels experience a reduction in this
concentration after the issue. This, coupled with the significant increase in post-issue
insider ownership concentration, is consistent with firms enjoying high and concentrated
levels of monitoring in the lead up to the issue using private placements as a way of
substituting insider for monitor shareholders, reducing the likelihood of increased
monitoring activity being undertaken by existing monitors.
[Table 6 about here]
Table 7 presents regressions for firms who undertook non-underwritten non-
tradable rights issues that estimate the relationship between pre-issue monitor
shareholding concentration and changes in both monitor and insider shareholding
concentration around the rights issue whilst controlling for information asymmetry and
other firm-level characteristics known to influence both the equity issuance and
underwriting decisions. We include two additional (indicator) variables in these
regressions, namely High Monitor Herfindahl and Low Monitor Herfindahl. High
Monitor Herfindahl is equal to one if Monitor Herfindahl for a given firm is in the top
quartile of the sample, and zero otherwise, while Low Monitor Herfindahl is equal to one
if Monitor Herfindahl for a given firm is in the bottom quartile of the sample, and zero
otherwise. Examination of the results presented in Table 7 show that for firms
undertaking a private placement, consistent with our univariate results, monitor
concentration increases following the issue for firms with low pre-issue concentration
23
levels. In stark contrast, firms with high pre-issue levels experience a reduction in this
concentration after the issue and a significant increase in post-issue insider ownership
concentration.
[Table 7 about here]
In summary, our results suggest that the influence of the demand for enhanced
monitoring on the choice to undertake a private placement depends upon the pre-issue
monitor concentration levels. At low pre-issue levels of monitor shareholder
concentration firms exhibit a positive demand for enhanced monitoring. However, at
high levels, firms use private placements to substitute insider for monitor shareholders,
reducing the likelihood of increased monitoring activity being undertaken by existing
monitors.
5.3 Robustness Tests
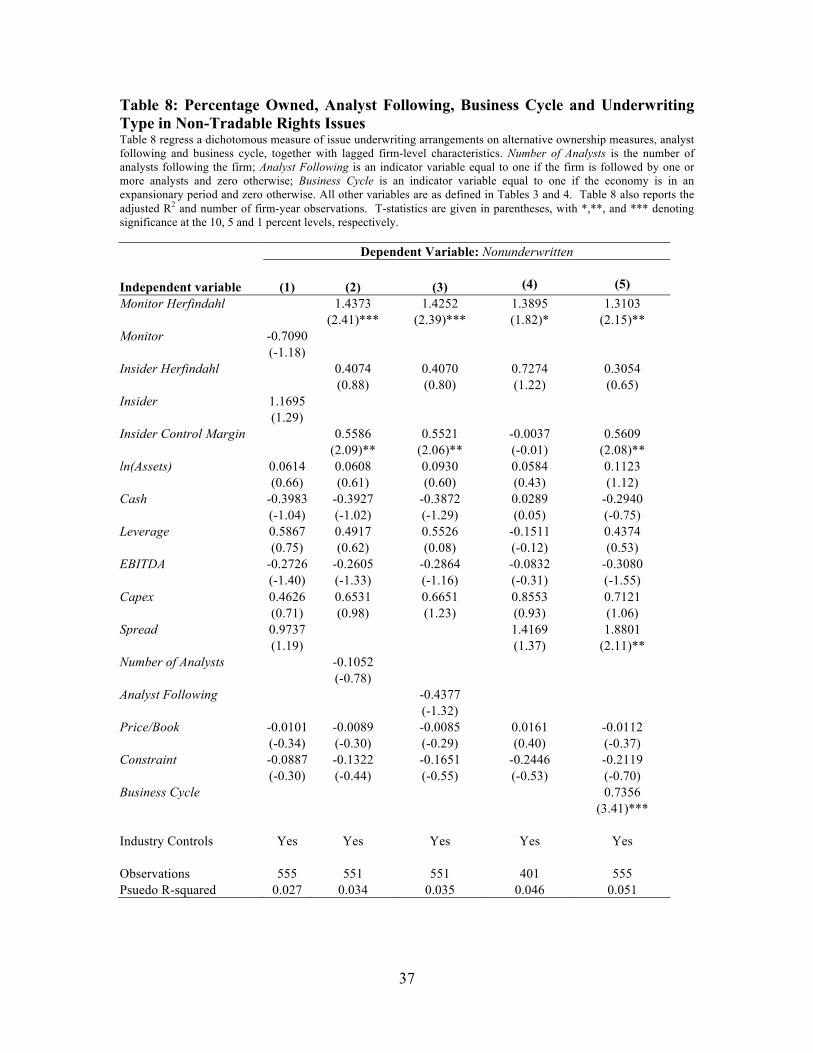
In the first of our robustness tests, we follow Wu (2004) and use ownership percentages
rather than Herfindahl measures of ownership concentration in testing. Results are
presented in Column 1 of Table 8 and provide no support for the percentage of either
monitor or insider shareholdings being significant in influencing the public/private
choice. Coupling these findings with the significance of Monitor Herfindahl in this
regard provides support for monitor shareholders having the greatest incentive to
scrutinize and influence firm operations when their holdings are large and concentrated.

24
Next, we follow Wu (2004) and Gomes and Phillips (2007), employing both the
number of analysts following the firm (Number of Analysts) and an indicator variable
equal to one if the firm is followed by one or more analysts (Analyst Following) as
alternative proxies for information asymmetry. We make use of annual analyst earnings
forecasts from IBES to estimate these proxies. Our results (Columns 2 and 3, Table 8) are
robust to the inclusion of alternative proxies for information asymmetry. Consistent with
the results reported in Table 5, firms with larger and more concentrated pre-issue monitor
shareholdings are more likely to allocate unsubscribed shares via a private placement.
With respect to information asymmetry, we again find no evidence in support of a
positive relationship between information asymmetry and the choice to undertake private
placements within our sample. This result is consistent with the lack of a statistically
significant difference in information asymmetry between firms making underwritten
versus non-underwritten issues reported in Table 3.
To recognize the potential for the inclusion of non-tradable issues with best
efforts arrangements to bias our sample of non-underwritten issues, we exclude them
from our sample and re-perform testing. Our results (Column 4, Table 8) are robust to
the exclusion of best efforts issues, albeit weaker. Firms with larger and more
concentrated pre-issue monitor shareholdings are more likely to allocate unsubscribed
shares via a private placement.
It is possible that market conditions impact on both the level of rights issues and
the supply of underwriters. In particular, we conjecture that there will be more rights
issues and more underwriters willing to underwrite these issues during periods of
economic expansion. We test the impact of theses by including an indicator variable

25
equal to one if the Melbourne Institute Business Cycle Dates suggest the economy is in
an expansionary period and zero otherwise (Business Cycle). Unexpectedly, as depicted
in Column 5 of Table 8, we find evidence that firms are more likely to undertake private
placements in expansionary periods. However, consistent with the results reported in
Table 5, we still find that firms with larger and more concentrated pre-issue monitor
shareholdings are more likely to allocate unsubscribed shares via a private placement.
[Table 8 about here]
6. Conclusions
We take advantage of both the relatively high concentration of insider ownership in
Australian firms, absent the dominance of founding families, and the widespread use of
non-tradable rights issues in the Australian equity market to better understand
determinants of the public/private choice. We first examine the importance of the size
and concentration of pre-issue monitor and insider shareholdings as well as the level of
insider control on firms’ decisions to underwrite these issues. In doing so, we
demonstrate it is the demand for monitoring, and not the avoidance of control dilution nor
the level of insider control, that is pivotal in shaping the firm’s decision to place equity
privately. Initial testing shows that, on average, firms with higher and more concentrated
pre-issue levels of monitor shareholdings are more likely to place unsubscribed shares
privately. More importantly, post-issue changes in ownership reveal that the influence of
the demand for monitoring on the choice of a private placement varies based on firms’
pre-issue monitor concentration. While post-issue monitor concentration increases in

26
firms with low levels of pre-issue monitor concentration, the reverse is true for firms with
high levels. Indeed, the latter substitute inside for monitor ownership concentration,
thereby reducing the level of independent oversight of the firm.
Overall, our strongest finding suggest that firms with larger and more
concentrated pre-issue monitor shareholdings are more likely to allocate unsubscribed
shares via a private placement. The finding of no support for the influence of pre-issue
insider ownership concentration or insider control on the public/private choice, with the
inclusion of firms controlled by non-founding insiders in our definition of insiders,
suggests that the positive influence of insider control on the decision to undertake a
private placement is restricted to family-controlled firms (Cronqvist and Nilsson, 2005).
As per our earlier caveat, non-tradable issues tend to be undertaken by smaller,
less-levered firms. Given this, to the extent that larger firms enjoy increased analyst
following and this coverage substitutes for the monitoring that can be secured by private
placements, our results may not be generalizable to such firms. Notwithstanding this, our
results provide concrete support that the demand for monitoring is the central determinant
in many firms’ decisions to make private issues.
27
References
Balachandran, B., Faff, R., Theobald, M., 2008. Rights offerings, takeup, renounceability, and underwriting status. Journal of Financial Economics 89, 328-346.
Brophy, D., Ouimet, P., Sialm, C., 2009. Hedge funds as investors of last resort? Review of Financial Studies 22, 541-574.
Byrd, J., Hickman, K., 1992. Do outside directors monitor managers? Evidence from tender offer bids. Journal of Financial Economics 32, 195-221.
Chaplinsky, S., Haushalter, D., 2010. Financing under extreme uncertainty: contract terms and returns to private investments in public equity. Review of Financial Studies 23, 2789-2820. Chemmanur, T., Fulghieri, P., 1999. A theory of going-public decision. The Review of Financial Studies 12, 249-279. Cremers, M., Nair, V., 2005. Governance mechanisms and equity prices. Journal of Finance 60, 2859-94. Cronqvist, H, Nilsson, M., 2005. The choice between rights offerings and private equity placements”, Journal of Financial Economics, 78, 375-407. Eckbo, B., 2008. Equity issues and the disappearing rights offer phenomenon. Unpublished working paper. Tuck School of Business at Dartmouth, Hanover. Eckbo, B., Masulis, R., 1992. Adverse selection and the rights offer paradox. Journal of Financial Economics 32, 293–332. Eckbo, B., Masulis, R., Norli, O., 2007. Security offerings. In: Eckbo, B. (Ed.), Handbook of Corporate Finance. Elsevier/North-Holland, Amsterdam, pp. 233-373. Eckbo, B., Norli, O., 2005. The equity flotation method pecking order. Unpublished working paper. Tuck School of Business at Dartmouth, Hanover. Glasop, L., 2009, Australia’s top 100 private family firms, Unpublished working paper, Deakin University. Gomes, A., Phillips, G., 2007. Why do public firms issue private and public securities? Unpublished working paper. Washington University, Saint Louis. Hertzel M., Smith, R., 1993. Market discounts and shareholder gains for placing equity privately. Journal of Finance 48, 459-485. Massa, M., Vermaelen, T., Xu, M., 2013. Rights offerings, trading, and regulation: a global perspective. Unpublished working paper. INSEAD, Fontainebleau. Masulis, R.W., Pham, P.K., Zein, J., 2011, Family Business Groups around the World: Financing Advantages, Control Motivations, and Organizational Choices, The Review of Financial Studies 24, 3556-3600.
Mroczkowski, N., Tanewski, G., 2007, Delineating publicly listed family and nonfamily controlled firms: an approach for capital market research in Australia, Journal of Small Business Management 45, 320–332.

28
Shleifer, A., Vishny, R., 1986. Large shareholders and corporate control. Journal of Political Economy 94, 461-488.
Ursel, N., 2006. Rights offerings and corporate financial condition. Financial Management 35, 31-52.
Wruck, K., 1989. Equity ownership concentration and firm value: evidence from private equity financings. Journal of Financial Economics 23, 2-28.
Wu, Y., 2004. The choice of equity-selling mechanisms. Journal of Financial Economics 74, 93 – 119.
29
Table 1: Rights Issue Proceeds by Issue and Underwriting Type Table 1 provides a breakdown of the frequency of, and proceeds raised by, ASX-listed Australian non-financial firms through rights issues conducted between 1997 and 2009, inclusive. Specifically, it details mean and total proceeds raised in issues partitioned on the basis of both issue and underwriting type, with all reported figures denominated in Australian dollars. Finally, it tests for differences in the mean proceeds using a t-test. T-statistics are included in parentheses, with *,**, and *** denoting their significance at the 10, 5 and 1 percent levels, respectively. Difference in Means
Type N Mean Proceeds
($ million) Total Proceeds
($ million) Tradable Versus
Non-tradable Issues Non-Tradable Issues
by Underwriting Type Tradable
Full sample 274 22.70 6,219.80 Underwitten 209 27.72 5,792.60 Non-underwritten 65 6.57 427.20
Non-tradable Full sample 803 7.13 5,725.70 (4.35)*** Underwitten 452 9.35 4,224.60 (3.83)*** Non-underwritten 351 4.28 1,501.10 (1.75)* (2.58)**
30
Table 2: Non-Tradable Rights Issue Proceeds by Firm Industry Table 2 provides an industry breakdown of non-tradable rights issues conducted by ASX-listed Australian non-financial firms between 1997 and 2009, inclusive, by underwriting type. Specifically, it details both the number of issues conducted in a given industry and the mean proceeds of these issues. T-tests are employed to test the significance of differences in these means. All reported figures are denominated in Australian dollars. *,**, and *** denote significance at the 10, 5 and 1 percent levels, respectively, with # indicating small sample size / s prevented the calculation of t-statistics.
Underwritten Issues Non-Underwritten Issues
Industry N Mean Proceeds
($ million) N Mean Proceeds
($ million)
Agriculture 9 7.75 10 2.78
Mining 243 5.97 208 4.75 Construction 3 3.16 2 24.95 Manufacturing 102 5.75 66 3.29 Transport and Communications 18 11.65 16 1.98** Retail and Wholesale 15 45.38 10 6.22 Services 59 20.43 38 3.22* Other 3 2.70 1 1.60#
31
Table 3: Characteristics of Non-Tradable Rights and Their Issuing Firms Panel A: Issue Characteristics Panel A compares the mean characteristics of underwritten versus non-underwritten non-tradable rights issues made by ASX-listed Australian non-financial firms between 1997 and 2009, inclusive. T-tests are employed to test the significance of differences in these means. Variables are defined as follows: Dilution is the rights issue ratio; Discount is the discount offered on shares purchased under the rights issue relative to the market price current at the time of the issue announcement; Private/Total is the difference between the funds sought and the proceeds raised by the issue scaled by the funds sought; Fees are underwriting and other fees incurred in making the rights issue expressed as a fraction of the issue proceeds; Take-up is the expected take-up rate for the rights issue and is equal to the fitted value obtained by regressing the ratio of Proceeds to funds sought through the issue against Discount, Top Ownership (proportion of firm’s outstanding common stock owned by the top 20 shareholders) and the natural logarithm of the market value of equity; Proceeds is the money raised by conducting the rights issue; and, Proceeds/Book is the ratio of Proceeds to the book value of equity; All reported figures are denominated in Australian dollars with *,**, and *** denoting significance at the 10, 5 and 1 percent levels, respectively.
Underwritten Issues Non-Underwritten Issues
Variable N Mean N Mean
Dilution 452 0.7003 351 0.7018
Issue Discount 327 0.2030 245 0.1291***
Private/Total 452 0.2391 351 0.2577
Fees 254 0.0323 29 0.0200***
Take-up 294 0.1967 230 0.1964**
Proceeds ($ million) 452 9.3500 351 4.2800**
Proceeds/Book 452 0.6793 351 0.4752***

32
Panel B: Firm Characteristics Panel B compares the mean characteristics of ASX-listed Australian non-financial firms making underwritten versus non-underwritten non-tradable rights issues between 1997 and 2009, inclusive. T-tests are employed to test the significance of differences in these means. Variables are defined as follows: Assets is the book value of total assets; Sales is net sales and other operating revenues; Cash is the cash and other marketable securities over total assets; Fixed Assets is the ratio of fixed to total assets; Goodwill is goodwill divided by total assets; Leverage is the book value of total debt divided by the sum of the book value of total debt and the market value of common stock outstanding; Constraint is a financial constraint indicator variable equal to one if a firm is in the top tertile when firms are ranked by leverage and it did not pay a cash dividend during the year, and zero otherwise. Turnover is sales divided by total assets; Income is net income before extraordinary items and dividends over total assets; R&D is research and development expenditure scaled by total assets; Capex is the ratio of capital expenditure to total assets; Depreciation represents the ratio of depreciation charges to total assets; EBITDA is the ratio of earnings before interest, tax, depreciation and amortization to total assets; Dividends is cash dividends scaled by total assets; Price/Book is the market value of equity scaled by the book value of equity; Price/Book+ is the Price/Book ratio for firms with a positive book value of equity; Spread is the 12-month average of the daily time-weighted average bid-ask spread; Monitor is proportion of total shareholding held by monitors; Insider is proportion of total shareholding held by insiders; Monitor Herfindahl is a Herfindahl measure of the concentration of monitors’ shareholdings; Insider Herfindahl is a Herfindahl measure of the concentration of insiders’ shareholdings; and, Insider Control Margin is insider minus monitor ownership divided by the ownership of the firms’ Top 20 shareholders. All variables are lagged one period. All reported figures are denominated in Australian dollars with *,**, and *** denoting significance at the 10, 5 and 1 percent levels, respectively.
Underwritten Issues Non-Underwritten Issues
Variable N Mean N Mean
Assets ($ million) 436 34.3371 333 24.4714*
Sales ($ million) 430 26.5087 327 13.1627***
Cash 436 0.3379 333 0.3187
Fixed Assets 404 0.4495 318 0.4757
Goodwill 419 0.0444 317 0.0471
Leverage 409 0.0826 310 0.0819
Constraint 452 0.1806 351 0.1743
Turnover 430 0.4091 327 0.3285
Income 430 -0.3735 330 -0.3928
R & D 149 0.1113 109 0.0652**
Capex 430 0.0933 329 0.1170**
Depreciation 410 0.0333 314 0.0310
EBITDA 397 -0.3247 298 -0.3217
Dividends 425 0.0023 328 0.0020
Price/Book 409 3.0149 311 2.8447
Price/Book+ 398 3.1240 299 2.9979
Spread 452 0.1056 351 0.1047
Age 251 19.5894 212 17.5707
Monitor 382 0.2742 314 0.2413***
Insider 382 0.1127 314 0.1228
Monitor Herfindahl 363 0.2417 298 0.2715**
Insider Herfindahl 363 0.3187 298 0.2914
Insider Control Margin 374 -0.2698 307 -0.2089**
Top Ownership 406 0.5642 336 0.5504
33
Table 4: Correlation Matrix Table 4 provides Pearson correlation coefficients for measures calculated in respect of our sample of ASX-listed Australian non-financial corporations who conducted a non-tradable rights issue between 1997 and 2009, inclusive. Nonunderwritten is an indicator variable equal to one if a rights issue is both non-tradable and non-underwritten, and zero otherwise; ln(Assets) is equal to the natural logarithm of Assets; ln(Age) is equal to the natural logarithm of Age; and, all other variables as defined in Table 3. Variable (1) (2) (3) (4) (5) (6) (7) (8) (9) (10) (11) (12) (13) Nonunderwritten (1) 1.0000 ln(Assets) (2) -0.0215 1.0000 Cash (3) -0.0329 -0.4314 1.0000 Leverage (4) -0.0020 0.4318 -0.4290 1.0000 EBITDA (5) 0.0026 0.5116 -0.2487 0.2388 1.0000 Capex (6) 0.0648 -0.0692 -0.0234 -0.1002 -0.1553 1.0000 Spread (7) 0.0027 -0.2839 0.0860 0.1215 -0.1068 -0.0491 1.0000 Price/Book (8) -0.0259 -0.1757 0.2357 -0.2007 -0.2795 0.1988 -0.1321 1.0000 Constraint (9) -0.0081 0.1413 -0.3191 0.6248 0.0828 -0.0395 0.1581 -0.1222 1.0000 Monitor Herfindahl (10) 0.1026 -0.0515 -0.0486 0.1491 -0.0026 -0.0313 0.1594 -0.0690 0.0977 1.0000 Insider Herfindahl (11) -0.0229 0.2023 -0.0342 0.1151 0.1176 -0.0628 0.0045 -0.0469 0.0399 -0.0923 1.0000 Insider Control Margin (12) 0.0702 -0.2523 0.0740 -0.0578 -0.0361 -0.0330 0.0693 0.0195 -0.0350 0.1410 -0.2066 1.0000 ln(Age) (13) -0.0683 0.2823 -0.3091 0.2962 0.0335 -0.1798 -0.1193 -0.0856 0.1337 0.0185 0.0981 -0.1193 1.0000 Take-up (14) -0.0738 -0.1843 0.1335 -0.2927 -0.1431 0.0679 -0.0659 0.0440 -0.1840 -0.1969 -0.2279 0.0111 -0.0225
34
Table 5: Ownership Concentration and Underwriting Type Table 5 presents the results of employing a logistic regression framework to examine the relationship between the levels of pre-issue monitor and insider concentration and issue underwriting arrangements. Specifically, we regress a dichotomous measure of issue underwriting arrangements on a suite of lagged firm-level characteristics for our sample of ASX-listed Australian non-financial corporations who conducted a non-tradable rights issue between 1997 and 2009, inclusive. Variables are as defined in Tables 3 and 4. Table 5 also reports the adjusted R2 and number of firm-year observations. T-statistics are given in parentheses, with *,**, and *** denoting significance at the 10, 5 and 1 percent levels, respectively. Dependent Variable: Nonunderwritten Independent variable (1) (2) (3) (4)
Monitor Herfindahl 1.4757 2.1303 1.4231 2.6851
(2.46)*** (2.48)*** (2.09)** (1.77)*
Insider Herfindahl 0.3214 0.2347 -0.0393 0.6751
(0.70) (0.36) (-0.07) (0.54)
Insider Control Margin 0.5677 0.4387 0.5148 0.1871
(2.13)** (1.20) (1.66) (0.20)
ln(Assets) 0.0764 -0.0014 0.0674 0.0944
(0.78) (-0.01) (0.63) (0.34)
Cash -0.4182 -0.8959 -0.2546 -0.4884
(-1.09) (-1.69) (-0.57) (-0.46)
Leverage 0.2932 -0.0109 0.5015 -1.3834
(0.36) (-0.01) (0.54) (-0.74)
EBITDA -0.2693 -0.2299 -0.2610 -0.4535
(-1.38) (-0.85) (-1.07) (-0.53)
Capex 0.6130 1.0914 0.8148 -0.5936
(0.92) (1.13) (1.04) (-0.30)
Spread 0.9311 2.4078
(1.13) (1.26)
Price/Book -0.0063 0.0106 -0.0194 -0.0236
(-0.21) (0.25) (-0.58) (-0.29)
Constraint -0.1215 -0.3236 -0.0297 0.8518
(-0.41) (-0.86) (-0.09) (1.34)
ln(Age) -0.2430
(-1.50)
Take-up -157.9712
(-2.58)***
Industry Controls Yes Yes Yes Yes
Observations 555 309 432 107 Psuedo R-squared 0.0353 0.0552 0.0515 0.0704

35
Table 6: Changes in Monitoring and Insider Herfindahls Table 6 compares the mean changes in Monitoring and Insider Herfindahls around non-tradable rights issues conducted by ASX-listed Australian non-financial firms between 1997 and 2009, inclusive. Changes in both measures are calculated between years t-1 and t+1, with reference to the issue date, t=0. T-tests are used to ascertain whether the change in a given Herfindahl is significantly different from zero and whether there are significant differences between pairs of Herfindahl changes. T-statistics are given in parentheses, with *,**, and *** denoting their significance at the 10, 5 and 1 percent levels, respectively. In Panel A, the sample is partitioned based on underwriting type, underwritten versus non-underwritten. Panel B compares the difference between the change in Monitoring and Insider Herfindahls for the top and bottom quartiles of the sub-sample of non-underwritten non-tradable rights issues ranked by the level of the issuing firm’s pre-issue Monitoring Herfindahl. Panel A: Underwritten versus Non-Underwritten Issues
Underwriting Type Underwritten Non-underwritten Herfindahl N Mean Change N Mean Change Difference Monitor Herfindahl 338 0.0936*** 279 0.1975*** 0.1039*** Insider Herfindahl 338 0.2003*** 279 0.2125*** 0.0122 Panel B: High Versus Low Pre-Issue Monitor Ownership Concentration for Non-Underwritten Issues Pre-Issue Level Monitor Herfindahl Low High Herfindahl N Mean Change N Mean Change Difference Monitor Herfindahl 67 0.6572*** 68 -0.1981*** -0.8553*** Insider Herfindahl 67 -0.0018 68 0.4068*** 0.4086***

36
Table 7: High and Low Pre-Issue Monitor Herfindahls and Changes in Herfindahls Table 7 presents the results of a regression examining the relationship between the levels of pre-issue monitor concentration and changes in Monitoring and Insider Herfindahls around non-tradable rights issues conducted by ASX-listed Australian non-financial firms between 1997 and 2009, inclusive. We define ΔMonitor Herfindahl as the change in monitor ownership concentration for non-underwritten non-tradable issues between years t-1 and t+1 and ΔInside Herfindahl as the change in insider ownership concentration for non-underwritten non-tradable issues between years t-1 and t+1. High Monitor Herfindahl is an indicator variable equal to one if Monitor Herfindahl for a given firm is in the top quartile of the sample, and zero otherwise. Low Monitor Herfindahl is an indicator variable equal to one if Monitor Herfindahl for a given firm is in the bottom quartile of the sample, and zero otherwise. All other variables are as defined in Tables 3 and 4. Table 5 also reports the adjusted R2 and number of firm-year observations. T-statistics are given in parentheses, with *,**, and *** denoting significance at the 10, 5 and 1 percent levels, respectively.
Dependent variable: ΔMonitor Herfindahl ΔInside Herfindahl Independent variable
High Monitor Herfindahl -0.3735 0.2332
(-4.14)*** (2.00)** Low Monitor Herfindahl 0.4499 -0.2363
(4.54)*** (-2.01)** ln(Assets) -0.0788 0.0061
(-1.61) (0.11)
Cash 0.1153 -0.0367
(0.72) (-0.17)
Leverage 0.9270 -0.3773
(2.28)** (-0.94)
EBITDA 0.0522 -0.1421
(0.65) (-1.45)
Capex 0.5346 -0.3651
(1.85)* (-1.27)
Spread -0.4724 0.0245
(-1.67)* (0.08)
Price/Book -0.0057 0.0105
(-0.53) (0.55)
Constraint -0.1900 0.1369
(-1.63) (1.04)
Industry Controls Yes Yes
Observations 229 224 Psuedo R-squared 0.2589 0.1033
37
Table 8: Percentage Owned, Analyst Following, Business Cycle and Underwriting Type in Non-Tradable Rights Issues Table 8 regress a dichotomous measure of issue underwriting arrangements on alternative ownership measures, analyst following and business cycle, together with lagged firm-level characteristics. Number of Analysts is the number of analysts following the firm; Analyst Following is an indicator variable equal to one if the firm is followed by one or more analysts and zero otherwise; Business Cycle is an indicator variable equal to one if the economy is in an expansionary period and zero otherwise. All other variables are as defined in Tables 3 and 4. Table 8 also reports the adjusted R2 and number of firm-year observations. T-statistics are given in parentheses, with *,**, and *** denoting significance at the 10, 5 and 1 percent levels, respectively. Dependent Variable: Nonunderwritten
Independent variable (1) (2) (3)
(4)
(5) Monitor Herfindahl 1.4373 1.4252 1.3895 1.3103
(2.41)*** (2.39)*** (1.82)* (2.15)**
Monitor -0.7090 (-1.18) Insider Herfindahl 0.4074 0.4070 0.7274 0.3054
(0.88) (0.80) (1.22) (0.65)
Insider 1.1695 (1.29) Insider Control Margin 0.5586 0.5521 -0.0037 0.5609 (2.09)** (2.06)** (-0.01) (2.08)** ln(Assets) 0.0614 0.0608 0.0930 0.0584 0.1123
(0.66) (0.61) (0.60) (0.43) (1.12)
Cash -0.3983 -0.3927 -0.3872 0.0289 -0.2940
(-1.04) (-1.02) (-1.29) (0.05) (-0.75)
Leverage 0.5867 0.4917 0.5526 -0.1511 0.4374
(0.75) (0.62) (0.08) (-0.12) (0.53)
EBITDA -0.2726 -0.2605 -0.2864 -0.0832 -0.3080
(-1.40) (-1.33) (-1.16) (-0.31) (-1.55)
Capex 0.4626 0.6531 0.6651 0.8553 0.7121
(0.71) (0.98) (1.23) (0.93) (1.06)
Spread 0.9737 1.4169 1.8801
(1.19) (1.37) (2.11)**
Number of Analysts -0.1052 (-0.78) Analyst Following -0.4377 (-1.32) Price/Book -0.0101 -0.0089 -0.0085 0.0161 -0.0112
(-0.34) (-0.30) (-0.29) (0.40) (-0.37)
Constraint -0.0887 -0.1322 -0.1651 -0.2446 -0.2119 (-0.30) (-0.44) (-0.55) (-0.53) (-0.70) Business Cycle 0.7356 (3.41)***
Industry Controls Yes Yes Yes Yes Yes
Observations 555 551 551 401 555 Psuedo R-squared 0.027 0.034 0.035 0.046 0.051