oxford eds
TRANSCRIPT

SIRION EDS
Rev. 0915

Start an Aztec Project
Launch Aztec software.
Create a new project or open an
existing one.
User projects are kept on the local
drive in the Oxford Users folder.
Select the DEFAULT user profile.
The projects will auto-save each time
you collect a new spectrum.
2

3
Real-time X-ray signal
processing shows in the
Ratemeter
Step-Through Guide
changes for each mode
Navigation Panel Support Panel
Step Notes give more
detailed info about the
operation
Data Tree organizes
samples, sites, images
and spectral dataOperating Modes:
• Point & ID gives the most
accurate element quant
• Linescan is a 1D spatial
analysis
• Maps are 2D spatial
analyses
Navigation & Support Panels

The EDS detector should be “Out” when not in use.
Raise the sample to 5mm working distance.
Use the control window to insert the detector.
Turn off the CCD camera at the toggle switch
The CCD camera emits IR light which excites the x-ray detector.
Prepare the Chamber
EDS Detector Control
4
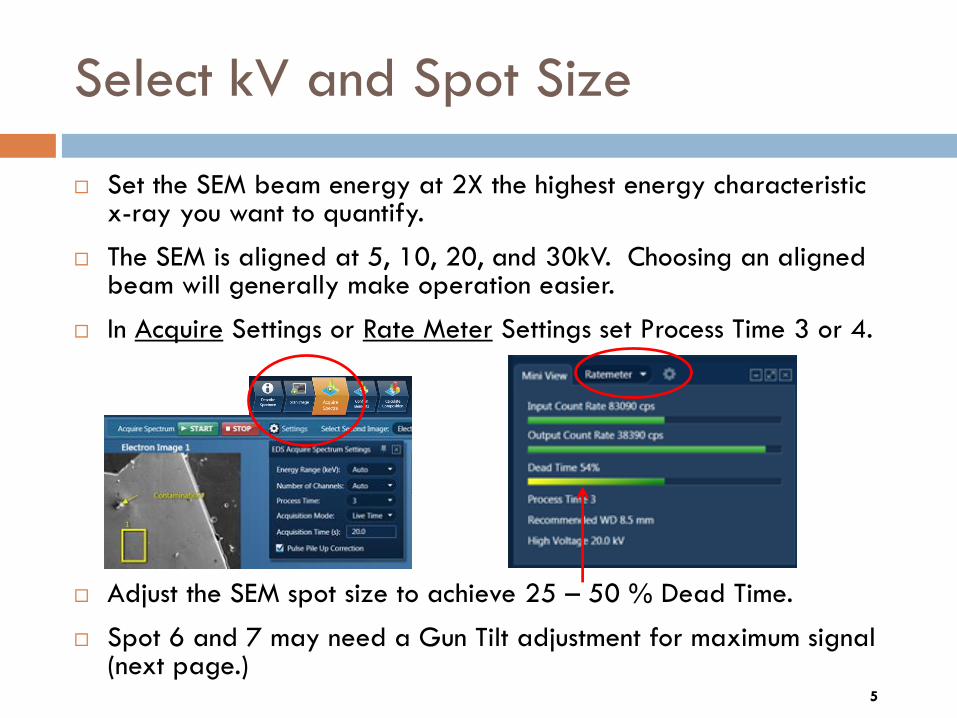
Select kV and Spot Size
Set the SEM beam energy at 2X the highest energy characteristic x-ray you want to quantify.
The SEM is aligned at 5, 10, 20, and 30kV. Choosing an aligned beam will generally make operation easier.
In Acquire Settings or Rate Meter Settings set Process Time 3 or 4.
Adjust the SEM spot size to achieve 25 – 50 % Dead Time.
Spot 6 and 7 may need a Gun Tilt adjustment for maximum signal (next page.)
5

Gun Tilt (optional)
To maximize x-ray output using spot 6 or 7,
optimize the “Gun Tilt” in Microscope Control
“Beam” submenu.
1. Adjust contrast/brightness to see the image.
2. Left-click in the Gun Tilt box and adjust it to
the brightest position.
3. Reduce contrast to correct over-saturation.
4. Repeat Gun Tilt and contrast/brightness.
5. Focus and stigmate for the best final image
resolution.
6

Describe Specimen7
Right-click on Specimen 1 to rename.
Any Project or Specimen Notes you add will show
on the ‘.doc’ reports you generate for the project.
Because of carbon contamination in the chamber,
the default “Specimen Coating Info.” is set to
exclude C from quant.
Elements of particular
interest can be added to
the AutoID in the “Pre-
defined Elements” tab.

Scan Image
Open the Image Settings menu.
Select the Scan Size (1025 pix suggested).
Set Dwell Time (5 us works for many samples).
Select the correct detector SE or BSE (note BSE
must be installed by a staff person at the
beginning of the SEM session).
Close settings and click “Start” to acquire.
To protect an image select the padlock icon and
it will not be overwritten by new images at the
same site.
8

Acquire Spectra
Open the Spectrum Settings to switch Acquisition Mode
between Live Time and Counts.
9
4.
For good statistical significance
chose at least 300,000 Counts
20 sec Live Time also yields
good results on most samples
Define a region of interest on the image with the
tool bar at left or use the entire frame.
Options are spot, square, circle, and freehand area
Do not define a region to scan the entire imaged
area
Click “Start.”

Confirm ElementsPoint & ID only
Review the element IDs and add/remove elements to
achieve the best agreement between the spectral data
in yellow and the fitted spectrum in magenta.
10
4.
PAN
ANNOTATE
INFO
SUGGEST ELEMENT

Calculate CompositionPoint & ID only
Calculate Composition after element IDs are confirmed.
Use available templates to view quant results, spectrum
details, and compare multiple spectra.
Threshold for AutoID is normally set to 3x the sigma
value (~1% by wt.)
11
4.
To report composition, first
arrange data view using a
template and available
options. Then generate the
corresponding Word or Excel
report (more pg.18)

Calc. Composition Settings
Options:
Normalize composition to 100%
Remove elements from the Quant.
by adding them to the
“Deconvolution Elements” list.
Select an alternate peak series for
Quantification by un-checking the
“Automatic line selection” box and
choosing the element.
To apply your setting changes click
Apply and Save, then highlight all
spectra and click “Requantify.”
12

Acquire Line Scan
13
Acquisition “Until Stopped” lets the scan run until you see a spatial pattern develop in the spectrum.
Process time 3 is most efficient, but a longer time will more fully resolve overlapping x-ray peaks.
Shorter dwell times minimize charging.
More points/line do not necessarily improve the spatial resolution of EDS since sampling volume is a function of beam energy and sample material.
Chose the Linescan collection mode.
Line selection tool defines the line to scan on image.

Construct Lines
14
Elements to plot
are selected here
Tile each element
or stack them all
in one plot

Acquire Map
Choose the Map collection mode.
Scan Image to capture the SE or BSE image.
Open Map Settings for options:
Select high spatial resolution for low magnification scans only. High resolution scans do not improve the spatial resolution of EDS.
Acquisition “Until Stopped” lets the scan run until you see a spatial pattern develop.
Select Process Time 3.
Short pixel dwell times minimize charging.
Acquire Map: Click “Start” to map the whole area or draw a shape around the are of interest.
15
Mag Resolution
< 500 X 4096
1000 X 2048
2500 X 1024
> 5000 X 512

Construct Map
16
True Image filters overlapping
x-ray peaks out of the map
images.
Click layer icons to overlay maps
in the Layered Image
Select a map and click
contrast to adjust threshold.

Report Results
All reports are exported to MS Word.
From the Report Results dropdown menu
chose “Save As” for a site report.
17
You can chose an alternate
template from “Report
Templates.”
Select a template that
includes all of the relevant
results.
Preview the report below.

Export Raw Data
Right click on any spectra and export as
EMSA (.txt)
18
Right click on any image and export
as “original resolution.”

Shutdown
Turn the chamber Camera back on.
Move detector to “Out” position.
Save Project.
Drag and drop reports to you M or Q-drive.
Disable Oxford in Coral.
19

Troubleshooting
The Detector control is not present or Aztec
not reading mag or controlling beam sweep Run the Tidy Up utility from the desktop
Rate meter >60% or strong Strobe
Lower the spot size
Process Time 3-4
Rate meter low Output Counts
Working distance 5mm
Unfreeze image
Spot 3 - 6
Correct Gun Tilt
20
Strong Strobe at 0eV