oxidant production from source-oriented particulate ... - acp
TRANSCRIPT

Atmos. Chem. Phys., 15, 2327–2340, 2015
www.atmos-chem-phys.net/15/2327/2015/
doi:10.5194/acp-15-2327-2015
© Author(s) 2015. CC Attribution 3.0 License.
Oxidant production from source-oriented particulate matter –
Part 1: Oxidative potential using the dithiothreitol (DTT) assay
J. G. Charrier1, N. K. Richards-Henderson1, K. J. Bein2,3, A. S. McFall1, A. S. Wexler1,2,4, and C. Anastasio1
1Department of Land, Air and Water Resources, University of California, Davis, CA 95616, USA2Air Quality Research Center, University of California, Davis, CA 95616, USA3Center for Health and the Environment, University of California, Davis, CA 95616, USA4Department of Mechanical and Aeronautical Engineering, University of California, Davis, CA 95616, USA
Correspondence to: C. Anastasio ([email protected])
Received: 5 September 2014 – Published in Atmos. Chem. Phys. Discuss.: 18 September 2014
Revised: 10 February 2015 – Accepted: 10 February 2015 – Published: 4 March 2015
Abstract. Recent epidemiological evidence supports the hy-
pothesis that health effects from inhalation of ambient par-
ticulate matter (PM) are governed by more than just the
mass of PM inhaled. Both specific chemical components
and sources have been identified as important contributors
to mortality and hospital admissions, even when these end
points are unrelated to PM mass. Sources may cause ad-
verse health effects via their ability to produce reactive oxy-
gen species in the body, possibly due to the transition metal
content of the PM. Our goal is to quantify the oxidative po-
tential of ambient particle sources collected during two sea-
sons in Fresno, CA, using the dithiothreitol (DTT) assay. We
collected PM from different sources or source combinations
into different ChemVol (CV) samplers in real time using a
novel source-oriented sampling technique based on single-
particle mass spectrometry. We segregated the particles from
each source-oriented mixture into two size fractions – ultra-
fine (Dp ≤ 0.17 µm) and submicron fine (0.17 µm ≤Dp ≤
1.0 µm) – and measured metals and the rate of DTT loss in
each PM extract. We find that the mass-normalized oxida-
tive potential of different sources varies by up to a factor of
8 and that submicron fine PM typically has a larger mass-
normalized oxidative potential than ultrafine PM from the
same source. Vehicular emissions, regional source mix, com-
mute hours, daytime mixed layer, and nighttime inversion
sources exhibit the highest mass-normalized oxidative poten-
tial. When we apportion DTT activity for total PM sampled
to specific chemical compounds, soluble copper accounts for
roughly 50 % of total air-volume-normalized oxidative po-
tential, soluble manganese accounts for 20 %, and other un-
known species, likely including quinones and other organics,
account for 30 %. During nighttime, soluble copper and man-
ganese largely explain the oxidative potential of PM, while
daytime has a larger contribution from unknown (likely or-
ganic) species.
1 Introduction
Inhalation of particulate matter (PM) has been linked with
adverse health effects and mortality in humans (Dominici et
al., 2006; Dockery et al., 1993; Pope et al., 2002; Sunyer
and Basagana, 2001; Breysse et al., 2013). Current regula-
tions to protect health are based on PM mass without re-
gard to source or chemical composition. While PM mass of-
ten exhibits good correlations with toxicity (Brunekreef and
Holgate, 2002), the toxicity of PM is likely more compli-
cated than mass alone, and may be defined by a combination
of properties including number concentration, size, surface
area, and chemical composition (Valavanidis et al., 2008;
Adamson et al., 1999; Costa and Dreher, 1997; Stoeger et al.,
2006; Peters et al., 1997; Perrone et al., 2013). These prop-
erties determine where PM will deposit in the lungs, how it
will interact with the body, and how much oxidative stress
it will produce (Churg and Brauer, 1997; Aust et al., 2002;
Oberdorster et al., 2005; Yang et al., 2009). Oxidative stress
is hypothesized as a primary mechanism for adverse health
effects from PM (Ercan et al., 2006; Fearon and Faux, 2009;
Halliwell and Cross, 1994), and occurs when reactive oxy-
gen species (ROS) or other oxidants overwhelm the natural
Published by Copernicus Publications on behalf of the European Geosciences Union.
2328 J. G. Charrier et al.: Oxidant production from source-oriented particulate matter
defenses of the body (Li et al., 2003a). The picture is fur-
ther complicated by the fact that PM is a complex mixture of
particles from various primary and secondary sources with
different degrees of atmospheric processing. Aging changes
both the size distribution and chemical composition of PM
(Ellison et al., 1999; Maring et al., 2003; Pirrone et al., 2000;
Sullivan et al., 2007), making sources harder to differentiate
and potentially changing the toxicity of the aerosol over time.
Recent epidemiological studies have identified specific
sources or chemical components of PM that are associated
with health outcomes even when PM mass is not, supporting
the hypothesis that specific chemicals or sources have higher
toxicities. These results indicate that PM mass may underes-
timate the extent of health effects from PM (Ito et al., 2011;
Lall et al., 2011). Ostro et al. (2007) identified that mortal-
ity from PM in California was strongly tied to particulate Cu
and other compounds, while Lall et al. (2011) identified steel
and traffic PM in New York as sources associated with res-
piratory and cardiovascular hospital emissions, respectively.
Traffic and residual oil fly ash are two sources commonly as-
sociated with adverse effects (Hoffmann et al., 2007; Peters
et al., 2004; Dreher et al., 1997), possibly due to the ability of
transition metals in the PM to cause oxidative stress (Gasser
et al., 2009; Antonini et al., 2004; Aust et al., 2002; Dye et
al., 1997; Costa and Dreher, 1997).
One of the primary tools used to identify sources of am-
bient PM is positive matrix factorization (PMF). PMF can
be used in conjunction with in vitro (Zhang et al., 2008) or
epidemiological (Lall et al., 2011) data to identify sources
that are potentially important for human health. PMF was
also recently applied to DTT data for particles collected in
the southeastern USA (Verma et al., 2014). However, PMF
requires intensive sampling and chemical analysis to obtain
enough data for accurate source identification, which limits
its applicability. In this work we use a novel method (Bein
et al., 2009) to identify, separate, and collect ambient parti-
cles from different sources in real time based on their chemi-
cal composition. The method uses single-particle mass spec-
trometry coupled to a suite of particle samplers, which allows
for source identification and collection on relatively short
(min) timescales. Each source-oriented mixture of particles
is collected on individual substrates as ultrafine (UF, Dp ≤
0.17 µm) and submicron fine (SMF, 0.17 µm≤Dp ≤ 1.0 µm)
size fractions.
Using this technique we collected up to 10 sources over
two sampling campaigns during 2008 and 2009 in Fresno,
CA. In this paper we describe the soluble and total metal
composition of the PM sources and their oxidative poten-
tial as measured by the dithiothreitol (DTT) assay. It should
be noted that the DTT assay is insensitive to ROS produc-
tion from iron (Fe) (Charrier and Anastasio, 2012; Lin and
Yu, 2011), though Fe effectively produces the hydroxyl radi-
cal (qOH) in particle extracts via the Fenton reaction (Vidrio
et al., 2009). Thus, use of the DTT assay may underesti-
mate oxidative potential from sources that are high in Fe. In
our companion manuscript (part 2), we quantitatively mea-
sure the rate of production ofqOH and hydrogen peroxide
(HOOH), from the same Fresno particles in a cell-free sur-
rogate lung fluid, and compare these results with our DTT
outcomes (Richards-Henderson et al., 2015). In this current
paper, we examine differences in soluble metal composition
and oxidative potential for different source-oriented particles
collected in Fresno. We also quantify the contributions of dif-
ferent chemical species and particle sources to the measured
oxidative potential as a function of season and particle size.
2 Methods
2.1 Source-oriented particulate matter
Source-oriented particles (i.e., particles primarily from one
source or a mixture of a few sources) were identified and
collected using online single-particle mass spectrometry
(RSMS-II) as described in Bein et al. (2009). Downstream
of the RSMS-II was a bank of 10 ChemVol (CV) samplers –
which are high-flow-rate (900 L min−1) impactor-based sam-
plers (Demokritou et al., 2002) – for PM collection, with
each CV assigned to one source or source combination. Ta-
ble 1 lists the CVs for each collection season, with cor-
responding source identification and sampling information.
Prior to sample collection, Bein et al. (2009) used a pre-
study analysis in Fresno, CA, to determine up to eight ma-
jor nighttime sources based on RSMS-II single-particle mass
spectra, diurnal trends, and back trajectory analysis. These
pre-study data were used to define the combination of spec-
tra that identify a specific source. During later sample col-
lection, when the single-particle mass spectrometer observed
these spectra, sampling algorithms automatically switched
the flow of ambient aerosol to the appropriate CV. We contin-
uously collected PM over each sampling period, alternating
between CVs as an individual source became dominant dur-
ing nighttime sampling. If the RSMS-II identified a mixture
of sources or an unidentified source, the flow was directed
to the “nighttime inversion (CV 10)” sampler, which there-
fore represents a mixture of many different particle origins
and histories. Daytime PM was not separated into sources be-
cause the lower PM mass and greater turbulent mixing in the
boundary layer during the day did not allow for a clear sepa-
ration of sources (Bein et al., 2009). Daytime PM were segre-
gated into one to three samples based on time of day instead
of chemical composition. These samples include “daytime
mixed layer (CV 9)” for both seasons, along with “morning
commute (CV 8)” and “evening commute (CV 7)” during
winter 2009 (specific sampling times listed in Table 1). These
sampling adjustments were made in winter 2009 based on
sampling experience gained during summer 2008. “Evening
commute (CV 7)” was only collected for the last five days of
the winter 2009 study.
Atmos. Chem. Phys., 15, 2327–2340, 2015 www.atmos-chem-phys.net/15/2327/2015/

J. G. Charrier et al.: Oxidant production from source-oriented particulate matter 2329
Table 1. CV sample characteristicsa.
UF mass SMF mass
Sample time CV Source % of total % of total % of total concentration concentration
volume UF mass SMF mass (µg m−3) (µg m−3)
Summer 2008
1 Cooking – NE 11 13 11 3.0 7.8
2 Secondary 8 11 13 3.5 11.9
Night-source 3 Diesel-enriched 0.3 0.4 0.4 3.0 9.3
segregated 4 Regional source mix 0.3 0.4 0.3 3.4 9.0
samples 5 Vehicular emissions 0.07 0.1 0.1 3.6 7.6
15:00–11:00 6 Unknown – metals 0.8 1.0 0.9 3.5 9.2
7 Cooking – W 0.2 0.1 0.1 2.0 5.1
10 Nighttime inversion 61 58 60 2.5 7.8
Day 11:00–15:00 9 Daytime mixed layer 18 16 14 2.3 6.2
Summer totalb: 41 568 m3 108 mg 327 mg 2.6 7.9
Winter 2009
1 Residential heating 0.9 3.1 2.9 6.9 8.6
2 Secondary 0.8 1.5 2.8 4.0 9.2
Night-source 3 Vehicular emissions 0.6 1.2 1.8 4.2 8.4
segregated 4 Processed biomass 0.2 0.9 0.7 8.2 8.9
samples 5 Regional source mix 0.6 1.6 1.5 5.2 6.5
20:00–06:00 6 Cooking – W 0.3 1.0 1.1 8.2 11.5
10 Nighttime inversion 48 44 43 1.9 2.4
Day 06:00–09:00 8 Morning commute 12 13 14 2.3 3.1
Day 09:00–17:00 9 Daytime mixed layer 35 32 30 2.0 2.3
Day 17:00–20:00 7 Evening commute 1.2 1.3 1.7 2.3 4.0
Winter totalb: 40 029 m3 84.5 mg 109 mg 2.1 2.7
a Data from (Bein et al., 2009). b Totals are the sum of all CVs. Total mass concentrations were calculated from the total PM mass divided by the total volume
collected for all sources.
Particles were collected in Fresno, CA, from 11 September
2008 to 21 October 2008 and from 1 March 2009 to 6 April
2009. To maintain consistency with previous publications
(Bein et al., 2009, 2014; Bein and Wexler, 2014; Carosino
et al., 2015), these study periods are designated “summer”
and “winter”, respectively, which reflect the timing of the
corresponding pre-studies for the single-particle mass spec-
trometer, though actual sample collections were in fall and
spring. For each CV, particles were collected separately as
ultrafine (UF, Dp ≤ 0.17 µm) and submicron fine (SMF,
0.17 <Dp ≤ 1.0 µm) size fractions. SMF samples were col-
lected on polyurethane foam (PUF, Fisher Scientific), and
UF samples were collected on Teflon-coated glass-fiber fil-
ters (Pall TX-40, Fisher Scientific).
2.2 PM extraction and sample preparation
The PM extraction is described in detail in Bein and
Wexler (2014). Briefly, PM collection substrates were ex-
tracted via sonication using a sequential series of solvents:
Milli-Q (18.2 M� cm), dichloromethane (HPLC grade,
99.9 %, Acros), then hexane (Optima, HPLC grade, 95 %,
Fisher). The water fraction was extracted in a separatory
funnel with dichloromethane and then hexane to remove or-
ganics (especially semivolatiles). The remaining water frac-
tion was lyophilized (freeze-dried, Labconco FreeZone®)
to remove water ice leaving solid PM behind. The four
dichloromethane and hexane extracts were dried under ni-
trogen and the remaining solid from all extractions, includ-
ing the water fraction, were combined. The solid was stored
under vacuum in the freezer (−20 ◦C) in 10 mL serum bot-
tles with 20 mm rubber split stoppers (Labconco) until re-
constitution. To obtain a total extracted mass for each PM
sample, the vacuum-sealed serum bottles were gravimetri-
cally weighed before and after PM was added using an A&D
model HR-202i semi-micro analytical balance (± 0.01 mg).
This method extracts over 90 % of PM from the filters, and
retains bulk chemical composition better than traditional ex-
traction techniques, especially with regard to organics (Bein
and Wexler, 2014).
To divide each particle sample into smaller aliquots, we
first reconstituted the material in methanol (Fisher, HPLC
www.atmos-chem-phys.net/15/2327/2015/ Atmos. Chem. Phys., 15, 2327–2340, 2015
2330 J. G. Charrier et al.: Oxidant production from source-oriented particulate matter
grade, 99.9 %), sonicated for ∼ 10 min in a bath sonicator
(Branson model 8510, Bransonic®), and split the suspension
into 8 mL amber glass (Thermo Scientific) vials for DTT
analysis. Methanol in each vial was evaporated and the re-
sulting solids were stored in the dark at −20 ◦C until the day
of each experiment.
2.3 Dithiothreitol assay
Dithiothreitol (DTT) is commonly used to measure the ox-
idative potential of PM (Cho et al., 2005; Charrier and Anas-
tasio, 2012). This method measures the rate of loss of 100 µM
DTT at 37 ◦C upon incubation with PM. The magnitude of
the rate of DTT loss is proportional to the oxidative poten-
tial of the PM. We used DTT analysis methods identical
to Charrier and Anastasio (2012). We warm the PM sam-
ple of known mass (Table S2) for 2 min in a 7.0 mL amber
glass vial. We start the reaction by adding 100 µM DTT in
0.10 M phosphate buffer (77.8 mM Na2H2PO4 and 22.2 mM
KH2PO4, pH 7.4; Chelex-treated) and then measure the con-
centration of DTT over time to calculate the linear rate of
DTT loss. Each experiment includes a solution blank and
positive control (0.50 µM Cu(II)SO4) to ensure reproducibil-
ity from day to day: our average (± 1σ , n= 25) blank is
0.19± 0.05 µM DTT min−1 and our average blank-corrected
positive control is 0.76± 0.05 µM DTT min−1. The average
solution-blank-corrected filter blank (±1σ , n= 3 each) was
0.23± 0.018 and 0.22± 0.003 µM DTT min−1 for the SMF
and UF samples. Each PM sample and filter blank is analyzed
in triplicate. All sample rates are corrected by their daily
solution blank and average filter blank (which was already
solution-blank-corrected). The final DTT rate for a given size
fraction of source-oriented mixture (i.e., CV) is reported as
a PM-mass-normalized rate (pmol DTT min−1 µg−1 PM) ac-
cording to
Mass-normalized DTT rate= (1)
Blank-corrected rate of loss (pmolDTTmin−1)
PM mass added to the vial (µg).
We also calculate the air-volume-normalized rate for a given
season and size fraction (pmol DTT min−1 m−3 of air sam-
pled) according to
Air-volume-normalized DTT rate= (2)∑ (Mass-normalized DTT rate CVi × total mass CVi (µg))
Total air volume for that season (m3),
where the numerator term is summed over each source-
oriented mixture i and the total air volume collected is
41 568 m3 for summer and 40 029 m3 for winter. The error
of each sample includes the standard deviation of replicates
(n= 2–3), the error of mass in the sample (Table S2 in the
Supplement), and propagated error of the filter blank ( n= 3–
5).
As we discuss in Supplement Sect. S1, there is a com-
plication in the DTT assay that has not been appreciated
previously: the DTT response from PM is nonlinearly re-
lated to PM mass when Cu and Mn are significant contrib-
utors to the oxidative potential, a consequence of the nonlin-
ear concentration-response curves for these metals (Charrier
and Anastasio, 2012). Thus the mass-normalized oxidative
potential (Eq. 1) will sometimes vary with PM mass added
to the vial, which complicates comparison between samples
and confounds the interpretation of DTT data. As we discuss
in Sect. S1, we are in the process of developing and validat-
ing a method to normalize DTT data for the PM mass ex-
tracted. Application of this preliminary method to the Fresno
samples in this current work had little effect on the DTT re-
sults (Figs. S2 and S3) because most of the extracts used
a sample mass concentration near the value we suggest for
normalization (10 µg mL−1); thus we did not adjust the DTT
responses for these samples (Sect. S1). However, the non-
linearity of the DTT assay to Cu and Mn, coupled with the
important contribution of these metals to ambient DTT activ-
ity in at least some locations, indicates that each DTT study
must examine this issue and, if needed, account for the non-
linear response of the DTT rate with PM mass. Otherwise,
DTT results might be significantly skewed by the PM mass
extracted (e.g., Fig. S3).
2.4 Transition metal analysis
Soluble metals were measured by extracting the PM solid
in acid-washed PTFE containers containing 5.0 mL of a
surrogate lung fluid (SLF). The SLF is composed of PBS
(114 mM NaCl (A.C.S., Fisher), 2.2 mM KH2PO4 (A.C.S.,
99 %, Fisher), and 7.8 mM Na2HPO4 (A.C.S., Fisher) at pH
7.4 that is Chelex-treated to remove transition metals; Char-
rier and Anastasio, 2012) and four antioxidants (200 µM
ascorbic acid (99 %, Fluka), 300 µM citric acid (99.7 %,
Sigma Aldrich), 100 µM glutathione (98 %, Sigma Aldrich),
and 100 µM uric acid (A.C.S., Sigma Aldrich)). After 1.5
or 24 h of incubation on a wrist-action shake table, 400 µL
of the PM extract was filtered (0.22 µm, PTFE syringe fil-
ter, Tisch Scientific) into a 15 mL acid-washed polypropy-
lene centrifuge vial (Fisher Scientific) containing 3.6 mL of
3 % nitric acid (Optima, Fisher Scientific) and then refriger-
ated until analysis. Samples were analyzed for Ba, Cd, Co,
Cr, Cu, Fe, Mn, Mo, Ni, Pb, V, and Zn by ICP-MS (Agilent
7500 CE); further details of ICP-MS analysis along with total
metal analysis are given in Sect. S3. Soluble metal concen-
trations were corrected for the metal concentration in the so-
lution blank and the corresponding solution-blank-corrected
field blank. Errors were calculated from the variance between
replicates and the propagated error of the solution and field
blanks.
Conditions of the DTT assay differ from the SLF condi-
tions under which the PM was extracted for metal analysis,
i.e., temperature and the presence of antioxidants. Since these
Atmos. Chem. Phys., 15, 2327–2340, 2015 www.atmos-chem-phys.net/15/2327/2015/

J. G. Charrier et al.: Oxidant production from source-oriented particulate matter 2331
factors may affect soluble metal concentrations in the extract,
we compared metal content in separate SLF and DTT ex-
tracts for 12 samples. We found very good agreement be-
tween the two techniques, except that Fe was sometimes
higher in the SLF than DTT assay (Sect. S2), possibly be-
cause SLF contains citrate, which solubilizes particulate Fe
(Aust et al., 2002). Although our soluble Fe concentrations in
SLF are likely upper-bound estimates of the amounts in the
DTT assay, Fe is a relatively weak oxidant for DTT (Charrier
and Anastasio, 2012) and is a negligible contributor to DTT
loss in our Fresno source-oriented samples, as we describe
later.
3 Results and discussion
3.1 Sample characteristics
Table 1 summarizes the sampling characteristics and source
identifications for each CV. Detailed source identification in-
formation can be found in Bein et al. (2009, 2014). Briefly,
sources were identified based on chemical composition mea-
sured by the single-particle mass spectrometer, the temporal
pattern of the source, and wind roses indicating the direction
of the source. In addition to the timed daytime CVs, seven
other sources were identified in summer and six in winter.
Two distinct cooking sources were identified: “cooking – NE
(CV 1)” is from the northeast, characterized by a high K con-
tent, while “cooking – W (CV 6 or CV 7)” comes from the
west and is characterized by K and mixed Na/K particles.
In summer the “unknown – metals (CV 6)” source is of un-
known origin and was identified based on high concentra-
tions of metals, especially Zn and Pb (Bein et al., 2014).
The volume and mass of the collected PM for each sample
varies widely depending on how often a source was dom-
inant. During most nights, no single dominant source was
identified, and sampling was directed to “nighttime inver-
sion (CV 10)”, which accounts for 40–60 % of PM mass in
each season (Table 1). The difference in the percent of to-
tal mass attributed to “nighttime inversion (CV 10)” between
seasons is partially driven by different sampling times: night-
time sampling was 18 h per day during summer and 10 h per
day during winter (Table 1). The total air volume and total
UF mass concentration are similar between seasons, approx-
imately 40 000 m3 and ∼ 80–100 mg, respectively. In con-
trast, the total SMF mass collected is 3 times larger in sum-
mer than in winter. In summer, UF mass concentrations for
the CVs are relatively similar (2.0–3.6 µg m−3), while there
is more variability in mass concentrations for PM sources in
the other seasons and sizes: 5.1–11.9 for SMF in summer,
1.9–8.2 for UF in winter, and 2.3–11.5 µg m−3 for SMF in
winter (Table 1).
3.2 Metal composition by CV
Figure 1 shows the soluble metal content for each source,
season, and size fraction in units of microns of metal per
gram of PM; total metals are in the Supplement Fig. S5.
Ambient concentrations (ng m−3) of total and soluble metals
are summarized by season and size fraction in Table S1. The
median soluble metal concentrations are at or below median
levels from other regions of the USA (Charrier and Anasta-
sio, 2012). The general trend in relative abundance follows
Zn�Ba∼Fe > Cu∼Mn > Ni > Pb∼V∼Cr > Cd∼Co. On
average, Zn, Ba, Fe, Cu, and Mn account for 66, 11, 10, 5.6,
and 3.0 % by mass of the all measured soluble metals, respec-
tively, while other metals each account for less than 3 %. In
the total metal data, Fe is slightly more important, accounting
for 20 % of the total on average, while Zn still dominates with
an average of 57 % of the total. Total and soluble metals are
generally well correlated (R2= 0.4–0.8), likely due to high
solubility (50–100 %) in our system (Figs. S3 and S4 in the
Supplement). Fe is the exception, showing poor correlation
between total and soluble measurements (R2= 0.15) and
much lower solubility (median solubility of 27 %). A large
percent of each particulate metal is soluble, with an average
of approximately 100 % for all species besides Fe, which has
an average solubility of 29 %. Metal solubility in ambient
PM depends on a number of factors including pH, ligands,
particle size, morphology, and extraction technique. A large
range of metal solubilities in ambient PM have been reported
(Connell et al., 2006). However, the percent of particulate Fe
that is soluble is generally low in ambient PM, with reports
ranging from < 1 to 6 % solubility (Costa and Dreher, 1997;
Upadhyay et al., 2011; Connell et al., 2006). The high metal
solubilities in the source-oriented particles might be due to
the extraction procedure used to remove PM from their sub-
strates required a number of analytical steps which may have
changed some properties of the PM; for example, sonication
of particles may have preferentially removed soluble metals
and left some fraction of insoluble metals on the filter.
In general, the soluble metal content in microns of metal
per gram of PM is similar for the two size fractions of a
given source. Notable exceptions are “diesel-enriched (CV
3)”, “vehicular emissions (CV 5)”, and “unknown – metals
(CV 6)” in summer and “regional source mix (CV 5)” in
winter, all of which have a higher concentration of metals in
the SMF size fraction compared to the UF, especially for Fe,
Cu, and Mn. The metal content of PM (Fig. 1) and the am-
bient concentration of metals (Table S1) are often higher in
summer sampling. Because the sampling periods were actu-
ally spring and fall, we do not expected the mixing height to
affect concentrations differently between these two seasons.
It is possible that periodic rain during the winter sampling
explains some of the reduction in ambient concentrations of
both PM mass and metals. NOAA precipitation data indicate
no rain during summer sampling and 5 days of rain during
winter sampling (NOAA, 2014).
www.atmos-chem-phys.net/15/2327/2015/ Atmos. Chem. Phys., 15, 2327–2340, 2015

2332 J. G. Charrier et al.: Oxidant production from source-oriented particulate matter
3.3 Mass-normalized oxidative potential
We start by examining the rate of DTT loss for each source
normalized by PM mass (Eq. 1), which is a measure of the
intrinsic oxidative potential of each source. Figure 2 shows
that, for a given source, the SMF particles are generally more
reactive than the accompanying UF particles: for approxi-
mately half of the PM sources the SMF reactivity is a factor
of 2 larger than that for the UF fraction. This higher reactivity
of the submicron fine particles is in contrast to past results,
where ultrafine particles (typically Dp < 0.1 µm) are gener-
ally reported to be more reactive than PM2.5 (Li et al., 2003b;
Cho et al., 2005; Ntziachristos et al., 2007; Hu et al., 2008).
All of these past measurements of size-segregated DTT re-
sponses are for California’s South Coast Air Basin, while
our results are the first for the Central Valley of California.
Thus this difference in the mass-normalized oxidative poten-
tial between SMF and UF particles might reflect differences
in sampling site.
Across both seasons, we observe a range of DTT rates
for both UF and SMF PM, with values of 11–60 and 24–
92 pmol DTT min−1 µg−1 PM, respectively; that is, the mass-
normalized oxidative potential of different sources varies
by up to a factor of 5.5 for UF and 3.8 for SMF parti-
cles. Our mass-normalized rates of DTT loss are similar
to those reported in the literature (restricted to those stud-
ies using the same DTT method), which range from 5.0 to
170 pmol DTT min−1 µg−1 PM (Verma et al., 2009, 2012;
Ntziachristos et al., 2007; De Vizcaya-Ruiz et al., 2006).
We also calculated the overall oxidative potential for each
size fraction in each of the two seasons. This metric sums the
mass-normalized oxidative potential of each particle type,
weighted by the mass of that PM collected:
Mass-weighted oxidative potential=∑
(Fi,k ×DTTi,k), (3)
where i refers to season (summer or winter), k refers to size
fraction (UF or SMF), F is the fraction of total mass col-
lected (Table 1), and DTT is the mass-normalized oxida-
tive potential (Fig. 2, bars). This metric is similar to Eq. (2),
which calculates the DTT response of the total PM relative to
air volume, but instead calculates the DTT response of the to-
tal PM relative to PM mass. If we consider each season across
both size fractions (i.e., summing over k in Eq. 3), the overall
oxidative potentials for summer and winter PM1.0 are 71± 9
and 45± 2 pmol DTT min−1 µg−1 PM, respectively. Thus,
the average mass-normalized oxidative potential of summer
PM is 60 % higher than that of winter for our study periods.
Broken down by season and size fraction, the weighted av-
erages are 79± 12 and 47± 4 pmol DTT min−1 µg−1 PM for
summer SMF and UF size fractions, respectively, and 49± 3
and 39± 3 pmol DTT min−1 µg−1 PM for winter SMF and
UF, respectively; these values are plotted as lines in Fig. 2.
Thus the overall oxidative potential of SMF PM is higher
than UF in both seasons, by 68 % in summer and 26 % in
0
1,000
2,000
3,000
4,000
5,000
So
lub
le m
eta
l co
nce
ntr
ati
on
(μg
Me
tal
/ g
PM
)
a) Summer V
Pb
Mn
Cu
Fe
Zn/10
0
1,000
2,000
3,000
4,000
5,000
So
lub
le m
eta
l co
nce
ntr
ati
on
(μg
Me
tal
/ g
PM
)
b) Winter V
Pb
Mn
Cu
Fe
Zn/10
UF SMF
Figure 1. Soluble metal concentrations for (a) summer and (b) win-
ter. For each CV, the first bar is the result for the UF size fraction
and the second bar is for the SMF size fraction. Zn concentrations
are divided by 10.
winter. Comparing the two seasons, the oxidative potential
of summer SMF is 61 % larger than winter SMF, while UF
PM exhibited similar oxidative potential between the sea-
sons. Based on these data, summer SMF PM stands out as
having a substantially higher mass-normalized oxidative po-
tential relative to the other PM.
When comparing each source-oriented mixture to the
weighted average for season and size (bars versus lines in
Fig. 2), most summer sources have an oxidative potential that
is at or below the weighted average. This is because “night-
time inversion (CV 10)” accounts for most of the PM mass
and has a high oxidative potential in summer for both UF
and SMF PM, so it dominates the weighted average. In win-
ter, there is less variability between the oxidative potentials
of the different sources, but most sources are still at or below
the weighted average defined by the “daytime mixed layer
(CV 9)” and “nighttime inversion (CV 10)”, which make up
most of the PM mass.
Atmos. Chem. Phys., 15, 2327–2340, 2015 www.atmos-chem-phys.net/15/2327/2015/

J. G. Charrier et al.: Oxidant production from source-oriented particulate matter 2333
0102030405060708090
100
Ra
te o
f D
TT
Lo
ss
(pm
ols
DT
T /
min
/ μ
g P
M)
a) SummerUF SMF UF Average SMF Average
0102030405060708090
100
Ra
te o
f D
TT
Lo
ss
(pm
ols
DT
T /
min
/ μ
g P
M)
b) WinterUF SMF UF Average SMF Average
Figure 2. PM-mass-normalized rate of DTT loss for (a) summer
and (b) winter. Lines represent the mass-weighted, average DTT
loss over all CVs for UF (dashed line) and SMF (solid line) in a
given season. Error bars are 1 standard deviation of replicates (n=
2–3) with the propagated error of the filter blank.
3.4 Contribution of transition metals to DTT activity
DTT responses in Fig. 2 often mirror the soluble metal con-
centrations (Fig. 1), e.g., summer SMF “vehicular emissions
(CV 5)” and “unknown – metals (CV 6)” have some of the
highest DTT responses, and also have substantially higher
soluble metal concentrations. Other sources, such as summer
SMF “daytime mixed layer (CV 9)” and “nighttime inversion
(CV 10)” also have a high DTT response but lower soluble
metals per PM mass, indicating metals may not explain the
DTT response in these cases. To quantify the contribution of
each metal to our measured DTT response, we use our mea-
sured metal concentrations in each PM extract in conjunc-
tion with concentration-response curves for individual tran-
sition metals and quinones (Charrier and Anastasio, 2012). In
this prior work we determined that the DTT responses from
these individual species are additive: mixtures of metals and
quinones give the same DTT response as the sum of the DTT
responses from the individual species. Therefore, to calcu-
late the total DTT response from soluble metals, we sum the
calculated DTT response from each individual species.
Figure 3 shows the measured DTT rate (in grey) in each
PM extract compared to the calculated DTT responses from
Cu (purple), Mn (green), and Fe, V, and Pb (orange). If
metals are primarily responsible for the DTT response, then
the measured and calculated bars will be equal. If the mea-
sured DTT rate is larger than the calculated rate, it indi-
cates that other compounds, such as quinones, contribute to
DTT loss. In 36 out of the 38 samples, the measured and
calculated rates of DTT loss are not statistically different
(p < 0.05), highlighting the importance of copper and man-
ganese. This agreement between measured and calculated
DTT loss is sometimes due to large errors, which are pri-
marily from uncertainties in the soluble metal measurements
and in PM masses added to the vial (Table S2). However,
visual inspection of most pairs shows good agreement. Al-
though generally not statistically different, there are a num-
ber of cases where the measured DTT rate is larger than the
DTT rate calculated from soluble metals. In these cases there
is likely some contribution from other species, probably or-
ganic compounds, but the difference is encompassed by large
error bars. Even in these samples metals generally account
for half or more of the DTT, although there is a small but
significant contribution from other species, as would be ex-
pected from typical ambient concentrations of quinones (as
discussed below). There are also a few cases where the cal-
culated DTT response is larger than the measured DTT re-
sponse, but large error bars in the soluble metal data indi-
cate these differences are generally due to experimental error.
One exception is winter UF “nighttime inversion (CV 10)”,
which has a much larger calculated DTT response than we
measured from PM. We do not currently have an explanation
for this result, but it could be an outlier in either the DTT or
soluble metal data.
On average (±σ), soluble Cu and Mn account for 83± 40
and 26± 14 % of the measured DTT response, respectively,
in our Fresno particles. Fe, V, and Pb each contribute less
than 1 % to DTT response; these contributions are too small
to be seen for most samples in Fig. 3. These results repre-
sent the DTT response for the specific chemical composi-
tion of PM collected at this site. The DTT response from
PM measured at other sites will depend on the composi-
tion of the particles and may not be dominated by transition
metals. On the other hand, our interpretation of recent re-
sults from Atlanta and other sites in the southeastern USA
also indicate Cu and Mn may play important roles in the
DTT response (Verma et al., 2014; see reviewer’s discus-
sion at http://www.atmos-chem-phys-discuss.net/14/19625/
2014/acpd-14-19625-2014-discussion.html). The DTT re-
sults for any site represent the specific chemical composi-
tion of the collected PM and the contributions to the result-
ing DTT response depend on the relative amounts of Cu, Mn,
quinones, and other redox-active species.
Sources of Cu and Mn in Fresno are incompletely un-
derstood, as indicated by recent modeling that showed poor
correlation between predicted and measured concentrations
www.atmos-chem-phys.net/15/2327/2015/ Atmos. Chem. Phys., 15, 2327–2340, 2015

2334 J. G. Charrier et al.: Oxidant production from source-oriented particulate matter
0
20
40
60
80
100
DT
T r
ate
(pm
ols
/ m
in /
μg
PM
)
b) Summer SMF
0
20
40
60
80
100
DT
T r
ate
(pm
ols
/ m
in /
μg
PM
)a) Summer UF Measured
Fe, V, Pb
Mn
Cu
0
20
40
60
80
100
DT
T r
ate
(pm
ols
/ m
in /
μg
PM
)
d) Winter SMF
0
20
40
60
80
100
DT
T r
ate
(pm
ols
/ m
in /
μg
PM
)
c) Winter UF
*
*
Figure 3. Measured rate of DTT loss (grey bars) compared to the calculated rate from soluble transition metals (colored stacked bars).
Asterisks identify cases where the measured and calculated rates are statistically different (p ≤ 0.05). Errors for the calculated bars are ±1
standard deviation, propagated from the uncertainty in each of the five metals.
of Cu and Mn in PM2.5 and PM0.1 at Fresno (Hu et al.,
2014). The model underpredicts Cu and overpredicts Mn.
In the USA, industrial Cu processing is thought to be the
largest source of Cu, followed by brake lining dust, agri-
cultural soil, sintering furnaces, and process gas combustion,
while Mn is primarily emitted by unpaved road dust, agricul-
tural soil, electric arc furnaces, and cast iron cupola furnaces
in foundries (Reff et al., 2009). Bukowiecki et al. (2009)
observed Cu emissions from brake wear in the submicron
range, especially from heavy duty vehicles. The relative im-
portance of industrial sources will likely be smaller in Cali-
fornia, while break lining dust and agricultural sources will
likely be larger due to high vehicle miles traveled and intense
agricultural activity. For example, some dairies use copper
baths to treat cows for fungus and then pour the remaining
solution into manure lagoons, which may then be spread to
soils (Jokela et al., 2010).
The daytime samples summer SMF CV 9 and winter SMF
and UF CV 8, as well as CV 9, stand out as having a relatively
high contribution from unknown species (i.e., the measured
rate of DTT loss is larger than the rate calculated from met-
als). The measured DTT response in both summer and win-
ter SMF “daytime mixed layer (CV 9)” is statistically larger
than calculated from transition metals (Fig. 3b and d, marked
with stars). In both cases, unknown species account for 49 %
of the measured rates of DTT loss. This indicates that com-
pounds other than the soluble metals we measured, likely
quinones or other organics, sometimes make significant con-
tributions to the PM oxidative potential. It is possible that
insoluble metals also contribute to DTT loss by “unknown
species”, but this is less likely since the insoluble fraction
of diesel PM (which has a low metal content) oxidizes DTT
quickly, while insoluble dust (which has high metals) oxi-
dizes DTT very slowly (Akhtar et al., 2010). Furthermore,
based on our total and soluble metal data, most DTT-active
metals (except Fe) have a high solubility (Fig. S7), while Fe
is less soluble but has a very low DTT activity (Charrier and
Anastasio, 2012). Hu et al. (2008) found a strong correla-
tion between DTT response and organic carbon (OC) and
observed that concentrations of OC are more than 4 times
larger during the day than at night. This could explain our
observed increase in DTT activity from compounds other
than metals during the day. OC is made up of a wide vari-
ety of organic compounds, not all of which are DTT-active.
Except for quinones (Kumagai et al., 2002; Charrier and
Anastasio, 2012; Chung et al., 2006), it is largely unknown
which organic compounds are active in the DTT assay. Re-
cent research has identified humic-like substances (HULIS)
as DTT-active (Verma et al., 2012; Lin and Yu, 2011), so
these types of compounds may contribute to the oxidative
potential of OC.
Atmos. Chem. Phys., 15, 2327–2340, 2015 www.atmos-chem-phys.net/15/2327/2015/
J. G. Charrier et al.: Oxidant production from source-oriented particulate matter 2335
We can estimate the likely contribution of quinones to our
Fresno PM samples by using previously measured particu-
late concentrations of phenanthrenequinone (PQN), the most
DTT-active quinone tested (Kumagai et al., 2002; Charrier
and Anastasio, 2012; Chung et al., 2006). PQN has a median
particulate-phase concentration of 0.32 ng−1 m−3 based on
(limited) measurements in southern California (Cho et al.,
2004). If we assume this ambient concentration for all of
our Fresno source-oriented mixtures (SMF + UF), and that
all PQN is soluble, the resulting PQN concentration in solu-
tion is between 1 and 12 nM. This would correspond to DTT
responses in the range of 0.01–0.16 µM DTT min−1, which
represents 2–36 % of the measured DTT rates (with an aver-
age ± 1σ contribution of 13± 9 %). This result agrees well
with the observations in Fig. 3, which show a consistent but
relatively small contribution of species besides Cu and Mn
to measured DTT response. This is consistent with our pre-
vious calculations for PM2.5 based on typical literature con-
centrations of DTT-active species (Charrier and Anastasio,
2012), where Cu, Mn, and quinones accounted for 47, 28,
and 18 % of the calculated DTT response of a hypothetical
“typical” fine particle sample. The specific organic species
that contribute to DTT response are still incompletely under-
stood, and may include species other than the PQN. These
hypothetical results are a lower estimate for organic contri-
bution to DTT response if other DTT-active organic species
are present. It is also possible that PM samples underesti-
mat the quinone contribution because semi-volatile organics
might be lost during sampling or particle extraction, but we
do not have any evidence for this.
In contrast to our mechanistic approach to identify the im-
portant DTT-active species in PM, previous studies gener-
ally use correlation analysis. However, correlations between
our DTT results and measured soluble metal concentrations
(Fig. S8a–c) reveal some of the difficulties with the correla-
tion approach. Cu, Mn, and Fe are modestly correlated with
DTT loss (R2 values of 0.40, 0.56, and 0.43, respectively)
and the correlation with Cu is the weakest, even though our
mechanistic approach identifies Cu as the dominant con-
tributor to DTT loss. The correlation understates the role
of copper because this metal has a nonlinear concentration-
response curve (see the green line in Supplement Fig. S8a).
The positive correlation between DTT loss and Mn agrees
with our mechanistic results, but the correlation with Fe is
spurious (since Fe is nearly inactive in the DTT assay), and is
possibly due to the covariance between Fe and Mn (Fig. S8f).
These plots illustrate that correlation analysis is unlikely to
identify the metals most important for DTT loss, which might
explain the inconsistent correlations between DTT response
and Cu in the literature (Ntziachristos et al., 2007; Hu et al.,
2008).
3.5 Air-volume-normalized oxidative potential
While the mass-normalized oxidative potential in Figs. 2 and
3 is useful for identifying sources that have the highest poten-
tial for harm, the oxidative burden associated with an air par-
cel also depends on the particle mass concentration of each
source. A source aerosol with a very high mass-normalized
oxidative potential may not be important if its atmospheric
mass concentration is low. As a first step to address this,
we use Eq. (2) to calculate the air-volume-weighted DTT re-
sponse for each size fraction and season. This metric weights
both the intrinsic oxidative potential of a source and the
relative abundance of that source. The volume-normalized
oxidative potentials from both size fractions (i.e., all PM
with Dp ≤ 1.0 µm) for summer and winter are 746± 90 and
217± 10 pmol DTT min−1 m−3 air, respectively. The DTT
activity in the summer particles is over 3 times higher than
in the winter because both the PM mass concentration and
mass-normalized oxidative potential of that PM are higher in
summer (Table 1 and Fig. 2), by factors of 2.2 and 1.6, re-
spectively. The winter SMF and UF volume-normalized ox-
idative potentials are 135 and 83 pmol DTT min−1 m−3 air,
respectively, while the corresponding summer SMF and UF
values are 623 and 123 pmol DTT min−1 m−3 air, respec-
tively. SMF PM has a higher volume-normalized oxidative
potential in both seasons, with summer SMF exhibiting very
high oxidative potential due to high mass concentrations and
high intrinsic oxidative potentials.
To identify which species and sources drive the air-
volume-normalized responses, we next apportion the
volume-normalized oxidative potential in two ways – by
chemical composition and by source (Fig. 4). Figure 4a
shows the contributions of soluble metals and unknown
species for each size fraction and season as an absolute value,
while Fig. 4b shows the data as a percent of the total DTT
loss. Summer SMF particles have the greatest oxidative po-
tential, approximately 6 times larger than the other condi-
tions, and this response is due to Cu (47 %), Mn (21 %),
and unknown species (31 %). Even though the other condi-
tions have much lower air-volume-normalized rates of DTT
loss, the percent contributions from Cu, Mn, and unknowns
are similar (Fig. 4b), although winter UF does not have a
contribution from unknown species. Based on these results,
unknown species, likely quinones or other organics, are im-
portant to the oxidative potential of PM in Fresno, but cop-
per and manganese are the dominant redox-active species.
The unknown contribution to PM is primarily from day-
time sources (Fig. 3), consistent with secondary formation of
quinones from PAHs (Eiguren-Fernandez et al., 2008; Wang
et al., 2007). DTT response from most segregated nighttime
sources, on the other hand, is completely explained by met-
als, with little unknown contribution (Fig. 3).
Apportionment of volume-normalized oxidative potential
by source is more difficult because most (> 79 %) of the
mass collected either during times when sources were not
www.atmos-chem-phys.net/15/2327/2015/ Atmos. Chem. Phys., 15, 2327–2340, 2015
2336 J. G. Charrier et al.: Oxidant production from source-oriented particulate matter
0
100
200
300
400
500
600
700
DT
T R
ate
(p
mo
ls /
min
/ m
3a
ir)
a)Unknown
Fe, V, Pb
Mn
Cu
0%
10%
20%
30%
40%
50%
60%
70%
80%
90%
100%
Co
ntr
ibu
tio
n t
o D
TT
Ra
te
b)
0
100
200
300
400
500
600
700
DT
T R
ate
(p
mo
ls /
min
/ m
3a
ir)
c) Unknown
Biomass/Wood
Smoke
Heating
Mobile
Cooking
0%
10%
20%
30%
40%
50%
60%
70%
80%
90%
100%
Co
ntr
ibu
tio
n t
o D
TT
Ra
te
d)
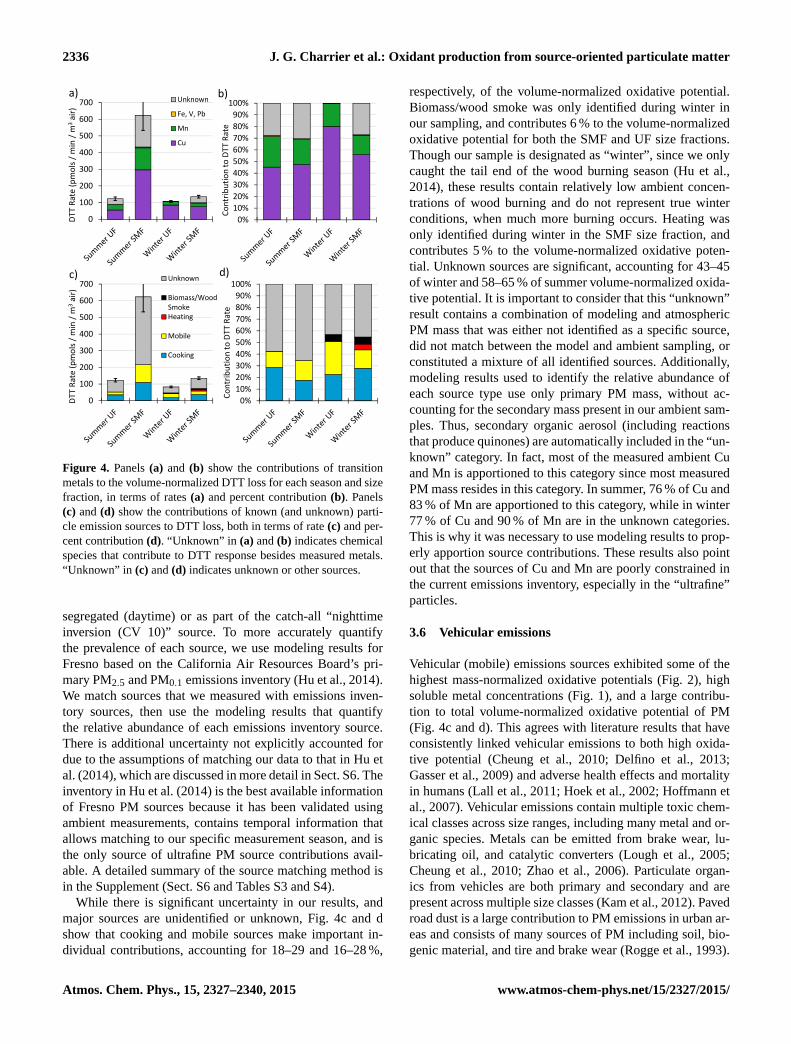
Figure 4. Panels (a) and (b) show the contributions of transition
metals to the volume-normalized DTT loss for each season and size
fraction, in terms of rates (a) and percent contribution (b). Panels
(c) and (d) show the contributions of known (and unknown) parti-
cle emission sources to DTT loss, both in terms of rate (c) and per-
cent contribution (d). “Unknown” in (a) and (b) indicates chemical
species that contribute to DTT response besides measured metals.
“Unknown” in (c) and (d) indicates unknown or other sources.
segregated (daytime) or as part of the catch-all “nighttime
inversion (CV 10)” source. To more accurately quantify
the prevalence of each source, we use modeling results for
Fresno based on the California Air Resources Board’s pri-
mary PM2.5 and PM0.1 emissions inventory (Hu et al., 2014).
We match sources that we measured with emissions inven-
tory sources, then use the modeling results that quantify
the relative abundance of each emissions inventory source.
There is additional uncertainty not explicitly accounted for
due to the assumptions of matching our data to that in Hu et
al. (2014), which are discussed in more detail in Sect. S6. The
inventory in Hu et al. (2014) is the best available information
of Fresno PM sources because it has been validated using
ambient measurements, contains temporal information that
allows matching to our specific measurement season, and is
the only source of ultrafine PM source contributions avail-
able. A detailed summary of the source matching method is
in the Supplement (Sect. S6 and Tables S3 and S4).
While there is significant uncertainty in our results, and
major sources are unidentified or unknown, Fig. 4c and d
show that cooking and mobile sources make important in-
dividual contributions, accounting for 18–29 and 16–28 %,
respectively, of the volume-normalized oxidative potential.
Biomass/wood smoke was only identified during winter in
our sampling, and contributes 6 % to the volume-normalized
oxidative potential for both the SMF and UF size fractions.
Though our sample is designated as “winter”, since we only
caught the tail end of the wood burning season (Hu et al.,
2014), these results contain relatively low ambient concen-
trations of wood burning and do not represent true winter
conditions, when much more burning occurs. Heating was
only identified during winter in the SMF size fraction, and
contributes 5 % to the volume-normalized oxidative poten-
tial. Unknown sources are significant, accounting for 43–45
of winter and 58–65 % of summer volume-normalized oxida-
tive potential. It is important to consider that this “unknown”
result contains a combination of modeling and atmospheric
PM mass that was either not identified as a specific source,
did not match between the model and ambient sampling, or
constituted a mixture of all identified sources. Additionally,
modeling results used to identify the relative abundance of
each source type use only primary PM mass, without ac-
counting for the secondary mass present in our ambient sam-
ples. Thus, secondary organic aerosol (including reactions
that produce quinones) are automatically included in the “un-
known” category. In fact, most of the measured ambient Cu
and Mn is apportioned to this category since most measured
PM mass resides in this category. In summer, 76 % of Cu and
83 % of Mn are apportioned to this category, while in winter
77 % of Cu and 90 % of Mn are in the unknown categories.
This is why it was necessary to use modeling results to prop-
erly apportion source contributions. These results also point
out that the sources of Cu and Mn are poorly constrained in
the current emissions inventory, especially in the “ultrafine”
particles.
3.6 Vehicular emissions
Vehicular (mobile) emissions sources exhibited some of the
highest mass-normalized oxidative potentials (Fig. 2), high
soluble metal concentrations (Fig. 1), and a large contribu-
tion to total volume-normalized oxidative potential of PM
(Fig. 4c and d). This agrees with literature results that have
consistently linked vehicular emissions to both high oxida-
tive potential (Cheung et al., 2010; Delfino et al., 2013;
Gasser et al., 2009) and adverse health effects and mortality
in humans (Lall et al., 2011; Hoek et al., 2002; Hoffmann et
al., 2007). Vehicular emissions contain multiple toxic chem-
ical classes across size ranges, including many metal and or-
ganic species. Metals can be emitted from brake wear, lu-
bricating oil, and catalytic converters (Lough et al., 2005;
Cheung et al., 2010; Zhao et al., 2006). Particulate organ-
ics from vehicles are both primary and secondary and are
present across multiple size classes (Kam et al., 2012). Paved
road dust is a large contribution to PM emissions in urban ar-
eas and consists of many sources of PM including soil, bio-
genic material, and tire and brake wear (Rogge et al., 1993).
Atmos. Chem. Phys., 15, 2327–2340, 2015 www.atmos-chem-phys.net/15/2327/2015/

J. G. Charrier et al.: Oxidant production from source-oriented particulate matter 2337
Though not directly emitted by vehicles, this source is corre-
lated with vehicle traffic volume.
In our summer data, “vehicular emissions (CV 5)” showed
high oxidative potential per mass of PM compared to other
sources (Fig. 2a), and also high soluble metal concentrations
(Fig. 1a). This source also showed significantly higher ox-
idative potential and soluble metals in the SMF size fraction
versus UF, which is not true for a majority of other sources.
Summer SMF “vehicular emissions (CV 5)” was enriched in
soluble Zn, Fe, and Cu, which were 46, 79, and 188 % higher
than the average summer SMF concentrations for the other
sources, while concentrations of soluble V and Mn were sim-
ilar to the average for the same size and season. Zn and Cu are
known to be enriched in brake wear and road dust (Cheung
et al., 2010), which have the largest concentrations in coarse
sizes but also contribute to submicron PM (Kam et al., 2012).
Thus the enhancement in soluble metals in the larger size
fraction of summer Vehicular Emissions suggest brake wear
or paved road dust can be important contributors to the ox-
idative potential of SMF vehicular emissions. Winter “vehic-
ular emissions (CV 3)” did not exhibit the same pronounced
enhancement in either soluble metals (Fig. 1b) or oxidative
potential (Fig. 2b), nor did they show a difference between
the two size fractions. We do not currently have a definitive
explanation for this result; however, there was periodic rain
during winter sampling which may have suppressed paved
road dust.
4 Conclusions
We measured the oxidative potential of 38 source-oriented
particle samples – separated into submicron fine (SMF) and
ultrafine (UF) size fractions – from Fresno, CA, in summer
2008 and winter 2009 using the DTT assay. We also quanti-
fied total and soluble metals in each sample. Fe and Zn are
the most abundant metals, followed by Cu and Mn. V and Pb
concentrations are extremely low, and Co, Cr, Cd, and Ni are
below detection. PM collected in summer 2008 has a higher
metal content on average and an ambient SMF mass concen-
tration 3 times higher. As a result, the oxidative potential of
summer PM is 60 % higher than winter PM per micron of
particle mass. SMF samples generally show higher oxidative
potentials on a mass-normalized basis compared to UF par-
ticles. Summer SMF sources with high oxidative potential
include “vehicular emissions (CV 5)”, “unknown – metals
(CV 6)”, “daytime mixed layer (CV 9)”, and “nighttime in-
version (CV 10)”. UF sources with the highest oxidative po-
tential per mass of PM include summer “cooking – NE (CV
1)”, summer “nighttime inversion (CV 10)”, winter “morn-
ing commute (CV 8)” and winter “daytime mixed layer (CV
9)”. On an air-volume-normalized basis useful for considera-
tions of human exposure, summer PM produces 240 % more
oxidative potential than winter PM per cubic meter of air. A
total of 83 % of summer oxidative potential is from the SMF
size fraction.
Our results indicate that Cu, and to a lesser extent Mn,
accounts for essentially all of the DTT response for most
of our individual nighttime sources. DTT rates in the day-
time sources are also generally dominated by metals, but
these samples also have a large (up to 50 %) contribution
from unknown compounds, likely quinones and other or-
ganics. When calculating the overall volume-normalized ox-
idative potential for each season (Fig. 4), Cu accounts for
approximately 50 %, unknown species account for approxi-
mately 30 %, and Mn accounts for 20 %. These results are
supported by recent epidemiological studies that found a sta-
tistical relationship between the Cu content of PM and mor-
tality in California (Ostro et al., 2007). When we appor-
tion our volume-normalized oxidative potential to sources,
unknown/unconstrained sources make the largest contribu-
tion (43–65 %), while cooking accounts for 18–29 %, mobile
sources account for 14–28 %, and heating and biomass com-
bustion make minor contributions (though they will be larger
in the winter months).
The Supplement related to this article is available online
at doi:10.5194/acp-15-2327-2015-supplement.
Acknowledgements. We thank Joel Commisso at the UC Davis
ICP-MS facility for soluble metal measurements, Tobias Kraft for
assistance with data collection, Jianlin Hu and Mike Kleeman for
useful discussions on air-volume-normalized DTT apportionment
by source, and Shexia Ma for preliminary sample preparation. This
research was made possible by Eladio Knipping and funding from
EPRI (award # P43512/C18871). Additional funding was provided
through an EPA STAR graduate fellowship to J. G. Charrier (no.
FP-91718101-0), by the National Institute of Environmental Health
Sciences (grant # P42ES004699), and by the California Agricul-
tural Experiment Station (project CA-D-LAW-6403-RR). This
work has not been formally reviewed by the EPA or NIEHS. The
views expressed in this article are solely those of the authors and do
not necessarily represent the views of the funders, who do not en-
dorse any products or commercial services mentioned in this article.
Edited by: A. Huffman
References
Adamson, I. Y. R., Prieditis, H., and Vincent, R.: Pulmonary toxicity
of an atmospheric particulate sample is due to the soluble frac-
tion, Toxicology and Applied Pharmacology, 157, 43–50, 1999.
Akhtar, U. S., McWhinney, R. D., Rastogi, N., Abbatt, J. P. D.,
Evans, G. J., and Scott, J. A.: Cytotoxic and proinflammatory
effects of ambient and source-related particulate matter (PM) in
relation to the production of reactive oxygen species (ROS) and
cytokine adsorption by particles, Inhal. Tox., 22, 37–47, 2010.
www.atmos-chem-phys.net/15/2327/2015/ Atmos. Chem. Phys., 15, 2327–2340, 2015

2338 J. G. Charrier et al.: Oxidant production from source-oriented particulate matter
Antonini, J. M., Taylor, M. D., Leonard, S. S., Lawryk, N. J., Shi,
X. L., Clarke, R. W., and Roberts, J. R.: Metal composition and
solubility determine lung toxicity induced by residual oil fly ash
collected from different sites within a power plant, Mol. Cell.
Biochem., ISI:000187068800028, 257–265, 2004.
Aust, A. E., Ball, J. C., Hu, A. A., Lighty, J. S., Smith, K. R., Strac-
cia, A. M., Veranth, J. M., and Young, W. C.: Particle charac-
teristics responsible for effects on human lung epithelial cells,
Research report (Health Effects Institute), 110, 1, 2002.
Bein, K. J. and Wexler, A. S.: A high-efficiency, low-bias method
for extracting particulate matter from filter and impactor sub-
strates, Atmos. Environ., 90, 87–95, 2014.
Bein, K. J., Zhao, Y., and Wexler, A. S.: Conditional sampling
for source-oriented toxicological studies using a single parti-
cle mass spectrometer, Environ. Sci. Technol., 43, 9445–9452,
doi:10.1021/es901966a, 2009.
Bein, K. J., Zhao, Y., and Wexler, A. S.: Retrospective source at-
tribution for source-oriented sampling and toxicity, Environ. Sci.
Technol., submitted, 2014.
Breysse, P. N., Delfino, R. J., Dominici, F., Elder, A. C. P., Framp-
ton, M. W., Froines, J. R., Geyh, A. S., Godleski, J. J., Gold, D.
R., Hopke, P. K., Koutrakis, P., Li, N., Oberdorster, G., Pinker-
ton, K. E., Samet, J. M., Utell, M. J., and Wexler, A. S.: US EPA
particulate matter research centers: summary of research results
for 2005–2011, Air Quality, Atmosphere and Health, 6, 333–355,
2013.
Brunekreef, B. and Holgate, S. T.: Air pollution and health, Lancet,
360, 1233–1242, 2002.
Bukowiecki, N., Lienemann, P., Hill, M., Figi, R., Richard, A.,
Furger, M., Rickers, K., Falkenberg, G., Zhao, Y. J., Cliff, S. S.,
Prevot, A. S. H., Baltensperger, U., Buchmann, B., and Gehrig,
R.: Real-world emission factors for antimony and other brake
wear related trace elements: Size-segregated values for light and
heavy duty vehicles, Environ. Sci. Technol., 43, 8072–8078,
2009.
Carosino, C. M., Bein, K. J., Plummer, L. E., Castaneda, A.,
Zhao, Y., Wexler, A. S., and Pinkerton, K. E.: Allergic Air-
way Inflammation is Differentially Exacerbated by Daytime
and Nighttime Ultrafine and Submicron Fine Ambient Parti-
cles: Heme Oxygenase-1 as an Indicator of PM-Mediated Aller-
gic Inflammation, J. Toxicol. Env. Health, Part A, 78, 254–266,
doi:10.1080/15287394.2014.959627, 2015.
Charrier, J. G. and Anastasio, C.: On dithiothreitol (DTT) as a mea-
sure of oxidative potential for ambient particles: evidence for the
importance of soluble transition metals, Atmos. Chem. Phys., 12,
9321–9333, doi:10.5194/acp-12-9321-2012, 2012.
Cheung, K. L., Ntziachristos, L., Tzamkiozis, T., Schauer, J. J.,
Samaras, Z., Moore, K. F., and Sioutas, C.: Emissions of Particu-
late Trace Elements, Metals and Organic Species from Gasoline,
Diesel, and Biodiesel Passenger Vehicles and Their Relation to
Oxidative Potential, Aerosol Sci. Technol., 44, 500–513, 2010.
Cho, A. K., Di Stefano, E., You, Y., Rodriguez, C. E., Schmitz,
D. A., Kumagai, Y., Miguel, A. H., Eiguren-Fernandez, A.,
Kobayashi, T., Avol, E., and Froines, J. R.: Determination of four
quinones in diesel exhaust particles, SRM 1649a, an atmospheric
PM2.5, Aerosol Sci. Technol., 38, 68–81, 2004.
Cho, A. K., Sioutas, C., Miguel, A. H., Kumagai, Y., Schmitz, D.
A., Singh, M., Eiguren-Fernandez, A., and Froines, J. R.: Redox
activity of airborne particulate matter at different sites in the Los
Angeles Basin, Environ. Res., 99, 40–47, 2005.
Chung, M. Y., Lazaro, R. A., Lim, D., Jackson, J., Lyon, J., Ren-
dulic, D., and Hasson, A. S.: Aerosol-borne quinones and reac-
tive oxygen species generation by particulate matter extracts, En-
viron. Sci. Technol., 40, 4880–4886, 2006.
Churg, A. and Brauer, M.: Human lung parenchyma retains PM2.5,
Am. J. Respir. Crit. Care Med., 155, 2109–2111, 1997.
Connell, D. P., Winter, S. E., Conrad, V. B., Kim, M., and Crist,
K. C.: The Steubenville Comprehensive Air Monitoring Program
(SCAMP): Concentrations and solubilities of PM2.5 trace ele-
ments and their implications for source apportionment and health
research, J. Air Waste Manage. Assoc., 56, 1750–1766, 2006.
Costa, D. L. and Dreher, K. L.: Bioavailable transition metals in par-
ticulate matter mediate cardiopulmonary injury in healthy and
compromised animal models, Environ. Health Perspect., 105,
1053–1060, 1997.
De Vizcaya-Ruiz, A., Gutierrez-Castillo, M. E., Uribe-Ramirez, M.,
Cebrian, M. E., Mugica-Alvarez, V., Sepulveda, J., Rosas, I.,
Salinas, E., Garcia-Cuellar, C., Martinez, F., Alfaro-Moreno, E.,
Torres-Flores, V., Osornio-Vargas, A., Sioutas, C., Fine, P. M.,
Singh, M., Geller, M. D., Kuhn, T., Miguel, A. H., Eiguren-
Fernandez, A., Schiestl, R. H., Reliene, R., and Froines, J.: Char-
acterization and in vitro biological effects of concentrated partic-
ulate matter from Mexico City, Atmos. Environ., 40, 583–592,
2006.
Delfino, R. J., Staimer, N., Tjoa, T., Gillen, D. L., Schauer, J. J., and
Shafer, M. M.: Airway inflammation and oxidative potential of
air pollutant particles in a pediatric asthma panel, J. Expo. Sci.
Environ. Epidemiol., 23, 466–473, 2013.
Demokritou, P., Kavouras, I. G., Ferguson, S. T., and Koutrakis, P.:
Development of a high volume cascade impactor for toxicologi-
cal and chemical characterization studies, Aerosol Sci. Technol.,
39, 925–933, 2002.
Dockery, D. W., Pope, C. A., Xu, X. P., Spengler, J. D., Ware, J.
H., Fay, M. E., Ferris, B. G., and Speizer, F. E.: An association
between air pollution and mortality in 6 United-States cities, N.
Engl. J. Med., 329, 1753–1759, 1993.
Dominici, F., Peng, R. D., Bell, M. L., Pham, L., McDermott, A.,
Zeger, S. L., and Samet, J. M.: Fine particulate air pollution and
hospital admission for cardiovascular and respiratory diseases,
Jama-J. Am. Med. Assoc., 295, 1127–1134, 2006.
Dreher, K. L., Jaskot, R. H., Lehmann, J. R., Richards, J. H.,
McGee, J. K., Ghio, A. J., and Costa, D. L.: Soluble transition
metals mediate residual oil fly ash induced acute lung injury, J.
Toxicol. Env. Health, 50, 285–305, 1997.
Dye, J. A., Adler, K. B., Richards, J. H., and Dreher, K. L.: Epithe-
lial injury induced by exposure to residual oil fly-ash particles:
Role of reactive oxygen species?, Am. J. Respir. Cell Mol. Biol.,
17, 625–633, 1997.
Eiguren-Fernandez, A., Miguel, A. H., Lu, R., Purvis, K., Grant,
B., Mayo, P., Di Stefano, E., Cho, A., and Froines, J.: Atmo-
spheric formation of 9,10-phenanthraquinone in the Los Angeles
air basin, Atmos. Environ., 42, 2312–2319, 2008.
Ellison, G. B., Tuck, A. F., and Vaida, V.: Atmospheric process-
ing of organic aerosols, J. Geophys. Res.-Atmos., 104, 11633–
11641, 1999.
Ercan, H., Birben, E., Dizdar, E. A., Keskin, O., Karaaslan, C.,
Soyer, O. U., Dut, R., Sackesen, C., Besler, T., and Kalayci, O.:
Atmos. Chem. Phys., 15, 2327–2340, 2015 www.atmos-chem-phys.net/15/2327/2015/

J. G. Charrier et al.: Oxidant production from source-oriented particulate matter 2339
Oxidative stress and genetic and epidemiologic determinants of
oxidant injury in childhood asthma, J. Allergy Clin. Immun., 118,
1097–1104, doi:10.1016/j.jaci.2006.08.012, 2006.
Fearon, I. M. and Faux, S. P.: Oxidative stress and cardiovascular
disease: Novel tools give (free) radical insight, J. Mol. Cell. Car-
diol., 47, 372–381, doi:10.1016/j.yjmcc.2009.05.013, 2009.
Gasser, M., Riediker, M., Mueller, L., Perrenoud, A., Blank, F.,
Gehr, P., and Rothen-Rutishauser, B.: Toxic effects of brake wear
particles on epithelial lung cells in vitro, Part. Fibre Toxicol., 6,
30 doi:10.1186/1743-8977-6-30, 2009.
Halliwell, B. and Cross, C. E.: Oxygen-derived species - their rela-
tion to human-disease and environmental stress, Environ. Health
Perspect., 102, 5–12, 1994.
Hoek, G., Brunekreef, B., Goldbohm, S., Fischer, P., and van den
Brandt, P. A.: Association between mortality and indicators of
traffic-related air pollution in the Netherlands: a cohort study,
Lancet, 360, 1203–1209, 2002.
Hoffmann, B., Moebus, S., Mohlenkamp, S., Stang, A., Lehmann,
N., Dragano, N., Schmermund, A., Memmesheimer, M., Mann,
K., Erbel, R., and Jockel, K. H.: Residential exposure to traffic is
associated with coronary atherosclerosis, Circulation, 116, 489–
496, 2007.
Hu, J., Hongliang, Z., Chen, S., Ying, Q., Wiedinmyer, C., Van-
denberghe, F., and Kleeman, M.: Identifying PM2.5 and PM0.1
sources for epidemological studies in California, Environ. Sci.
Technol., 48, 4980–4990, 2014.
Hu, S., Polidori, A., Arhami, M., Shafer, M. M., Schauer, J. J.,
Cho, A., and Sioutas, C.: Redox activity and chemical spe-
ciation of size fractioned PM in the communities of the Los
Angeles-Long Beach harbor, Atmos. Chem. Phys., 8, 6439–
6451, doi:10.5194/acp-8-6439-2008, 2008.
Ito, K., Mathes, R., Ross, Z., Nadas, A., Thurston, G., and Matte,
T.: Fine particulate matter constituents associated with cardiovas-
cular hospitalizations and mortality in New York City, Environ.
Health Perspect., 119, 467–473, 2011.
Jokela, W. E., Tilley, J. P., and Ross, D. S.: Manure nutrient con-
tent on Vermont dairy farms: long-term trends and relationships,
Commun. Soil Sci. Plant, 41, 623–637, 2010.
Kam, W., Liacos, J. W., Schauer, J. J., Delfino, R. J., and Sioutas, C.:
Size-segregated composition of particulate matter (PM) in major
roadways and surface streets, Atmos. Environ., 55, 90–97, 2012.
Kumagai, Y., Koide, S., Taguchi, K., Endo, A., Nakai, Y.,
Yoshikawa, T., and Shimojo, N.: Oxidation of proximal
protein sulfhydryls by phenanthraquinone, a component of
diesel exhaust particles, Chem. Res. Tox., 15, 483–489,
doi:10.1021/tx0100993, 2002.
Lall, R., Ito, K., and Thurston, G.: Distributed lag analyses of daily
hospital admissions and source-apportioned fine particle air pol-
lution, Environ. Health Perspect., 119, 455–460, 2011.
Li, N., Hao, M. Q., Phalen, R. F., Hinds, W. C., and Nel, A. E.:
Particulate air pollutants and asthma – A paradigm for the role
of oxidative stress in PM-induced adverse health effects, Cl. Im-
mun., 109, 250–265, doi:10.1016/j.clim.2003.08.006, 2003a.
Li, N., Sioutas, C., Cho, A., Schmitz, D., Misra, C., Sempf, J.,
Wang, M. Y., Oberley, T., Froines, J., and Nel, A.: Ultrafine
particulate pollutants induce oxidative stress and mitochondrial
damage, Environ. Health Perspect., 111, 455–460, 2003b.
Lin, P. and Yu, J. Z.: Generation of reactive oxygen species medi-
ated by humic-like substances in atmospheric aerosols, Environ.
Sci. Technol., 45, 10362–10368, 2011.
Lough, G. C., Schauer, J. J., Park, J. S., Shafer, M. M., Deminter,
J. T., and Weinstein, J. P.: Emissions of metals associated with
motor vehicle roadways, Environ. Sci. Technol., 39, 826–836,
2005.
Maring, H., Savoie, D. L., Izaguirre, M. A., Custals, L., and Reid,
J. S.: Mineral dust aerosol size distribution change during at-
mospheric transport, J. Geophys. Res.-Atmos., 108, 2156–2202,
doi:10.1029/2002JD002536, 2003.
NOAA: Climate Data Online, available at:http://www.ncdc.noaa.
gov/cdo-web/ (last access: 21 November 2014), 2014.
Ntziachristos, L., Froines, J. R., Cho, A. K., and Sioutas, C.: Re-
lationship between redox activity and chemical speciation of
size-fractionated particulate matter, Part. Fibre Toxicol., 4, 5,
doi:10.1186/1743-8977-4-5, 2007.
Oberdorster, G., Oberdorster, E., and Oberdorster, J.: Nanotoxicol-
ogy: An emerging discipline evolving from studies of ultrafine
particles, Environ. Health Perspect., 113, 823–839, 2005.
Ostro, B., Feng, W.-Y., Broadwin, R., Green, S., and Lipsett, M.:
The effects of components of fine particulate air pollution on
mortality in California: Results from CALFINE, Environ. Health
Perspect., 115, 13–19, 2007.
Perrone, M. G., Gualtieri, M., Consonni, V., Ferrero, L., Sangiorgi,
G., Longhin, E., Ballabio, D., Bolzacchini, E., and Camatini, M.:
Particle size, chemical composition, seasons of the year and ur-
ban, rural or remote site origins as determinants of biological
effects of particulate matter on pulmonary cells, Environ. Pollut.,
176, 215–227, 2013.
Peters, A., Wichmann, H. E., Tuch, T., Heinrich, J., and Heyder, J.:
Respiratory effects are associated with the number of ultrafine
particles, Am. J. Respir. Crit. Care Med., 155, 1376–1383, 1997.
Peters, A., von Klot, S., Heier, M., Trentinaglia, I., Hormann, A.,
Wichmann, H. E., and Lowel, H.: Exposure to traffic and the on-
set of myocardial infarction, N. Engl. J. Med., 351, 1721–1730,
2004.
Pirrone, N., Hedgecock, I. M., and Forlano, L.: Role of the am-
bient aerosol in the atmospheric processing of semivolatile con-
taminants: A parameterized numerical model (Gas-Particle Parti-
tioning (GASPAR)), J. Geophys. Res.-Atmos., 105, 9773–9790,
2000.
Pope, C. A., Burnett, R. T., Thun, M. J., Calle, E. E., Krewski, D.,
Ito, K., and Thurston, G. D.: Lung cancer, cardiopulmonary mor-
tality, and long-term exposure to fine particulate air pollution,
Jama, 287, 1132–1141, 2002.
Reff, A., Bhave, P. V., Simon, H., Pace, T. G., Pouliot, G. A., Mob-
ley, J. D., and Houyoux, M.: Emissions Inventory of PM2.5 Trace
Elements across the United States, Environ. Sci. Technol., 43,
5790–5796, 2009.
Richards-Henderson, N. K., Charrier, J. G., Bein, K. J., Bau, D.,
Wexler, A. S., and Anastasio, C.: Oxidant production from
source-oriented particulate matter – Part 2: Hydrogen peroxide
and hydroxyl radical, Atmos. Chem. Phys., in preparation, 2015.
Rogge, W. F., Hildemann, L. M., Mazurek, M. A., Cass, G. R.,
and Simoneit, B. R. T.: Sources of fine organic aerosol .3. Road
dust, tire debris, and organometallic brake lining dust – roads as
sources and sinks, Environ. Sci. Technol., 27, 1892–1904, 1993.
www.atmos-chem-phys.net/15/2327/2015/ Atmos. Chem. Phys., 15, 2327–2340, 2015
2340 J. G. Charrier et al.: Oxidant production from source-oriented particulate matter
Stoeger, T., Reinhard, C., Takenaka, S., Schroeppel, A., Karg, E.,
Ritter, B., Heyder, J., and Schulz, H.: Instillation of six different
ultrafine carbon particles indicates a surface area threshold dose
for acute lung inflammation in mice, Environ. Health Perspect.,
114, 328–333, 2006.
Sullivan, R. C., Guazzotti, S. A., Sodeman, D. A., and Prather,
K. A.: Direct observations of the atmospheric processing
of Asian mineral dust, Atmos. Chem. Phys., 7, 1213–1236,
doi:10.5194/acp-7-1213-2007, 2007.
Sunyer, J. and Basagana, X.: Particles, and not gases, are associ-
ated with the risk of death in patients with chronic obstructive
pulmonary disease, Int. J. Epidemiol., 30, 1138–1140, 2001.
Upadhyay, N., Majestic, B. J., and Herckes, P.: Solubility
and speciation of atmospheric iron in buffer systems sim-
ulating cloud conditions, Atmos. Environ., 45, 1858–1866,
doi:10.1016/j.atmosenv.2011.01.010, 2011.
Valavanidis, A., Fiotakis, K., and Vlachogianni, T.: Airborne Partic-
ulate Matter and Human Health: Toxicological Assessment and
Importance of Size and Composition of Particles for Oxidative
Damage and Carcinogenic Mechanisms, J. Environ. Sci. Health
Pt. C-Environ. Carcinog. Ecotoxicol. Rev., 26, 339–362, 2008.
Verma, V., Polidori, A., Schauer, J. J., Shafer, M. M., Cassee, F.
R., and Sioutas, C.: Physicochemical and toxicological profiles
of particulate matter in Los Angeles during the October 2007
Southern California wildfires, Environ. Sci. Technol., 43, 954–
960, 2009.
Verma, V., Rico-Martinez, R., Kotra, N., King, L., Liu, J. M., Snell,
T. W., and Weber, R. J.: Contribution of Water-Soluble and In-
soluble Components and Their Hydrophobic/Hydrophilic Sub-
fractions to the Reactive Oxygen Species-Generating Potential
of Fine Ambient Aerosols, Environ. Sci. Technol., 46, 11384–
11392, 2012.
Verma, V., Fang, T., Guo, H., King, L., Bates, J. T., Peltier, R. E.,
Edgerton, E., Russell, A. G., and Weber, R. J.: Reactive oxygen
species associated with water-soluble PM2.5 in the southeast-
ern United States: spatiotemporal trends and source apportion-
ment, Atmos. Chem. Phys., 14, 12915–12930, doi:10.5194/acp-
14-12915-2014, 2014.
Vidrio, E., Phuah, C. H., Dillner, A. M., and Anastasio, C.: Gener-
ation of hydroxyl radicals from ambient fine particles in a sur-
rogate lung fluid solution, Environ. Sci. Technol., 43, 922–927,
doi:10.1021/es801653u, 2009.
Wang, L., Atkinson, R., and Arey, J.: Formation of 9,10-
phenanthrenequinone by atmospheric gas-phase reactions of
phenanthrene, Atmos. Environ., 41, 2025–2035, 2007.
Yang, H., Liu, C., Yang, D. F., Zhang, H. S., and Xi, Z. G.: Com-
parative study of cytotoxicity, oxidative stress and genotoxicity
induced by four typical nanomaterials: the role of particle size,
shape and composition, J. Appl. Toxicol., 29, 69–78, 2009.
Zhang, Y. X., Schauer, J. J., Shafer, M. M., Hannigan, M. P., and
Dutton, S. J.: Source apportionment of in vitro reactive oxygen
species bioassay activity from atmospheric particulate matter,
Environ. Sci. Technol., 42, 7502–7509, doi:10.1021/es800126y,
2008.
Zhao, P. S., Feng, Y. C., Zhu, T., and Wu, J. H.: Characterizations of
resuspended dust in six cities of North China, Atmos. Environ.,
40, 5807–5814, 2006.
Atmos. Chem. Phys., 15, 2327–2340, 2015 www.atmos-chem-phys.net/15/2327/2015/