oxidation half-reaction of aqueous nucleosides and...
TRANSCRIPT
1
Oxidation half-reaction of aqueous nucleosides and nucleotides via
photoelectron spectroscopy augmented by ab initio calculations
Christi A. Schroeder,a‡
Eva Pluhařová,b‡
Robert Seidel,a William P. Schroeder,
a Manfred
Faubel,c Petr Slavíček,
d* Bernd Winter,
e* Pavel Jungwirth,
b* and Stephen E. Bradforth
a*
a Department of Chemistry, University of Southern California, Los Angeles, California 90089-
0482, USA b
Institute of Organic Chemistry and Biochemistry, Academy of Sciences of the Czech Republic,
Flemingovo nám. 2, 16610 Prague 6, Czech Republic c
Max-Planck-Institut für Dynamik und Selbstorganisation, Bunsenstrasse 10, D-37077
Göttingen, Germany d
Institute of Chemical Technology, Department of Physical Chemistry, Technická 5, 16628
Prague 6, Czech Republic and J. Heyrovsky Institute of Physical Chemistry, Academy of Sciences
of the Czech Republic, Dolejskova 3, 18223 Praha 8, Czech Republic
eJoint Laboratory for Ultrafast Dynamics in Solutions and at Interfaces (JULiq), Helmholtz-
Zentrum Berlin für Materialien und Energie, Albert-Einstein-Strasse 15, D-12489 Berlin,
Germany
‡ Contributed equally to this work
*Email: [email protected], [email protected]
[email protected], [email protected]
Keywords: DNA damage | photoelectron spectroscopy | DNA charge migration
Abstract
Oxidative damage to DNA as well as hole transport between nucleobases in oxidized DNA are
important processes in lesion formation for which surprisingly poor thermodynamic data exists; the
relative ease of oxidizing the four nucleobases being one such example. Theoretical simulations of
radiation damage and charge transport in DNA depend on accurate values for vertical ionization energies
(VIEs) and reorganization energies as well as standard reduction potentials. Liquid-jet photoelectron
spectroscopy can be used to directly study the oxidation half-reaction. The VIEs of nucleic acid building
blocks are measured in their native buffered aqueous environment. The experimental investigation of
purine and pyrimidine nucleotides, nucleosides, pentose sugars, and inorganic phosphate demonstrate that
photoelectron spectra of nucleotides arise as a spectral sum over their individual chemical components,
that is to say that electronic interactions between each component are effectively screened from one
2
another by water. Electronic structure theory affords the assignment of the lowest energy photoelectron
band in all investigated nucleosides and nucleotides to a single ionizing transition centered solely on the
nucleobase. Thus combining the measured VIEs with theoretically determined reorganization energies
allows for the spectroscopic determination of the one-electron redox potentials that have been difficult to
establish via electrochemistry.
3
Introduction
Oxidative damage induced by ionizing radiation has significant deleterious effects on genomic DNA such
as strand breaks and nucleobase damage,1 which can lead to mutations and cancer.
2 Double strand breaks
are by far the most damaging lesion as their repair is particularly difficult and the mutation probability is
high.3 For a double strand break to occur at least two oxidative lesions must lie within close range on the
double helix and the probability of such an occurrence increases if the hole (the locus of the oxidized
base) can migrate efficiently by charge transport.4-8
Rates of electron (hole) transport between two
nucleobases are determined by Marcus theory.9 To predict such rates, accurate knowledge of two key
energetic parameters is required, the energy change for the electron to move between nucleobases and the
total reorganization energy connected with this process. Equivalently, this information can be synthesized
from knowledge of the energetic parameters for the redox half-reactions of the two individual
nucleobases, namely the vertical ionization energies (VIEs) of each and the individual reorganization
energies on loss of an electron.10
Likewise, the long-lived electronically excited states populated after
ultraviolet exposure of DNA in sunlight have recently been shown to involve charge transfer between
adjacent bases; the energetic availability of such charge transfer states is determined by knowledge of the
VIE of the electron donor nucleobase as well as the electron affinity of the accepting base.11-13
Despite the
severe consequences of damage to DNA by ionizing or ultraviolet radiation, and the growing interest in
DNA as a scaffold for electronic materials,14,15
reliable energetic information of this sort has been difficult
to come by for native nucleobases.
A general consensus in the literature on the standard one-electron redox potentials of the
nucleobases has not yet been reached.16,17
Measuring the redox properties of these molecules by
electrochemical means is complicated by their dependence on protonation equilibria (giving pH
dependent shifts in half-potentials) and their tendency to undergo rapid deprotonation and further follow-
up reactions after oxidation.18,19
Time-resolved experiments have indicated that the initial charge transfer
step (removal of an electron) is in fact not dependent upon pH,20
but the slower subsequent follow-up
reactions can result in irreversible charge transfer at a measurement electrode surface.21,22
These poorly
defined follow-up reactions influence the redox equilibrium resulting in irreversible conditions that can
artificially lower the measured redox potential by as much as 0.3 V.17
In an effort to eliminate the complications that arise due to protonation equilibria, Seidel et al.
performed a series of cyclic voltammetry experiments to electrochemically probe the oxidation potential
of nucleosides (more formally the standard reduction potential of the nucleoside radical cation, Eo(N
•+/N))
in acetonitrile.16
However, experimental traces revealed that even under aprotic conditions, redox
reactions were still irreversible for all nucleosides. As such, the resulting electrochemically measured
values represent a lower limit of the potentials for the nucleosides.17
Steenken and coworkers
4
circumvented the problem of irreversible redox reactions in water by measuring aqueous electron transfer
equilibria between purine nucleosides and a reference molecule with a well-defined reduction potential in
order to back out the nucleoside radical cation reduction potential. Although values for purines are
established, estimates for the pyrimidine nucleosides by this approach are considerably less certain.23
This overall situation is hardly satisfactory. The best experimental data comparing all 5 bases are
not for aqueous solution. Moreover, these values are in relatively poor agreement with experimental
measurements in water that require multiple corrections to be transformed into numbers suitable for
modeling electron transfer processes between bases in aqueous solution.24
Into this void, there have been
recent attempts to provide such data from first principles theory using free energy cycles.17,24
The most
recent and comprehensive for the nucleobases are from Schlegel and coworkers, however, their
computations for redox potentials are not in quantitative agreement with experimental values in aqueous
solutions and suggest that Eo(N
•+/N) values in water should not differ much from those in the aprotic
acetonitrile.24
Finally, it is not clear how relevant these estimates are to the thermodynamic driving forces
for charge transfer between stacked bases inside the different electrostatic environment of double helical
DNA. Electronic interactions due to base stacking or hydrogen bonding inside the double helix have been
predicted to result in shifts in the vertical ionization energies17,25,26
. How large such shifts are for
nucleobase ionization energies within the double helix has been the topic of a recent paper by Cauet et al.
who suggest a surprisingly steep increase in the nucleobase VIE by approximately 3.4 eV due to long
range ordering of counterions along the phosphate backbone.27
However, our most recent calculations, in
which the effects of the aqueous environment were carefully included, paint a very different picture:
water and counterions reduce the effect of DNA environment on VIE of nucleobases to ~0.1 eV.28
It is
clear that a direct experimental probe of the ionization energetics of the component molecular groups
within aqueous DNA and a systematic assessment of what factors influence the ionization energies is
highly desirable.
Gas phase and microhydrated nucleic acid components’ IE values are pervasive in the
literature,29,30
yet much controversy exists regarding the energetic ordering of the highest lying orbitals
and in particular the molecular orbital that is home to the least tightly bound electron.31-33
Strong changes
in the lowest gas phase IE are found when a negatively charged phosphate is included to make a
nucleotide.31
On the other hand, gas phase studies are of limited value in that they neglect dielectric
contributions by the solvent to the electron binding energy (BE) as well as hydrogen bonding and
counterion effects. The ability to measure the electron BEs of biomolecules in a native environment is
crucial for obtaining a clear picture of the impact of the solvent and counterions. Here we present a
complete study on the photoionization energies of the individual components of nucleic acids in buffered,
aqueous solutions.
5
Methods
Experimental
Photoemission measurements were made at the U41 PGM undulator beamline at the BESSY
synchrotron facility in Berlin. Valence photoelectron spectra were collected using 200 eV X-rays
irradiating a 21 μm diameter liquid microjet flowing at a velocity of 120 m/s and a starting temperature of
20° C. The jet temperature in the interaction region is not expected to be less than approximately 3° C as
determined by evaporative cooling modeling.34,35
Experimental details of the liquid microjet technique
have been previously described36
and additional details can be found in the SI.
To generate meaningful data for the biomolecules studied, all solutions were prepared in a buffer
solution. Tris (tris(hydroxymethyl)aminomethane) along with hydrofluoric acid (HF) was used to buffer
and adjust the pH. More common biochemical buffers such as phosphate or Tris/HCl were avoided as
they would yield significant contributions to the PE spectrum in the energy range under study arising
from the phosphate or chloride anions, respectively.37,38
We refer to the SI for a detailed description of the
sample preparation.
Computational
The ground state geometries of canonical forms of nucleobases, nucleosides, and nucleotides
(both monovalent and divalent) in the most populated conformation in solution were optimized at the
MP2/aug-cc-pVDZ level employing the polarizable continuum model (PCM) for the aqueous solvent. For
AMP and UMP (both monovalent and divalent), we also optimized several structures with Na+
counterions. The lowest VIE was calculated employing the unrestricted version of the MP2 method with
annihilated higher spin components via Schlegel’s projection method (PMP2) for solute geometry before
ionization. In order to model VIEs, we employed the non-equilibrium version of PCM (NEPCM), which
means that only the fast component of the solvent response (corresponding to electronic motions) was
included. This approach was shown to yield very good agreement with VIEs from photoelectron
spectroscopy for a range of neutral and monovalent solutes including DNA components.32,39
(Note that
the standard PCM with both slow nuclear and fast electronic response included is suitable for the
adiabatic ionization energy (AIE) rather than VIE calculations). Ionization energies originating from more
tightly bound electrons were obtained by adding the electronic excitation energies of the lowest ionized
state, evaluated employing the TDDFT with the BMK functional combined with NECPM, to the lowest
VIE. This approach employing a well-chosen hybrid functional was shown to be a reliable way for higher
ionization energies of DNA components in refs.32,39
. All calculations are performed with Gaussian 03.40
6
Results and Discussion
Photoelectron spectra
In general, because photoelectron (PE) spectroscopy ionizes solute and solvent molecules with near equal
probability,36
we find a solute concentration of at least 0.2 M is required to obtain adequate signal-to-
noise when removing the aqueous buffer background (see SI for procedure and Fig. S2). The few
millimolar solubility of nucleobases in water,41
has precluded us from studying them with the current
experimental setup. As the pentose sugars substantially increase solubility, we were able to obtain high
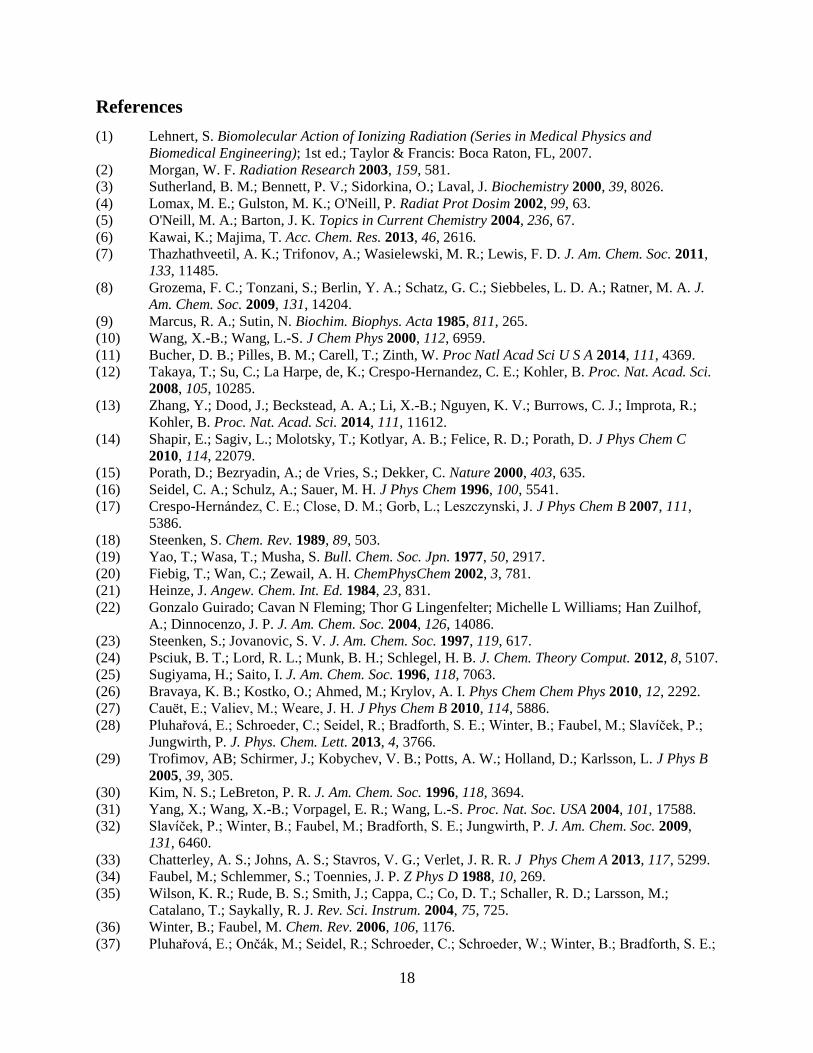
quality PE spectra for the pyrimidine nucleosides deoxythymidine, uridine and cytidine (Figure 1(a-c))
after subtracting the background spectrum (1 M Tris-HF buffer) from the similarly buffered nucleoside
solution. The photon energy was 200 eV. We have previously reported preliminary data on the ionization
energies for deoxythymidine and cytidine.32
However, repeating both experiments here using
supersaturated solutions and higher energy resolution results in a significant improvement in signal-to-
noise; in addition the new PE spectrum of uridine completes the pyrimidine nucleoside family. All three
exhibit similar spectral features consisting of two distinct bands, which are well fit by a sum of two
Gaussians with the same band centers for the three investigated species. The difference resides in the
intensity of the two bands; the lower BE peak is best resolved in deoxythymidine followed by uridine.
Figure 1(d) shows the PE spectra for D-ribose and 2'-deoxy-D-ribose. Both sugar solution spectra
exhibit a similar broad band that can be fitted to a single Gaussian centered at 9.4 eV, although we cannot
infer from this that the band represents ionization from a single orbital. Nevertheless, the lowest energy
band at 8.1 eV in the nucleoside data is distinctly absent in the ribose and deoxyribose spectra, strongly
suggesting the ionizing transition(s) associated with the 8.1 eV band in Fig 1(a-c) are solely attributable to
orbital(s) on the nucleobase, as also shown computationally in our previous studies.32,39
Given the
similarity in peak positions, the sugar presumably contributes significantly to the 9.4 eV band in the
nucleoside PE spectra. This interpretation is supported by poorer signal-to-noise spectra (Figure S3) of
the most soluble of the nucleobases, cytosine. The spectrum shows approximately equal intensity between
8.0 and 9.5 eV BE suggesting the cytosine base contributes intensity to the 9.5 eV band of the cytidine
nucleoside as well as around ~8.1 eV. Table 1 summarizes our findings for the valence region of cytidine,
deoxythymidine, and uridine. Solubility constraints made acquisition of purine nucleoside PE spectra
impossible, although recently Lübcke and coworkers have been able to extract an adiabatic ionization
energy for adenosine using resonant multi-photon ionization from a liquid jet.42
Solubilities for adenosine
and guanosine, 30 mM43
and 2 mM,41
respectively, are well below the ~200 mM threshold required for
adequate contrast to the water background in our experiments.
Next in the series of nucleic acid building blocks is the nucleotide, where the addition of
orthophosphate at the 5' position of the pentose sugar introduces a new low binding energy center and
7
imparts a net negative charge to the molecule. Inorganic phosphate with a pKa2 of 7.244
has two
protonation states (H2PO41-
and HPO42-
) relevant to biological media. We have recently reported PE
measurements of sodium phosphate solutions and find the lowest VIEs of 9.5 eV for H2PO41-
and 8.9 eV
for HPO42-
.37
The divalent phosphate contribution can be seen in the photoelectron spectra of the
pyrimidine nucleotides UMP2-
and CMP2-
in Figure 1(e-f). When comparing the pyrimidine nucleosides
to nucleotides, it is apparent that the addition of the orthophosphate results in new PE intensity near 9 eV,
reducing the ability to resolve the lower and higher energy peaks as distinct features. Gaussian fitting
however suggests the lowest energy peak position and, therefore, the base electronic structure, remains
essentially unaffected despite the addition of the charged phosphate near the nucleobase group. The
omission of the last pyrimidine nucleotide, dTMP, in this dataset is due to prohibitive cost of the
compound at the multi-gram quantities required for each experimental run.
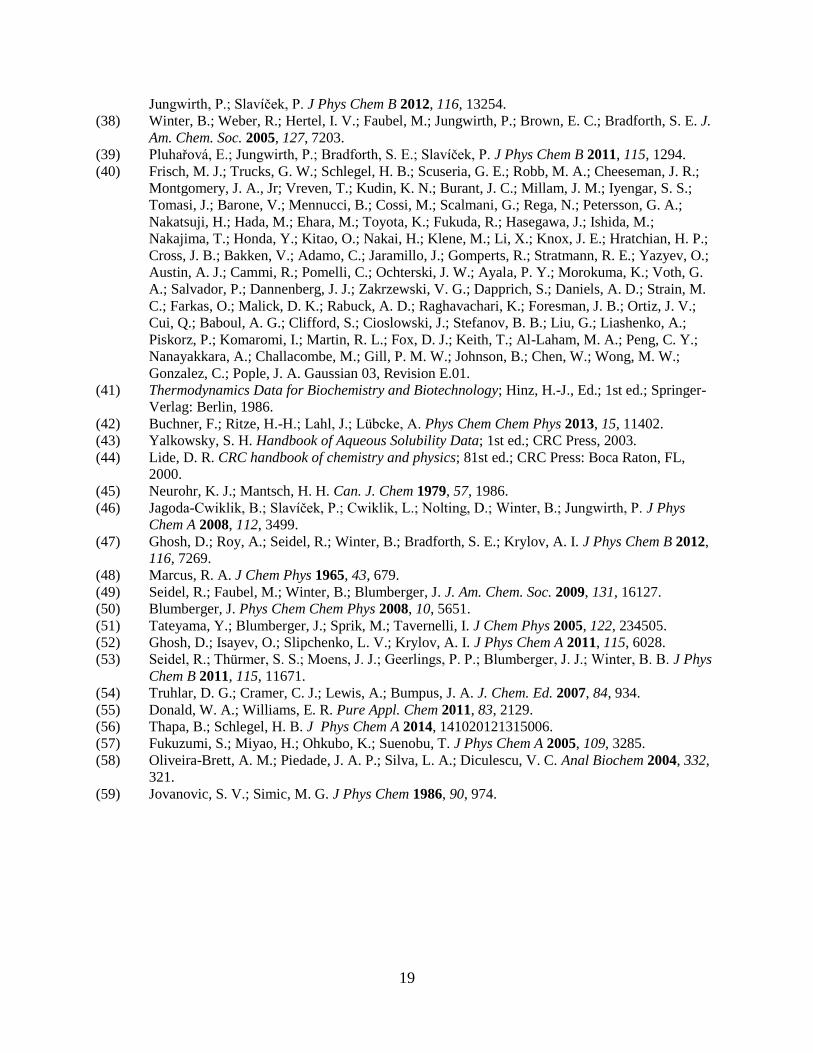
The spectra of the purine nucleotides AMP2-
and GMP2-
are shown in Figure 2. Unlike the
pyrimidine nucleotides, where the lowest VIEs were nearly identical, there is an obvious difference in the
AMP2-
and GMP2-
spectra between 6 and 8 eV. The first GMP2-
band begins to grow in at a lower energy
than that of AMP2-
, and peaks at 7.3 eV compared to 7.6 eV for AMP2-
(Table 2). We also note here that
even though some G-quadruplex formation and base stacking can be expected at concentrations as high as
1 M, an experimental concentration dependence study for GMP (Fig. S6 in SI) showed little or no change
for the peak center of the low BE band, and therefore the VIE. Specifically, over the concentration range
studied (0.2 – 1M), the fraction of free GMP decreases from ~85 to 70%,45
nevertheless the free
nucleotide is still the dominant species in the present experiments. At higher BEs, the overall band shapes
are qualitatively similar to each other, as well as to those of the pyrimidine nucleotides. In Figure S4 in
the SI we explore the effect of changing the protonation state of the adenine mononucleotide: i.e.,
AMP1-/2-
. The spectra are nearly identical in the low energy band centered at approximately 7.6 eV.
Differences only become apparent at BEs greater than 8 eV; the higher energy feature appears shifted to
lower energy in the deprotonated forms compared to the higher protonation state of the nucleotide. A
similar result is found for the different protonation states of inorganic phosphate ion.37
Importantly, there
are no significant changes in the lowest binding energy band (i.e., the VIE) on changing the phosphate
charge (via the pH).
Overall these experimental findings provide evidence to suggest that in the aqueous solution each
nucleic acid constituent group (base, sugar, phosphate) contributes individually to the photoelectron
spectra, generating an overall spectrum arising as a sum over the individual parts. In particular, for
nucleotides, the presence of the high dielectric solvent along with associated sodium counterions appears
to screen the electrostatic interactions between the charged phosphate and the remainder of the molecule.
8
Comparisons of VIEs and photoelectron spectra to theory
The broad nature of the spectral features makes it impossible to determine the number of states
contributing to each band as well as the molecular identity of the originating orbitals solely from the
experimental data. For this we seek the assistance of theory. Detailed theoretical results for pyrimidine
nucleobases, nucleosides, and nucleotides have been reported previously.32
The lowest vertical ionization
energies for purines were separately considered in some detail and we explored whether broadening in the
lowest BE photoelectron band could arise from various base tautomeric and conformational isomers.39
However, the full liquid PE spectrum was not modeled and the effect of counterions or protonation state
has not been addressed theoretically hitherto. The computational approach we employ, along with the
non-equilibrium polarizable continuum model (NEPCM) treatment of the solvent environment has been
justified in detail by comparison to experiment and higher level ab initio calculations for model
compounds elsewhere.39,46
Namely, we showed for ionization of neutral heteroaromatic species like
imidazole that this approach gives accurate VIEs. The values, which are within few tenths of eV below
the experimental value can be brought to even closer agreement by a hybrid approach combining
microhydration by several explicit water molecules with NEPCM.46
The microhydration approach is,
however, impractical for the scope of the present calculations. As such, simulated spectra are generated
by simply broadening the discrete lines from the calculated vertical ionization transitions by Gaussians
with empirical FWHM = 1 eV, in agreement with the peak widths corresponding to single ionization
transitions observed in several measured spectra.32,37,46,47 Each transition is assumed to have an equal
photoionization cross section as the energy of the ionizing photons is far above all ionization thresholds
and the outgoing kinetic energy dependent cross sections are therefore assumed to be relatively slowly
varying.
Computed spectra of the valence BE region of the pyrimidine nucleobases, pentose sugars, and
phosphate, H2PO41-
, can be seen in Fig. 3(a-c), along with sticks indicating the energies of individual
ionization transitions. Each panel clearly illustrates that the lowest energy ionization transition originates
from the nucleobase, is well separated from other transitions and occurs at BEs about 8 eV. All other
transitions involving the sugar and phosphate, along with additional transitions from the nucleobase,
occur at higher BEs of nearly 9 eV. There is one exception for cytosine, which has an additional ionizing
transition at approximately 8.4 eV.
The theoretical results for the pyrimidine nucleosides strongly support what has already been
deduced from the experimental data: the lowest BE spectral feature results from an ionization transition
originating from an orbital located solely on the nucleobase. A direct comparison between the
experimental and simulated spectra can be seen in Fig. 3(d-f). The lowest energy band is most clearly
resolved in deoxythymidine, followed by uridine, then cytidine. The calculations reveal that this is due to
9
the larger energy gap between the first and second ionization transitions in deoxythymidine, as compared
to uridine; cytidine having the smallest energy gap. The second ionization transition of cytidine (at 8.4
eV) is a second low-lying ionization of the cytosine nucleobase (see SI for cytosine spectrum). In uridine
and thymidine, a second transition originating from the nucleobase does not occur until 9.2 eV as seen in
Fig. 3(a-c). Although the simulations reproduce the band shapes and intensities well for the pyrimidine
nucleosides, there is an offset in the calculations for the lowest VIE that is particularly noticeable in
deoxythymidine (0.4 eV lower in the calculations). We argue that in this case the PCM probably does not
describe the first solvation shell adequately.32
In the SI we further discuss the role of micro-solvation on
the VIE.
For the nucleotides, both the calculated spectra (Fig. 3(g-i)) and now also the lowest VIEs are in
good agreement with experiment. It is clear in all cases that the electron ejected from the HOMO
originates from a base-centered orbital, however, molecular orbital assignments for more tightly bound
electrons are less straightforward. For nucleosides, the higher BE band consists of transitions originating
not only from orbitals located solely on the sugar and base, but also from molecular orbitals that extend
over both moieties. For nucleotides, the addition of the phosphate, whose spectral signature lies between
that of the base and sugar, suggests that there are even more orbitals contributing to this higher BE
spectral region. Representative examples of the molecular orbitals probed in the nucleotides are shown in
the SI (Fig. S9).
The simulated spectra for the nucleobase and nucleoside analogs of AMP, as well as calculated
and experimental AMP1-
results are presented in Fig. 4 together with the corresponding results from
guanine and its derivatives. As for the pyrimidines, the purine nucleobases display a single ionization
transition present at BEs < 9 eV. The lowest VIE for adenine is predicted to be 7.7 eV, only slightly less
than those of the pyrimidines nucleobases. Guanine, however, has a calculated VIE value of 7.3 eV, well
below that of all other nucleobases. The addition of a sugar results in no change for the nucleoside
adenosine as compared to the nucleobase, and only a minimal shift to 7.4 eV for guanosine. Fig. 4(e)
displays an excellent agreement between theory and experiment for the AMP1-
spectrum, as computations
for monovalent nucleotides do not suffer from the same complications as those conducted for their
divalent counterparts.37
In Fig. 4(f), we therefore show the comparison of modeled spectra for monovalent
GMP1-
with experimental results of GMP2-
. The agreement is very close at the onset of the spectrum but
tends to be less satisfactory at higher energies where ionizations from the phosphate and sugar moieties
appear. This latter issue and as well as the limitations of the PCM model for divalent anions is discussed
in greater detail in the SI, where experimental and calculated spectra for both the mono- and divalent
forms of AMP are shown (Fig. S5).
10
In an attempt to determine whether or not the identity of the counterion impacts the lowest VIE,
we have further investigated computationally the effect of the association of Na+ with the mono- and
divalent forms of UMP and AMP. Calculations show that Na+ in the vicinity of the phosphate group
causes changes smaller than 0.1 eV, which is negligible given the width of the experimental peaks. This
issue has been explored in detail in Ref. 37
.
In all cases, non-equilibrium polarizable continuum calculations show there is a single ionization
transition contributing to the lowest energy photoelectron band for all nucleobases, nucleosides, and
nucleotides. Furthermore, this ionization originates solely from the nucleobase moiety. A summary of all
theoretical and experimental results for the lowest band can be found in Table 3.
Reorganization Energies and Redox Potentials
So far our primary focus has been on the analysis of VIEs obtained from the experimental PE peaks. As
the lowest energy peak originates from a single ionizing transition, additional information can in principle
be deduced from the peak width; the energy it requires for both the biomolecule and solvent to reorganize
to relaxed geometries after the unit change in the nucleobase charge. The calculation of charge transport
rates in oxidized DNA crucially depends on knowledge of this energetic parameter.9,48
Direct knowledge
of both the VIE and reorganization energy allows a determination of the one-electron standard reduction
potential and represents an alternative to electrochemical experiments.
Photoionization of a neutral nucleoside results in the loss of an electron and the generation of an
oxidized radical cation according to the half-reaction, N N˙+ + e
-. The energy for the system to
structurally relax from the original neutral to that of the newly formed radical cation is the reorganization
energy, λ.10
This can be cast as the sum of two contributions, intramolecular (solute) λin and
intermolecular (solvent) λout. In the limit of linear response, the PE peak width is related to the total λ
through49-51
s 2 = 2lkBT (1)
where σ2 corresponds to the variance of the Gaussian distributed spectral intensity, kB is the
Boltzmann constant, and T is temperature. λ is readily accessible from computation as it corresponds to
the free energy difference between the aqueous VIE and adiabatic ionization energy (AIE), with solute
entropic contribution accounted for within the harmonic oscillator-free rotor approximation.
λout is estimated for all four bases at 1.1 eV from the polarizable continuum model used here
(Table 4). The fact that the λout values are the same within the error for all nucleosides may seem
surprising at first sight. However, note that the solvent response is due to removal of a unit charge from
the HOMO that is delocalized over the π-system, the extent of which is roughly the same in all cases. A
11
significantly higher value can be derived from previously simulated band profiles of thymine ionization.52
These calculations used an effective fragment potential (EFP) and molecular dynamics for discrete
solvent waters to capture the dynamical solvent structure at 300 K but kept the solute frozen (λin = 0).52
Taking a Gaussian full width of 0.75 eV from ref. 52
allows an estimate via equation (1) of λout = 2.0 eV.
As our calculations provide separately the reorganization energy of the solute, we can add this value to
both theoretical models to arrive at an overall reorganization and to compare with the experimental peak
width.
Thymine in deoxythymidine is the system where the photoelectron spectra show the most clearly
resolved lowest BE band and, therefore, it is the best current example to make this test. For this species,
λin is 0.34 eV (Table 4) yielding, using the PCM solvent model, λ = 1.44 eV (from ref. 32
, Table 4) or
derived from the EFP solvent model,52
λ = 2.3 eV. From these values, full peak widths predicted using
equation (1) are 0.62 and 0.81 eV FWHM respectively. The filled gray Gaussian in Fig. 1(a) corresponds
to FWHM = 0.62 eV. Gaussian fitting of the lowest binding energy experimental peak instead yields a
FWHM of ~0.9 eV. We note that broader widths in aqueous phase PE spectra than expected from
reorganization grounds alone have been noted before.28,49,53
We are therefore wary to discriminate
between quite different estimates for λ computed by the two theoretical approaches by comparison with
experimental peak widths alone.
A second approach to establish the correct magnitude of the solvent reorganization energy is to
compare the VIE with the appropriate standard state redox potential for G, the only base for which the
thermodynamic value is well agreed upon.23,24
Eo(G
•+/G), the standard state reduction potential for G
•+,
namely the negative of the free energy change for the reaction relevant to photoemission G•+
(aq) + e-
G(aq) at standard state, is simply the AIE referenced to the standard hydrogen electrode (SHE) rather than
vacuum. So if we difference our measured VIE for GMP (7.3 eV) with the literature Eo(G
•+/G) we can use
λ = VIE – AIE to work backward to get a best estimate for λout. Further, it is then reasonable to assume
λout to be roughly the same for all systems. The most commonly cited23
standard reduction potential for
G•+
suitably converted here to Eo(G
•+/G) by carefully reconsidering protonation states (see SI), gives 1.5 V
versus SHE. Taking into account the absolute half-cell potential for SHE relative to vacuum, 4.28 V24,54-55
the total reorganization energy, λ, for ionizing G is 7.3 – 1.5 – 4.3 = 1.5 eV.
This second line of evidence suggests that the PCM estimate for the solvent reorganization is
quite accurate, with an error in λ (and, therefore, also in λout) of only ~ 0.2 eV. This is further supported by
our test calculations on cytidine including 10 explicit water molecules within the PCM cavity (for more
details see SI), which yield λ larger by about 0.2 eV compared to the pure PCM value. We therefore
choose to use the PCM model for the solvent response to ionization and leave rationalizing the observed
experimental peak width for future work. We now have a route to derive the standard reduction potentials

12
for the nucleobases other than G where it is much more poorly known. Best values found this way for the
nucleoside and nucleotide radical cation standard reduction potentials Eo(N
•+/N) are shown in Table 4
using PE VIEs (where measured) and PCM values of the reorganization energies. The spread in VIEs
(Tables 1 and 2) is essentially mapped onto the derived Eo with U in uridine being the hardest to oxidize,
Eo(U
•+/U) = 2.4 V, 1.0 V higher than G in GMP. For comparison, the most heavily cited E
o(N
•+/N) values
in the literature are included in Table 4. These are Seidel et al.’s cyclic voltammetry results in aprotic
acetonitrile16
and Steenken and Jovanovic’s redox parameters23
obtained from measuring nanosecond
equilibria in water. Note that the latter data for aqueous purines needed to be recalculated here. This is
because for adenosine the equilibrium between its different protonation forms has not been properly taken
into account in the original paper by Steenken and Jovanovic. For guanosine a confused notation for E0 in
the same paper23
has unfortunately propagated into a later study by Schlegel et al., which otherwise
provides a very thorough analysis of issues connected with establishing redox potentials of DNA bases.24
In particular, Schlegel and coworker’s work is important in that these authors carefully analyze the
various equilibria for the radical cations, including the effect of specific56
and long-range continuum
solvation.24
For direct comparison between original and recalculated data and discussion of corrections
made here see last section of the SI and Table S1 therein. Another problem is that the experimental
literature values are for nucleosides,16,23
for which we have only datasets for pyrimidines. Due to purine
nucleoside solubility constraints, the values shown for guanosine and adenosine in Table 4 use
theoretically determined VIEs. But Fukuzumi et al., using a similar fast kinetics based approach to
Steenken23
have more recently reported half-potentials at pH=7 (E7) for all the nucleotides.57
These show
that E7 values are in fact very similar for the purine bases in nucleosides and nucleotides (see Table 4).
Likewise, pulsed voltammetry shows oxidation at the same potential for nucleosides and nucleotides in
the case of both pyrimidines and purines.58
In general, we find that it is possible to independently determine the standard reduction potentials
by PE spectroscopy in water when assisted by ab initio calculations. The relative uncertainty in the redox
potentials derived from photoelectron spectroscopy is sufficient to demonstrate that our E0 are in much
better agreement with those determined electrochemically in acetonitrile,16
than with those based on ref. 23
in water. Based on ~ 0.1 eV uncertainty in the determination of VIE, and experience with solvation of
neutral and singly charged species employing the polarizable continuum model, the cumulative error may
amount to as much as 0.2 - 0.3 eV in the absolute Eo(N
•+/N) values given in Table 4. However, we argue
in the Supporting Information that the error in the computed reorganization energy is systematic;
benchmarking with QM/MM calculations suggests that the reorganization energy is repeatedly
underestimated by 0.2 – 0.25 eV. As such, the relative uncertainty comparing one base to another is
closer to 0.15 eV. While this error exceeds that typical in electrochemical measurements, it allows us to
13
independently establish a scale for the Eo(N
•+/N) in water in the absence of follow up reactions (i.e., the
direct oxidation reaction). Moreover, we show that the derived E0 values align quantitatively with the
nucleoside redox couples in acetonitrile. This conclusion is consistent with the findings of Schlegel and
coworkers24
who finds small differences in values of Eo(N
•+/N) computed from first principles in
acetonitrile and water. We note that the spectroscopic scale of Eo(N
•+/N) that we propose here has even
more positive values for dThymidine and cytidine than those measured by voltammetry in acetonitrile.
This discrepancy could be attributable to a greater underestimation of the reorganization energy for a hole
localized on single ring aromatic compared to the more delocalized hole on an ionized purine.
Conclusions
We have measured the aqueous-phase photoelectron spectra and have obtained the vertical ionization
energies of the individual components of DNA, which include the pentose sugars, pyrimidine nucleosides
and nucleotides, and purine nucleotides. The first vertical ionization energies for the aqueous pyrimidine
nucleosides are essentially identical within experimental error. In nucleotides, the spectral contribution of
the phosphate moiety can be seen about 9 eV electron binding energy, consistent with previous
photoelectron studies on aqueous divalent phosphate.37
There is also little shift in the lowest VIE when
comparing the neutral pyrimidine nucleosides to the doubly charged nucleotides. As expected, the VIEs
for ionizing the purine group in their respective nucleotides are lower than in the corresponding
pyrimidines. This lowering is particularly pronounced for GMP which is 0.7 V easier to vertically ionize
than UMP.
Putting these results together, the photoelectron spectra of nucleic acid constituents can be viewed
essentially as sum over the component chemical groups. This is in strong contrast to the gas phase
photoelectron spectra of nucleotides31,33
and indicates that the solvent and the counterions effectively
screen the charged phosphate moiety, thus preventing electrostatic interaction with the remainder of the
molecule. The lack of spectral contributions at BEs less than 8 eV in the sugar and phosphate spectra37
imply that the lowest BE peaks present in the nucleosides and nucleotides are due to the nucleobase.
Although certainly an approximation, the non-equilibrium PCM model is shown to be effective in the
treatment of solvent effects, and the resulting computed photoelectron spectra are in excellent agreement
with experimental data. The electronic structure calculations confirm that the lowest energy feature is
indeed due to a transition originating on the nucleobase in all cases.
Combining the experimental VIE measurements with the reorganization free energy λ values
derived from the PCM model has allowed an independent, spectroscopic, determination of the one-
electron E0 values for these aqueous nucleic acid components, which does not suffer from follow-up
reactions such as deprotonation that renders electrochemical measurements irreversible. As a result, not
14
only is the ordering of ease of oxidation amongst all the nucleobases confirmed, but the standard
reduction potentials for the pyrimidine radical cations relative to the purine species are more firmly
established. These standard reduction potentials should find use in more accurately parameterizing the
kinetics of charge transfer in DNA, particularly as very recent PE spectra have shown rather negligible
shifts in vertical ionization energies when the nucleobases are incorporated into the double helix.28
Supporting Information Available
Detailed information about the experimental methods, including sample preparation, sample structure
(Figure S1), subtraction, normalization, and calibration (Figure S2) of the photoelectron spectra;
differential photoelectron spectrum of cytosine for representative low solubility nucleobase (Figure S3);
protonation and phosphorylation of the adenine nucleotide (Figure S4 and S5); GMP concentration
dependence on the PE spectrum, G-tetrad formation (Figure S6); theoretical description and calculations
of the microsolvation within the NEPCM approach (Figure S7, S8, and S9); depiction of the four highest
occupied molecular orbitals of all monovalent nucleotides in PCM water (Figure S10); description of the
pH-dependence of redox potentials (Figure S11); derivation of the prototropic equilibria and the reduction
potential; extraction of the standard redox potentials from electrochemical literature for the nucleobases;
correction of standard redox potential data for aqueous purines (Table S1). This material is available free
of charge via the Internet at http://pubs.acs.org.
Acknowledgments
We thank Professors Rich Roberts and Peter Qin for advice in biochemical preparation. The USC group is
supported by the National Science Foundation under CHE-0957869 and CHE-1301465 and acknowledges
the Helmholtz Zentrum Berlin for beam time. We also acknowledge Dr. Bernd Löchel and the
Microtechnology group at BESSY for assistance with the HF preparations used in the course of the
experimental work. P.J. thanks the Czech Science Foundation (grant P208/12/G016) and the Academy of
Sciences (Praemium Academie Award). P.S. thanks the Czech Science Foundation (grant 13-34168S).
E.P. thanks the International Max-Planck Research School for support and B.W. and R.S. acknowledge
support from the Deutsche Forschungsgemeinschaft (projects WI 1327/3-1 and SE 2253/1-1).
15
Ribose Deoxyribose Uridine dThymidine Cytidine
8.1 8.1 8.1
9.4 9.4 9.5 9.5 9.4
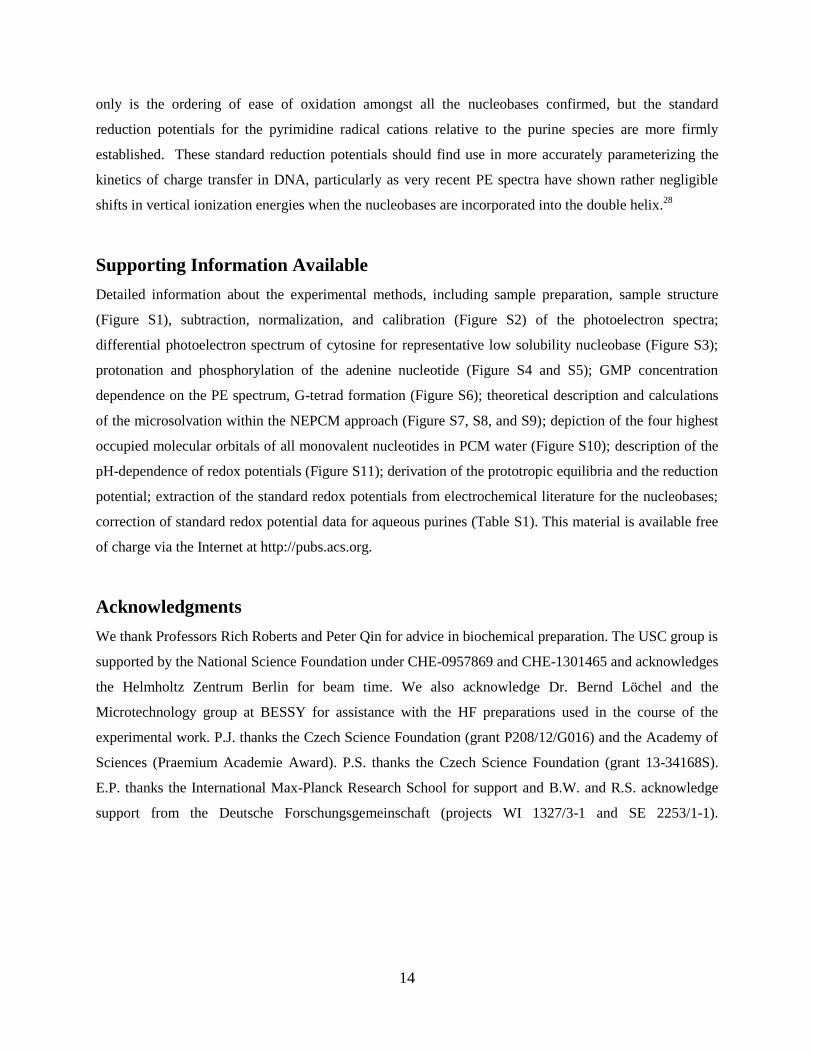
Table 1: Peak centers (electron binding energy, eV) based on Gaussian spectral fitting shown in Figure 1.
Similar binding energy peaks are aligned to suggest band assignments. The lowest ionization energies of
the three pyrimidine nucleosides are equal within experimental error (± 0.1 eV). Error in peak centers
above 9 eV is larger due to distortion of peak shapes due to water displacement (see text).
H2PO41-
HPO42-
UMP2-
CMP2-
AMP2-
GMP2-
8.0 7.9 7.6 7.3
9.5 8.9 9.1 8.9 9.1 8.9
9.9 9.8 9.8 9.7
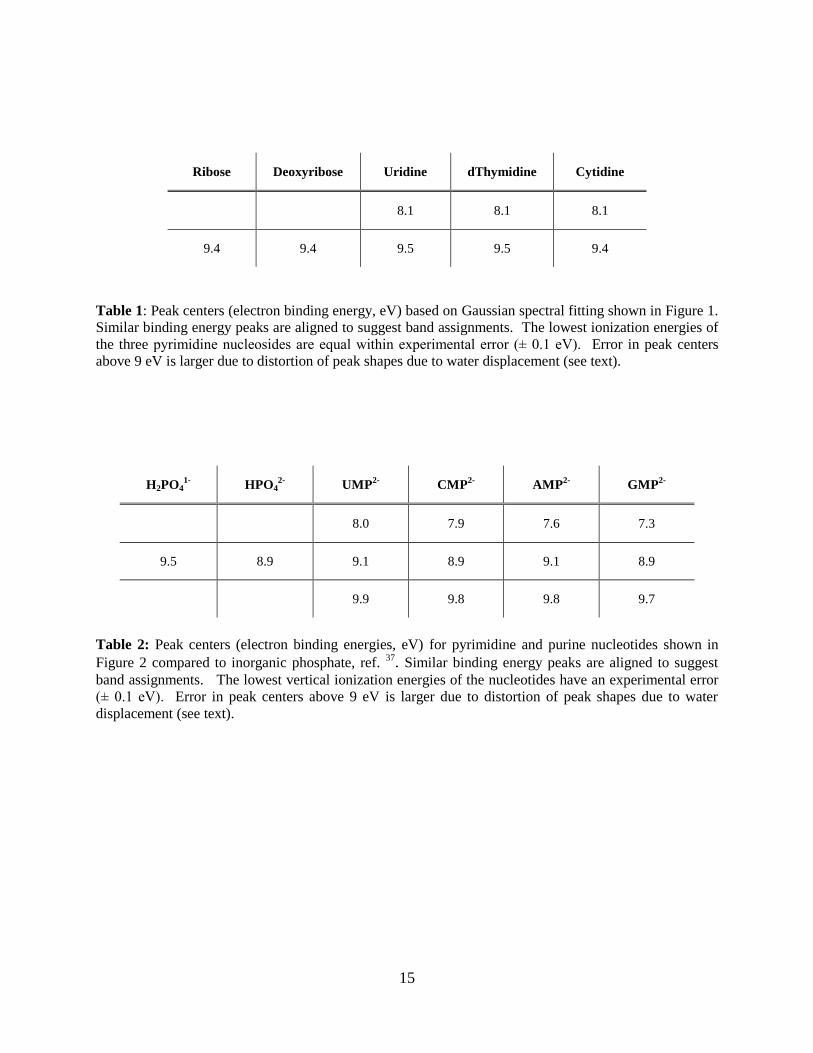
Table 2: Peak centers (electron binding energies, eV) for pyrimidine and purine nucleotides shown in
Figure 2 compared to inorganic phosphate, ref. 37. Similar binding energy peaks are aligned to suggest
band assignments. The lowest vertical ionization energies of the nucleotides have an experimental error
(± 0.1 eV). Error in peak centers above 9 eV is larger due to distortion of peak shapes due to water
displacement (see text).
16
Biomolecule Theory Expt.
Ribose 9.2a 9.4
Deoxyribose 9.1a 9.4
H2PO41-
9.0a 9.5
c
HPO42-
7.2a 8.9
c
Thymine 7.9a -
dThymidine 7.8a 8.1
dTMP1-
: dTMP2-
7.7a : 7.7
a -
Uracil 8.1 -
Uridine 8.0 8.1
UMP1-
: UMP2-
8.0 : 7.9 - : 8.0
Cytosine 7.9a -
Cytidine 7.8a 8.1
CMP1-
: CMP2-
7.8a : 7.7
a - : 7.9
Adenine 7.7b -
Adenosine 7.7b -
AMP1-
: AMP
2- 7.7
b : 7.7 7.7 : 7.6
Guanine 7.3b -
Guanosine 7.4b -
GMP1-
: GMP2-
7.1b : 6.9 - : 7.3
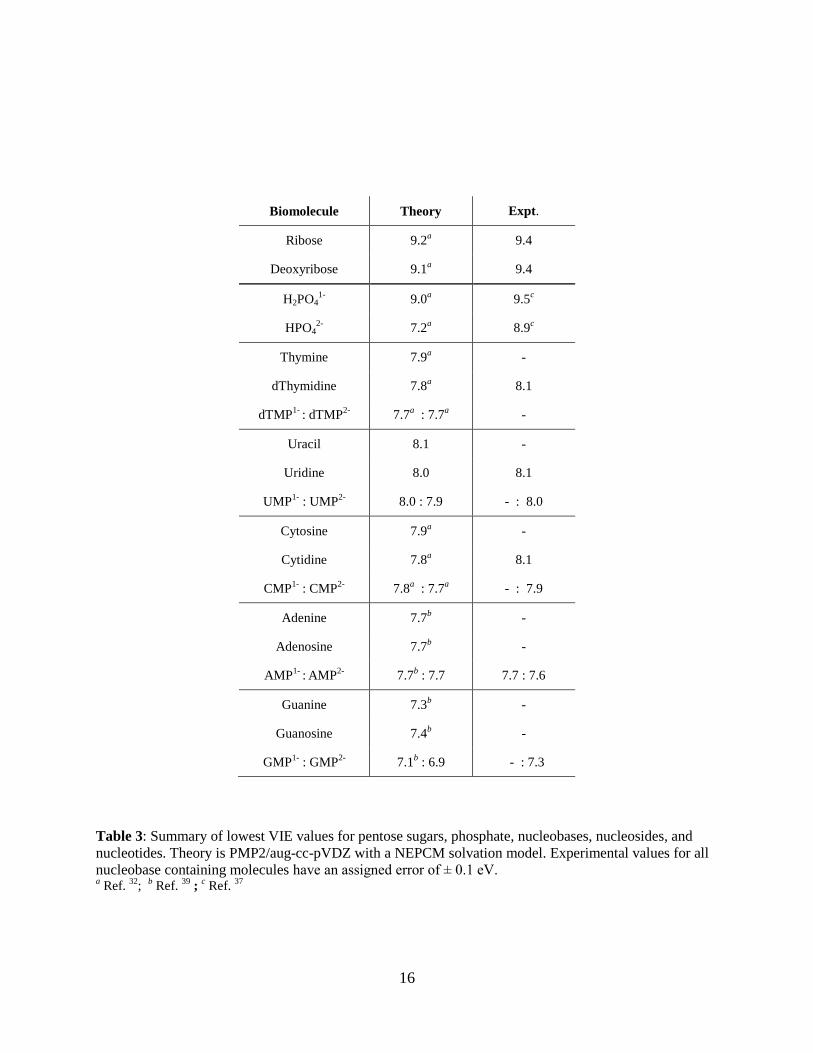
Table 3: Summary of lowest VIE values for pentose sugars, phosphate, nucleobases, nucleosides, and
nucleotides. Theory is PMP2/aug-cc-pVDZ with a NEPCM solvation model. Experimental values for all
nucleobase containing molecules have an assigned error of ± 0.1 eV. a Ref.
32;
b Ref.
39 ;
c Ref.
37
17
Nucleoside
(Nucleotide)
Exp.
VIEa
λout λin λtotal
E0(N
•+/ N)
from PES
vs. SHE
E0(N
•+/N)
literature
vs. SHEb,c
E7
vs. SHE
dThymidine
(dTMP)
8.1
7.7*
1.1
(1.0)
0.34
(0.53)
1.4
(1.6)
2.4
(1.9*)
2.11d, 1.90
g
(1.65h)
~ 1.7e
(1.45f, 1.63
l)
Uridine
(UMP)
8.1
8.0
1.1
(1.1)
0.21
(0.22)
1.3
(1.3)
2.5
(2.4)
≥ 2.39d
( - ) -
Cytidine
(CMP)
8.1
7.9
1.1
(1.1)
0.32
(0.6)
1.5
(1.7)
2.4
(1.9)
2.14d,1.78
g
(1.68h)
~ 1.6e
(1.5f, 1.68
l)
Adenosine
(AMP)
7.7*
7.6
1.1
(1.1)
0.27
(0.25)
1.4
(1.4)
2.1*
(2.0)
1.96d, 1.61
g
(1.59h)
1.44i
(1.42f, 1.41
l)
Guanosine
(GMP)
7.4*
7.3
1.1
(1.1)
0.44
(0.45)
1.5
(1.5)
1.6*
(1.5)
1.49d, 1.47
j
(1.49h)
1.29k
(1.31f, 1.11
l)
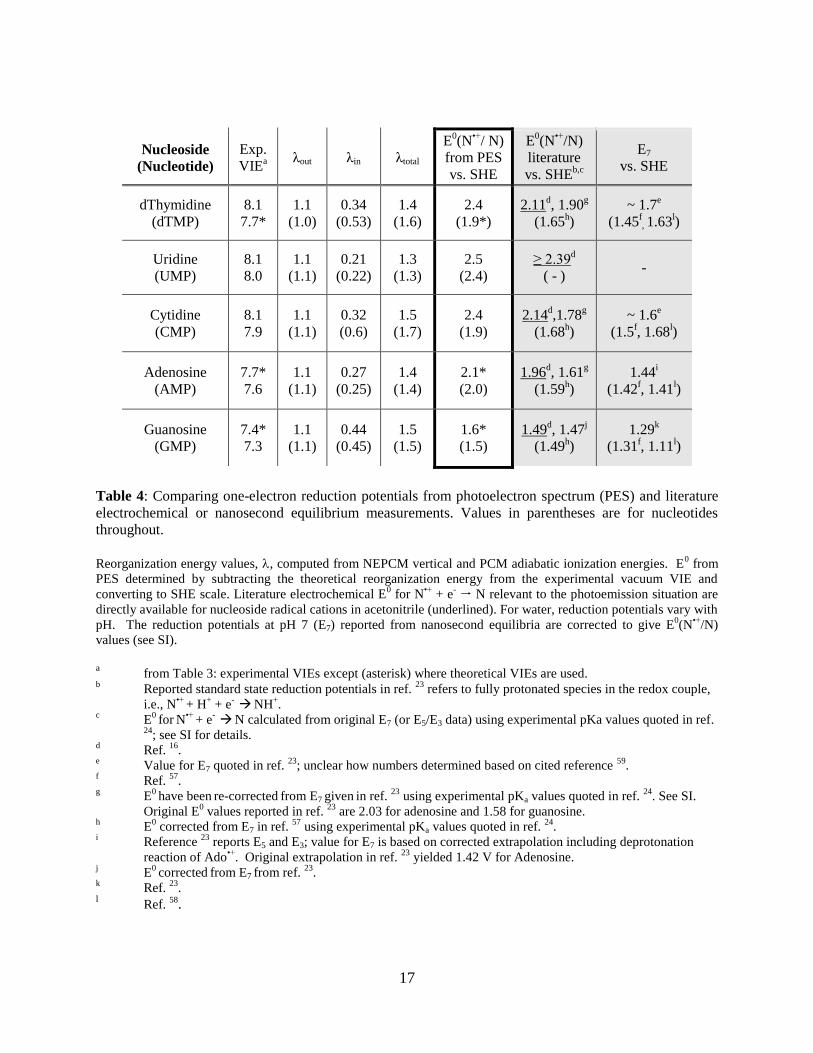
Table 4: Comparing one-electron reduction potentials from photoelectron spectrum (PES) and literature
electrochemical or nanosecond equilibrium measurements. Values in parentheses are for nucleotides
throughout.
Reorganization energy values, , computed from NEPCM vertical and PCM adiabatic ionization energies. E
0 from
PES determined by subtracting the theoretical reorganization energy from the experimental vacuum VIE and
converting to SHE scale. Literature electrochemical E0 for N
•+ + e
- N relevant to the photoemission situation are
directly available for nucleoside radical cations in acetonitrile (underlined). For water, reduction potentials vary with
pH. The reduction potentials at pH 7 (E7) reported from nanosecond equilibria are corrected to give E0(N
•+/N)
values (see SI).
a from Table 3: experimental VIEs except (asterisk) where theoretical VIEs are used.
b Reported standard state reduction potentials in ref.
23 refers to fully protonated species in the redox couple,
i.e., N•+
+ H+ + e
-
NH
+.
c E
0 for
N
•+ + e
-
N calculated from original E7 (or E5/E3 data) using experimental pKa values quoted in ref.
24; see SI for details.
d Ref.
16.
e Value for E7 quoted in ref.
23; unclear how numbers determined based on cited reference
59.
f Ref.
57.
g E
0 have been
re-corrected
from E7 given in ref.
23 using experimental pKa values quoted in ref.
24. See SI.
Original E0 values reported in ref.
23 are 2.03 for adenosine and 1.58 for guanosine.
h E
0 corrected from E7 in ref.
57 using experimental pKa values quoted in ref.
24.
i Reference
23 reports E5 and E3; value for E7 is based on corrected extrapolation including deprotonation
reaction of Ado•+
. Original extrapolation in ref. 23
yielded 1.42 V for Adenosine. j
E0 corrected
from E7 from ref.
23.
k Ref.
23.
l Ref.
58.
18
References
(1) Lehnert, S. Biomolecular Action of Ionizing Radiation (Series in Medical Physics and
Biomedical Engineering); 1st ed.; Taylor & Francis: Boca Raton, FL, 2007.
(2) Morgan, W. F. Radiation Research 2003, 159, 581.
(3) Sutherland, B. M.; Bennett, P. V.; Sidorkina, O.; Laval, J. Biochemistry 2000, 39, 8026.
(4) Lomax, M. E.; Gulston, M. K.; O'Neill, P. Radiat Prot Dosim 2002, 99, 63.
(5) O'Neill, M. A.; Barton, J. K. Topics in Current Chemistry 2004, 236, 67.
(6) Kawai, K.; Majima, T. Acc. Chem. Res. 2013, 46, 2616.
(7) Thazhathveetil, A. K.; Trifonov, A.; Wasielewski, M. R.; Lewis, F. D. J. Am. Chem. Soc. 2011,
133, 11485.
(8) Grozema, F. C.; Tonzani, S.; Berlin, Y. A.; Schatz, G. C.; Siebbeles, L. D. A.; Ratner, M. A. J.
Am. Chem. Soc. 2009, 131, 14204.
(9) Marcus, R. A.; Sutin, N. Biochim. Biophys. Acta 1985, 811, 265.
(10) Wang, X.-B.; Wang, L.-S. J Chem Phys 2000, 112, 6959.
(11) Bucher, D. B.; Pilles, B. M.; Carell, T.; Zinth, W. Proc Natl Acad Sci U S A 2014, 111, 4369.
(12) Takaya, T.; Su, C.; La Harpe, de, K.; Crespo-Hernandez, C. E.; Kohler, B. Proc. Nat. Acad. Sci.
2008, 105, 10285.
(13) Zhang, Y.; Dood, J.; Beckstead, A. A.; Li, X.-B.; Nguyen, K. V.; Burrows, C. J.; Improta, R.;
Kohler, B. Proc. Nat. Acad. Sci. 2014, 111, 11612.
(14) Shapir, E.; Sagiv, L.; Molotsky, T.; Kotlyar, A. B.; Felice, R. D.; Porath, D. J Phys Chem C
2010, 114, 22079.
(15) Porath, D.; Bezryadin, A.; de Vries, S.; Dekker, C. Nature 2000, 403, 635.
(16) Seidel, C. A.; Schulz, A.; Sauer, M. H. J Phys Chem 1996, 100, 5541.
(17) Crespo-Hernández, C. E.; Close, D. M.; Gorb, L.; Leszczynski, J. J Phys Chem B 2007, 111,
5386.
(18) Steenken, S. Chem. Rev. 1989, 89, 503.
(19) Yao, T.; Wasa, T.; Musha, S. Bull. Chem. Soc. Jpn. 1977, 50, 2917.
(20) Fiebig, T.; Wan, C.; Zewail, A. H. ChemPhysChem 2002, 3, 781.
(21) Heinze, J. Angew. Chem. Int. Ed. 1984, 23, 831.
(22) Gonzalo Guirado; Cavan N Fleming; Thor G Lingenfelter; Michelle L Williams; Han Zuilhof,
A.; Dinnocenzo, J. P. J. Am. Chem. Soc. 2004, 126, 14086.
(23) Steenken, S.; Jovanovic, S. V. J. Am. Chem. Soc. 1997, 119, 617.
(24) Psciuk, B. T.; Lord, R. L.; Munk, B. H.; Schlegel, H. B. J. Chem. Theory Comput. 2012, 8, 5107.
(25) Sugiyama, H.; Saito, I. J. Am. Chem. Soc. 1996, 118, 7063.
(26) Bravaya, K. B.; Kostko, O.; Ahmed, M.; Krylov, A. I. Phys Chem Chem Phys 2010, 12, 2292.
(27) Cauët, E.; Valiev, M.; Weare, J. H. J Phys Chem B 2010, 114, 5886.
(28) Pluhařová, E.; Schroeder, C.; Seidel, R.; Bradforth, S. E.; Winter, B.; Faubel, M.; Slavíček, P.;
Jungwirth, P. J. Phys. Chem. Lett. 2013, 4, 3766.
(29) Trofimov, AB; Schirmer, J.; Kobychev, V. B.; Potts, A. W.; Holland, D.; Karlsson, L. J Phys B
2005, 39, 305.
(30) Kim, N. S.; LeBreton, P. R. J. Am. Chem. Soc. 1996, 118, 3694.
(31) Yang, X.; Wang, X.-B.; Vorpagel, E. R.; Wang, L.-S. Proc. Nat. Soc. USA 2004, 101, 17588.
(32) Slavíček, P.; Winter, B.; Faubel, M.; Bradforth, S. E.; Jungwirth, P. J. Am. Chem. Soc. 2009,
131, 6460.
(33) Chatterley, A. S.; Johns, A. S.; Stavros, V. G.; Verlet, J. R. R. J Phys Chem A 2013, 117, 5299.
(34) Faubel, M.; Schlemmer, S.; Toennies, J. P. Z Phys D 1988, 10, 269.
(35) Wilson, K. R.; Rude, B. S.; Smith, J.; Cappa, C.; Co, D. T.; Schaller, R. D.; Larsson, M.;
Catalano, T.; Saykally, R. J. Rev. Sci. Instrum. 2004, 75, 725.
(36) Winter, B.; Faubel, M. Chem. Rev. 2006, 106, 1176.
(37) Pluhařová, E.; Ončák, M.; Seidel, R.; Schroeder, C.; Schroeder, W.; Winter, B.; Bradforth, S. E.;
19
Jungwirth, P.; Slavíček, P. J Phys Chem B 2012, 116, 13254.
(38) Winter, B.; Weber, R.; Hertel, I. V.; Faubel, M.; Jungwirth, P.; Brown, E. C.; Bradforth, S. E. J.
Am. Chem. Soc. 2005, 127, 7203.
(39) Pluhařová, E.; Jungwirth, P.; Bradforth, S. E.; Slavíček, P. J Phys Chem B 2011, 115, 1294.
(40) Frisch, M. J.; Trucks, G. W.; Schlegel, H. B.; Scuseria, G. E.; Robb, M. A.; Cheeseman, J. R.;
Montgomery, J. A., Jr; Vreven, T.; Kudin, K. N.; Burant, J. C.; Millam, J. M.; Iyengar, S. S.;
Tomasi, J.; Barone, V.; Mennucci, B.; Cossi, M.; Scalmani, G.; Rega, N.; Petersson, G. A.;
Nakatsuji, H.; Hada, M.; Ehara, M.; Toyota, K.; Fukuda, R.; Hasegawa, J.; Ishida, M.;
Nakajima, T.; Honda, Y.; Kitao, O.; Nakai, H.; Klene, M.; Li, X.; Knox, J. E.; Hratchian, H. P.;
Cross, J. B.; Bakken, V.; Adamo, C.; Jaramillo, J.; Gomperts, R.; Stratmann, R. E.; Yazyev, O.;
Austin, A. J.; Cammi, R.; Pomelli, C.; Ochterski, J. W.; Ayala, P. Y.; Morokuma, K.; Voth, G.
A.; Salvador, P.; Dannenberg, J. J.; Zakrzewski, V. G.; Dapprich, S.; Daniels, A. D.; Strain, M.
C.; Farkas, O.; Malick, D. K.; Rabuck, A. D.; Raghavachari, K.; Foresman, J. B.; Ortiz, J. V.;
Cui, Q.; Baboul, A. G.; Clifford, S.; Cioslowski, J.; Stefanov, B. B.; Liu, G.; Liashenko, A.;
Piskorz, P.; Komaromi, I.; Martin, R. L.; Fox, D. J.; Keith, T.; Al-Laham, M. A.; Peng, C. Y.;
Nanayakkara, A.; Challacombe, M.; Gill, P. M. W.; Johnson, B.; Chen, W.; Wong, M. W.;
Gonzalez, C.; Pople, J. A. Gaussian 03, Revision E.01.
(41) Thermodynamics Data for Biochemistry and Biotechnology; Hinz, H.-J., Ed.; 1st ed.; Springer-
Verlag: Berlin, 1986.
(42) Buchner, F.; Ritze, H.-H.; Lahl, J.; Lübcke, A. Phys Chem Chem Phys 2013, 15, 11402.
(43) Yalkowsky, S. H. Handbook of Aqueous Solubility Data; 1st ed.; CRC Press, 2003.
(44) Lide, D. R. CRC handbook of chemistry and physics; 81st ed.; CRC Press: Boca Raton, FL,
2000.
(45) Neurohr, K. J.; Mantsch, H. H. Can. J. Chem 1979, 57, 1986.
(46) Jagoda-Cwiklik, B.; Slavíček, P.; Cwiklik, L.; Nolting, D.; Winter, B.; Jungwirth, P. J Phys
Chem A 2008, 112, 3499.
(47) Ghosh, D.; Roy, A.; Seidel, R.; Winter, B.; Bradforth, S. E.; Krylov, A. I. J Phys Chem B 2012,
116, 7269.
(48) Marcus, R. A. J Chem Phys 1965, 43, 679.
(49) Seidel, R.; Faubel, M.; Winter, B.; Blumberger, J. J. Am. Chem. Soc. 2009, 131, 16127.
(50) Blumberger, J. Phys Chem Chem Phys 2008, 10, 5651.
(51) Tateyama, Y.; Blumberger, J.; Sprik, M.; Tavernelli, I. J Chem Phys 2005, 122, 234505.
(52) Ghosh, D.; Isayev, O.; Slipchenko, L. V.; Krylov, A. I. J Phys Chem A 2011, 115, 6028.
(53) Seidel, R.; Thürmer, S. S.; Moens, J. J.; Geerlings, P. P.; Blumberger, J. J.; Winter, B. B. J Phys
Chem B 2011, 115, 11671.
(54) Truhlar, D. G.; Cramer, C. J.; Lewis, A.; Bumpus, J. A. J. Chem. Ed. 2007, 84, 934.
(55) Donald, W. A.; Williams, E. R. Pure Appl. Chem 2011, 83, 2129.
(56) Thapa, B.; Schlegel, H. B. J Phys Chem A 2014, 141020121315006.
(57) Fukuzumi, S.; Miyao, H.; Ohkubo, K.; Suenobu, T. J Phys Chem A 2005, 109, 3285.
(58) Oliveira-Brett, A. M.; Piedade, J. A. P.; Silva, L. A.; Diculescu, V. C. Anal Biochem 2004, 332,
321.
(59) Jovanovic, S. V.; Simic, M. G. J Phys Chem 1986, 90, 974.

20
Figure Captions:
Figure 1: Differential spectra (black circles) and fits (overall fit: blue, individual Gaussians: red)
for sugars, pyrimidine nucleosides and nucleotides. (a) 0.4 M deoxythymidine, pH 7.5, black
dotted grey-shaded Gaussian: lowest binding energy peak fit with constrained FWHM of 0.62 eV
(see text). (b) 1 M uridine, pH 7.1 (c) 0.7 M cytidine, pH 7.4 (d) 1 M D(-)ribose, pH 5.3 and 1
M deoxy-D(-)ribose, pH 5.5 (e) 0.9 M UMP2-
, pH 8.0 (f) 0.7 CMP2-
, pH 8.0.
Figure 2: Purine nucleotide valence band photoelectron spectra (symbols) with Gaussian fits
(overall fit: blue, individual peaks: red) (a) 1M AMP2-
, pH 8.4 (b) 1M GMP2-
, pH 8.1. Purine
nucleotides show a significantly lower IE in the lowest electron binding energy band, with the
first VIE of GMP2-
shifted to lower binding energy compared to AMP2-
.
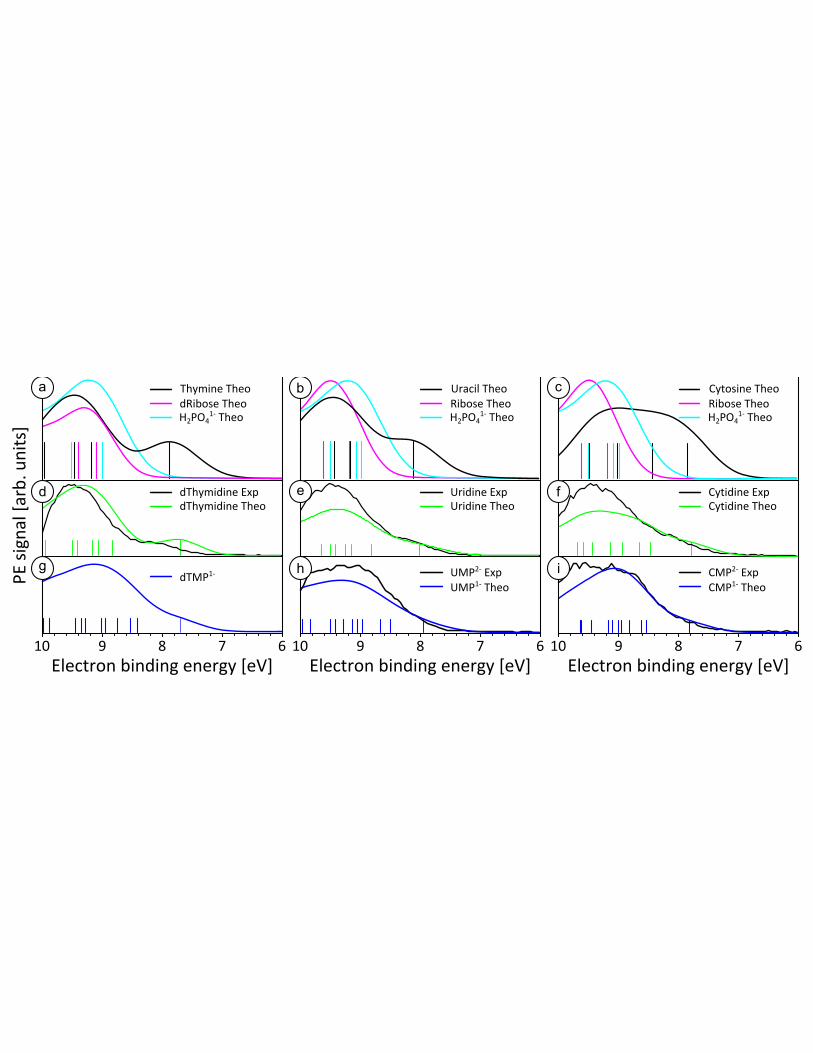
Figure 3: Decomposing the experimental and computed theoretical spectra for the pyrimidine
nucleotides. Computed spectra for nucleobases (black), pentose sugars (magenta) and singly
charged phosphate (cyan) shown in the top row (a-c). Comparison of experimental (black) and
theoretical (green) spectra for nucleosides can be seen in panels (d-f). Finally, experimental
(black) and theoretical (blue) spectra for nucleotides are shown (g-i). For theory, singly charged
nucleotides, as well as H2PO41-
are displayed due to complications that arise in the PCM
treatment of doubly charged species (see text).
Figure 4: Decomposing the experimental and computed spectra for the purines. Computed
spectra for nucleobases (black), pentose sugars (magenta) and singly charged phosphate (cyan)
(a-b). H2PO41-
is shown instead of HPO42-
(see text). Panels (c-d) display (green) computed and
stick spectra for purine nucleosides. No corresponding experimental data could be obtained due
to solubility constraints. Experimental (red) and theoretical (blue) spectra of the purine
nucleotide AMP1-
are seen in (e) and display very good agreement in lowest energy peak
position and overall shape. Panel (f) shows a comparison of the experimental spectrum for
GMP2-
(red) to the theoretical spectrum for GMP1-
(blue). The inset panel provides a magnified
view and includes the theoretical spectrum for GMP2-
(black). When comparing black and blue
curves, it becomes apparent that there is an overestimation of the number of predicted ionization
transitions for GMP2-
as compared to GMP1-
.

21
For Table of Contents Only
�
��
����������
����
���������
�� � � � �
�����
����
����
�����
��
���!���������������������"
#������
�� � � � ����!���������������������"
#$�%& �
��
'$�%&
'�������
�� � � � ����!���������������������"
�
�
�
�
�
�
�
�
�
�����
������ ������������ �
�
�����
�� � � � ��� � � � �� ����������������� � �����������������
� �
����
�������������� ����������
������
������������� ����������
������
������������������������
��������������������
����� ������������������
������������������
�
����������������������
��� ���������� ����������
������
��� � �
���!�
��"�#
��� $
������������� ����� ��!�%$ ������������� ����� ��!�%$ ������������� ����� ��!�%$�& ' ( ) * �& ' ( ) * �& ' ( ) *
�
�
� �
�
� �
�

���
��
����������������
���� �������
���������� �������
��
�� � � � �
�����
����
� �!�
"�#��
$�%
���&$! �������������!�'� �(%�� � � � �
)�������
)�������
)#�� �������
)#�������� �������
��
���
�������
�
�
� �
�
�
���&$! �������������!�'� �(%