oxidation kinetics of manganese cobaltite spinel protection layers on sanergy ht for solid oxide...
TRANSCRIPT

Oxidation Kinetics of Manganese Cobaltite SpinelProtection Layers on Sanergy HT for Solid Oxide FuelCell Interconnect Applications
Estefania Alvarez* and Alan Meier
Inamori School of Engineering at Alfred University, Alfred, New York 14802
K. Scott Weil and Zhenguo Yang
Pacific Northwest National Lab, Richland, Washington 99352
Chromia forming ferritic stainless steels (SS) exhibit many desirable qualities for intermediate temperature solid oxide fuelcell interconnect applications. However, with these alloys, there is a need to prevent chromia volatilization and the associatedchromium poisoning at the cathode–electrolyte interface, while ensuring low interfacial electrical resistance with the cellelectrodes; a need that has generated renewed interest in the development of oxidation resistant, electrically conductive coat-ings. In the present study, screen printed (Mn,Co)3O4 coatings were applied to a newly developed ferritic SS alloy, SanergyHT(Cr—21.9%, Ni—0.5%, Mo—0.88%, Nb—0.60%, and Si—0.05%). The oxidation behavior of both the coated alloyand the bare alloy were evaluated at 8001C in air for exposures times up to 1500 h. The oxidation kinetics, investigated usingweight gain and scale thickness measurements, exhibited parabolic behavior for the bare alloy. The oxidation behavior of thecoated material could not be explained by a single parabolic mechanism. The calculated parabolic thickening rate constantswere compared with published data on other ferritic SS alloy compositions.
Introduction
Several ferritic stainless-steel (SS) alloys are cur-rently being evaluated and/or used as interconnect ma-terials for solid oxide fuel cell (SOFC) stacks operating
Int. J. Appl. Ceram. Technol., 8 [1] 33–41 (2011)DOI:10.1111/j.1744-7402.2009.02421.x
Ceramic Product Development and Commercialization
The authors acknowledge NYSTAR for the funding through Center for Advanced Ceramic
Technology (CACT) by a NYSTAR contract # C030093 CDP grant.
r 2009 The American Ceramic Society

at intermediate temperatures of 6501–8001C. These in-clude the alloys listed in Table I. The primary charac-teristics or properties that an alloy must display for thisapplication are: (1) a coefficient of thermal expansion(CTE) that closely matches that of the adjacent ceramiccell, (2) a high oxidation resistance, (3) a low area spe-cific resistance, and (4) good thermomechanical reliabil-ity. Extensive work has been conducted in an effort torelate the kinetics of oxidation and scale growth to theinterfacial electrical resistance for these alloys.1–4 Theformation of an oxide scale is inevitable at high tem-perature and beneficially provides a protective layer thatinhibits further oxidation of the parent metal (Fe–Cr).However, the chromia (Cr2O3) layer that typicallyforms undergoes volatilization, particularly in the hu-mid environment on the cathode side of the cell. Thischromia volatilization degrades the cell/stack perfor-mance by poisoning the cathode/electrolyte interfacedue to an electrochemical plating reaction.1–3 Of thealloys listed in Table I, the most promising long-terminterconnect candidate is Crofer 22 APU because of itsunique scale microstructure, which consists of a(Mn,Cr)3O4 top layer and a chromia sub-layer bothof which are electrically conductive at a typical stackoperating temperature (8001C).1–3 However, there aresome processing issues with Crofer 22 APU that arecurrently being examined.
With respect to the materials systems that havebeen researched previously, this study considered twoapproaches to improve the oxidation resistance and theinterfacial electrical conductivity: the use of a newly de-veloped alloy and the use of a protective coating. One ofthe main goals was to evaluate the oxidation behavior ofa new alloy developed by Sandvik Technologies. Thisalloy contains minor alloying additions of Nb and Mothat provide a means of solid solution hardening that isretained at moderately high temperatures. In addition,both elements are effective carbide formers (offering the
potential for precipitation strengthening) and both canbe used to adjust the alloy CTE to more closely matchthat of the ceramic cell materials. Nb has also been re-ported to be an ‘enhancing’ component that increasesthe growth rate of the protective scale.4,10,11 It has alsobeen reported that additions of Nb and Mo can lead tothe formation of a Laves phase, an intermetallic com-pound of the A2B type (Fe2Nb), known for its hightemperature strength and strong scale adhesion.11,12 Inaddition to trying to reduce the cost of the alloy itself,Sandvik has put an emphasis on reducing the processingcost by changing the heat treating process and avoidinga vacuum refining step. In recent years, the SOFC re-search community has emphasized understanding theeffects of elemental additions on the composition, sta-bility, thickness, and density of the oxide scale thatforms on these types of alloys at high temperature, par-ticularly understanding the role of ion diffusion alongthe grain boundaries within the scale.13 Another poten-tially important alloying addition in this newly devel-oped alloy is silicon, which is known to mitigatecarburization in H2-rich, high-temperature environ-ments. However, the value of Si in interconnect appli-cations may also be deleterious because of the potentialto form an electrically insulating SiO2 layer along themetal/scale interface, which would increase the ohmicresistance in the interconnect.5,14 It has been reportedthat small additions of Si compensate the enhanced ox-idation behavior of Nb-alloyed ferritic SS, leading to amore stable, well-adhered scale.12 From previous stud-ies, at concentrations below 0.25 wt%, Si will be re-tained in the Laves phase and therefore is notdetrimental to electrical conductivity.11,12 Based onthe chemistries given in Table I, Sanergy HT could fol-low this behavior.
This study also considers another approach to in-crease the oxidation resistance, the use of a manganesecobaltite coating. This is a dual phase material, which
Table I. Compositions for Potential Solid Oxide Fuel Cell Interconnects Ferritic Stainless–Steels (SS)1,5–7
Weight percent (wt%) Cr Mn Si C Ti P S La Ni Mo Nb Fe Y2O3
Crofer22 APU 22 0.45 — 0.005 0.08 0.016 0.002 0.06 — — — Bal.E-Brite 27 0.01 0.025 0.001 — 0.02 0.02 — — — — Bal.430 SS 17 1.0 1.0 0.12 — 0.04 0.03 — — — — Bal.Sanergy HT 21.9 o1%� 0.05 0.025 — — — — 0.5 0.88 0.60 Bal.Ducrolloy (Plansee) 95 — — — — — — — — — — 5 1�From SS manufacturing process.8,9.
34 International Journal of Applied Ceramic Technology—Alvarez, et al. Vol. 8, No. 1, 2011
consists of a tetragonal CoMn2O4 and a cubicMnCo2O4 spinel. This surface coating inhibits thechromium volatilization and decreases the contact resis-tance between the cathode and the interconnect. It alsoplays a key role as a mass transport barrier that inhibitsthe scale growth on ferritic SS. Long-term exposuretesting has demonstrated both improved alloy stabilityand improved electrochemical performance relative tobare SS substrates.2,15,16
Typical high-temperature oxidation processes arecontrolled by solid-state diffusion through the oxide layer.Solid-state diffusion-controlled mechanisms include lat-tice diffusion, grain boundary diffusion, and short circuitdiffusion.17 All of these diffusion mechanisms result in aparabolic thickening rate due to the increase in thediffusion distance with time. The increase in the weightof the sample (which is proportional to the increase inthickness of the oxide scale) can be described by anequation of the form as follows:
dw2 ¼ kpt þ c ð1Þ
where dw2 is the weight gain squared, kp is the parabolicfit constant (units of weight2 surface/area2/time), t is thetime at temperature, and c is a constant that accounts forscale present before the isothermal exposure. A similarequation can be derived for the scale thickness as afunction of time with a proportional kp value using thescale thickness squared.
There is also the possibility of interface controlledoxide formation kinetics resulting in a linear thickeningrate and weight gain. This type of mechanism follows:
dw ¼ kLt þ c ð2Þ
where kL is the linear rate constant (units of weightsurface area/time). An example of an interfacial-con-trolled mechanism is steady state adsorption. The anal-ysis of the oxidation kinetics and the determinationof the oxidation mechanism can be complicated bymicrostructural changes that result in a mixed mech-anism or a transition between mechanisms with time.According to Kofstad,17 at high temperatures a com-bination of parabolic and linear oxidation is frequentlyencountered.
Experimental Procedure
The ferritic SS used in this study, Sanergy HT,has the chemical composition described in Table I.
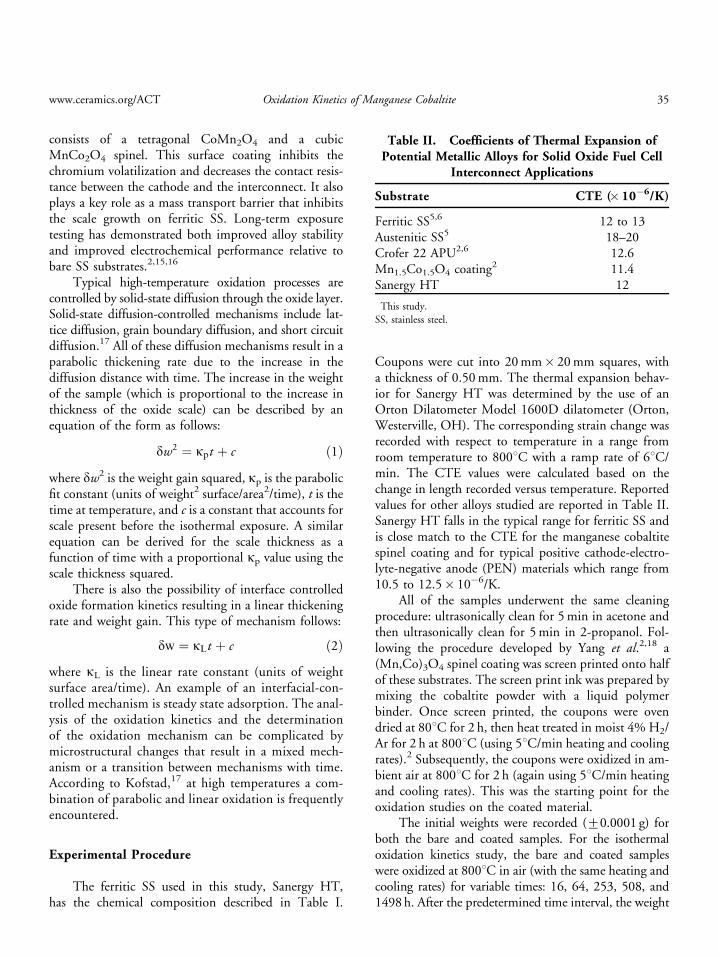
Coupons were cut into 20 mm� 20 mm squares, witha thickness of 0.50 mm. The thermal expansion behav-ior for Sanergy HT was determined by the use of anOrton Dilatometer Model 1600D dilatometer (Orton,Westerville, OH). The corresponding strain change wasrecorded with respect to temperature in a range fromroom temperature to 8001C with a ramp rate of 61C/min. The CTE values were calculated based on thechange in length recorded versus temperature. Reportedvalues for other alloys studied are reported in Table II.Sanergy HT falls in the typical range for ferritic SS andis close match to the CTE for the manganese cobaltitespinel coating and for typical positive cathode-electro-lyte-negative anode (PEN) materials which range from10.5 to 12.5� 10�6/K.
All of the samples underwent the same cleaningprocedure: ultrasonically clean for 5 min in acetone andthen ultrasonically clean for 5 min in 2-propanol. Fol-lowing the procedure developed by Yang et al.2,18 a(Mn,Co)3O4 spinel coating was screen printed onto halfof these substrates. The screen print ink was prepared bymixing the cobaltite powder with a liquid polymerbinder. Once screen printed, the coupons were ovendried at 801C for 2 h, then heat treated in moist 4% H2/Ar for 2 h at 8001C (using 51C/min heating and coolingrates).2 Subsequently, the coupons were oxidized in am-bient air at 8001C for 2 h (again using 51C/min heatingand cooling rates). This was the starting point for theoxidation studies on the coated material.
The initial weights were recorded (70.0001 g) forboth the bare and coated samples. For the isothermaloxidation kinetics study, the bare and coated sampleswere oxidized at 8001C in air (with the same heating andcooling rates) for variable times: 16, 64, 253, 508, and1498 h. After the predetermined time interval, the weight
Table II. Coefficients of Thermal Expansion ofPotential Metallic Alloys for Solid Oxide Fuel Cell
Interconnect Applications
Substrate CTE (� 10�6/K)
Ferritic SS5,6 12 to 13Austenitic SS5 18–20Crofer 22 APU2,6 12.6Mn1.5Co1.5O4 coating2 11.4Sanergy HT� 12�This study.SS, stainless steel.
www.ceramics.org/ACT Oxidation Kinetics of Manganese Cobaltite 35

of each sample was measured and recorded. Three to fivespecimens were prepared for each test condition.
X-ray diffraction (XRD) analysis of the bare andcoated coupons was performed using a Siemens D-500X-ray Generator (Siemens, Munich, Germany) withCuKa radiation for proper phase identification and toverify the successful formation of the spinel phase on thecoated samples. It was also used to track the scale for-mation for the bare alloys. In order to characterize thescale formation and the coating performance, scanningelectron microscopic (SEM) analysis of mounted crosssections for both bare and coated samples were analyzedusing a Phillips 515 SEM (Phillips, Eindhoven, TheNetherlands) at 20 keV. The thickness of the scale wasmeasured using the SEM, randomly choosing positionsalong the interface and obtaining a minimum of 15measurements per sample. A more detailed descriptionof the sample preparation and analysis is given else-where.18
Electron probe microanalysis (EPMA) in wave-length dispersive X-ray spectroscopy (WDS) mode wasused for the chemical characterization of internal prod-ucts observed in the cross-sectional analysis. EMPA wasperformed using a JEOL JXA-8200 WD/ED Com-bined Microanalyzer (JEOL, Tokyo, Japan) equippedwith JEOL analysis software. The WDS analysis wasperformed using an accelerating potential of 8 keV and aconstant current of 2� 10�8 A.
Results and Discussion
A typical coating and steel substrate microstructureimmediately after reduction in moist 4%H2/Ar is shown
in Fig. 1A. Note that there is some porosity in the coatingsimilar to results obtained for work on other substrates.2
The subsequent oxidation step densified and sintered thecoating with the spinel stoichiometry in an oxygen-richatmosphere (Fig. 1B). This study successfully reproducedthe desired coating microstructure.2,15 The final thick-ness of the coating was approximately 10mm.
Oxidation of Bare and Coated Sanergy HT
The measured weight gain versus time for both bareand spinel coated substrates is given in Fig. 2. Theweight gain is presented as average values for three tofive specimens per condition, as the results for duplicatespecimens were in good agreement. The error bars rep-resent 1 SD of the mean for the average of the sample
Fig. 1. Typical cross sections of spinel layers on Sanergy HT: (A) after heat treatment at 8001C for 2 h in flowing moist 4%H2/Ar, and (B)after oxidation at 8001C for 2 h in air (SEM–SE mode).
Fig. 2. Average weight gain (dw, g/cm2) as a function of time forbare and spinel-coated Sanergy HT for exposure in air at 8001C.
36 International Journal of Applied Ceramic Technology—Alvarez, et al. Vol. 8, No. 1, 2011

weights at each condition. For both sets of samples,there is no linear relationship between weight gain andtime. In order to evaluate whether the weight gain fol-lows a classical parabolic trend, the weight gain squaredversus time curves are plotted in Fig. 3. The bare alloyexhibits parabolic behavior with a parabolic rate con-stant, kp, of 3� 10�14 g2/cm4/s and with a correlationcoefficient, R2 of 0.9918. This kp value is comparable tothe value obtained for E-Brite (see the kp values given inTable III). In addition, the bare Sanergy HT exhibitshigher oxidation resistance, and a lower weight gainthan Crofer22 APU. This supports the argument thatthis newly developed alloy has oxidation behaviorsimilar to E-brite. This study also indicates that theoxidation rate of Sanergy HT is almost an order ofmagnitude o430 SS.
The analysis of the oxidation behavior of the coatedSanergy HT samples was not as conclusive. By visualinspection of Fig. 3, there is a deviation from ideal par-abolic behavior at approximately 253 h (B1� 106 s).Therefore, this system was analyzed assuming a morecomplex oxidation kinetics and the data were fit in se-lected regions to either a parabolic or a linear fit in orderto better understand this possible transition.
Considering the possible parabolic or linear mech-anisms (Equations 1 and 2), the data were fit accord-ingly and the results of the analysis are given in TableIV. Another possible mechanism is a transition follow-ing a parabolic to linear behavior. Based on Equations 1and 2, the best fit parabolic and linear curves were de-termined for the entire 1500 h exposure as well as sep-arately for the data below and above 253 h (1� 106 s)and 508 h (1.8� 106 s) in order to gain insight into thistransition. Table V summarizes the respective rate con-stants and their correlation coefficients. The parabolicrate for the spinel-coated Sanergy HT is 2� 10�14 g2/cm4/s. For the parabolic rate constants, all of them arelower than the bare Sanergy HT rate constant, indicat-ing that the spinel-coated alloy has much higher oxida-tion resistance. This is consistent with results obtainedfor other alloys.2 The parabolic rate constant for expo-sures up to 253 h is approximately one half of the con-stant for the entire exposure, even though both have anR2 40.95. The calculated constants have relatively goodcorrelation coefficients with R2 values 40.9, with theexception of the linear fit up to 253 h. Parabolic to lin-ear or parabolic to parabolic transitions both result ingood fits. Figure 4 provides an example of one of thepossible transitions: parabolic to linear behavior after
253 h. Further analysis to define this transition is needed.This analysis determined possible k constants; however, itis not possible to define a conclusion rate controllingmechanism for the coated alloy, considering the high cor-relation coefficients for several of the different possibilities.For example, the oxidation mechanism appears to followa parabolic behavior for both exposure times, 253 or508 h. However, by considering the data fitted up to508 h, the second oxidation mechanism is then definedand limited by three exposure data points, therefore itlimits the choice for a preferred mechanism as the datacan be fitted for both parabolic or linear behavior.
In addition to weight gain data, the scale thickeningrate was also measured as part of the oxidation kineticsanalysis. Figure 5 presents the measured scale thicknessfor bare and spinel-coated samples versus time. There isno evident linear relationship between scale thicknessand time. The error bars represent 1 SD of the mean forthe average scale thickness at each condition. Based onFig. 5, the smaller SD of the coated substrates indicates
Fig. 3. Squared weight gain versus time for bare and spinel-coated Sanergy HT substrates as function of time during oxidationin air at 8001C.
Table III. Parabolic Oxidation Rate Constants forFerritic Stainless-Steels (SS) at 8001C
Ferritic SS kp(� 10�14 g2/cm4/s) R2
Crofer22 APU 1 7.96E-brite 1 3.53430 SS 1 35Sanergy HT� 3 0.99�This study.
www.ceramics.org/ACT Oxidation Kinetics of Manganese Cobaltite 37

a more consistent and controlled scale growth behavior.The scale development curve for the bare alloy indicatesa nonlinear growth rate for the scale and indicates apossible parabolic thickening mechanism.
To evaluate if the scale thickness follows a parabolicrate, the squared scale thickness was plotted versus timefor both bare and spinel-coated substrates. The bareSanergy HT follows the same behavior for both weightgain as well as scale growth for up to 1000 h (Figs. 5 and6). The best fit is obtained for parabolic behavior with akp based on weight gain of 3� 10�14 g2/cm4/s withan R2 of 0.99, and 2� 10�14 cm4/s with an R2 of 0.83for scale thickness (based on the data plot of in Figs. 3and 6, respectively).
For the spinel-coated Sanergy HT, the scale growthdoes not follow the same transition as the weight gain.Considering that the best relative fit for up to the 1000 hfor the coated samples, the scale growth follows a par-abolic pattern. In addition, the lowest correlation co-efficient (R2 5 0.57) is obtained for the parabolic rateequation until 253 h, contradicting the high correlationcoefficient (R2 5 0.95) achieved for the measuredweight gain (from Table IV). The other curve fits con-sistently have R2 values 40.8. The rate constants areincluded in Fig. 6, with a kt for parabolic behavior of8� 10�15 cm4/s (R2 5 0.86). A much larger parabolicrate constant of 1� 10�14 cm4/s (with R2 5 0.57) is
obtained up to 253 h. The linear rate constant for thedata after 253 h displays the same order of magnitude asthe measured weight gain constant with a value of2� 10�11 cm2/s (and R2 5 0.90). If the assumption isthat the weight gain is only due to scale formation, thenthe scale thickness should follow a proportional weightgain pattern. However, while the scale thickness doesnot follow perfect parabolic behavior, it still follows thistrend within the experimental error of the data.
A similar analysis was performed to evaluate theweight gain based on scale thickness measurements. Theeffective weight gain was calculated from the scale thick-ening data using a previously developed analysis.8 TableV presents the calculated weight gain up to 1000 h. Thecalculated weight gain includes an adjustment for theaddition of oxygen in order to form the chrome oxidelayer. The data were fit following the same procedure asthe measured weight gain, and analyzed versus time inorder to obtain the respective parabolic and linear rateconstants. The calculated weight gain data also considersthe experimental error for the scale thickness measure-ments obtained using the SEM. Based on the effectiveweight gain for the bare Sanergy HT using the thicknessdata, kp is 5� 10�14 g2/cm4/s with an R2 of 0.83. Forthe coated alloy, there is a significant difference of ap-proximately 20% between the measured weight gainand the effective weight gain parabolic constants
Table V. Oxidation Rate Constants for Spinel-Coated Sanergy HT Based on Effective Weight Gain Calculatedfrom Scale Thickness Data
Exposure time at 8001C(h)
Parabolic fit Linear fit
jp (� 10�14 g2/cm4/s) R2 jL (� 10 �11 g/cm2/s) R2
0–1000 1.84 0.95 2.66 0.940–253 1.88 0.83 2.66 0.74253–1000 1.67 0.91 2.42 0.90
Table IV. Oxidation Rate Weight Gain Constants for Spinel-Coated Sanergy HT
Parabolic fit Linear fit
Exposure time at 8001C (h) jp (� 10�14 g2/cm4/s) R2 jL (� 10�11 g/cm2/s) R2
0–1500 2.29 0.96 7.23 0.960–253 1.17 0.95 1.0 0.820–508 1.0 0.98 20 0.97253–1498 2.81 0.98 6 0.97
38 International Journal of Applied Ceramic Technology—Alvarez, et al. Vol. 8, No. 1, 2011

(2.29� 10�14 and 1.84� 10�14 g2/cm4 s) for thecoated Sanergy HT, assuming parabolic behavior until1500 and 1000 h, respectively. This result suggests thatthe scale thickening is only one contribution to theweight gain. However, there is lower correlation(R2 o0.9) for the parabolic rate until 253 h. The rateconstant value is almost twice the value from the mea-sured weight gain data, assuming uniform scale growth.Between 253 and 1000 h, the predicted weight gainfrom the linear fit is approximately one-half of the ac-tual measured weight gain, confirming that the weightgain is not only a function of the scale thickening. Otherfactors that may contribute to the weight gain includechanges in microstructure such as internal oxidation andthe formation of a Laves phase in the alloy.
Microstructural Analysis
Typical microstructures for the coating with in-creasing exposure times are given in Fig. 7. The coatingremains stable at long exposures, with some internalcracking that should not be detrimental as it is stilleffective as a mass barrier for chromium diffusion.18
However, the deterioration of the coating could be det-rimental as it can cause an increase in the electrical re-sistance. Electrical measurements are being performedfor both the bare and coated samples in order to eval-uate if the coating deterioration has a negative effect onthe electrical resistance.
The initial coating had a closed pore microstruc-ture, but at longer exposures there was also the devel-opment of new features that could have an affect on theweight gain transition observed in Fig. 3. With time,there were new products that could be internal oxida-tion phases or a Laves precipitate inside the alloy. Inaddition, the internal cracking could result in faster ox-ygen diffusion through the coating which can affect theoxidation kinetics. Therefore, it suggests that the weightgain may not only be to the scale growth, but also to theformation of internal oxidation products (dark sphericalphase inside the substrate in Fig. 7B). The same micro-structure presents other products that do not affect theoxidation kinetics directly, such as the white internalphase in Fig. 7B. Both features are also observed for thebare substrate within the same time range. Further workto determine if there is any significant SiO2 formation isbeing characterized using EPMA.
Fig. 6. Squared scale thickness of bare and spinel-coated SanergyHT as a function of time during oxidation in air at 8001C.
Fig. 4. Weight gain as a function of time during isothermaloxidation for spinel-coated Sanergy HT at 8001C in air up to1500 h of exposure.
Fig. 5. Average scale thickness for bare and spinel-coated SanergyHT as a function of time during oxidation in air at 8001C.
www.ceramics.org/ACT Oxidation Kinetics of Manganese Cobaltite 39

To verify the chemical composition of the lighterphase in Fig. 7B and C, a quantitative analysis was per-formed using WDS for a spinel-coated substrate ex-posed for 1000 h. Its chemical composition containedCr—7.1%, Fe—5.1%, Nb—86.8%, Si—0.1%, andNi—0.6% (wt%). The precipitate is Nb rich, as wellas containing Fe and Cr, with a small amount of silicon.This suggests that a Laves phase of a form (Fe,Cr)Nb4,is located along the grain boundaries. Phases with sim-ilar chemistry and distribution have been reported forother alloys, such as T-441 and a modified Crofer 22APU (that was rich in Nb and W) that were exposed tosimilar conditions (8001C and 9001C in air, respec-tively).9,12 WDS rather than EDS has been the preferredchemical characterization tool for analysis of these Nbrich regions.5
Preliminary, XRD results for the bare Sanergy HTsubstrates with a thermally grown scale reveal primarilychromia along with a Mn spinel phase (Fig. 8). Com-paring Sanergy HT’s scale development to other alloysafter long exposure times (after approximately 1000 h)
the Sanergy HT develops the same phases that arereported for Crofer 22 APU. The Crofer 22 alloy de-velops a top layer of (Mn,Cr)3O4 on a sublayer ofCr2O3 when exposed to the same conditions (8001C in
Fig. 7. Typical cross sections of coated Sanergy HT substrates after exposure at 8001C in air for (A) 2 h (SEM–SE mode), (B) 253 h, and (C)after 1000 h (SEM–BSE mode).
Fig. 8. X-ray diffraction pattern of bare Sanergy HT afterexposure for 1000 h in air at 8001C.
40 International Journal of Applied Ceramic Technology—Alvarez, et al. Vol. 8, No. 1, 2011

air). The main difference between both of these alloysystems and E-brite is the absence of the manganese-richoxide top layer on E-brite. The similarity between allthree alloy systems is that all of them meet the requiredCr content (approximately between 18% and 20%Cr)to develop a protective chromium oxide layer.
Conclusions
This investigation was a preliminary evaluation ofthe oxidation kinetics for a new alloy, Sanergy HT alongwith the oxidation kinetics for this alloy with a protective(Mn,Co)3O4 protective coating. The bare alloy displayeda parabolic oxidation kinetics bahavior with a reportedrate constant of 3� 10�14 g2/cm4/s. The oxidation be-havior was similar to E-brite and the alloy exhibited ahigher oxidation resistance than Crofer 22 APU and 430SS. For the coated Sanergy HT, the oxidation kinetics aremore complicated and cannot be explained by a singleparabolic mechanism. A transition in behavior was ob-served at approximately 253 h but an attempt to separatethe data into two regions of behavior was inconclusive.Comparing the results for the bare and spinel-coated al-loy coupons, the coated Sanergy HT exhibited a lowerscale growth rate indicating an increased resistance tohigh-temperature oxidation. Further analysis is needed todefine the transition and conclusively determine theoxidation mechanism. A preliminary microstructuralanalysis observed major changes at 253 h, including in-ternal oxidation products and the formation of Lavesprecipitates. Sanergy HT also develops an outer spinelphase scale (Mn,Cr,Fe)3O4 and an inner chromium ox-ide scale. The microstructure of the Sanergy HT is similarto the microstructures previously reported for Crofer 22APU.
Further work is needed in order to characterize thetransition region, to better understand the microstructuralchanges, and to relate the microstructural changes to theweight gain. The formation of the Laves phase and in-ternal oxidation products complicate the microstructuralanalysis and need to be better characterized in order todetermine if they play a role in the oxidation and weightgain behavior. In addition, the effectiveness of the coatingas a chromium diffusion barrier needs to be further char-acterized. Preliminary data up to 1000 h suggested thatthere were no significant chromium migration.
Acknowledgment
We also acknowledge Gerry Wynick at Alfred Uni-versity for his expertise and guidance with the SEM andmicrostructural analysis.
References
1. Z. Yang, J. S. Hardy, M. S. Walker, G. Xia, S. P. Simner, and J. W. Ste-venson, ‘‘Structure and Conductivity of Thermally Grown Scales on FerriticFe–Cr–Mn Steel for SOFC Interconnect Applications,’’ J. Electrochem. Soc.,151 [11] 1825–1831 (2004).
2. Z. Yang, G. Xia, S. P. Simner, and J. W. Stevenson, ‘‘Thermal Growth andPerformance of Manganese Cobaltite Spinel Protection Layers on FerriticStainless Steel SOFC Interconnects,’’ J. Electrochem. Soc., 152 [9] 1896–1901(2005).
3. S. Fontana, et al., ‘‘Metallic Interconnects for SOFC: Characterisationof Corrosion Resistance and Conductivity Evaluation at OperatingTemperature of Differently Coated Alloys,’’ J. Power Sources, 171 [2]652–662 (2007).
4. S. Geng, J. Zhu, M. P. Brady, H. U. Anderson, X.-D. Zhou, and Z. Yang, ‘‘ALow-Cr Metallic Interconnect for Intermediate-Temperature Solid OxideFuel Cells,’’ J. Power Sources, 172 [2] 775–781 (2007).
5. Z. Yang, K. S. Weil, D. M. Paxton, and J. W. Stevenson, ‘‘Selection andEvaluation of Heat-Resistant Alloys for SOFC Interconnect Applications,’’J. Electrochem. Soc., 150 [9] 1188–1201 (2003).
6. J. W. Fergus, ‘‘Metallic Interconnects for Solid Oxide Fuel Cells,’’ Mater. Sci.Eng. A., 397 [1–2] 271–283 (2005).
7. J. Rufner, et al., ‘‘Oxidation Behavior of Stainless Steel 430 and 441 at8001C in Single (Air/Air) and Dual Atmosphere (Air/Hydrogen) Ex-posures,’’ Int. J. Hydrogen Energ., 33 [4] 1392–1398 (2008).
8. J. E. Hammer, S. J. Laney, R. W. Jackson, K. Coyne, F. S. Pettit, and G. H.Meier, ‘‘The Oxidation of Ferritic Stainless Steels in Simulated Solid-OxideFuel-Cell Atmospheres,’’ Oxid. Met., 67 [1–2] 1–38 (2007).
9. Z. Yang, et al., ‘‘Investigation of Fe–Cr–Nb–Ti Ferritic Stainless Steelfor SOFC Interconnect Applications,’’ J. Power Sources, in press.
10. S. Chandra-Ambhorn, Y. Wouters, L. Antoni, F. Toscan, and A. Galerie,‘‘Adhesion of Oxide Scales Grown on Ferritic Stainless Steels in Solid OxideFuel Cells Temperature and Atmosphere Conditions,’’ J. Power Sources, 171[2] 688–695 (2007).
11. K. Yamamoto, Y. Kimura, F.-G. Wei, and Y. Mishima, ‘‘Design of LavesPhase Strengthened Ferritic Heat Resisting Steels in the Fe–Cr–Nb(-Ni) Sys-tem,’’ Mater. Sci. Eng. A., 329–331 249–254 (2002).
12. J. Froitzheim, et al., ‘‘Development of High Strength Ferritic Steel forInterconnect Application in SOFCs,’’ J. Power Sources, 178 [1] 163–173(2008).
13. T. Horita, et al., ‘‘Effect of Grain Boundaries on the Formation of Ox-ide Scale in Fe-Cr Alloy for SOFCs,’’ Solid State Ionics, 179 [27–32]1320–1324 (2008).
14. Z. Yang, M. S. Walker, P. Singh, J. W. Stevenson, and T. Norby, ‘‘OxidationBehavior of Ferritic Stainless Steels Under SOFC Interconnect ExposureConditions,’’ J. Electrochem. Soc., 151 [12] 669–678 (2004).
15. Z. Yang, G.-G. Xia, X.-H. Li, and J. W. Stevenson, ‘‘(Mn,Co)3o4 SpinelCoatings on Ferritic Stainless Steels for SOFC Interconnect Applications,’’Int. J. Hydrogen Energ., 32 [16] 3648–3654 (2007).
16. Z. Yang, G. Xia, and J. W. Stevenson, ‘‘Mn1.5Co1.5O4 Spinel ProtectionLayers on Ferritic Stainless Steels for SOFC Interconnect Applications,’’Electrochem. Solid-State Lett., 8 [3] 168–170 (2005).
17. P. Kofstad, High-Temperature Oxidation of Metals, John Wiley and Sons,New York, 1966.
18. E. Alvarez, ‘‘Long Term Oxidation and Kinetics Study of Mn-Co SpinelProtective Coating for SOFC Interconnects,’’ M.S. Thesis, Alfred University,Alfred, NY, February 2009.
www.ceramics.org/ACT Oxidation Kinetics of Manganese Cobaltite 41