oxidation of uc: an in situ high temperature environmental
TRANSCRIPT

HAL Id: hal-01996203https://hal.archives-ouvertes.fr/hal-01996203
Submitted on 25 Apr 2019
HAL is a multi-disciplinary open accessarchive for the deposit and dissemination of sci-entific research documents, whether they are pub-lished or not. The documents may come fromteaching and research institutions in France orabroad, or from public or private research centers.
L’archive ouverte pluridisciplinaire HAL, estdestinée au dépôt et à la diffusion de documentsscientifiques de niveau recherche, publiés ou non,émanant des établissements d’enseignement et derecherche français ou étrangers, des laboratoirespublics ou privés.
Oxidation of UC: An in situ high temperatureenvironmental scanning electron microscopy study
Claudia Gasparrini, Renaud Podor, Denis Horlait, Michael J.D. Rushton,Olivier Fiquet, William Edward Lee
To cite this version:Claudia Gasparrini, Renaud Podor, Denis Horlait, Michael J.D. Rushton, Olivier Fiquet, et al.. Oxi-dation of UC: An in situ high temperature environmental scanning electron microscopy study. Journalof Nuclear Materials, Elsevier, 2017, 494, pp.127-137. �10.1016/j.jnucmat.2017.07.016�. �hal-01996203�

1
Oxidation of UC: an in situ high temperature environmental
scanning electron microscopy study
Claudia Gasparrinia, Renaud Podorb, Denis Horlaita,c, Michael J.D. Rushtona , Olivier Fiquetd
and William Edward Leea
a Centre for Nuclear Engineering (CNE) & Department of Materials, Imperial College London, South
Kensington Campus, London SW7 2AZ, U.K.
b Institut de Chimie Séparative de Marcoule, UMR 5257 CEA/CNRS/UM/ENSCM, BP17171, 30207 Bagnols-
sur-Cèze, France
c CNRS/IN2P3 and University of Bordeaux, Centre d’Etudes Nucléaires de Bordeaux-Gradignan, UMR 5797,
Chemin du Solarium, 33175 Gradignan, France
d Commissariat à l’Energie Atomique, CEA, Cadarache, France
[email protected]; [email protected]; [email protected]; [email protected];
[email protected]; [email protected]
Abstract. In situ HT-ESEM oxidation of sintered UC fragments revealed the morphological changes
occurring during the transformation between UC to UO2 and UO2 to U3O8 at 723 to 848 K and in an
atmosphere of 10 to 100 Pa O2. Two main oxidation pathways were revealed. Oxidation at 723 K in
atmospheres ≤ 25 Pa O2 showed the transformation from UC to UO2+x, as confirmed by post mortem
HRTEM analysis. This oxidation pathway was comprised of three steps: (i) an induction period, where
only surface UC particles oxidised, (ii) a sample area expansion accompanied by crack formation and
propagation, (iii) a stabilisation of the total crack length inferring that crack propagation had stopped.
Samples oxidised under 50 Pa O2 at 723 K and at 773 - 848 K for 10 to 100 Pa O2 showed an “explosive”
oxidation pathway: (i) sample area expansion occurred as soon as oxygen was inserted into the chamber
and crack propagation and crack length followed an exponential law; (ii) cracks propagated as a network
and the oxide layer fragmented, (iii) an “explosion” occurred causing a popcorn-like transformation,
typical for oxidation from UO2 to U3O8. HRTEM characterisation revealed U3O8 preferentially grow in
the [001] direction. The explosive growth, triggered by ignition of UC, proceeded as a self-propagating
high-temperature synthesis reaction, with a propagation speed of 150-500 ± 50 µm/s.
Keywords: Uranium carbide – Uranium oxide – Oxidation – HT-ESEM –
INTRODUCTION
Uranium monocarbide (UC) has potential application as nuclear fuel for Generation IV reactors. The
main advantages of this material compared to the current UO2 fuel are its higher fissile material density
(1.34 times) and better thermal conductivity (25.3 W/(m·K) which is 2.6 times higher) 1. While UC
offers improved properties during use, at the end of the fuel cycle it cannot be safely stored or disposed
of without undergoing preliminary conditioning to a suitable oxide form as it may be potentially
pyrophoric and reactive with moisture and gases 2,3.

2
The mechanism of oxidation of uranium carbide was investigated in the 1960s and 1970s when interest
in UC as a breeder reactor fuel was high 4-9. It was found to be affected by several parameters such as
temperature, oxygen partial pressure, morphology of the oxide layer formed, separation of the reaction
products and stoichiometry of the initial material 10. The oxidation mechanism of UC is complex as
similar studies 5,11 performed over the same temperature range and under the same oxygen atmosphere,
suggest different oxidation mechanisms which are affected by the formation of a protective oxide layer
or a low density non-protective pulverised oxide layer 12,13. Indeed U3O8 appears to be a detachable
powder whilst the thin layer adherent at the surface of uranium carbide is usually characterised as UO2
14,15. Many aspects of the intermediate oxidation process that occur when UO2 is oxidised to U3O8 are
not well understood. Oxidation of UO2 powders usually occurs in two stages represented by a pseudo-
parabolic weight gain curve followed by a sigmoidal curve 16. The first part of the curve is characterised
by a low oxidation rate, an induction period, that is associated with the diffusional oxidation of UO2 to
UO2.34 with formation of U4O9 and U3O7 as intermediate products while the latter part of the curve
assumes sigmoidal kinetics associated with the U3O8 nucleation and growth process 16,17,18 that occurs
when U3O8 is formed from U3O7 16
or UO2 18,19. The fcc cubic fluorite–type crystal structure of UO2 can
accommodate extra oxygen atoms and therefore is able to form the polymorphs U4O9 and U3O7. These
are described as UO2 matrices enriched with oxygen atoms20. Solubility of oxygen in UO2+x depends
on temperature 21: above 773 K uranium oxides from UO2.26 - UO2.33 can be converted to U3O8 22.
UC oxidation occurs with the characteristic Maltese cross 23 shape of the oxide, typical for carbides and
borides of the group IV,V,VI of the transition metals 24,25 when oxidised in CO2 atmosphere 26 at 1073
K or in an atmosphere ≥ 13.3 kPa in oxygen from 823 - 1073 K 14,27.
Iyer et al. 28 proposed a mechanism of oxidation for UC which involves: first the diffusion of oxygen
into the uranium carbide matrix with the precipitation of carbon, reported to be highly reactive. The
resulting oxycarbide is converted into uranium dioxide with subsequent precipitation of carbon as a
second phase. This oxide acts as a diffusion barrier for oxygen transport through the carbide matrix 28.
It is unclear whether the oxide product readily spalls off or stays adherent to the carbide core, as
contradictory results have been reported 11,12,13. Mukerjee et al. 11 proposed that at low oxygen partial
pressures (< 5kPa) the slow release of CO2 does not generate stresses in the oxide layer and therefore
an intact oxide layer at the end of the reaction is formed.
The main reactions that can occur during the oxidation of UC are:
𝑈𝐶 + 𝑂2 → 𝑈𝑂2 + 𝐶 (1)
𝐶 + 𝑂2 → 𝐶𝑂2 (2)
3𝑈𝑂2 + 𝑂2 → 𝑈3𝑂8 (3)
Reactions (1) and (2) occur at the same time, however reaction (3) is believed to occur when all the
carbon is oxidised to CO2 28. Slightly different reactions have been reported 7 where the intermediate
products of oxidation are UC2, UO2, UC1-xOx, UO3 or directly U3O8 and carbon could be oxidised either
to CO or CO2 14 depending on temperature and oxygen availability 29. The presence of carbon increases
the complexity of the oxidation mechanism of UC in comparison with oxidation of UO2 or metallic U
as carbon can be found in the oxide as either free carbon, as carbide, as oxycarbide, as carbon monoxide
or dioxide 14. UC is well known to be pyrophoric 3,28 and its ignition temperature is system dependant

3
and is affected by several parameters such as heating rate, partial pressure of oxygen, and at least ten
other factors including mass and specimen geometry 2. The proposed UC ignition reaction 28 is:
𝑈𝐶 +7
3𝑂2 →
1
3𝑈3𝑂8 + 𝐶𝑂2 (4)
It has been previously proposed that ignition in UC powder is triggered by the formation of a poorly
crystallised and cracked layer of UO2 which does not offer protection to the UC core when being
exposed to oxygen 15. On the other hand, a stable and protective layer made of a solid solution
UCO/UO2-x would prevent ignition. The second path was found to be possible thanks to slow heating
rates 15.
The work presented in this paper is the first of its kind as it follows the in situ observation of
morphological changes occurring during oxidation of sintered fragments of UC at low oxygen partial
pressures (≤ 100 Pa O2). This was made possible thanks to the use of state-of-the art techniques: high-
temperature environmental scanning electron microscope (HT-ESEM) used for monitoring in situ
oxidation of UC samples and post-mortem characterisation of the oxide products performed via high
resolution transmission electron microscopy (HRTEM).
EXPERIMENTAL
High density disc shaped, 235U depleted UC pellets (>91% of the theoretical density, TD, with U/C
stoichiometry of 1.00 ± 0.03), were manufactured at CEA (Commissariat à l’Energie Atomique)
Cadarache, France. They were crushed into fragments of various sizes and shapes with masses in the
range 3.3-17.5 mg and stored in an inert glovebox. A value for the samples surface area before oxidation
was evaluated by measuring the 3D sample dimensions from a SE image, approximating the third
dimension as this was taken on a 2D image. The approximated samples height was considered to be
even on all sides as this measurement could not be performed on each sample corner, the evaluated
surface area was then divided by the sample mass and the values found were in the range of 1.6 – 9.7
cm2/g. The insertion of the sample in the HT-ESEM was performed in air after removal of the UC
fragment from the glovebox. The oxidation experiments were performed at the Institut de Chimie
Séparative de Marcoule (ICSM) in Marcoule, France, in a HT-ESEM (FEI Quanta 200 FEG ESEM)
equipped with a hot stage under an atmosphere of oxygen between 10 and 100 Pa oxygen. Samples
were heated to the desired temperature, from 723 to 848 K, under vacuum, and only after the required
temperature was reached and stabilised, was the oxygen flux introduced into the chamber. A sample
corner region, to study flat surfaces, edges and corners all at once, was continuously monitored for the
entire length of the experiment and pictures were recorded every 3 or 5 seconds as soon as oxygen was
inserted in the chamber and by default every 15 seconds after. All images were recorded with the same
field of view, corresponding to an area of 908 × 836 μm2. The general procedure and details of the HT-
ESEM platform may be found in refs 30,31,32. Image analysis, using the Fiji ImageJ 33 software, was used
to monitor surface changes during isothermal heat treatments. Expansion of the sample surface and
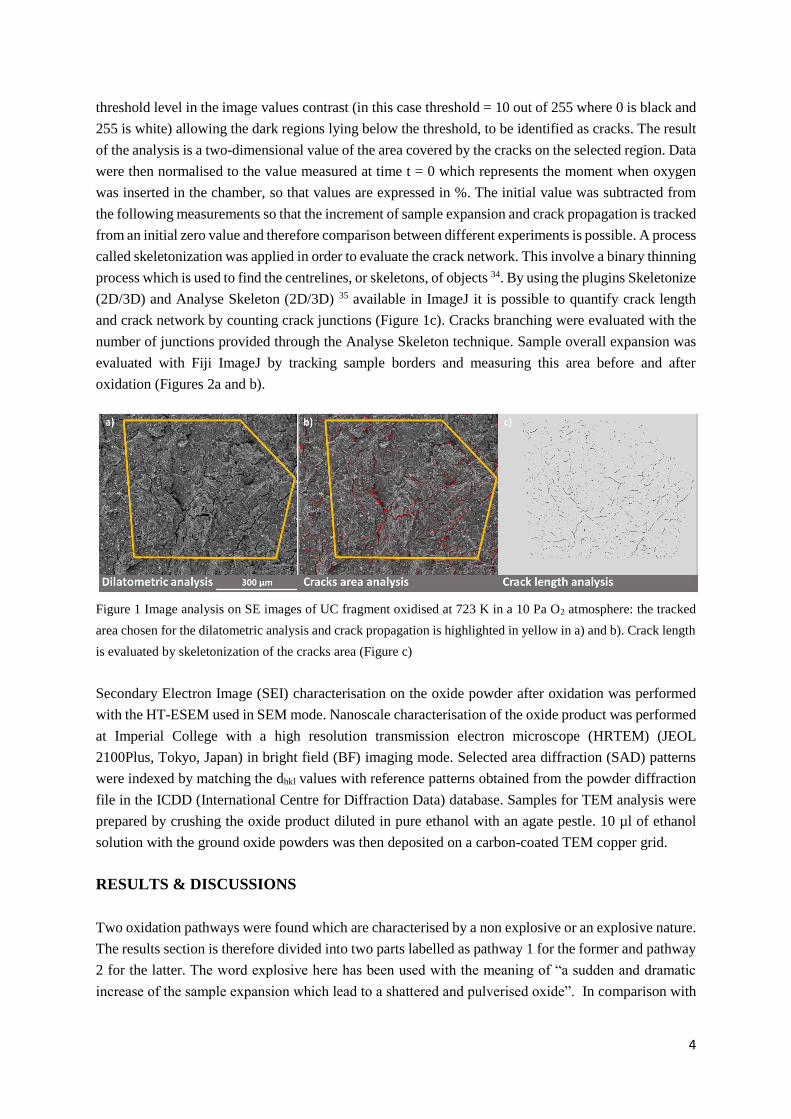
crack propagation due to the oxidation process was monitored by choosing specific features that identify
a portion of the surface (the area highlighted in yellow in Figure 1a, b) and by manually tracking their
change in position over time. The same area used to measure the dilatometric expansion of the sample
was used to analyse crack coverage (Figure 1b). Cracks were highlighted in the figure, by choosing a
4
threshold level in the image values contrast (in this case threshold = 10 out of 255 where 0 is black and
255 is white) allowing the dark regions lying below the threshold, to be identified as cracks. The result
of the analysis is a two-dimensional value of the area covered by the cracks on the selected region. Data
were then normalised to the value measured at time t = 0 which represents the moment when oxygen
was inserted in the chamber, so that values are expressed in %. The initial value was subtracted from
the following measurements so that the increment of sample expansion and crack propagation is tracked
from an initial zero value and therefore comparison between different experiments is possible. A process
called skeletonization was applied in order to evaluate the crack network. This involve a binary thinning
process which is used to find the centrelines, or skeletons, of objects 34. By using the plugins Skeletonize
(2D/3D) and Analyse Skeleton (2D/3D) 35 available in ImageJ it is possible to quantify crack length
and crack network by counting crack junctions (Figure 1c). Cracks branching were evaluated with the
number of junctions provided through the Analyse Skeleton technique. Sample overall expansion was
evaluated with Fiji ImageJ by tracking sample borders and measuring this area before and after
oxidation (Figures 2a and b).
Figure 1 Image analysis on SE images of UC fragment oxidised at 723 K in a 10 Pa O2 atmosphere: the tracked
area chosen for the dilatometric analysis and crack propagation is highlighted in yellow in a) and b). Crack length
is evaluated by skeletonization of the cracks area (Figure c)
Secondary Electron Image (SEI) characterisation on the oxide powder after oxidation was performed
with the HT-ESEM used in SEM mode. Nanoscale characterisation of the oxide product was performed
at Imperial College with a high resolution transmission electron microscope (HRTEM) (JEOL
2100Plus, Tokyo, Japan) in bright field (BF) imaging mode. Selected area diffraction (SAD) patterns
were indexed by matching the dhkl values with reference patterns obtained from the powder diffraction
file in the ICDD (International Centre for Diffraction Data) database. Samples for TEM analysis were
prepared by crushing the oxide product diluted in pure ethanol with an agate pestle. 10 µl of ethanol
solution with the ground oxide powders was then deposited on a carbon-coated TEM copper grid.
RESULTS & DISCUSSIONS
Two oxidation pathways were found which are characterised by a non explosive or an explosive nature.
The results section is therefore divided into two parts labelled as pathway 1 for the former and pathway
2 for the latter. The word explosive here has been used with the meaning of “a sudden and dramatic
increase of the sample expansion which lead to a shattered and pulverised oxide”. In comparison with

5
what was suggested by Mukerjee et al. work 11, this study shows that partial pressures as low as 2 Pa
O2 lead to a cracked oxide layer.
• Pathway 1: Non explosive (exponential then logarithmic increase of sample expansion)
Figure 2a and b show SE images of a UC sample oxidised in 10 Pa oxygen atmosphere at 723 K in the
HT-ESEM before and after the experiment. The sample outline at the end of the experiment was 2.5
times larger (Figure 2b) and the apparent volume gain is 5 times. SEM analysis of the powder after
oxidation showed that the oxide layer presented macrocracks and microcracks on the surface (Figure
2c) but still displays a compact structure. The surface morphological changes occurring during
oxidation are shown in Figures 2 d, e and f. After an initial induction period (approximately 1 hour)
where the sample surface appeared to remain compact and where only small crystals (approximately 3
µm wide) deposited on the surface oxidised, macro cracks started to appear over the entire surface.
Cracks were evenly distributed at corners and on the sample’s surface and their propagation was
accompanied by a considerable sample volume expansion as the sample corner left the field of view
(Figure 2f). The sample surface seen after 14 h of exposure in 723 K, 10 Pa oxygen atmosphere (Figure
2f) remained still as cracks were no longer propagating, the experiment was stopped at this stage by
decreasing the furnace temperature to room temperature.
Post mortem HRTEM analysis on oxide powders revealed that oxide particles are about 5 nm in size
(Figures 2g and h). Bright-field TEM imaging (Figure 2h) determined that the oxide shown in Figure
2c is mostly comprised of randomly oriented nanocrystals. A SAD pattern obtained from this region
(Figure 2i) showed that this oxide is polycrystalline UO2 (matched with PDF 00-041-1422 UO2, cubic
Fm-3m). Diffraction patterns for uranium oxide compounds however can be very similar, for example
tetragonal U3O7, cubic U4O9 and UO2 (see PDF 00 – 015 – 0004, 01 – 075 – 0944 and 00 – 041 – 1422,
respectively) show very close patterns, therefore the presence of U4O9 or U3O7 cannot be ruled out.

6
Figure 2 UC fragment oxidised at 723 K in a 10 Pa O2 atmosphere: SE images a) before and b) after oxidation;
yellow line highlights the outline of the sample, the dashed white square highlights the corner chosen to monitor
the surface during the experiment (Figures d, e and f); post mortem high magnification SEI of oxide powder c)
details of microcracks on the top surface and oxide layers organised in form of lamellae adherent to the oxide;
sequence of SEI showing in situ oxidation d) before oxidation, e) 5h after oxygen insertion and f) 14 hours after
oxygen insertion; BF TEM image of the oxide powder shown in Figure 2c) g) details of the aperture, labelled 1,
used to obtain SAD pattern, h) high magnification BFTEM image of the uranium oxide nanocrystals; i) SAD
pattern obtained from region 1 in Figure 2g showing rings matching cubic UO2
Figures 3a shows plots of sample dilatometric expansion of the surface during oxidation. The same
trend can be seen for crack propagation (Figure 3c) which cannot be described by a simple kinetic law,
as it resembles sigmoidal behaviour. Plotting values for the area expansion in % on a logarithmic scale
versus time (Figure 3b) revealed that the last part of the curve can be described by a linear fit, indicating
that oxidation proceeded with a logarithmic law, typical of low temperature oxidation in metals 36. UC
oxidation developed rapidly at the beginning when the first cracks were formed. After a given time,
approximately 6 hours after oxygen insertion, the rate of cracks propagation decreased. As can be seen
in Figure 3c, at the end of the experiment the area of cracks still increased but the overall crack length
(calculated from the skeletonised data) stabilised inferring that no new cracks were formed. This
indicates that cracks entered a regime in which the existing cracks opened and potentially increased in

7
depth. The reported values of cracks area and crack length are here used for qualitative considerations
and comparison.
Figure 3a) Plot of the dilatometric area analysis in % vs. time and b) plots of area analysis in % vs. log10 time and
c) cracks in % over the entire surface vs. time, and crack length (µm) sample oxidised at 723 K in 10 Pa O2
Pathway 2: Explosive growth (sudden and dramatic sample expansion)
The same heating procedure was applied to another UC sample oxidised also at 723 K, but at a higher
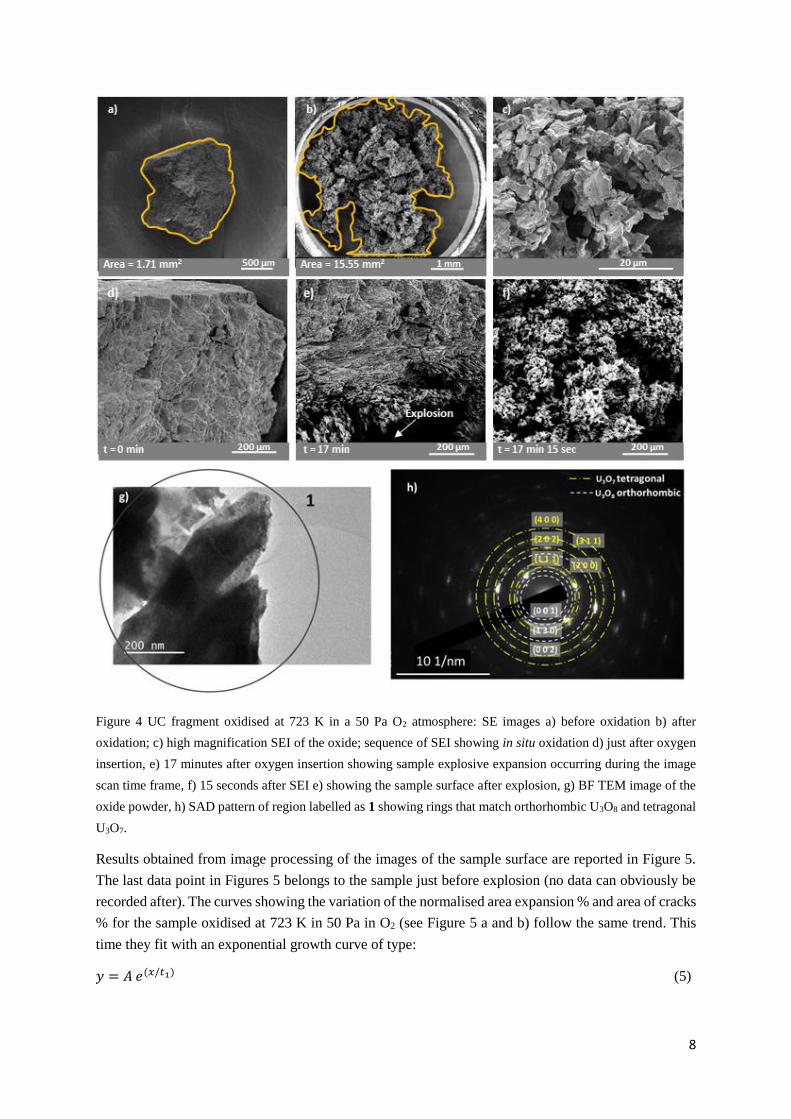
partial pressure of oxygen, 50 Pa. SEI obtained during in situ oxidation (Figure 4) revealed that the
sample after oxidation showed a completely different shape (Figure 4b) and it was not possible to
identify the original outline of the sample. The overall lateral sample expansion is measured as almost
10 times in size (Figures 4 a, b) and the overall apparent volume expansion is estimated to be ~26 times.
Figure 4c shows a high magnification image of the oxide after oxidation. The oxide conformation seen
at the end of the experiment resembles the characteristic cauliflower morphology, or also known as
popcorn-like transformation 17, named after the change from UO2 to U3O8. In this study, the popcorn-
like expansion was monitored for the first time in situ during UC oxidation. This transformation was
observed after the sample had increased in volume and an explosive expansion occurred (Figures 4d, e,
f). Figure 4d is a SEI of the sample surface at the beginning of the oxidation, 4e is a SEI of the sample
after 17 minutes of oxygen exposure where the sample has expanded and cracks are visible (top of the
image), while the sample explosion initiation is seen on the bottom of this picture. This transformation
happened in the frame time of this SE image scanning (a few seconds). The next image, Figure 4f,
captured 15 seconds later demonstrates the quasi-instantaneous change in sample morphology. Figure
4c shows the oxide morphology after the explosive event which has a structure that is opened in
comparison to the oxide shown in Figure 2c and shows the characteristic popcorn-like morphology of
U3O8 formed by UO2 oxidation 17,37.
The formation of U3O8 (and U3O7) at the end of the 50 Pa O2 experiment was confirmed by TEM
characterisation. Figure 4g shows a BF TEM image of the oxide powder formed at the end of the in situ
oxidation while Figure 4h shows the SAD pattern obtained from the area labelled as 1. The SAD ring
pattern matches with a polycrystalline biphasic sample made of orthorhombic U3O8 and tetragonal U3O7
(PDF 00 – 031 – 1424 and 00 – 015 – 0004, respectively). Confirmation of the presence of a mixture
of U3O7 / U3O8 in the SAD analysis obtained for the sample oxidised at 723 K can also be deduced from
the phase diagram reported by Higgs et al.38: for high oxygen/uranium ratio U3O8 is reported to be
present in a mixture with U3O7 for temperatures below 780 K. On the other hand, above 780 K instead,
U3O8 is expected to be present in a mixture with U4O9 38,39.
8
Figure 4 UC fragment oxidised at 723 K in a 50 Pa O2 atmosphere: SE images a) before oxidation b) after
oxidation; c) high magnification SEI of the oxide; sequence of SEI showing in situ oxidation d) just after oxygen
insertion, e) 17 minutes after oxygen insertion showing sample explosive expansion occurring during the image
scan time frame, f) 15 seconds after SEI e) showing the sample surface after explosion, g) BF TEM image of the
oxide powder, h) SAD pattern of region labelled as 1 showing rings that match orthorhombic U3O8 and tetragonal
U3O7.
Results obtained from image processing of the images of the sample surface are reported in Figure 5.
The last data point in Figures 5 belongs to the sample just before explosion (no data can obviously be
recorded after). The curves showing the variation of the normalised area expansion % and area of cracks
% for the sample oxidised at 723 K in 50 Pa in O2 (see Figure 5 a and b) follow the same trend. This
time they fit with an exponential growth curve of type:
𝑦 = 𝐴 𝑒(𝑥/𝑡1) (5)

9
where A is a positive growth factor and t1 is a time constant which represents the time required for the
function y, which is either the area % or cracks %, to increase by one factor equal to e. The sample
exposed to 50 Pa O2 oxidised at a much higher rate compared to the sample exposed to 10 Pa O2, the
experiment was completed within 18 minutes at 50 Pa compared to the 14 hours exposure at 10 Pa O2.
No induction time was observed for the sample at 50 Pa O2. Instead crack propagation and sample
expansion directly grew exponentially when oxygen was let into the chamber.
Figure 5 a) Plot of the dilatometric area analysis in % vs. time and b) crack area analysis in % vs. time. Fittings
performed with exponential laws. c) crack length vs. number of junctions analysis comparison, sample oxidised
at 723 K in 50 Pa O2
The popcorn-like explosion observed in Figure 4e also occurred for all the samples oxidised in the range
of 773-848 K in a 10 - 100 Pa O2 atmosphere. Cracks formation was monitored thoroughly in the sample
oxidised at 848 K in 10 Pa O2. Figure 6 shows the stages occurring just before and during the explosive
growth by oxidation of a UC sample. Fragmentation of the sample surface occurred in the area where
the disruption of the sample initiated (Figure 6d). The slow motion explosion visible in Figure 6 consists
of images recorded every second instead of the usual 15 seconds. The progress of this explosion (Figures
6d-h) is similar to a runaway reaction such as a self-propagating high-temperature synthesis, or SHS,
initiated with the ignition of UC. The propagation front from the initiation point seen in Figure 6d
travelled with a speed between 150 – 500 ± 50 µm/s across the sample. This was evaluated by measuring
the distance between the explosion front with the bottom left sample corner seen in Figure 6h.

10
Figure 6 Sequence of SE images of UC fragment oxidised at 848 K in 10 Pa O2 a) just after insertion of oxygen
b) after 16 minutes from oxygen insertion c) after 16 minutes and 7 seconds: crack propagation is evident on the
top right corner, d) to h) sequence of SE images taken 1 second apart showing the progress of the sample ignition.
Self-sustaining reactions can occur either between solids but also between gases and solids 40. In order
to have a SHS, the reaction considered must be highly exothermic 40, like in this system, as can be seen
in Table 1.
The standard enthalpy and entropy of reaction ∆rH0 and ∆rS0 along with the standard Gibbs enthalpy
of the reaction ∆rG0 have been evaluated with equations 6 and 7 and these are shown in Table 1:
∆𝑟𝑋 = ∑ 𝑟𝑖𝑖 ∆𝑓𝑋𝑖0 (6)
∆𝑟𝐺0 = ∆𝑟𝐻0 − 𝑇∆𝑟𝑆0 (7)
where X is either the enthalpy H or entropy S, r > 0 for products and r < 0 for reactants. The UC ignition
reaction shown in Equation 4 has the highest standard enthalpy of reaction, ΔrH0, measured as – 1487
kJ/mol. This means that UC ignition releases the highest amount of energy in comparison with all the
possible reactions that can occur within this system and this may explain the triggering of the SHS.
Also UC ignition has the highest standard Gibbs enthalpy of the reaction which shows that it is the most
spontaneous reaction in this system.
Table 1. Enthalpies of formation (ΔfH0) for the species in this system, standard enthalpy and entropy of reaction
(ΔrH0 , ΔrS0) and standard Gibbs enthalpy of the reaction (ΔrG0)
Species ΔfH0
(298.15 K)
(kJmol-1)
S0
(298.15 K)
(JK-1mol-1)
Reaction
(equation
n°)
ΔrH0
(298.15 K)
(kJ/mol-1)
ΔrS0
(298.15 K)
(J/K-1 mol-1)
ΔrG0
(298.15 K)
(kJ/mol-1)
Referen
ce
UC -97.9 ± 4.0
59.3 14
CO2 -394.4 213.6 -393.5
C (s) 5.7
O2 205
UO2 -1085.0 ± 1.0 77.03 (1) -987.1 -181.6 -932.9 41
U3O8 -3574.8 ± 2.5 282.54 (3)
(4)
-319.8
-1487.21
-153.6
-229.9
-274.1
-1419.6
41
2
Crack area analysis and crack length analysis on the sample performed just before the explosion is
shown in Figure 7a. A drastic increase in crack length and number of junctions occurred before the
sample was disrupted, these were measured on pictures taken before Figure 6c. The drastic increase of
these two parameters shows that cracks propagated forming a network before the sample explosion
occurred. The time to reach this last oxidation step, characteristic for UC oxidation, is here called
“ignition time”. The dependence of the ignition time with temperature and oxygen partial pressure from

11
773 to 848 K, in an oxygen atmosphere from 10 to 100 Pa O2 is shown in Figures 7b and c. A similar
trend is shown: by increasing the temperature or oxygen partial pressure the ignition time is reduced.
The same transformation seen in the sample oxidised at 723 K in 50 Pa O2 occurred for all samples
tested in this range of oxygen pressure and temperature. UC oxidised as soon as oxygen was added to
the chamber, no induction period was observed and sample area expansion and crack propagation grew
exponentially until reaching the point of no-return where explosion occurred.
Figure 7 a) Plot of the crack length and number of junctions vs. time just before ignition of sample oxidised at
848 K in 10 Pa O2; Correlation of the ignition time with oxygen partial pressure b) and with temperature c) for
UC samples oxidised from 723 K to 848 K in an oxygen atmosphere between 10 - 100 Pa.
The characteristic popcorn-like morphology of U3O8 previously reported in the literature 17,37 for the
conversion from UO2 to U3O8 was monitored during in situ oxidation of UC in the range of temperature
from 723 to 848 K. The influence of surface morphological changes such as crack propagation was here
used to describe the mechanism of oxidation and ignition of UC. The characterisation of oxidation
mechanisms via crack analysis is an unusual method in comparison with the widely used method of
weight gain curves. However, Lefort et al. 42 previously characterised the sigmoidal weight gain curves
typical for oxidation of cubic niobium nitride thanks to the development of a fragmentation model.
UC oxidation was observed to follow two types of process: (1) an oxidation where sample area and
crack propagation are characterised by an induction time followed by a drastic increase which then
slowed to low rates forming UO2 or (2) a drastic oxidation where sample expansion and crack
propagation are observed to start as soon as oxygen is inserted in the chamber followed by an
exponential growth until an explosion (i.e. an instantaneous and dramatic increase of growth rate)
occurred. At this stage sample morphology is changed into a popcorn-like shape were a mixture of
U3O8/ U3O7 is formed. The reason for occurrence of either one of the two types of oxidation was found
to be strictly related to both partial pressure of oxygen and temperature. Furthermore, the time needed
for the ignition to occur, here called ignition time, (see Figures 7b and c) is influenced by both
parameters. This is in agreement with Matzke, who reported that both the reaction of carbon with
oxygen and the dissolution of oxygen in the carbide during oxidation of uranium carbide are strictly
linked with both partial pressure of oxygen and temperature14.
By examining the first stages of reactions occurring at 723 K, it is possible to see that samples oxidised
at 10 and 25 Pa O2 followed pathway 1, while the sample oxidised at 50 Pa O2 followed pathway 2
(Figure 8a). Samples exposed to 10 Pa showed an induction time of approximately 1 hour while the
sample exposed to 25 Pa O2 presented a 15 minutes induction time. The induction time is 4 times shorter
when the atmosphere is changed from 10 to 25 Pa of oxygen. It is therefore plausible to assume that for

12
the curve at 50 Pa the induction time is either too short to be experimentally observed or that pathway
2 is characterised by the absence of an incubation time.
At higher temperatures, such as 773 K, samples followed pathway 2 for all pressures tested, from 10-
100 Pa O2 (see Figure 8c). The plots of normalised area% vs. time were fitted with the exponential law
shown in Equation 5.
Figure 8 Plot of the normalised area in % vs. time for a) UC samples oxidised at T= 723 K in an atmosphere of
10 Pa O2 (■), 25 Pa O2 (♦) and 50 Pa O2 (●); b) logarithmic fit for the normalised area for samples that follow
pathway 1: 10 (■) and 25 Pa O2 (♦) at 723 K c) normalised area in % vs. time for UC samples oxidised at T= 773
K in an atmosphere of 10 Pa O2 (●), 25 Pa O2 (▲), 50 Pa O2 (▼) and 100 Pa O2 (♦)
The time constant t1, was directly evaluated for all curves that fit Equation 5 as shown in Figure 8c.
Time constants t1 for samples that followed mechanism 1 were found by plotting the natural logarithm
of the normalised area % vs. time and by linearly fitting the initial part of the curve, after the induction
time. In this case the time constant t1 is the inverse of the slope of the straight line fitted in Figure 8b
(see Equation 8).
ln(𝑦) = ln (𝐴) +1
𝑡1𝑥 (8)
Table 2 summarises the time constants for the samples oxidised at 723 K from 10-50 Pa O2 and at 773
K from 10-100 Pa O2.
Table 2. Time constants t1 (seconds) evaluated for samples oxidised at 723 K and 773 K in an atmosphere from
10-100 Pa O2
Partial Pressure O2
(Pa)
10 25 50 100
Temperature (K)
723 K 740 ± 49 820 ± 53 243 ± 12
773 K 470 ± 14 246 ± 25 119 ± 9 46 ± 2
The time constant error for samples oxidised at 723 K at 10 and 25 Pa was found by using Equation 9:
𝛿𝑡1 =𝛿
1
𝑡11
𝑡1
∙ 𝑡1 (9)
where the error δ 1
𝑡1 is given by the fitting of the plot in Figure 8b.

13
The change in oxidation pathway from 1 to 2 is characterised by a different value of t1. Values of t1
higher or equal to 740 ± 49 seconds characterise pathway 1 which represent the non-explosive
oxidation. Conversely, values of t1 smaller or equal to 470 ± 14 seconds characterise the explosive
pathway. In this case the area increase and cracks propagation occur rapidly. Sample fragmentation
leads to UC ignition which in turn triggers the explosion of the entire sample. Figure 9 is a schematic
of the two oxidation processes.
Figure 9. Proposed mechanism of oxidation of UC sintered fragments from 723 – 848 K in an oxygen atmosphere
of 10-100 Pa O2.
• Pathway 1. T = 723 K, P ≤ 25 Pa: non explosive
(i) Induction time: UC small particles (approximately 3 µm wide) on the surface oxidise while
sample area remains (presumably) stable as cracks are not formed. During this period
oxygen can be agglomerated in the oxide layer.
(ii) Sample starts to expand: oxygen passes through the protective oxide layer and comes into
contact with core UC. This process is described by both Equations 1 and 2, the formation
of UO2 creates stresses on the surface as this transformation implies a volume increase of
34% (see Table 3) which provokes sample expansion and crack formation. Crack
propagation and sample area expansion first exponentially increase, with a time constant t1
≥ 740 ± 49 seconds, and then drop off to low rates following a logarithmic trend.
(iii) At the end of the experiment crack length stabilises: no new cracks form. Oxygen keeps
penetrating through the cracks but reactive surface area does not increase.
• Pathway 2. T = 723 K and P = 50 Pa, 773 ≤ T ≤ 848 K and 10 ≤ P ≤ 100 Pa : explosive
(i) Induction time is not experimentally observed as oxidation occurs rapidly. UC soon
oxidises into UO2 (Equations 1 and 2), this transformation is accompanied by a 34 %
volume increase. Sample area, crack area and crack length follow an exponential growth
law (Equation 5). The time constant for the sample area expansion is ≤ 470 ± 14 seconds
describing a high rate of oxidation.

14
(ii) Crack length increase is accompanied by a sharp increase of reactive surface area as cracks
join in a network. Fragmentation of the sample follows as oxidation proceeds on all the
surfaces exposed to the oxygen atmosphere
(iii) Oxygen comes into contact with the fragmented UC core and ignition occurs, this acts as
initiation point of the SHS reaction which is visible in Figure 6. The reaction propagates
through the sample within a few seconds and the new sample surface gets a popcorn-like
morphology. The oxidation products for the sample oxidised at 723 K are a mixture of U3O8
and U3O7.
The main phenomena which are involved in UC oxidation are: ignition of UC, presence of carbon which
oxidises into CO2, volumetric expansion between UC to UO2 and from UO2 to U3O8 and crack
propagation. These phenomena are individually discussed below.
• Ignition of UC
Usually SHS is used to fabricate carbides, nitrides and also complex oxides by reacting a higher oxide
of one metal with a lower oxide of usually another metal. The characteristics of this process are: the
adiabatic temperature for combustion is below the melting points of the reactants, the gas phase products
is very small and the combustion wave which is self-sustained propagates with a velocity that ranges
from 0.1–4.5 cm/s 40,43. The difference between the combustion speed found in this study, approximately
150-500 ± 50 µm/s, with the ones previously reported by Shuck et al.43 and Munir et al.40 from 0.1 to
4.5 cm/s is related to the fact that SHS reactions reported in literature consider as initial material a fine
powder, while in this case the runaway reaction initiates on a sintered sample when the reactive surface
area reaches a critical point. Particle size of the powder was found to have a great influence on
propagation wave velocity, for example by increasing the particle size from 0.05 to 3 mm Munir et al.
observed a velocity drop from 4.5 cm/s to 0.7 cm/s in a mixture of titanium and carbon 40. A SHS
reaction is associated with a combustion process after local initiation which can be induced using
different methods such as placing a coil wire 44, by laser radiation or by spark ignition 45. Here the spark
initiation is provided by ignition of UC. As can be seen in Table 1 the proposed ignition reaction of UC
directly to U3O8 2 (Equation 4) releases the highest amount of heat in comparison with all the other
reactions present in the system. At this stage heat release is confined within the fragmented UC core,
the nearby UC fragments are therefore heated and consequently self-ignite propagating the reaction
through the entire sample.
A correlation between the time needed for ignition to occur and oxygen partial pressure shown in Figure
7b is in agreement with a numerical prediction performed by Hughes et al. 46 for a different system that
considers competing exothermic and endothermic chemical reactions in parallel with water evaporation 46. Their numerical prediction was performed by considering the simplest model where mass transport
phenomena such as diffusion and advection are neglected as all gaseous and liquid phases are
considered evenly distributed.
• Presence of C as UC or free C
It has been reported here that the occurrence of an explosive-like reaction is dependent on oxygen partial
pressure (see Figure 7b). The presence of both U3O7 and U3O8 in the oxide at the end of the experiment,
and the fact that Equation 3 is said to happen after carbon transforms into CO and/or CO2 28 suggests

15
that gases are released during sample explosive expansion. However, a direct correlation between the
CO2 release and sample explosion cannot be drawn as it was not possible here to monitor the gas
evolution.
• Volumetric transformation between UC and UO2 and U3O8
The main explanation associated with the characteristic popcorn like morphology of U3O8 is usually
attributed to the 36% increase in volume (see Table 3) during conversion from UO2 17. This is related to
the fact that most of the work on uranium oxidation is based on UO2 22,47,48. It is well reported that cracks
form in UO2 single crystals when they oxidise to U3O7 16,49 and formation of U3O7 is an intermediate
step that usually occurs when UO2 oxidises to U3O8 50. In the case of UC oxidation, shown in our study,
additional transformations occur. UC is first oxidised to UO2, then hyperstoichiometric UO2 is
converted into U3O7, possibly to U4O9 and then to U3O8 with the release of CO2 gas due to carbon
oxidation. In previous in situ UO2 oxidation experiments the popcorn morphology of U3O8 was
associated with crack formation, according to Quémard et al.16. In their study the oxidised and popcorn-
like U3O8 sample had a similar outline to the initial UO2 sample. In our experiments instead the sample’s
outline is completely altered by the explosive phenomenon indicating that the popcorn-like
transformation is due to ignition of UC.
Table 3. Space groups, specific volumes, densities, lattice parameters and volume changes associated with
transformation between uranium monocarbide and uranium oxides39
Uranium
compound
Space
Group
Cell
Volume
(nm3)
Z
number
Density
(g/cm3)
Lattice
Paramet
er (Å)
Angle
(°)
Transformati
on
Volume
change
(%)
UC
Cubic
Fm-3m 0.122 4 13.61 4.96 90
UO2
Cubic
Fm-3m 0.163 4 10.98 5.467 90 UC UO2 +34
α-U3O8
orthorhombic
C2mm 0.333 6 8.39 a=6.71
b=11.96
c=4.14
90
90
90
UO2U3O8 +36
The U3O8 phase formed after popcorn-like transformation is a textured phase, as reported in Figure 7b,
as only some directions are seen in the SAD. The planes seen are the (001), (130) and (002). The fact
that the points related to the (001) are rather intense can be explained with the epitaxial theory of Allen
et al.51,52,53 and confirmed by Taylor et al.17: the oxidation occurring with a rapid rate in the UO2 [111]
direction causes the formation of U3O8 in the [001] direction due to the epitaxial relation that exists
between these crystallographic directions 17. However, in polycrystalline samples the lattice expansion
is not readily accommodated as the UO2 parallel to the (111) plane cannot easily expand orthogonally
to the surface 17. This will create a build-up of stress in the oxide structure followed by an increase in
crack formation which provokes a drastic modification in the original shape of the sample.
CONCLUSIONS
16
The morphological changes during transition from UC to U3O8 have been investigated for the first time
during UC oxidation at 723 - 848 K from 10 – 100 Pa O2. Sample area expansion and crack propagation
were monitored thanks to the use of an in situ technique: HT-ESEM. This is, to the best of our
knowledge, the first time that an oxidation mechanism has been described by measuring the sample
morphological changes in situ: surface expansion, crack propagation and crack length. Our method
expands on the results found by Quémard et al.16 on in situ oxidation of UO2. In their study the sigmoid
shape of the weight gain curve describing oxidation of UO2 has been related to the macro cracking
process starting when a UO2+x layer is formed on the surface.
In this work, we have shown that the transformation from UO2+x to U3O8 occurred after an explosive
reaction which propagated as a SHS reaction throughout the sample. This was triggered by UC ignition
which occurred at 723 K in a 50 Pa O2 atmosphere and for all samples exposed to higher temperatures,
from 773 K to 848 K in an oxygen atmosphere of 10-100 Pa O2. UC ignition initiated after a drastic
exponential growth of the sample area and crack propagation. The morphology of the oxide before and
after this transformation showed that the oxide layers previously arranged in a compact structure were
disrupted. Samples that did not oxidise via an explosive pathway showed UO2 as a main oxide product,
in this case, sample expansion followed an exponential increase followed by a decrease in rate which
fits well to a logarithmic law. At this stage cracks are no longer forming. A proposed model for UC
oxidation is shown in Figure 9. Pathway 1 shows the non explosive oxidation occurring when UC
oxidises to UO2 while pathway 2 describes the explosive mechanism involved when UC ignition
triggers the oxidation from UO2 to U3O8. The explosive pathway is characterised by fragmentation of
the sample due to the high oxidation rate accompanied by an exponential increase of crack propagation
and crack length which increased the sample reactive surface area. A criterion for pathway 1 or 2 to
occur was found to be related with the time constant, t1. Samples that did undergo explosive reaction
had a t1 ≤ 470 ± 14 seconds while samples that followed pathway 1 are characterised by a t1 ≥ 740 ± 49
seconds.
ACKNOWLEDGMENTS
The authors are grateful to the EPSRC DISTINCTIVE (Decommissioning, Immobilisation and Storage
soluTIons for NuClear wasTe InVEntories) Consortium for their financial support of this project
(EPSRC Industrial Case Award EP/M507428/1 Grant and the DISTINCTIVE EP/ L014041/1 Grant).
We also thank Dr Mahmoud Ardakani for help with HRTEM analysis at Imperial College, Dr Stéphanie
Szenknect for sample preparation and Joseph Lautru for help with the SEM at ICSM.
1. IAEA - International Atomic Energy Agency. Thermophysical Properties of Materials for
Nuclear Engineering: A tutorial and Collection of data. (IAEA-THPH, 2008).
2. Dell, M. & Wheeler, V. J. The ignition of uranium mononitride and uranium monocarbide in
oxygen. J. Nucl. Mater. 21, 328–336 (1966).
3. Berthinier, C., Coullomb, S., Rado, C., Blanquet, E., Boichot, R. & Chatillon, C. Experimental
study of uranium carbide pyrophoricity. Powder Technol. 208, 312–317 (2011).
4. Peakall, K. A. & Antill, J. E. Oxidation of uranium monocarbide. J. Less-Common Met. 4,
426–435 (1962).
5. Naito, K., Kamegashira, N., Kondo, T. & Takeda, S. Isothermal oxidation of uranium

17
monocarbide powder under controlled oxygen partial pressures. J. Nucl. Sci. Technol. 13, 260–
267 (1976).
6. Matzke, H. Effect of humidity on the surface oxidation of UC single crystals at room
temperature. J. Appl. Phys. 40, 3819–3824 (1969).
7. Tets, A. Van. Reaction of uranium monocarbide powder in oxidizing atmospheres.
Thermochim. Acta 6, 195–203 (1973).
8. Matcheret, G. L’oxydation des carbures d’uranium par des reactifs gazeux. Commissariat à
l’Energie Atomique Report, BIB-183 (1970).
9. Ohmichi, T. & Honda, T. The oxidation of UC and UN powder in air. J. Nucl. Sci. Technol. 5,
600–602 (1968).
10. Coppersthwaite, D. P. Options for the recovery of surplus uranium carbide fuel. Technical
Report RAT 3432, Issue 01. (BNFL Commercial, 2002).
11. Mukerjee, S. K., Rao, G. A. R., Dehadraya, J. V., Vaidya, V. N., Venugopal, V. & Sood, D. D.
The oxidation of uranium monocarbide microspheres. J. Nucl. Mater. 210, 97–106 (1994).
12. Mazaudier, F., Tamani, C., Galerie, a. & Marc, Y. On the oxidation of (U,Pu)C fuel:
Experimental and kinetic aspects, practical issues. J. Nucl. Mater. 406, 277–284 (2010).
13. Shepherd, J. S., Fairweather, M., Hanson, B. C. & Heggs, P. J. Mathematical model of the
oxidation of a uranium carbide fuel pellet including an adherent product layer. Appl. Math.
Model. 45, 784–801 (2017).
14. Matzke, H. Science of Advanced LMFBR Fuels : Solid State Physics, Chemistry, and
Technology of Carbides, Nitrides, and Carbonitrides of Uranium and Plutonium. (North
Holland, 1986).
15. Le Guyadec, F., Rado, C., Joffre, S., Coullomb, S., Chatillon, C. & Blanquet, E.
Thermodynamic and experimental study of UC powders ignition. J. Nucl. Mater. 393, 333–
342 (2009).
16. Quémard, L., Desgranges, L., Bouineau, V., Pijolat, M., Baldinozzi, G., Millot, N., Nièpce, J.
C. & Poulesquen, A. On the origin of the sigmoid shape in the UO2 oxidation weight gain
curves. J. Eur. Ceram. Soc. 29, 2791–2798 (2009).
17. McEachern, R. J. & Taylor, P. A review of the oxidation of uranium dioxide at temperatures
below 400°C. J. Nucl. Mater. 254, 87–121 (1998).
18. Walker, D. E. Y. The oxidation of uranium dioxides. J. Appl. Chem. 15, 128–135 (1965).
19. McEachern, R. J., Choi, J. W., Kolár,̃ M., Long, W., Taylor, P. & Wood, D. D. Determination
of the activation energy for the formation of U3O8 on UO2. J. Nucl. Mater. 249, 58–69 (1997).
20. Garrido, F., Ibberson, R. M., Nowicki, L. & Willis, B. T. M. Cuboctahedral oxygen clusters in
U3O7. J. Nucl. Mater. 322, 87–89 (2003).
21. Rousseau, G., Desgranges, L., Charlot, F., Millot, N., Nièpce, J. C., Pijolat, M., Valdivieso, F.,
Baldinozzi, G. & Bérar, J. F. A detailed study of UO2 to U3O8 oxidation phases and the
associated rate-limiting steps. J. Nucl. Mater. 355, 10–20 (2006).
22. Hoekstra, H. R., Santoro, A. & Siegel, S. The low temperature oxidation of UO2 and U4O9. J.
Inorg. Nucl. Chem. 18, 166–178 (1961).
23. Gasparrini, C., Podor, R., Horlait, D., Chater, R. & Lee, W. E. Zirconium carbide oxidation:
maltese cross formation and interface characterization. Oxid. Met. 1–8 (2016).
doi:10.1007/s11085-016-9672-6

18
24. Sciti, D., Silvestroni, L., Guicciardi, S., Fabbriche, D. D. & Bellosi, A. Processing, mechanical
properties and oxidation behavior of TaC and HfC composites containing 15 vol% TaSi2 or
MoSi2. J. Mater. Res. 24, 2056–2065 (2009).
25. Silvestroni, L. & Sciti, D. Sintering behavior, microstructure, and mechanical properties: A
comparison among pressureless sintered ultra-refractory carbides. Adv. Mater. Sci. Eng. 2010,
1–11 (2010).
26. Menzies, I. A. & Strafford, N. The oxidation of uranium-based ceramics. The behaviour of UC
and UO2 contaminated with carbon containing phases. J. Nucl. Mater. 21, 287–301 (1967).
27. Besson, J. & Moureau, C. La réaction de l’oxygène sur le monocarbure d’uranium massif.
Compt. Rend. Acad. Sci. Paris 258, 4079–4082 (1964).
28. Iyer, V. S., Mukerjee, S. K., Kamat, R. V, Pillai, K. T., Kumar, N., Vaidya, V. N. & Sood, D.
D. Oxidation behavior of carbide fuels. Nucl. Technol. 91, 388–393 (1990).
29. Scott, C. D. Analysis of combustion of graphite-uranium fuels in a fixed bed or moving bed.
Ind. Eng. Chem. Process Des. Dev. 5, 223–233 (1966).
30. Horlait, D., Claparede, L., Tocino, F., Clavier, N., Ravaux, J., Szenknect, S., Podor, R. &
Dacheux, N. Environmental SEM monitoring of Ce1−xLnxO2−x/2 mixed-oxide microstructural
evolution during dissolution. J. Mater. Chem. A 2, 5193–5203 (2014).
31. Clavier, N., Podor, R., Deliere, L., Ravaux, J. & Dacheux, N. Combining in situ HT-ESEM
observations and dilatometry: An original and fast way to the sintering map of ThO2. Mater.
Chem. Phys. 137, 742–749 (2013).
32. Podor, R., Pailhon, D., Ravaux, J. & Brau, H.-P. Development of an integrated thermocouple
for the accurate sample temperature measurement during high temperature environmental
scanning electron microscopy (HT-ESEM) experiments. Microsc. Microanal. 21, 307–312
(2015).
33. Schneider, C. A., Rasband, W. S. & Eliceiri, K. W. NIH Image to ImageJ: 25 years of image
analysis. Nat. Methods 9, 671–675 (2012).
34. Homann, H. Implementation of a 3D thinning algorithm. Insight J. July-Decem, 4–7 (2007).
35. Arganda-Carreras, I., Fernández-González, R., Muñoz-Barrutia, A. & Ortiz-De-Solorzano, C.
3D reconstruction of histological sections: Application to mammary gland tissue. Microsc.
Res. Tech. 73, 1019–1029 (2010).
36. Kofstad, P. High Temperature Corrosion. (Elsevier Applied Science, London & New York,
1988).
37. Yang, J. H., Kang, K. W., Kim, K. S., Rhee, Y. W. & Song, K. W. Recycling process for
sinter-active U3O8 powders. J. Nucl. Sci. Technol. 47, 538–541 (2010).
38. Higgs, J. D., Thompson, W. T., Lewis, B. J. & Vogel, S. C. Kinetics of precipitation of U4O9
from hyperstoichiometric UO2+x. J. Nucl. Mater. 366, 297–305 (2007).
39. Guéneau, C., Chartier, A. & Van Brutzel, L. Book section 2.02: Thermodynamic and
thermophysical properties of the actinide oxides. Comprehensive Nuclear Materials - Volume
2 (2012).
40. Munir, Z. A. & Anselmi-Tamburini, U. Self-propagating exothermic reactions: The synthesis
of high-temperature materials by combustion. Mater. Sci. Reports 3, 279–365 (1989).
41. Konings, R. J. M., Morss, L. R. & Fuger, J. in The chemistry of the Actinide and Transactinide
Elements 2113–2224 (Springer, 2006).

19
42. Lefort, P., Desmaison, J. & Billy, M. Comportement du nitrure de niobium cubique δ en
atmosphere d’oxygene. Mater. Res. Bullettin 14, 479–486 (1979).
43. Shuck, C. E., Manukyan, K. V., Rouvimov, S., Rogachev, A. S. & Mukasyan, A. S. Solid-
flame: Experimental validation. Combust. Flame 163, 487–493 (2016).
44. Holt, J. B. & Munir, Z. A. Combustion synthesis of titanium carbide : theory and experiment.
J. Mater. Sci. 21, 251–259 (1986).
45. Barzykin, V. V. Initiation of SHS processes. Pure Appl. Chem. 64, 909–918 (1992).
46. Hughes, K. J., Brindley, J. & McIntosh, A. C. Initiation and propagation of combustion waves
with competitive reactions and water evaporation. Proc. R. Soc. A Math. Phys. Eng. Sci. 469,
20130506–20130506 (2013).
47. Hoekstra, H. R., Siegel, S., Fuchs, L. H. & Katz, J. J. The uranium-oxygen system: UO2.5 to
U3O8. J. Phys. Chem. 59, 136–138 (1955).
48. Blackburn, P. E., Weissbart, J. & Gulbransen, E. A. Oxidation of uranium dioxide. J. Phys.
Chem. 62, 902–908 (1958).
49. Desgranges, L., Palancher, H., Gamaléri, M., Micha, J. S., Optasanu, V., Raceanu, L.,
Montesin, T. & Creton, N. Influence of the U3O7 domain structure on cracking during the
oxidation of UO2. J. Nucl. Mater. 402, 167–172 (2010).
50. Poulesquen, A., Desgranges, L. & Ferry, C. An improved model to evaluate the oxidation
kinetics of uranium dioxide during dry storage. J. Nucl. Mater. 362, 402–410 (2007).
51. Allen, G. C., Tempest, P. A. & Tyler, J. W. Characterisation of crystalline UO2 oxidised in 1
Torr of oxygen at 25, 225 and 300 °C. Part 1. X-ray photoelectron spectroscopy. J. Chem. Soc.
Faraday Trans. 1 Phys. Chem. Condens. Phases 84, 4049–4059 (1988).
52. Allen, G. C., Tempest, P. A. & Tyler, J. W. The formation of U3O8 on crystalline UO2.
Philos. Mag. Part B 54, L67–L71 (1986).
53. Allen, G. C., Tempest, P. A. & Tyler, J. W. Characterisation of crystalline UO2 oxidised in 1
Torr of oxygen at 25, 225 and 300 °C. Part 2. X-ray diffraction and scanning electron
microscopy. J. Chem. Soc. Faraday Trans. 1 Phys. Chem. Condens. Phases 84, 4061–4072
(1988).