p capacity decisions for non profit internet service providers
TRANSCRIPT
PRICING AND CAPACITY DECISIONS FOR NON-PROFIT
INTERNET SERVICE PROVIDERS
Hsing Kenneth Cheng* Kutsal Dogan
and Richard A. Elnicki
Department of Decision and Information Sciences Warrington College of Business Administration
P.O. Box 117169 The University of Florida
Gainesville, FL 32611-7169
* Corresponding author. Phone: (352) 392-7068; Fax: (352) 392-5438; e-mail: [email protected] The authors are listed in alphabetical order.
PRICING AND CAPACITY DECISIONS FOR NON-PROFIT INTERNET SERVICE PROVIDERS
Abstract Many universities and other non-profit organizations started dial-up Internet access as a value-
added service to their respective communities. The implementation and maintenance of these services becomes a nontrivial task, requiring large annual budgets to keep these systems up and running. The mandate for these non-profit entities is to recover the costs of providing their value added services in the long run while maintaining a guaranteed quality of service (QoS) level. Their pricing and capacity planning problem has three distinct aspects. First, pricing based on cost recovery has inherent challenges. Second, the non-profit ISPs have to tackle the growth of very unpredictable demand that calls for a continuous capacity expansion. Third, capacity expansion in terms of Internet dial-up lines comes only in multiple or bulk units which typically exhibit economy of scale characteristics. Another critical issue of capacity expansion is the timing of the expansion since the installation of capacity requires a lead-time for testing.
This paper proposes a Busiest-Minute Planning Model (BMPM) for the non-profit ISPs to
effectively solve the aforementioned issues. The BMPM model provides non-profit ISPs a mechanism to determine the optimum capacity for a given QoS level. The mechanism can predict when existing capacity becomes saturated by taking into account the desired QoS and future demand growth. The BMPM model proposed in this paper is tested using data from a non-profit ISP - The Northeast Regional Data Center (NERDC) of the State of Florida. The results suggest that our BMPM model is very effective in solving the pricing and capacity expansion decisions of NERDC and can be applied to other non-profit ISPs.
Keywords: Pricing, Capacity Planning, Cost Recovery Pricing, Internet Service Provider
1
PRICING AND CAPACITY DECISIONS FOR NON-PROFIT INTERNET SERVICE PROVIDERS
1. Introduction
Many universities and other non-profit organizations started dial-up Internet
access as a value-added service to their respective communities. At first the provision of
the service was relatively easy since the demand for such services was not high and the
users did not have much to do with their connections. The Web was not as rich and
populated as it is today, and the occasional e-mail use did not require a lot of networking
resources. But soon after the commercial activities on the Internet took place in 1995,
access to the Web became extremely popular. More and more users started to use the
dial-up services provided by the universities and other non-profit organizations for ever
increasing periods of time. This led to congested lines and the need for capacity
expansion. Many users have come to take these services for granted and expected the
continuation of provision.
The implementation and maintenance of providing Internet dial-up services
became a nontrivial task, requiring large annual budgets to keep these systems up and
running. At this point, some kind of cost recovery model or privatization of the services
was considered by these non-profit organizations. A variety of pricing and cost recovery
algorithms (flat rate pricing, usage pricing, two-part tariff, and etc.) were put in use.
Some were successful and kept the services viable while others were not and the services
were abolished altogether. The pricing and capacity decisions are rather different for the
non-profit Internet Service Providers (ISPs) than those for their profit-seeking
counterparts. The mandate for these non-profit entities is to recover the costs of

2
providing their value added services in the long run while maintaining a guaranteed
quality of service (QoS) level. Their pricing and capacity planning problem has three
distinct aspects.
First, pricing based on cost recovery has inherent challenges. The administrators
of these non-profit entities have to take into consideration the trade-off between capacity
level and QoS level. In the context of Internet dial-up services, the capacity is defined as
the number of available dial-up lines, and the QoS level as the percentage of customers
who get a dial-up line within a predetermined time frame. The QoS level can also be
interpreted as the probability that a customer will get a line within the predefined time.
For the same demand level, the capacity required to provide 99 percent QoS level is
larger than the capacity required for 95 percent QoS level. The larger the capacity or the
better the QoS level is, the higher the average costs. If the desired QoS level is set too
high, it may result in a high average cost that drives away the demand, rendering cost
recovery impossible. On the other hand, a low QoS level leads to intolerable congestion
and extreme customer dissatisfaction, driving away the demand and making cost recovery
impossible again.
Second, the non-profit ISPs have to tackle the growth of demand that calls for a
continuous capacity expansion. In general, the demand growth for dial-up lines is very
unpredictable. The market for ISPs becomes more competitive as new services and
providers enter the market. The competition may drive away the demand for the non-
profit ISPs if certain QoS level is not provided at a competitive average cost. Some
customers might select a high-price high-quality service even though low-quality service
from the non-profit ISP is provided free.
3
Third, capacity expansion in terms of Internet dial-up lines comes only in multiple
or bulk units which typically exhibit economy of scale characteristics. Non-profit ISPs
need to take into account the economies of scale in capacity expansion. Another critical
issue of capacity expansion is the timing of the expansion since the installation of
capacity requires a lead-time for testing. Further, the capacity expansion decision should
consider the seasonal fluctuations in demand. During the low demand periods, such as
summer terms for universities, the capacity expansion may be delayed to reduce the cost.
This paper proposes a Busiest-Minute Planning Model (BMPM) for the non-profit
ISPs to effectively solve the aforementioned issues. The BMPM model provides non-
profit ISPs a mechanism to determine the optimum capacity for a given QoS level. The
mechanism can predict when existing capacity becomes saturated by taking into account
the desired QoS and future demand growth. The administrator of the non-profit ISP can
then look at the average cost of the optimal capacity and compare it with other market
prices. If the price and the QoS level are competitive in the market, the service should be
continued. Otherwise, other alternatives should be considered.
The BMPM model proposed in this paper is tested using data from a non-profit
ISP - The Northeast Regional Data Center (NERDC) of the State of Florida at the
University of Florida. The results suggest that our BMPM model is very effective in
solving the pricing and capacity expansion decisions of NERDC and can be applied to
other non-profit ISPs.
The rest of the paper is structured as follows. In Section 2, we review the
literature closely related to our study. We contrast the similarities and differences
between our model and models proposed earlier in the literature. Section 3 describes the
4
background of the NERDC and its pricing and capacity decision problem in detail. We
present our BMPM model in section 4. Section 5 delineates the information about the
data set and data collection process as well as the BMPM’s forecasting model. The
estimation of BMPM’s parameters and interpretations of the results are presented in
Section 6. The paper concludes with summary of findings and the application of this
model in Spring Semester 2001 at the University of Florida.
2. Literature Review
Our work is most closely related to the literature in two interrelated fields: peak-
load pricing and Internet pricing. Faulhaber and Baumol (1988) define peak-load pricing
as “… intertemporal pattern of prices for a non-storable good or service … which vary by
time of day or season of the year …” The most important characteristic that calls for
such a pricing scheme is non-storability. This is the case in electricity, telephone, airline
seats, hotel rooms, and so on. The focus of this study, Internet dial-up capacity, is
another example of such a product. Most of these products are provided by a fixed
capacity and the demand for them fluctuates greatly. Therefore, in certain periods of time
the demand is likely to be greater than the capacity, whereas in others it may be much
lower than the capacity and a major portion of the available capacity sits idle. This
obviously results in low average utilization.
The peak load pricing problem was studied as early as at the beginning of the 20th
century. Varying prices according to peak and off-peak demand periods was found to be
effective in terms of the total welfare of all the parties and the utilization of the capacity.
Given the availability of different prices for different periods of time, the consumers

5
would self-select the best service-price combination according to their own valuations of
the service, which will balance the peak-load and off-peak demand. The two earliest
works in this field are by Clark (1911) and Bye (1926). However, it was after Boiteux
(1949) and Steiner (1957) that the literature on peak-load pricing picked up pace. The
issue has been examined in the following decades and an extensive literature on this
subject is built. Hirshleifer (1958), Williamson (1966 and 1974), Pressman (1970), Crew
and Kleindorfer (1971 and 1976), Panzar (1976), Chao (1983) and many others built
theoretical models for various inputs, technological specifications, and industries. The
reader is referred to Faulhaber and Baumol (1988, pages 586-88) for a brief review, and
Crew and Kleindorfer (1986) for an extensive review of the literature in peak-load
pricing.
Most of the aforementioned models are developed and later applied to pricing and
capacity planning of public goods such as electricity and expressways, which are often
regulated. The peak-load pricing models are applicable to many other competitive
industries where the goods has time-varying demand for a fixed capacity. Another
important aspect of these models is that the pricing structure is static (pre-determined).
Recently, the advent of related technologies and the reduction in costs makes dynamic
(real-time) pricing first suggested by Vickrey (1971) a viable option. Airlines have been
using dynamic pricing techniques for years. Dynamic pricing becomes very popular
recently and many new models proposing the use of dynamic pricing in myriad areas are
offered. Aubin, et al. (1995) report the results of an experiment where a six-rate real-time
tariff of electricity improved the welfare of most people who participated in the
experiment.

6
Our model is related to the literature on peak-load pricing in that our metric for
the measurement of demand for dial-up lines, “number of busiest minute connections”, is
analogous to peak-load demand in peak-load pricing models. As in the peak-load pricing
literature, the capacity in our model is governed by the demand level during the peak
periods. This is because, as it is extremely obvious in the electricity case,
outages/shortages are very costly; so is the shortage of dial-up lines. Our work departs
from the peak-load pricing literature in one important aspect. Our pricing scheme does
not include time-varying multiple tariffs since most ISPs do not implement such a pricing
scheme. Our focus is on the determination of what price to charge rather than what price
to charge when. As for the determination of what price to charge, our work is related to
the Internet pricing literature that we discuss next.
Internet pricing literature is relatively new as the Internet becomes popular only in
recent years. However, pricing and capacity planning has always posed a difficult and
challenging problem to both private and public firms in other industries that are similar,
with respect to underlying technology, to the Internet. One such example is the
telecommunications industry. The pricing and capacity planning models and the
evolution of services in the telecommunications industry very much resemble the
development in the Internet area (Odlyzko, 2001), see Mitchell and Vogelsang (1991) for
a thorough review of pricing theories and practices in the telecommunications industry.
In general, pricing decision has to answer at least two questions: a) what price to charge?
and b) how to charge? The first question is known in the economics literature as “price
setting” or “price determination” decision. Some of the alternative answers for this
question are marginal cost, average cost plus markup, and maximum willingness to pay.
7
Our model’s answer to the first question is “average cost pricing” since the objective of
most non-profit ISPs is cost recovery. Mitchell and Vogelsang (1991, p. 249) favor
average cost pricing by stating:
“…potential inefficiencies of marginal-cost pricing can arise because marginal-
cost prices, due to long-run excess capacity or due to economies of scale and
scope, rarely cover total cost of service…”
The answers for the second question regarding “how to charge” include but are
not limited to pure flat rate pricing, pure usage based pricing, or two-part tariff. The
literature on this subject has grown rapidly in recent years. McKnight and Boroumand
(2000) give a brief overview of recent proposals for pricing Internet services. More
detailed review of pricing and cost recovery for Internet services can be found in Reichl,
et al. (1999) and Stiller, et al. (2000). DaSilva (2000) studies the advantages and
disadvantages of both flat rate and usage-sensitive pricing schemes for QoS-enabled
networks. In general, Internet access provided at a flat fee is not the best method for
pricing dial-Internet dial-up services. Unlimited access results in excessive usage and an
ever-growing need to increase the dial-up capacity. When the capacity expansion is not
possible in the short term or not profitable at all, users have to live with low QoS levels
and experience frustratingly long waiting times. With a flat fee pricing mechanism, the
users have no incentive to plan or limit their use of the network resources. As the
network gets more and more congested and receiving a busy signal from the attempt to
dial up becomes more likely, the users will increase their usage even further in order to
keep the connection alive. This further worsens the congestion problem. This occurred

8
in the early 1990’s at the University of Florida at a computing service unit that gave free
access to 36 dial-up lines. Odlyzko (1998, p. 11) makes the same observation regarding
the modem pools of Columbia University and states that “…many users are probably
staying online for longer periods than they would if they had assurance they could get a
new connection when they wanted it.”
It is suggested that the use of congestion pricing instead of unlimited access at a
flat rate would soften the congestion problem and provide other benefits as well.
MacKie-Mason and Varian (1995) argue that the use of connect fee and usage pricing is
much more socially beneficial than a simple flat fee mechanism. Their work shows that
with flat rate pricing, the congestion may result in “Yogi Berra” equilibrium: some users
are deterred from the service due to high congestion thus the total network usage is less
than what it would be if the usage pricing was in place. Gupta, et al. (1996) examine the
use of a different mechanism that imposes a “congestion toll” on the users according to
additional delay they cause to other users. Their model includes a scheme that assigns
different priority classes to different requests. The result of their simulation study
suggests increased total net benefit compared to free access.
Although the ISPs “should” charge usage fees in order to reduce the congestion
problem, the Internet Demand Experiment (INDEX) conducted at the University of
California at Berkeley shows strong user preference for the flat rate pricing (DaSilva,
2000 and Odlyzko, 2001). The users in the experiment reduced their use of network
resources with metered usage scheme. However, they were willing to accept a flat rate
that was higher than what they would pay under the metered usage scheme. The reason
is probably more a psychological one. This is perhaps why many ISPs still provide
9
unlimited access at a flat rate as well as providing limited access plans where a flat fee
provides certain hours of access and a usage fee applies over the access time allowance.
The Northeast Regional Data Center (NERDC) of the State of Florida, the subject of this
paper, uses a form of usage based pricing that we will explain in the next section.
3. Background
The model described below is being used at a non-profit ISP - the State of
Florida’s Northeast Regional Data Center (NERDC) at the University of Florida.
NERDC is a service organization whose mission and scope in a higher education
environment is “to provide a full-service computer, networking, and information services
center shared across a broad spectrum of user groups, which realizes economies of scale
and precludes unnecessary duplication.” The major function of NERDC is to provide
full-service academic and administrative computing to the University of Florida,
University of North Florida, Florida Center for Library Automation, Shands Hospital at
UF, Florida Board of Education, and other Florida educational institutions and
governmental agencies. Further information about the NERDC services can be found at
http://nersp.nerdc.ufl.edu.
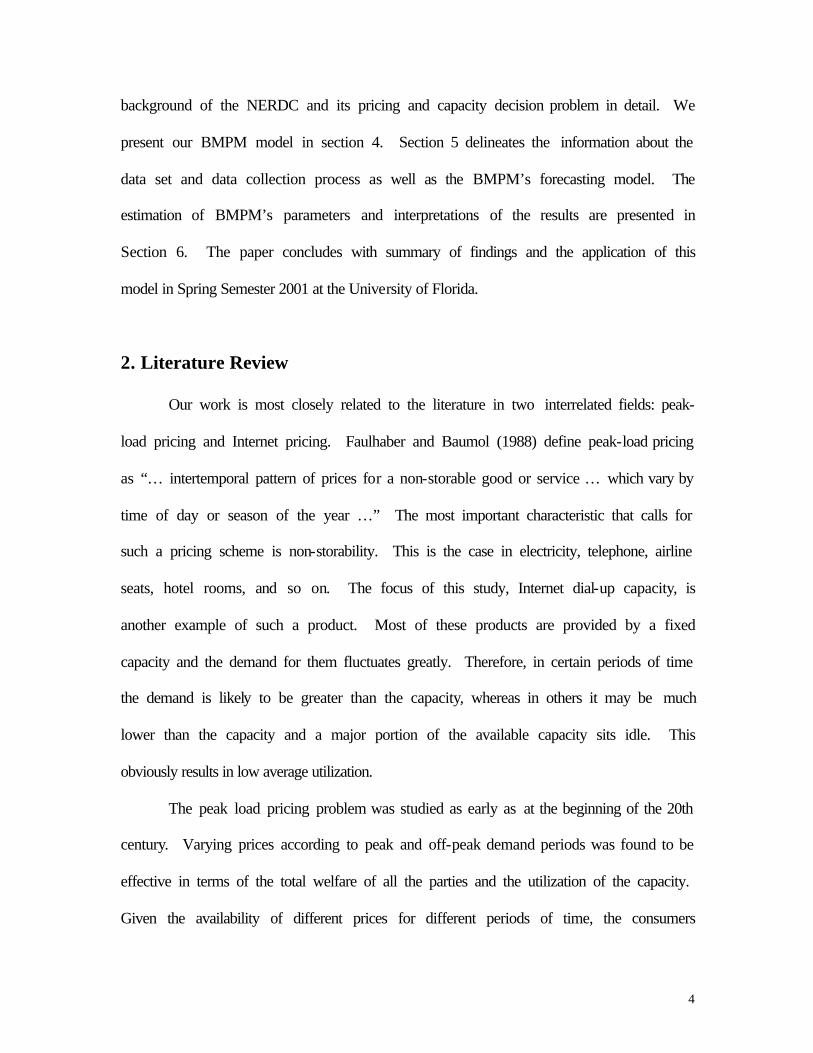
The dial-up services provided by the NERDC include access to graphic or
character-based services and access to the Internet. Anyone affiliated with the University
of Florida can connect to a dial-up line with a valid user ID and a password either from
their homes or from their offices. Figure 1 shows the details of the access path.
10
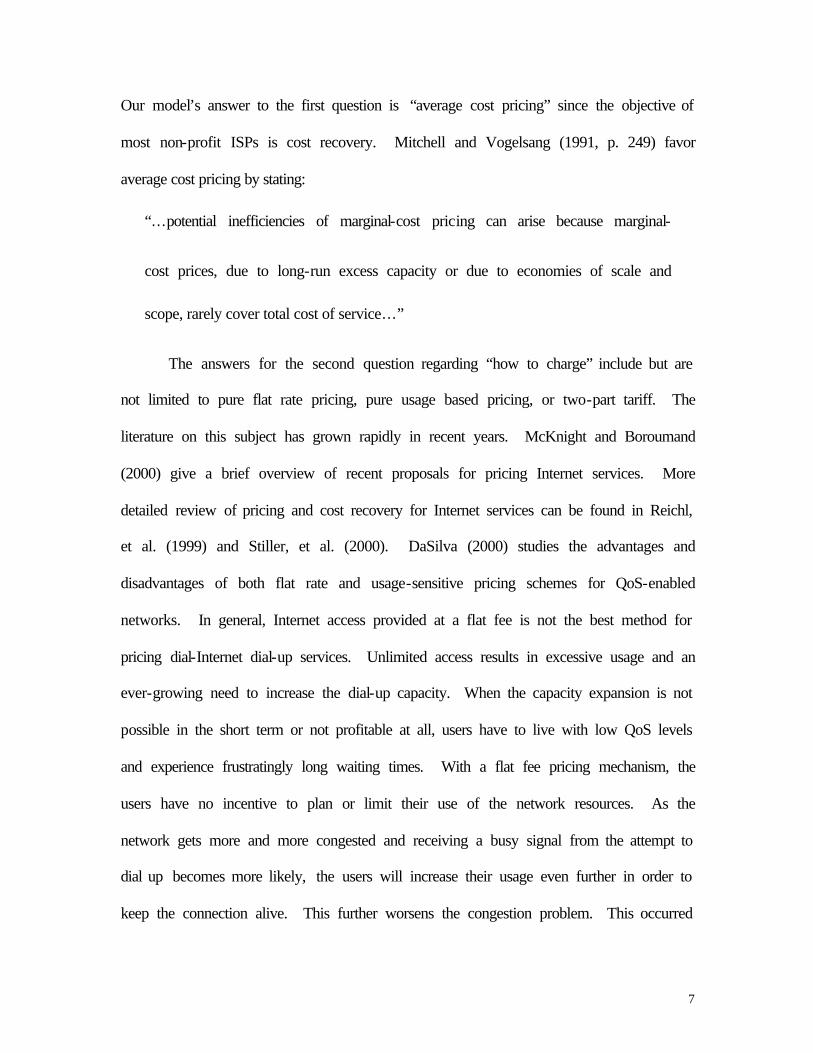
There are currently 1,330 Internet dial-up lines available, each of which provides
connection speed up to 56,000 bps (V.90). The current cost of access time (to the
Internet, other services are free) is $0.008 per minute via the local line and $0.10 per
minute via the eight 1-800 long distance lines not included in 1,330. In comparison,
AOL usage base price is $2.50 per hour or $0.042 per minute, see
http://www.aol.com/info/pricing.html.
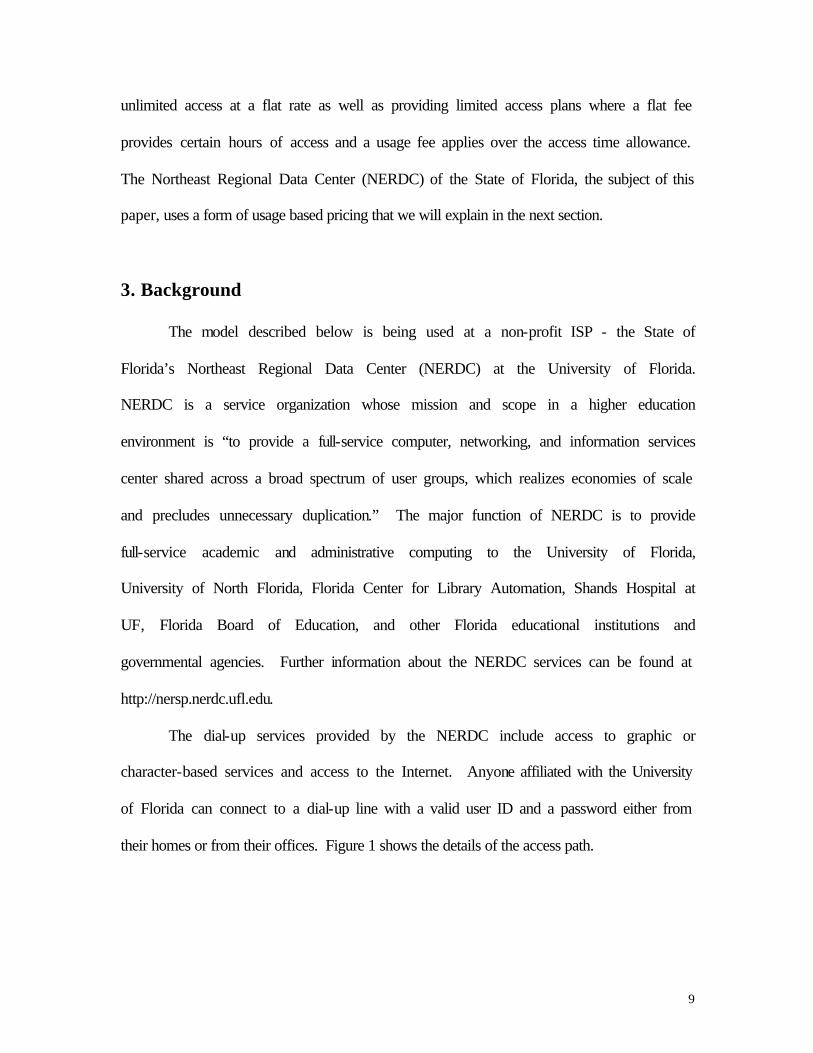
Figure 2. Daily Demand Pattern
11
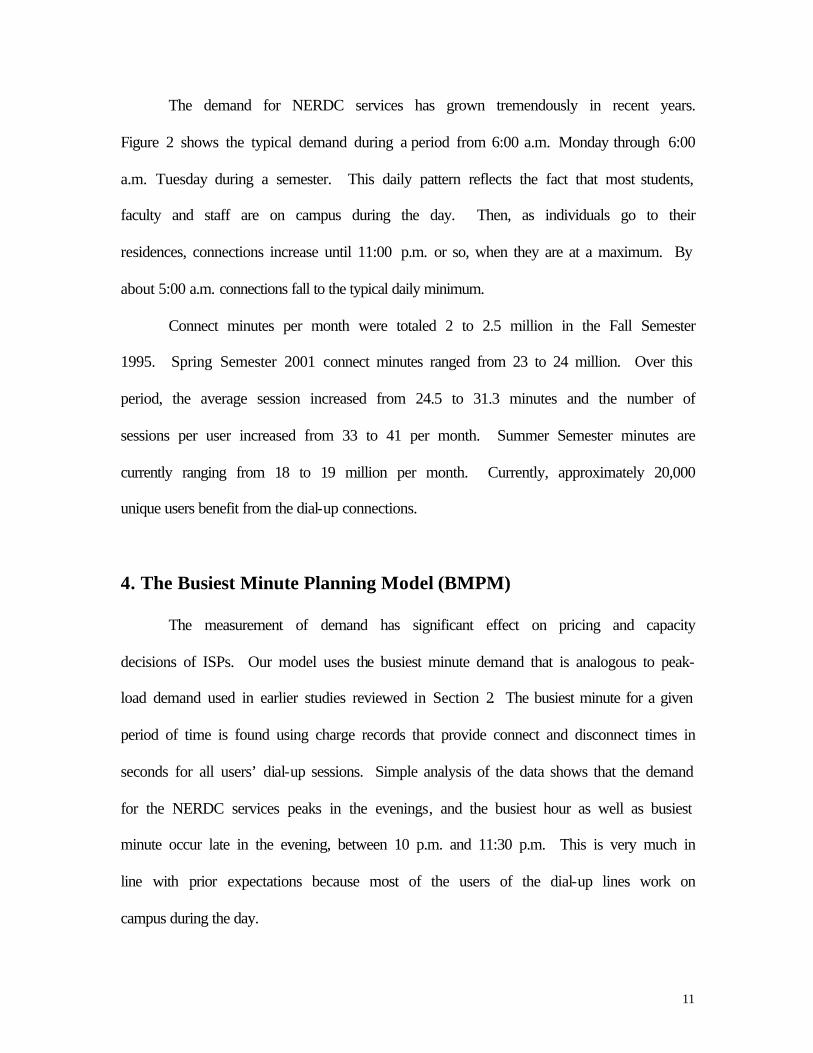
The demand for NERDC services has grown tremendously in recent years.
Figure 2 shows the typical demand during a period from 6:00 a.m. Monday through 6:00
a.m. Tuesday during a semester. This daily pattern reflects the fact that most students,
faculty and staff are on campus during the day. Then, as individuals go to their
residences, connections increase until 11:00 p.m. or so, when they are at a maximum. By
about 5:00 a.m. connections fall to the typical daily minimum.
Connect minutes per month were totaled 2 to 2.5 million in the Fall Semester
1995. Spring Semester 2001 connect minutes ranged from 23 to 24 million. Over this
period, the average session increased from 24.5 to 31.3 minutes and the number of
sessions per user increased from 33 to 41 per month. Summer Semester minutes are
currently ranging from 18 to 19 million per month. Currently, approximately 20,000
unique users benefit from the dial-up connections.
4. The Busiest Minute Planning Model (BMPM)
The measurement of demand has significant effect on pricing and capacity
decisions of ISPs. Our model uses the busiest minute demand that is analogous to peak-
load demand used in earlier studies reviewed in Section 2. The busiest minute for a given
period of time is found using charge records that provide connect and disconnect times in
seconds for all users’ dial-up sessions. Simple analysis of the data shows that the demand
for the NERDC services peaks in the evenings, and the busiest hour as well as busiest
minute occur late in the evening, between 10 p.m. and 11:30 p.m. This is very much in
line with prior expectations because most of the users of the dial-up lines work on
campus during the day.

12
Measurement of demand in short durations of peak-load is very common in
industry and literature. Peak-load demand for electricity is measured by the hour
(Schwartz, 1984). For example, prices are set every half-hour in an electricity spot
market in England and Wales (Green, 1999). Arnott, et al. (1993) measure peak-load
demand for urban highways in rush-hour traffic periods that are usually longer than an
hour. Telephone line usage is typically measured by the “hundreds of call seconds per
hour” (CCS) metric. There are 36 CCS’s in one hour (60 minutes x 60 seconds per
minute/100). In “Report of Bell Atlantic on Internet Traffic”, the CCS measure was used
to show the impact of ISPs on phone line usage. The reader is referred to Selwyn and
Laszlo (1997) for the critique of this and other regional bell operating company (RBOCs)
reports on the subject. According to Bell Atlantic report, ISP calls averaged 17.7 minutes
as compared to 4 to 5 minutes for all other calls. The ISP maximums occurred at 10 and
11 p.m. respectively, similar to the NERDC’s busiest minute pattern.
The administrators of the NERDC set a high QoS level at 99 percent, i.e., the
probability that a user will get a line within one minute should be greater than or equal to
.99. Alternatively stated, this means on average 99 people or more, out of 100, will get a
line within one minute. The one-minute figure is chosen to allow 3 attempts to establish
a dial-up connection by typical modem dialing. To achieve this QoS level, our capacity
planning model, termed the Busiest Minute Planning Model (BMPM), determines the
worst-case QoS level if a certain capacity is provided given the existing distributions of
busiest minute demand so that our model can make sure that the probability is less than 1
percent for the future demand at any given minute to exceed the capacity.
13
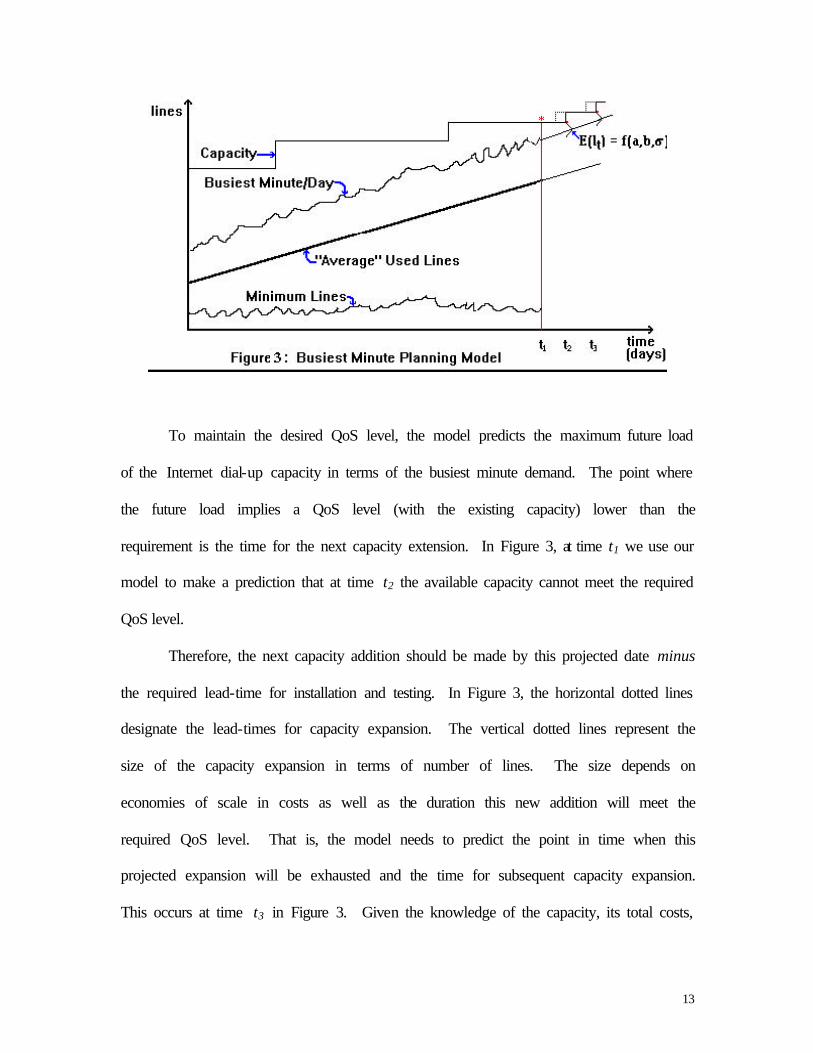
To maintain the desired QoS level, the model predicts the maximum future load
of the Internet dial-up capacity in terms of the busiest minute demand. The point where
the future load implies a QoS level (with the existing capacity) lower than the
requirement is the time for the next capacity extension. In Figure 3, at time t1 we use our
model to make a prediction that at time t2 the available capacity cannot meet the required
QoS level.
Therefore, the next capacity addition should be made by this projected date minus
the required lead-time for installation and testing. In Figure 3, the horizontal dotted lines
designate the lead-times for capacity expansion. The vertical dotted lines represent the
size of the capacity expansion in terms of number of lines. The size depends on
economies of scale in costs as well as the duration this new addition will meet the
required QoS level. That is, the model needs to predict the point in time when this
projected expansion will be exhausted and the time for subsequent capacity expansion.
This occurs at time t3 in Figure 3. Given the knowledge of the capacity, its total costs,
14
and the duration it will last, average cost will be calculated. The administrators can then
compare the average cost with other market prices and decide what price to charge and
whether or not the service is competitive.
The NERDC has been using the BMPM since 1997 to effectively address the
pricing and capacity planning decisions. The critical part of our BMPM model is its
ability to predict “the busiest minute demand” accurately. The next section describes the
demand forecasting component of the BMPM.
5. Data Set and Demand Forecasting Model
The latest BMPM model created and used by the NERDC has observations from
approximately 19 million charge records for 1544 days spanned from Fall 1996 to Fall
2000. The data were gathered from the engineers responsible for regular maintenance
and occasional upgrades of the Internet dial-up servers. To determine the busiest minute
for each of these 1544 days, we create a charge vector of size 1440 (one entry for each
minute of day) for each day. The value of the ith element of this vector for any given day
represents the number of active dial-up connections during the ith minute of that day. A
small computer program populates the vectors by scanning through the charge records
and determining if a certain dial-up session is active during a certain minute of a certain
day. Then, the maximum value for each vector is found and designated as the busiest
minute demand for the corresponding day.
The number of connections during the busiest minute was used as the dependent
variable called MAXI in our demand forecasting regression model. The GLM procedure
of SAS was used to find the best predictor for the dependent variable. To find the best
15
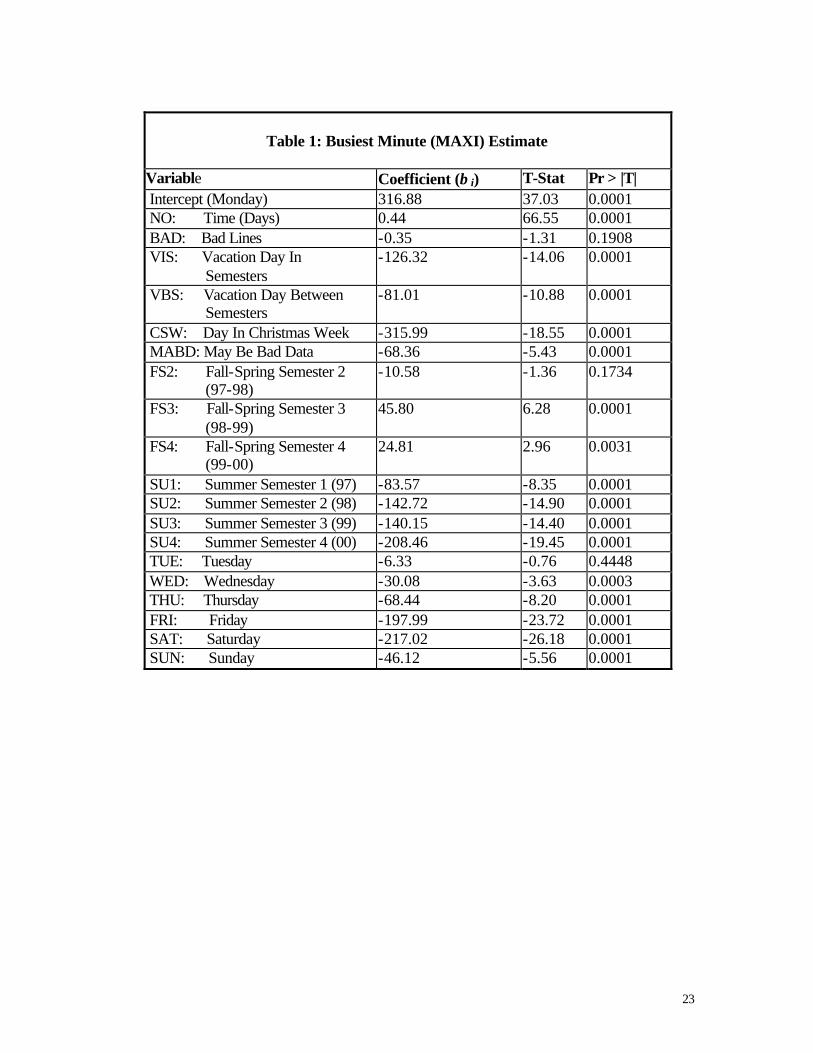
predictor for MAXI, a total of 48 variables were tried out. Out of 48 possible
independent variables only 19 survived in the final “best” model. The final model with
19 independent variables is as follows. Table 1 summarizes the meaning of independent
variables.
The Demand Forecasting Model of BMPM
0 1 2 3 4 5 6MAXI NO BAD VIS VBS CSW MABDβ β β β β β β= + + + + + +
7 8 9 10 11 12 132 3 4 1 2 3 4FS FS FS SU SU SU SUβ β β β β β β+ + + + + + +
14 15 16 17 18 19TUE WED THU FRI SAT SUNβ β β β β β ε+ + + + + + +
--- Insert Table 1 About Here ---
The surviving independent variables include a time variable (NO) to account for
general trend of demand (days 1 to 1544). Next, we have three dummy variables to
account for demand fluctuations due to vacations (VIS: Vacation Day In Semesters,
VBS: Vacation Day Between Semesters, CSW: Day In Christmas Week). These three
variables are used because the visual inspection of data indicated that the demand during
vacation days in and between semesters is lower. Three vacation types are differentiated
because the residual analysis of the model with binary (0,1) variables suggests these three
types. Additionally, when the vacation days are not differentiated the model has a
smaller R2. During fall, spring and summer semesters, the users showed different
demand patterns. To account for these differences we include 7 dummy variables.
MAXI during fall and spring semesters are similar whereas MAXI during summer
semesters is different from these two semesters. Fall 1996 - spring 1997 semester is the

16
intercept default in the model and other 7 groups are represented by the dummy variables
(FS2 to FS4 and SU1 to SU4, see Table 1).
Besides vacation days and semesters, day-of-week affects the demand. This
demand-side variable is represented by 6 dummy binary variables. Chandra and Eckberg
(1997) find similar demand patterns in their work on traffic characteristics of on-line
services. Their work observes a strong dependence of arrivals on the time of day and day
of week. They also discover that demand peaks typically between 7-10 PM daily, and on
Fridays and Saturdays, demand hits its weekly minimums. In our model, Monday, which
has the highest MAXI, is set to be the intercept default.
Finally two dummy variables (BAD: Bad Lines and MABD: May Be Bad Data)
are used to account for fluctuations in supply of dial-up lines. These two variables,
whose effect is not statistically significant, do not represent the capacity but rather
represent certain types of anomaly in the dial-up access path described in Figure 1. The
first one, Bad Lines variable represents the failure in “T1 Lines” box in Figure 1. This
does not happen very often but it is easy to detect when it happens. However, there is
another type of anomaly that occurs in “Cisco Servers” part of Figure 1. Sometimes
these servers fail, all slots become unavailable for connection and anyone who is
connected to this specific server is kicked out. This problem may not be easily detected
by the NERDC if the problem occurs during off-peak hours or not many people are
actually connected to this server. To complicate the problem, the servers fail in a
different way sometimes. This time the servers do not kick everyone who is connected
out but they become unavailable only for new connections. Additionally, anyone who
disconnects from the server cannot re-connect to the same server and his slot in this

17
server becomes unavailable as well. Since these two types of anomalies cannot be
distinguished clearly and are harder to detect, they are designated to “may be bad data”
(MABD).
6. Estimation of the Forecasting Model
The SAS estimation of the model that gave one of the best fits for the equation
above is shown in Table 1. The R2 value for this model is .875. A logarithmic model
where the natural log of MAXI is used as the dependent variable provides a better fit with
R2 value of 0.922. However, both models provide very similar forecasts. Therefore, we
will report and use the linear model subsequently to ease the analysis and the
interpretation of the coefficients in the model. In reality, the NERDC’s administrators
use the best model to make the capacity expansion and pricing decisions. The F-statistics
for the linear model is 559.76 and this value is significant at one-percent level. Therefore
the overall model is statistically significant. Table 1 also lists the t-statistics for
individual coefficients. Although most of the coefficients are statistically significant at
one-percent level some of them are not significant at any acceptable level (All but TUE
coefficient are significant in log model). However, we believe that these variables should
be kept in the model since our purpose is to predict rather than explain the changes in the
dependent variable. The model is tested for heteroskedasticity and the linear model has a
slight problem. A slight triangular shape is visible in the residual plot, which means
increase in variance in time. This is remedied and the variance of residuals became
homeskedastic when the log transformation of the dependent variable is used. The
18
normality assumption is also tested and the residuals found to be distributed normally in
the logarithmic model.
As the results presented in Table 1 show, the Christmas week has the highest
impact on the busiest minute demand. During the Christmas week the busiest minute
demand is 316 dial-up connections less than the overall average of 522 lines. Other
vacation days also have lower MAXIs; vacation days in semesters result in a MAXI that
is 126 lines lower and vacation days between semesters exhibit 81 lines reduction in
MAXI.
Each day the busiest minute demand increases by 0.44 lines. This corresponds to
additional 160 dial-up lines annually. Besides vacations and the trend, the day of week
variables have a significant effect. The busiest minute demand is the highest on Mondays
and hits its lowest level on Saturdays, on average 217 lines less than the demand on
Mondays. On Fridays, the demand is very similar to that of Saturdays and results in 197
less dial-up connections. Wednesdays, Thursdays and Sundays also have significantly
lower MAXIs. Tuesdays exhibit a similar demand pattern to Mondays. Summer
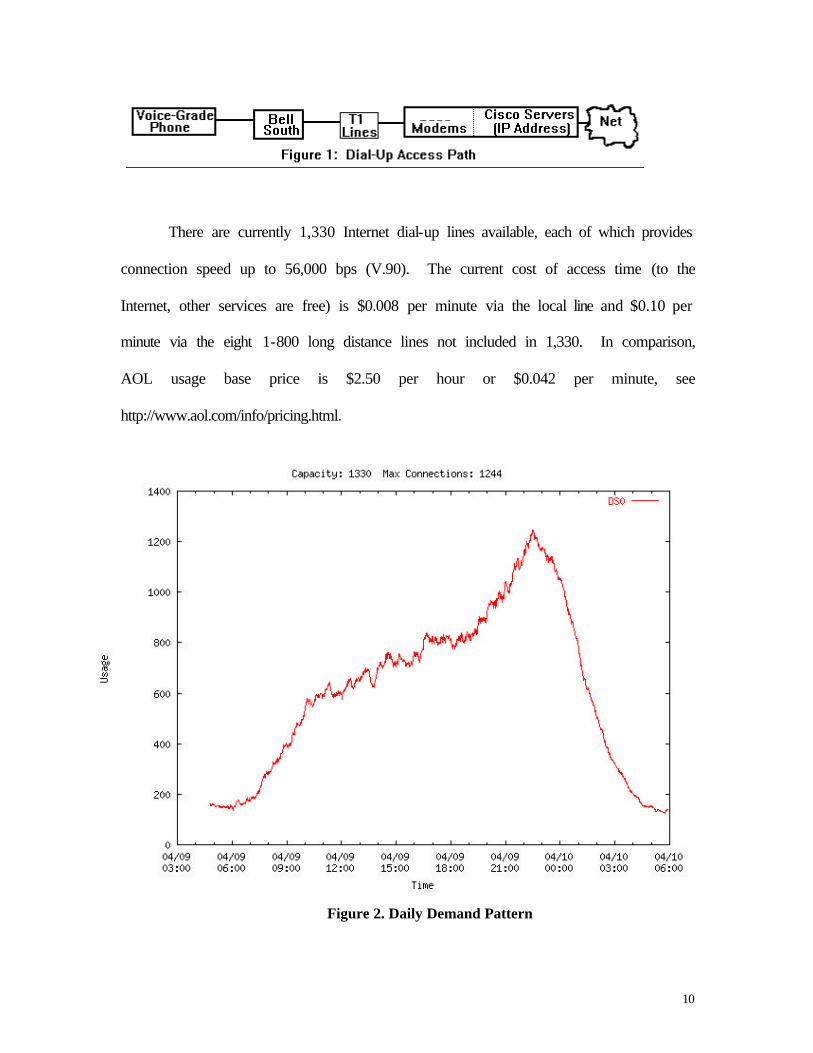
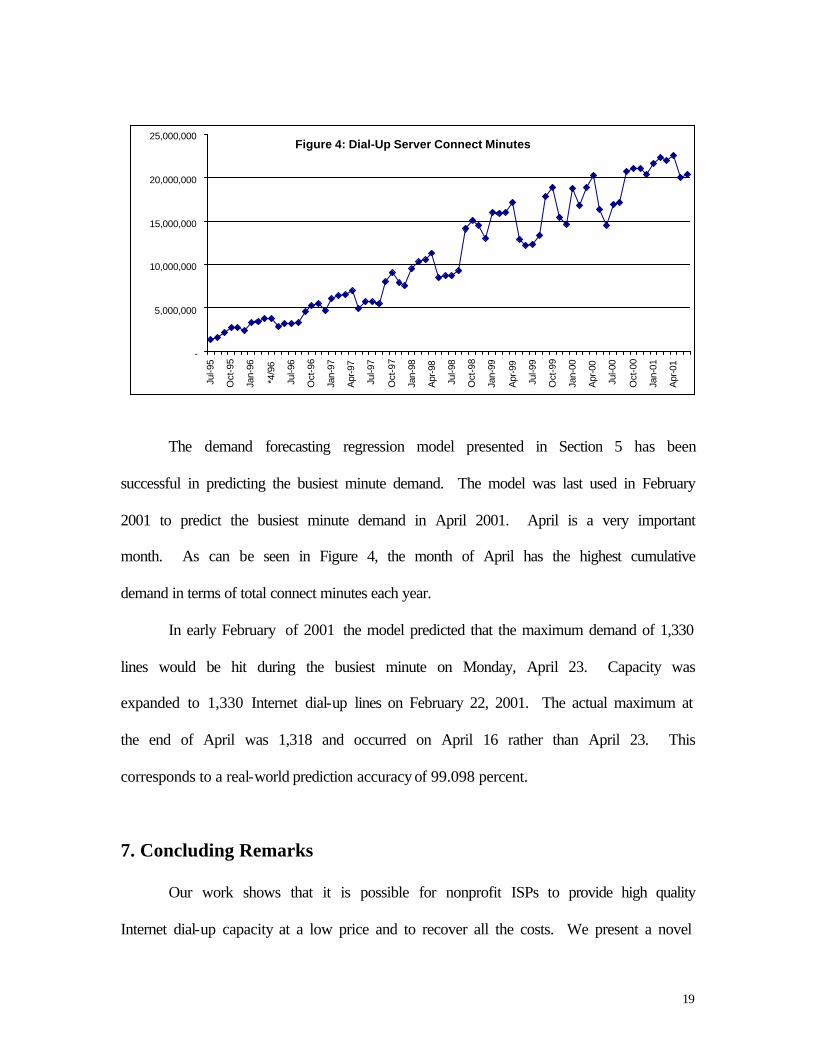
semesters have shown lower demand as shown in Figure 4.
19
The demand forecasting regression model presented in Section 5 has been
successful in predicting the busiest minute demand. The model was last used in February
2001 to predict the busiest minute demand in April 2001. April is a very important
month. As can be seen in Figure 4, the month of April has the highest cumulative
demand in terms of total connect minutes each year.
In early February of 2001 the model predicted that the maximum demand of 1,330
lines would be hit during the busiest minute on Monday, April 23. Capacity was
expanded to 1,330 Internet dial-up lines on February 22, 2001. The actual maximum at
the end of April was 1,318 and occurred on April 16 rather than April 23. This
corresponds to a real-world prediction accuracy of 99.098 percent.
7. Concluding Remarks
Our work shows that it is possible for nonprofit ISPs to provide high quality
Internet dial-up capacity at a low price and to recover all the costs. We present a novel
Figure 4: Dial-Up Server Connect Minutes
-
5,000,000
10,000,000
15,000,000
20,000,000
25,000,000
Jul-9
5
Oct
-95
Jan-
96
*4/9
6
Jul-9
6
Oct
-96
Jan-
97
Apr
-97
Jul-9
7
Oct
-97
Jan-
98
Apr
-98
Jul-9
8
Oct
-98
Jan-
99
Apr
-99
Jul-9
9
Oct
-99
Jan-
00
Apr
-00
Jul-0
0
Oct
-00
Jan-
01
Apr
-01
20
model to aid the non-profit ISPs in making pricing and capacity planning decisions. The
novelty of our model comes from the measurement of demand using “busiest minute
demand” metric. A critical component of our Busiest Minute Planning Model (BMPM)
is the forecasting model to predict the future demand for Internet dial-up capacity. It is
shown that the seasonal, weekly, and other fluctuations in demand can be effectively
modeled into the forecasting process. The model has been very successful in forecasting
the busiest minute demand for the State of Florida’s Northeast Regional Data Center
(NERDC), a non-profit ISP. The knowledge of the maximum demand and when it will
occur allows the NERDC to maintain a high QoS level with accurate capacity planning.
Since the capacity expansion decisions in our model are more informed than the
ad-hoc decisions made before the model was in place, the model also helps the NERDC
financially in recovering costs. The long-run objective to recover costs can be achieved
with ease. Better planning also helps reduce the maintenance requirements and customer
complaints.
21
References Aubin, C., Fougere, D., Husson, E., and Ivaldi, M. “Real-Time Pricing of Electricity for Residential Customers: Econometric Analysis of an Experiment,” Journal of Applied Econometrics (10), 1995, pp. S171-S191. Boiteux, M., “La tarification des demandes en point: application de la theorie de la vente
au cout marginal,” Revue Generale de l’electricite (58), August 1949, pp. 321-340; English translation: “Peak Load Pricing,” Journal of Business (33), April 1960, pp. 157-179.
Bye, R. T., “The Nature of Fundamental Elements of Costs,” Quarterly Journal of Economics (41:4), November 1926, pp. 30-62.
Chandra, K. and Eckberg, A.E., "Traffic Characteristics of On-Line Services," Proceedings of the 2nd IEEE Symposium on Computers and Communications, Alexandria, Egypt, July 1997, pp. 17-22.
Chao, H. P., “Peak Load Pricing and Capacity Planning with Demand And Supply Uncertainty,” Bell Journal of Economics (14:1), 1983, pp. 179-190.
Clark, J. M., “Rates for Public Utilities,” American Economic Review (1:3), September 1911, pp. 473-487.
Crew, M. A., and Kleindorfer, P. R., “Marshall and Turvey on Peak Loads or Joint Product Pricing,” Journal of Political Economy (79:6), 1971, pp. 1369-1377.
Crew, M. A., and Kleindorfer, P. R., “Peak Load Pricing with a Diverse Technology,” Bell Journal of Economics (7), Spring 1976, pp. 207-231.
Crew, M. A., and Kleindorfer, P. R., The Economics of Public Utility Regulation, MIT Press, 1986, Cambridge, MA.
DaSilva, L. A., “Pricing for QoS-Enabled Networks: A Survey,” IEEE Communication Surveys and Tutorials, Second Quarter 2000, pp. 2-8.
Faulhaber, G. R., and Baumol, W. J., “Economists as Innovators: Practical Products of Theoretical Research,” Journal of Economic Literature (26:2), June 1988, pp. 577-600.
Green, R., “The Electricity Contract Market in England and Wales,” Journal of Industrial Economics (47:1), March 1999, pp107-124.
Gupta, A., Stahl, D. O., and Whinston, A. B. Pricing of Services on the Internet, Technical report, University of Texas at Austin, 1996, Available online at <http://cism.bus.utexas.edu/alok/pricing.html>
Hirshleifer, J., “Peak Loads and Efficient Pricing: Comment,” Quarterly Journal of Economics (72:3), August 1958, pp. 451-462.
MacKie-Mason, J. K., and Varian, H. R. "Pricing Congestible Network Resources," IEEE Journal on Selected Areas in Communications (13:7), September 1995, pp. 1141-1149. McKnight, L. W., and Boroumand, J., “Pricing Internet Services: Proposed
Improvements,” IEEE Computer, March 2000, pp.108-109. Mitchell, B. M. and Vogelsang, I., Telecommunications Pricing, Cambridge University
Press, 1991, Cambridge, UK Odlyzko, A., “The Economics of the Internet: Utility, Utilization, Pricing, and Quality of
Service,” AT&T Labs Internal Report, Florham Park, NJ, July 1998, Available at <http://www.research.att.com/~amo/doc/internet.economics.pdf >
22
Odlyzko, A., “Internet Pricing and the History of Communications,” Internet Services, Lee McKnight and John Wroclawski, eds., MIT Press, 2001, Cambridge, MA.
Panzar, J. C., “A Neoclassical Approach to Peak Load Pricing,” Bell Journal of Economics (7), Autumn 1976, pp. 521-530.
Pressman, I., “A Mathematical Formulation of Peak Load Pricing Problem,” Bell Journal of Economics and Management Science (1), Autumn 1970, pp. 304-326.
Reichl, P., Leinen, S., and Stiller, B., “A Practical Review of Pricing and Cost Recovery for Internet Services,” Proceedings of IEW’9: 2ndInternet Economics Workshop, Berlin, Germany, May 28-29, 1999.
Schwartz, P., “The Estimated Effects on Industry of Time-of-Day Demand and Energy Electricity Prices,” Journal of Industrial Economics (32:4), June, 1984, pp. 523-539. Selwyn, L. L., and Laszlo, J. W. The Effect of Internet Use on the Nation's Telephone
Network, January 22, 1997, Available online at <http://www.itic.org/policy/eti/eti_part1.html>
Steiner., P. O., “Peak Loads and Efficient Pricing,” Quarterly Journal Economics (71:4), November 1957, pp. 585-610.
Stiller, B., Reichl, P., and Leinen, S., “Pricing and Cost Recovery for Internet Services: Practical Review, Classification, and Application of Relevant Models,”, Netnomics - Economic Research and Electronic Networking (2:1), 2000.
Vickrey, W., “Responsive Pricing of Public Utility Services,” Bell Journal of Economics and Management Science (2:1), 1971, pp. 337-346.
Williamson, O. E., “Peak Load Pricing and Optimal Capacity Under Indivisibility Constraints ,” American Economic Review (56:4), September 1966, pp. 810-827.
Williamson, O. E., “Peak Load Pricing: Some Further Remarks,” Bell Journal of Economics and Management Science (5), Spring 1974, pp. 223-228.
23
Table 1: Busiest Minute (MAXI) Estimate
Variable Coefficient (β i) T-Stat Pr > |T| Intercept (Monday) 316.88 37.03 0.0001 NO: Time (Days) 0.44 66.55 0.0001 BAD: Bad Lines -0.35 -1.31 0.1908 VIS: Vacation Day In Semesters
-126.32 -14.06 0.0001
VBS: Vacation Day Between Semesters
-81.01 -10.88 0.0001
CSW: Day In Christmas Week -315.99 -18.55 0.0001 MABD: May Be Bad Data -68.36 -5.43 0.0001 FS2: Fall-Spring Semester 2 (97-98)
-10.58 -1.36 0.1734
FS3: Fall-Spring Semester 3 (98-99)
45.80 6.28 0.0001
FS4: Fall-Spring Semester 4 (99-00)
24.81 2.96 0.0031
SU1: Summer Semester 1 (97) -83.57 -8.35 0.0001 SU2: Summer Semester 2 (98) -142.72 -14.90 0.0001 SU3: Summer Semester 3 (99) -140.15 -14.40 0.0001 SU4: Summer Semester 4 (00) -208.46 -19.45 0.0001 TUE: Tuesday -6.33 -0.76 0.4448 WED: Wednesday -30.08 -3.63 0.0003 THU: Thursday -68.44 -8.20 0.0001 FRI: Friday -197.99 -23.72 0.0001 SAT: Saturday -217.02 -26.18 0.0001 SUN: Sunday -46.12 -5.56 0.0001