p e r f o r m a n c e measuring results of organizational performance 1 lesson 05 performance...
TRANSCRIPT
P e r f o r m a n c e
Performanc
Measuring Results of Organizational Performance 1
Lesson 05 Performance Measurement
Lesson 05 Performance Measurement

P e r f o r m a n c e
Performanc
Measuring Results of Organizational Performance
So, what’s a good measure? “When an airline became concerned that a crucial aspect of customer
satisfaction concerned how quickly the passengers retrieved their luggage after landing, it set an objective to improve baggage delivery and introduced a new performance measure. The day after this was introduced, senior managers watched in astonishment as one of the teams of baggage handlers unloaded the cases from an incoming flight.
Initially, the team members stood chatting together as they waited for the tractor to bring the baggage trucks from the aircraft. When it arrived, the team leader grabbed one small bag and threw it to the youngest member of the team. The youth caught the bag and sprinted across the tarmac with it. He reached the conveyor belt, threw on the bag, hit the start button and then sauntered back to the group. None of the others had moved. They continued chatting for several more minutes before eventually starting to unload the rest of the bags.”
(Bourne, M. and Neely, A., 2002)Question: How had the measure been operationally defined?Answer: The time taken for the first bag to hit the conveyor after the aircraft had landed. Outcome: Is that what the customer wanted?
P e r f o r m a n c e
Performanc
Measuring Results of Organizational Performance
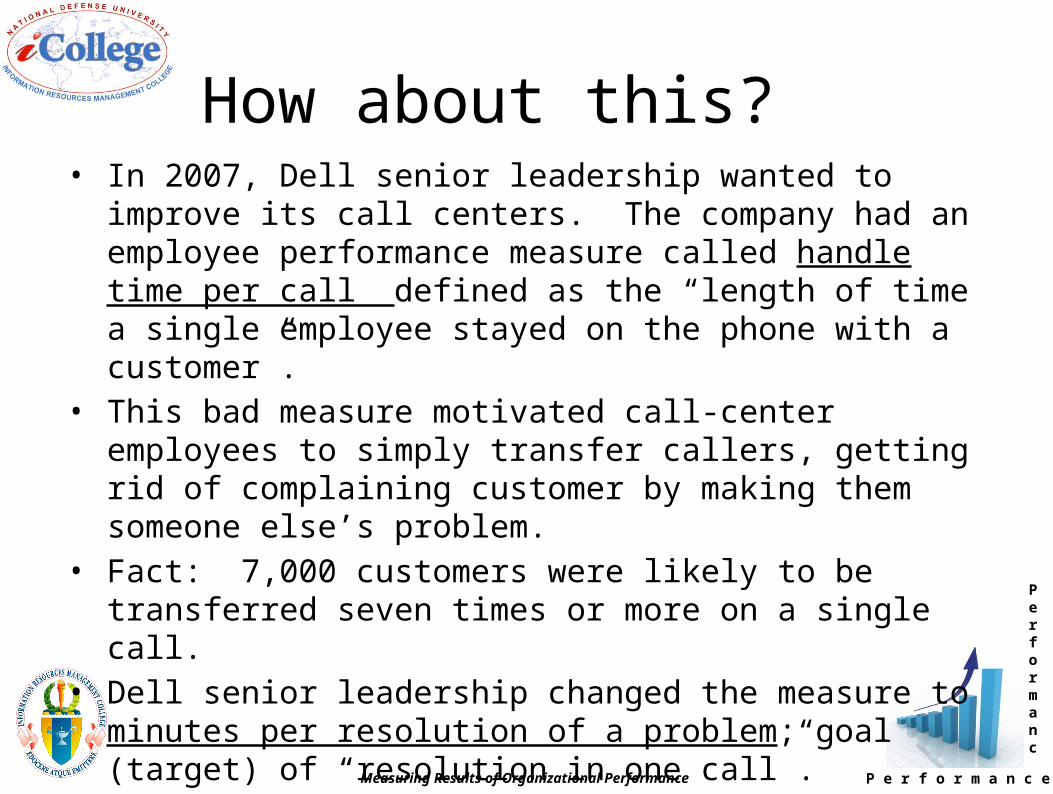
How about this? • In 2007, Dell senior leadership wanted to improve its call centers.
The company had an employee performance measure called handle time per call defined as the “length of time a single employee stayed on the phone with a customer”.
• This bad measure motivated call-center employees to simply transfer callers, getting rid of complaining customer by making them someone else’s problem.
• Fact: 7,000 customers were likely to be transferred seven times or more on a single call.
• Dell senior leadership changed the measure to minutes per resolution of a problem; goal (target) of “resolution in one call”.
(Jarvis, 2009, What Would Google Do?)

P e r f o r m a n c e
Performanc
Measuring Results of Organizational Performance
How about you?
Any bad measures stories?
P e r f o r m a n c e
Performanc
Measuring Results of Organizational Performance 5
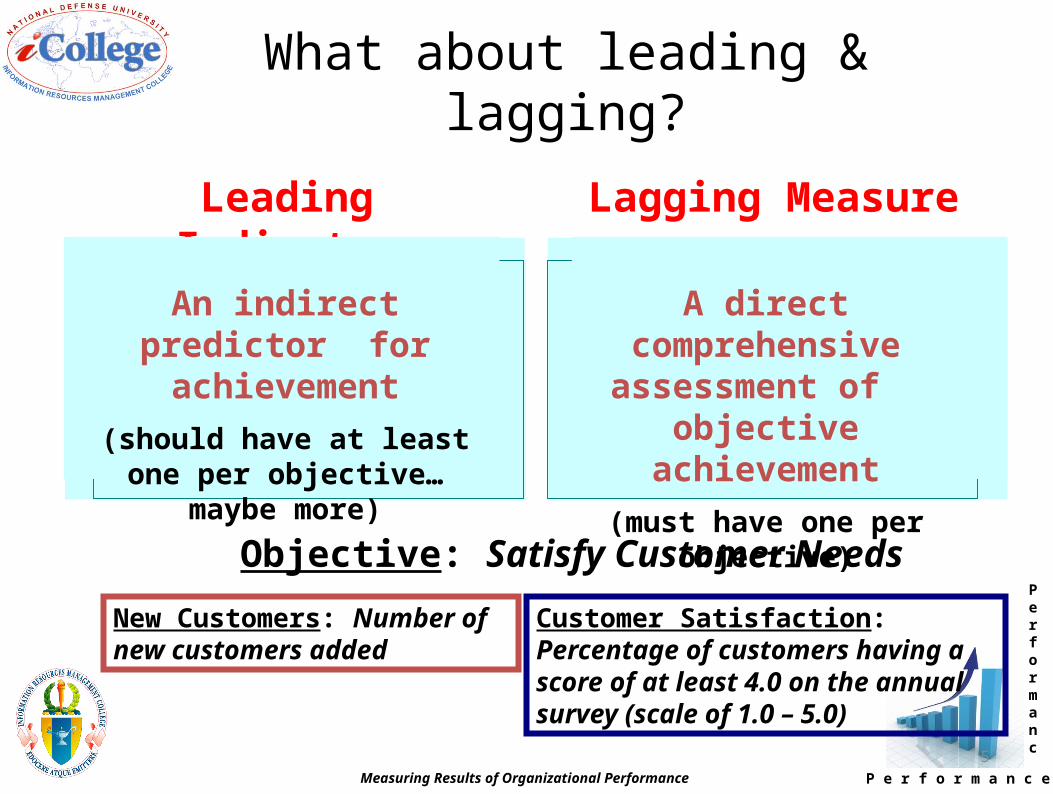
What about leading & lagging?
Leading Indicator Lagging Measure
A direct comprehensive assessment of
objective achievement
(must have one per objective)
An indirect predictor for achievement
(should have at least one per objective…
maybe more)
Objective: Satisfy Customer Needs
Customer Satisfaction: Percentage of customers having a score of at least 4.0 on the annual survey (scale of 1.0 – 5.0)
New Customers: Number of new customers added

P e r f o r m a n c e
Performanc
Measuring Results of Organizational Performance 6
Measures vs. Indicators
INDICATOR MEASURE
Number of customer Customercomplaints Satisfaction
Gain in market share
Number of new Not used customers added
Lag (direct assessment of actual performance)
Objective: Satisfy Customer Needs
Lead (indirect predictor of performance)

P e r f o r m a n c e
Performanc
Measuring Results of Organizational Performance
So, is this a good lag indicator?
P e r f o r m a n c e
Performanc
Measuring Results of Organizational Performance 8
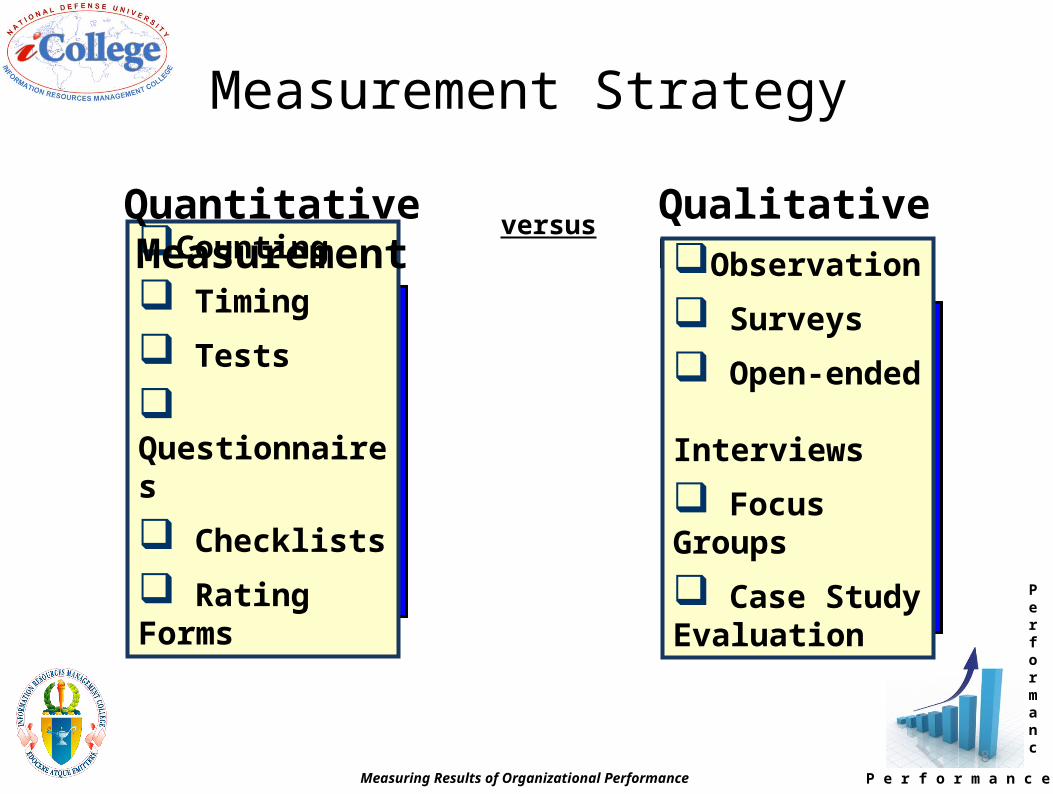
Measurement Strategy
Counting
Timing
Tests
Questionnaires
Checklists
Rating Forms
Quantitative Measurement
Qualitative Measurement
versus
Observation
Surveys
Open-ended Interviews
Focus Groups
Case Study Evaluation
P e r f o r m a n c e
Performanc
Measuring Results of Organizational Performance 9
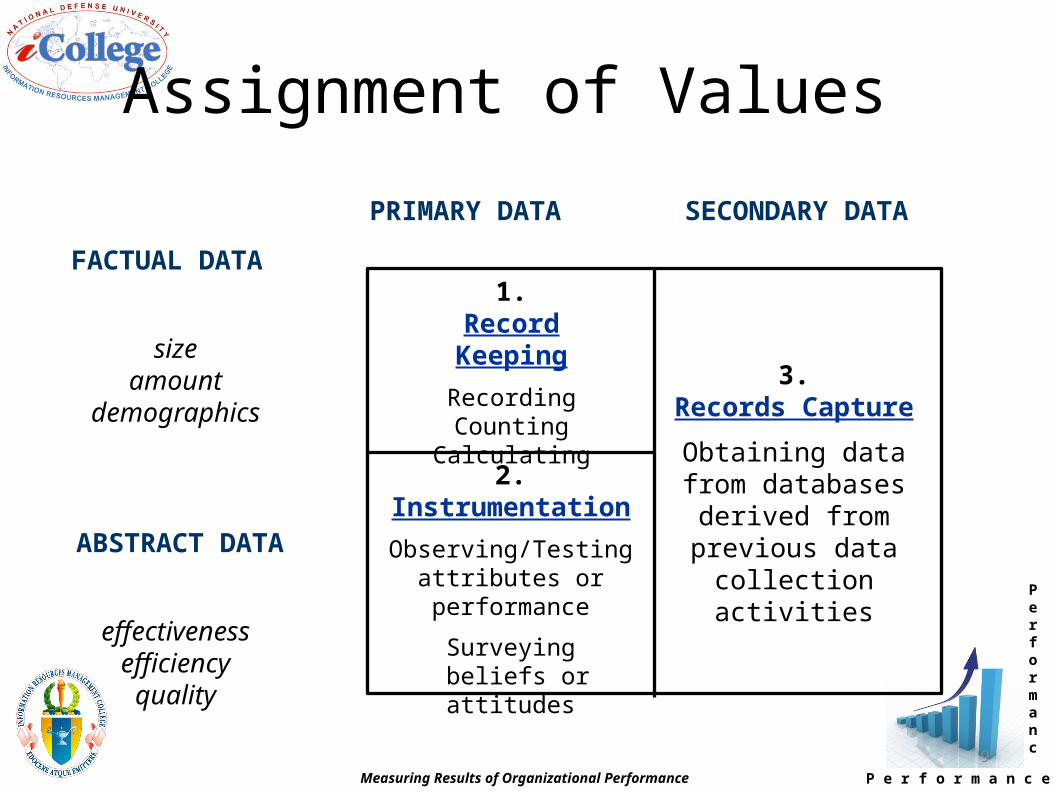
Assignment of Values
FACTUAL DATA
sizeamount
demographics
ABSTRACT DATA
effectivenessefficiencyquality
PRIMARY DATA SECONDARY DATA
3.Records Capture
Obtaining data from databases
derived from previous data
collection activities
1.Record Keeping
RecordingCounting
Calculating2.
Instrumentation
Observing/Testing attributes or performance
Surveying beliefs or attitudes
P e r f o r m a n c e
Performanc
Measuring Results of Organizational Performance 10
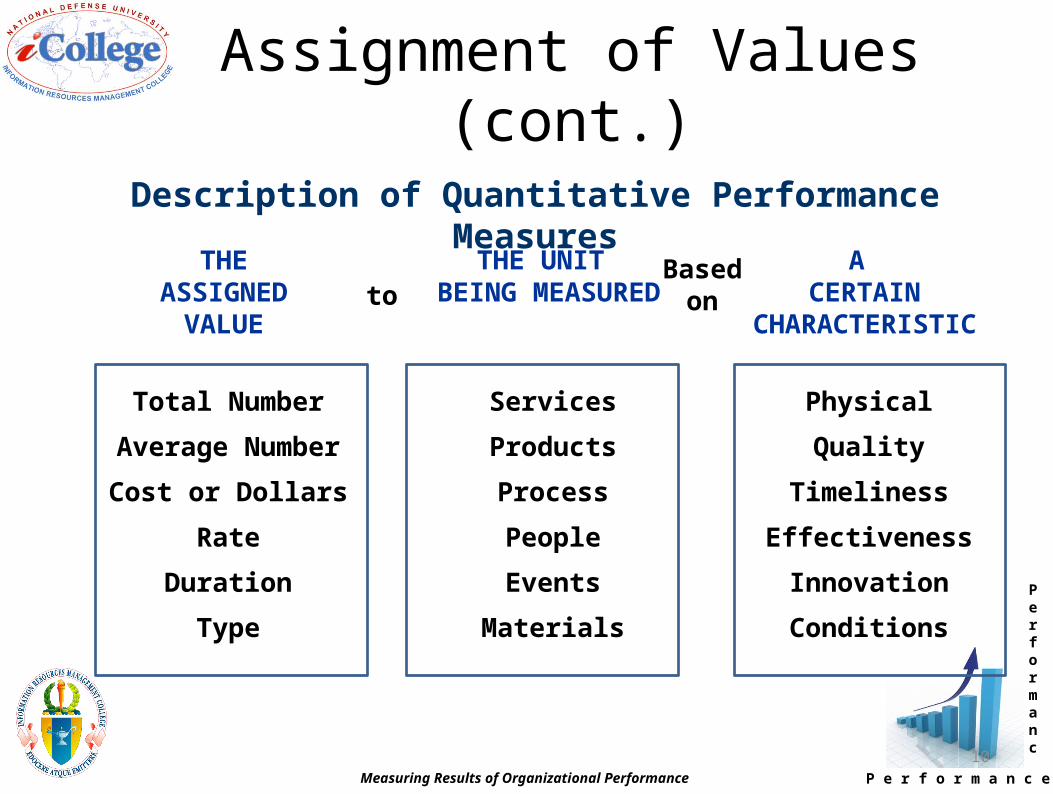
Assignment of Values (cont.)
THEASSIGNED
VALUE
Total Number
Average Number
Cost or Dollars
Rate
Duration
Type
THE UNIT BEING
MEASURED
Services
Products
Process
People
Events
Materials
A CERTAIN
CHARACTERISTIC
Physical
Quality
Timeliness
Effectiveness
Innovation
Conditions
toBased on
Description of Quantitative Performance Measures

P e r f o r m a n c e
Performanc
Measuring Results of Organizational Performance 11
RATIO
Description of Quantitative Performance MeasuresONE MEASURE ANOTHERof to
Productivity or Efficiency
Total number of products
produced by an employee
Total labor hours or
resources consumed by
that employee
= ÷
= ÷
= ÷
Percentage
Total number of units having a
particular characteristic
Total number of units
independent of the
characteristic
Cost-benefits Costs avoided or dollars
gained by a program
Dollars spent or invested in that
program
Assignment of Values (cont.)

P e r f o r m a n c e
Performanc
Measuring Results of Organizational Performance
12
WEIGHT
Description of Quantitative Performance MeasuresMEASURE WEIGHTED SCORE
20
10
2
1
No. Fatalities due
to on-job injury
No. Terminationsdue to on-job
injury
No. Lost work days due to on-
job injury
No. restricted work days due to on-job injury
20 X No.FATALITIES
10 x No.TERMINATIONS
2 x No.LOST WORK
DAYS
1 x No.RESTRICTED WORK DAYS
X =
X
X
X
=
=
=
Assignment of Values (cont.)
P e r f o r m a n c e
Performanc
Measuring Results of Organizational Performance 13
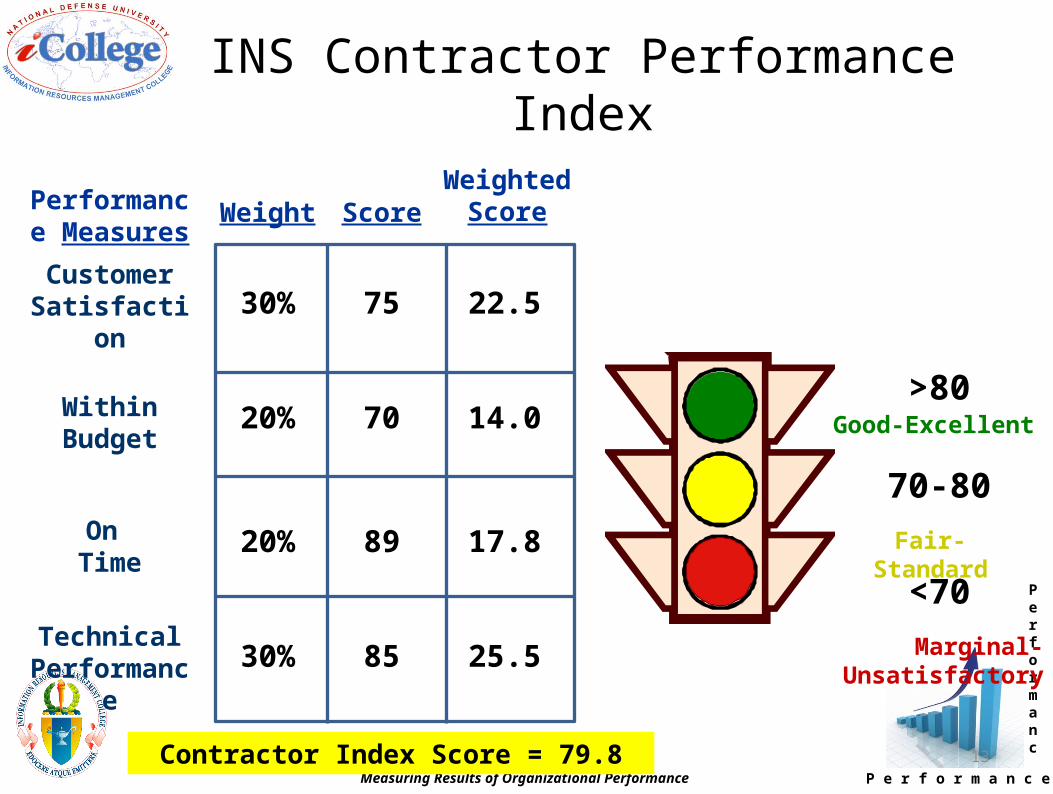
INS Contractor Performance Index
Performance
Measures
Weight ScoreWeighted
Score
Customer Satisfaction
Within Budget
On Time
Technical Performance
30%
20%
20%
30%
75
70
89
85
22.5
14.0
17.8
25.5
Good-Excellent
Fair-Standard
Marginal-Unsatisfactory
Contractor Index Score = 79.8
>80
70-80
<70

P e r f o r m a n c e
Performanc
Measuring Results of Organizational Performance 14
Operational Definitions
At the Very Least To Understand Even More
Name & intended meaning
Operational means for collecting data
Rules/procedures for assigning values
Owner / POC
Frequency of collection
(Name of instrument)
Data Collectors
Sampling Technique
Verification Technique
Goals or Targets
Data Analysis Guidelines
Use of Information

P e r f o r m a n c e
Performanc
Measuring Results of Organizational Performance
Op Def Template Balanced Scorecard Operational Definition Template Perspective: Customer Measure Number / Name: C01 / Customer Satisfaction Owner: J.Doe, VP Customer Relations Objective: (brief verb noun statement) Increase customer loyalty Strategic Goal: Revenue Growth Description: The customer satisfaction rating measures the percentage of surveyed customers who are satisfied with our products and services. Research indicates that satisfied customers make purchases more frequently and recommend our products/services to others. Hence, increasing customer satisfaction will help us achieve our strategy of revenue growth. A satisfied customer is one whose overall rating averages out greater than 4.5 on a 5.0 scale on our customer satisfaction survey. Lag/Lead: Lag Frequency: Monthly Unit Type: Percentage Polarity: High percentages are good. Formula: Number of monthly survey respondents who provide an overall average assessment rating of 4.5 on a 5.0 scale divided by the total number of surveys completed. Data Source: Our survey company, XYZ, provides data for this measure each month. XYZ performs a random survey of our customers and provides the results electronically to our Customer Relations department. Data are contained in MS Excel spreadsheets (CUSTSRVY.xls line 22). Data is available the 10th business day following the end of each month. Data Quality: High—received automatically from third-party vendor Data Collector: Frank Doe, Customer Relations Dept. Baseline: Our most recent data from XYZ indicates a customer satisfaction rating of 54%
Target: > 80% by 1Q 2011 Target by calendar Quarter : Q1 2010: 59% Q2 2010: 65% Q3 2010: 72% Q4 2010 : 80%
Target Rational: Achieving customer satisfaction is critical to our revenue growth strategy. Research shows top performing organizations in our field achieve greater than 80% customer satisfaction on a routine basis (80% of the time). We can achieve the quarterly increases via our initiatives and stronger focus on customer satisfaction.
Initiatives: Cost: 1. Customer appreciation events ~ $150K 2. Customer product training ~ $100K 3. Create a positive website experience ~ $200K 4. Create multi-channel inbound/outbound capabilities that improve customer support / response
~ $750K
Total Cost for Initiatives ~ $1.2M Niven, 2006.

P e r f o r m a n c e
Performanc
Measuring Results of Organizational Performance
• Department of Education Troops-to Teachers Program
– Percentage of Troops-to-Teachers who remain in teaching for 3 or more years after placement in a teaching position in a high-need school (Outcome/Output)
– Outcome
• Department of Health and Human Services Office of Child Support Enforcement
– Total dollars collected per $1 of expenditures (Outcome/Output)
– Output
• Patent and Trademark Office
– Average Patent Pendency (Outcome/Output) [Patent pendency is the estimated time in months for a complete review of a patent application, from the filing date to issue or abandonment of the application]
– Output
• Food and Drug Administration
– Increase consumer understanding of diet-disease relationships, and in particular, the relationships between dietary fats and the risk of coronary heart disease, the leading cause of death in the US (Outcome/Output)
– Outcome
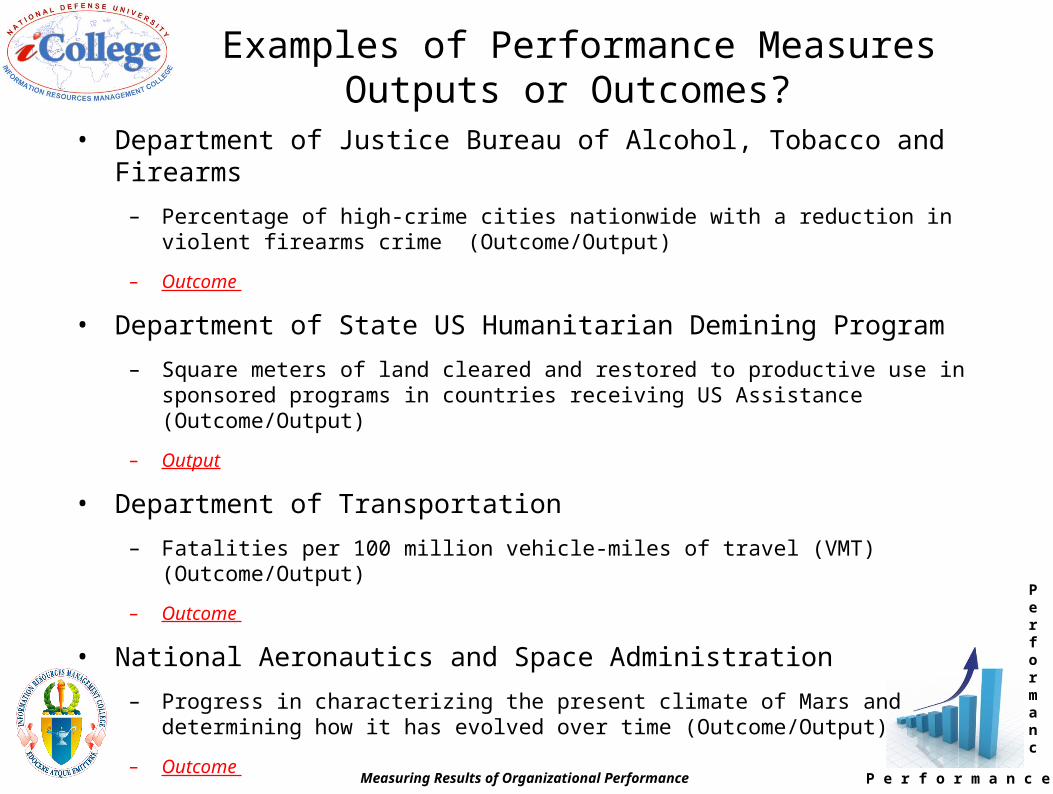
Examples of Performance MeasuresOutputs or Outcomes?
P e r f o r m a n c e
Performanc
Measuring Results of Organizational Performance
• Department of Justice Bureau of Alcohol, Tobacco and Firearms
– Percentage of high-crime cities nationwide with a reduction in violent firearms crime (Outcome/Output)
– Outcome
• Department of State US Humanitarian Demining Program
– Square meters of land cleared and restored to productive use in sponsored programs in countries receiving US Assistance (Outcome/Output)
– Output
• Department of Transportation
– Fatalities per 100 million vehicle-miles of travel (VMT) (Outcome/Output)
– Outcome
• National Aeronautics and Space Administration
– Progress in characterizing the present climate of Mars and determining how it has evolved over time (Outcome/Output)
– Outcome
Examples of Performance MeasuresOutputs or Outcomes?

P e r f o r m a n c e
Performanc
Measuring Results of Organizational Performance 18
Criteria for Effective Measures
VALID RELIABLE
IMPORTANT CREDIBLEMULTI-
DIMENSIONAL
ECONOMIC TIMELY SIMPLETAMPER- PROOF
Accurate
Relevant
Practical

P e r f o r m a n c e
Performanc
Measuring Results of Organizational Performance 19
Which Measure Should You Use?
1. No. community colleges receiving grants. (Agency records)
2. Average time to complete review of grant application. (Agency records)
3. No. visits to community colleges to discuss and review programs. (Employee trip/expense reports)
4. No. colleges visited at least 3 times per year. (Employee trip/expense reports)
5. No. spaces offered to students. (Community College reports)
6. Cost per space made available. (#5 divided by grant amount)
7. No. students completing training. (Community College reports)
8. Cost per student completing program. (#7 divided by grant amount)
9. Average student-to-teacher ratio. (Community College reports)
10. No. Students moving up one grade level. (Test scores)
11. % of students who meet individual training plan goals. (Employee reports)
12. % of students who reported that they received benefit from program. (Existing client survey)
13. % of students who take vocational training classes within 4 months of program completion. (New client survey) 14. % of students who successfully complete vocational skills training within 1 year of program completion. (New client survey) 15. % of students who obtain employment within 1 year of program completion. (New client survey) 16. % of students who retain employment within 2 years of program completion. (New client survey) 17. % of students who leave social assistance programs within 1 year of program completion. (Agency records)
Agency Mission:Provide educationally disadvantaged adults with basic literacy, arithmetical, and other life skills training in order to help them gain access to vocational skills training and job opportunities.
Relevant ?
Practical ?
Accurate ?