p g 2016 annual report · pdf filep&g 2016 annual report (1) diluted net earnings per...
TRANSCRIPT

P&G 2016 Annual Report

(1) Diluted net earnings per common share are calculated based on net earnings attributable to Procter & Gamble. (2) These results exclude net sales in Corporate.
VARIOUS STATEMENTS IN THIS ANNUAL REPORT, including estimates, projections, objectives and expected results, are “forward-looking statements” within the meaning of the Private Securities Litigation Reform Act of 1995, Section 27A of the Securities Act of 1933 and Section 21E of the Securities Exchange Act of 1934 and are generally identified by the words “believe,” “expect,” “anticipate,” “intend,” “opportunity,” “plan,” “project,” “will,” “should,” “could,” “would,” “likely” and similar expressions. Forward-looking statements are based on current assumptions that are subject to risks and uncertainties that may cause actual results to differ materially from the forward-looking statements, including the risks and uncertainties discussed on pages 2–6 of this Annual Report. We undertake no obligation to update or revise publicly any forward-looking statements.
Brand names referenced in this Annual Report are trademarks of The Procter & Gamble Company or one of its subsidiaries. All other brand names are trademarks of their respective owners.
2016 NET SALES BY GEOGRAPHIC REGION
Grooming
Health Care
Fabric and Home Care
Beauty
Baby, Feminine and Family Care
Developed Markets
Developing Markets
2016 NET SALES BY BUSINESS SEGMENT(2)
FINANCIAL HIGHLIGHTS (UNAUDITED)Amounts in billions, except per share amounts
2016 NET SALES BY MARKET MATURITY
North America
44%
Europe
23%
Greater China
8%
Asia Pacific
9%India, Middle East & Africa (IMEA)
8%
Latin America
8%
2016 2015 2014 2013 2012
Net sales $65.3 $70.7 $74.4 $73.9 $73.1
Operating income 13.4 11.0 13.9 13.1 12.5
Net earnings attributable to Procter & Gamble 10.5 7.0 11.6 11.3 10.8
Net earnings margin from continuing operations 15.4% 11.7% 14.3% 14.0% 12.1%
Diluted net earnings per common share from
continuing operations(1)
$3.49 $2.84 $3.63 $3.50 $2.97
Diluted net earnings per common share(1) 3.69 2.44 4.01 3.86 3.66
Dividends per common share
$2.66 $2.59 $2.45 $2.29 $2.14
65%35%
18%
28%
11%
32%
11%
NET SALES ($ BILLIONS)
2016
2015
2014
2013
2012
$74.4
$70.7
$73.9
$73.1
$65.3
OPERATING CASH FLOW ($ BILLIONS)
2016
2015
2014
2013
2012
$15.4
$14.6
$14.0
$14.9
$13.3
DILUTED NET EARNINGS (PER COMMON SHARE)
$3.692016
2015
2014
2013
2012
$2.44
$4.01
$3.86
$3.66

Dear Shareholders,Fiscal 2016 was a year of progress in our journey to return P&G’s results to a balance of top-line growth, bottom-line growth and cash generation. We increased investments in innovation, advertising and sales coverage to enhance our long-term prospects for faster, sustainable sales growth. We stabilized top-line growth rates in several key markets. We delivered another strong year of productivity improvement and cost savings. We made significant steps in our portfolio transformation — completing the Duracell transaction in February, negotiating and preparing for the sale of 41 beauty brands to Coty Inc., and streamlining the product lineups in our ongoing businesses.
We made this progress during a challenging year. We faced significant foreign exchange headwinds, which reduced sales growth by six percentage points and core earnings per share by nine percentage points. We faced slowing market growth, and economic and political disruptions in many large markets. We made choices to exit several lines of unprofitable business, which reduced organic sales growth. Earnings were impacted by reduced exports to Venezuela.
Despite these challenges, we delivered organic sales growth within our initial guidance range, and free cash flow productivity was above our initial expectations.
Core earnings per share were at the low end of our initial guidance range due primarily to over half a billion dollars after-tax of incremental foreign exchange impacts that occurred after we had set our targets for the year.
• All-in sales declined 8%; organic sales grew 1%• All-in earnings per share increased 51%; core earnings per share declined 2% • Free cash flow was $12.1 billion, with adjusted free cash flow productivity of 115%David S. Taylor
Chairman of the Board, President and Chief Executive Officer
TABLE OF CONTENTS
Letter to Shareholders iP&G’s 10 Categories iiForm 10-K ixMeasures Not Defined by U.S. GAAP 29Company and Shareholder Information 73
Global Company Leadership 74Board of Directors 75Recognition 76Citizenship Inside Back Cover

We continued to build on our strong track record of returning cash to you, our shareholders. We paid $7.4 billion in dividends, increasing our dividend for the 60th consecutive year. We reduced shares outstanding by more than $8 billion through a combination of share repurchases and shares that were exchanged in the Duracell transaction. In total, P&G delivered nearly $16 billion of value for shareholders.
We made progress in a challenging environment, but we know we need to do better. We are focused on streamlining and strengthening our product portfolio, improving productivity and our cost structure, building the foundation for stronger top-line growth, and strengthening our organization and culture. These are the choices we’re focused on to raise the bar on P&G’s performance to consistently deliver balanced growth and leadership value creation.
Streamlining Our Product PortfolioWe’re organizing our portfolio around 10 category-based business units and about 65 brands. These are categories where P&G has leading market positions and where product technologies deliver performance differences that matter to consumers. We’re focusing on categories where product performance drives purchase decisions — where there are clear consumer jobs to be done and objective measures of performance. These are products in financially attractive categories, which consumers purchase and use on a daily basis. These 10 category- based business units have historically grown faster with higher margins than the balance of the company.
Within these core categories, we are streamlining our product lines. For example, we are making smart choices to discontinue undifferentiated, unprofitable and commoditizing products in favor of more profitable, consumer-preferred and differentiated products in a number of markets and businesses around the world, including Mexico, India and Fabric Care. Combined, these choices caused about a one-point drag on organic sales growth in fiscal 2016 and are expected to continue to be a headwind in fiscal 2017.
As we complete this work, our portfolio of brands and products will be better positioned for stronger and more profitable growth.
10P&G’sCategories
Explore our brands and categories
ii • The Procter & Gamble Company

P&G is a global leader in all these categories.
We have deep consumer understanding in our categories.
Consumers at the CenterP&G’s aspiration is to serve the world’s consumers better than our best competitors, in every category and every country where we choose to compete — creating superior shareholder value in the process.
We’re organizing our portfolio around 10 category-based business units and about 65 brands. These are categories where P&G has leading market positions and where
product technologies deliver performance differences that matter to consumers.
We’re focusing on categories where product performance drives purchase decisions — where there are clear consumer jobs to be done and objective measures of performance. These are products in financially attractive categories, which consumers purchase and use on a daily basis.
The Procter & Gamble Company • iii

GROOMING
Male Blades & Razors, Female Blades & Razors, Pre- and Post-Shave Products, Appliances, Other Shave Care
FABRIC CARE
Laundry Detergents, Fabric Enhancers, Laundry Additives
HOME CARE
Dish Care, Air Care, Surface Care, P&G Professional
ORAL CARE
Toothbrushes, Toothpaste, Other Oral Care

SKIN AND PERSONAL CARE
Skin Care, Antiperspirant and Deodorant, Personal Cleansing
HAIR CARE
Shampoo, Conditioner, Styling Aids, Treatments
PERSONAL HEALTH CARE
Gastrointestinal, Respiratory, Rapid Diagnostics, Vitamins / Minerals /
Supplements, Other Personal Health Care
FEMININE CARE
Feminine Care, Adult Incontinence
FAMILY CARE
Paper Towels, Tissues, Toilet Paper
BABY CARE
Diapers and Pants, Baby Wipes

Improving Productivity and Cost StructureWe continue to improve cost and cash productivity with significant upside ahead. Productivity is the fuel for top- and bottom-line growth. We have delivered and exceeded $10 billion in savings over the past five fiscal years across cost of goods sold, marketing spending and overhead.
In cost of goods sold, our original target was $6 billion in savings over five years, from fiscal 2012 to 2016. We delivered over $7 billion, with savings at or above target each year.
In marketing spending, we have delivered strong savings over the last two years in non-working agency fees and commercial production costs. We’ve been reinvesting these savings in marketing programs that improve the reach, frequency or continuity of our advertising, and in programs such as product sampling that generate trial of our superior products.
In overhead, the decision to reduce enrollment was difficult, but was made with careful consideration of what is best for the health of the business. Since 2011, we have reduced non-manufacturing roles by about 25%, which is two-and-a-half times the original target. Including divestitures, we’ll reduce non-manufacturing roles by about 35% by the end of fiscal 2017.
Productivity cost savings have been essential to offset $4 billion of negative foreign exchange impacts over the last four years. These savings have enabled us to improve constant currency gross and operating profit margins and deliver high-single- to double-digit constant currency core earnings per share growth in each of these years.
We believe we can deliver up to an additional $10 billion in productivity improvements over the next five years. As with the first $10 billion, we expect the large majority of our savings will come from cost of goods sold.
Supply chain transformation is in its early stages. We started in North America. Europe is following, and then we will move on to Latin America and India, Middle East and Africa. We’re in investment mode now, with savings to ramp up over the next two to four years.
More opportunity exists for savings in marketing spending, particularly in non- working fees and production costs. We will also optimize the reach, effectiveness and efficiency of media spending through the right mix of TV advertising and digital — across search, social, video and mobile — to reach consumers when and where they spend their time.
As we fully operationalize the new, focused 10-category company, there will be additional opportunities to increase organization efficiency, agility and speed of decision making.
Finally, we are working to improve the effectiveness of our promotional spending by changing how we use these funds to give our sales teams more flexibility to invest in what drives the most profitable growth. We see clear opportunities to improve the effectiveness of promotional spending for us and for our retail partners to grow categories and brands profitably.
Going forward, we expect to reinvest a significant amount of the productivity savings back into the business. We’ll invest more in R&D, in product and packaging improvements, in sales coverage, in brand awareness and in trial-building programs. P&G wins when we create new categories and grow categories and brands. These investments are aimed at delivering balanced top- and bottom-line growth.
iv • The Procter & Gamble Company

Supply Chain EfficiencyOne way we’re increasing efficiency in our U.S. supply chain is through our six new mixing centers. They are strategically located closer to customers in key population centers, putting 80% of our U.S. business within one day of the store shelf and the shopper. Shipping multiple categories per load allows more efficient use of every truck and more frequent customer deliveries. This is driving lower inventory, improving service to retailers, and increasing product availability for shoppers — delivering the right mix and the right amount, right on time.
Accelerating Top-Line GrowthSales growth is our biggest improvement need, which is enabled by winning with consumers and fueled by both our productivity and portfolio strengthening efforts that are underway. Our objective is to consistently deliver organic sales growth ahead of underlying growth of the markets in which we compete. This level of top-line growth, balanced with consistent bottom-line growth and cash generation, is what’s needed to deliver leadership levels of value creation for P&G shareholders.
We’re making progress in accelerating organic sales growth. Organic sales for the April–June quarter were in line or higher than the previous year in 9 of 10 product categories. For nearly all of these businesses, the second half of the year was stronger than the first half. Organic sales for the company were essentially flat in the first half of the fiscal year and were up 1.5% in the second half — moving in the right direction, but there’s more work to be done.
80%of P&G’s U.S. business
within one day of the store shelf multiple categories
shipped per loadincreased product
availability for shoppers
The Procter & Gamble Company • v

Innovating to Delight Consumers
Superior-performing products lead to a delightful consumer experience, driving repeat purchase and loyalty.
Everything starts with winning with consumers and shoppers.
We must win with consumers and shoppers at the zero, first and second moments of truth — when consumers become aware of our categories and brands, purchase them in a store or online, and use them in their homes. Winning these moments requires insights that lead to superior-performing product innovations, effective advertising and strong retail programs. The outcome is growing the number of users — and usage — of our brands and the categories in which we compete.
Growing users requires product superiority, broad media reach, advertising effectiveness, distinctive packaging, an easy-to-shop store shelf, sampling programs and consumer value. We’re raising the bar by asking key questions: Is the product better performing and most preferred by consumers? Do we have the media reach and effective advertising to ensure our brands are always top of mind? Is the packaging distinctive, familiar and appealing? Is the store shelf organized in a way that is easy to shop, enabling consumers to find the right product for them with the right benefits at the right price? Do we have sampling programs that allow people to try our best products, particularly at the point of market entry? Is the relative price and absolute cash outlay to purchase our brands a good consumer value? Every category and brand is focused on consistently delivering these drivers of growing users to grow category and brand sales.
At the same time, we’re strengthening our go-to-market execution. Execution is what our consumers and shoppers experience when they are in the store or online. Our brands need to have the right selection of products, in the right sizes, at the right value, in the right quantity, and in the right points of sale to win with consumers and shoppers in stores and online every day.
PANTENE
Pantene’s new breakthrough conditioner technology delivers ‘superior conditioning without weight,’ addressing a significant consumer trial barrier in the category. Our Pantene shampoo and conditioner systems are consumer blind test winners vs. our best competition in North America, China and Japan. And they are helping drive results — Pantene’s U.S. organic sales were up mid-single digits for the six months ended in June 2016.
TIDE
Tide is now reaching more consumers and addressing two growing consumer needs: natural detergents and odor removal. Tide purclean is a breakthrough as the first bio-based detergent with the cleaning power of Tide. And with the growth of synthetic fibers and active lifestyles, odors are an increasing laundry concern. Using our Febreze technology, the Odor Defense regimen helps eliminate, neutralize and block tough odors.
vi • The Procter & Gamble Company

Sampling is a winning strategy for growth. When people try our products, they are far more likely to buy them.
Growing Users for a Stronger Top LineGrowing users is a key driver of balanced growth and value creation. Two of the ways we grow users of P&G brands are to offer superior-performing products to consumers and to increase consumer trial through sampling, particularly at the point of market entry.
Increasing Consumer Trial
PAMPERS
We’re strengthening brand awareness and trial at category entry. 70% of U.S. new moms now receive samples of our best Pampers products through our prenatal and hospital programs. Our latest innovation has our unique three Extra Absorb Channels that help distribute wetness evenly — unlike ordinary diapers that have one unstructured core. It’s driving growth, with Swaddlers and Cruisers U.S. share up well over one point in the June 2016 quarter.
GILLETTE
Our U.S. 18th birthday sampling program has put Gillette Fusion ProGlide FlexBall razors in the hands of nearly 80% of young men — over two million in 2016, up 33% over the past two years. We’re now sampling the FlexBall handle and ProShield cartridge — our most advanced combination of technologies. ProShield launched in January and is the #1 razor in the U.S., the U.K. and Germany, based on sales. Over 40 million men globally are now shaving with FlexBall.
Love at first touch Love the
swaddlers™
*based on sales of the newborn hospital diaper©2016 P&G
The Procter & Gamble Company • vii

David S. TaylorChairman of the Board, President and Chief Executive Officer
Strengthening Organization and CultureOur choices — portfolio transformation, continued productivity improvement, and reaccelerating top-line growth — are enabled by a winning organization and culture.
We are adjusting our talent development and assignment planning to improve mastery and depth. The objective is simple. We will improve business results by getting and keeping the right people in the right roles to develop and apply deep category mastery. For example, we’re dedicating sales resources to categories, enabling them to apply their mastery to drive category growth.
We’re aligning incentives at a lower and more specific level of granularity to better match business responsibilities with results and to increase accountability.
P&G is fortunate to consistently source and develop strong talent, and we intend to maintain our develop-from-within approach. But there are times when the best talent for a role may not be inside our organization. Going forward, we will look selectively at outside hiring when we need it to field the best team possible.
The bottom line is that we are committed to getting, keeping and growing the right people in the right places to drive better business results.
A winning organization is supported by a winning culture. P&G has a great culture — one of integrity, trust, ownership, leadership and a passion for winning. But we are strengthening our culture, putting increased emphasis on behaviors that lead to faster decision making and action, and taking personal accountability to raise the bar to deliver our best performance.
I deeply believe in P&G people. I’ve had the opportunity to work in multiple functions, countries and businesses, and have experienced the quality and capability of P&G people around the world. P&G people are truly our most valuable asset. Together, we will return P&G to balanced growth and value creation.
Winning ConsistentlyWe are encouraged and optimistic as we enter fiscal 2017. We expect this year to represent another step toward our goal of balanced top- and bottom-line growth and cash generation. We’re committed to continued productivity improvement and cost savings that provide the fuel for innovation and investments needed to accelerate and sustain faster top- and bottom-line growth. We’re nearing the completion of the major portfolio moves to simplify and strengthen the category portfolio. We are strengthening the organization and culture.
P&G is adapting, evolving and changing to do what is needed to win. We’re making progress in each of these areas, but we know our success will ultimately be graded on the sales, profit, cash and value creation results we deliver, not on the activities that get us there. We expect to make meaningful progress in fiscal 2017 toward our return to our long-term growth targets, but there is still work to do. It will take time for the benefits of the work and the investments we are making to be fully visible in our results.
We are committed to do everything we can to get P&G back to winning with consumers, and delivering consistent, reliable, balanced and sustainable growth and value creation for you, our shareholders.
viii • The Procter & Gamble Company

UNITED STATES SECURITIES AND EXCHANGE COMMISSIONWashington, D.C. 20549
Form 10-K
(Mark one)[x] ANNUAL REPORT PURSUANT TO SECTION 13 OR 15(d) OF THE SECURITIES EXCHANGE ACT OF 1934
For the Fiscal Year Ended June 30, 2016
OR[ ] TRANSITION REPORT PURSUANT TO SECTION 13 OR 15(d) OF THE SECURITIES EXCHANGE ACT OF
1934
For the transition period from to
Commission File No. 1-434
THE PROCTER & GAMBLE COMPANYOne Procter & Gamble Plaza, Cincinnati, Ohio 45202
Telephone (513) 983-1100IRS Employer Identification No. 31-0411980
State of Incorporation: OhioSecurities registered pursuant to Section 12(b) of the Act:
Title of each class Name of each exchange on which registeredCommon Stock, without Par Value New York Stock Exchange, NYSE Euronext-Paris
Indicate by check mark if the registrant is a well-known seasoned issuer, as defined in Rule 405 of the Securities Act. Yes No
Indicate by check mark if the registrant is not required to file reports pursuant to Section 13 or 15(d) of the Act. Yes No
Indicate by check mark whether the registrant (1) has filed all reports required to be filed by Section 13 or 15(d) of the Securities ExchangeAct of 1934 during the preceding 12 months (or for such shorter period that the registrant was required to file such reports), and (2) hasbeen subject to such filing requirements for the past 90 days. Yes No
Indicate by check mark whether the registrant has submitted electronically and posted on its corporate website, if any, every InteractiveData File required to be submitted and posted pursuant to Rule 405 of Regulation S-T (§232.405 of this chapter) during the preceding12 months (or for such shorter period that the registrant was required to submit and post such files). Yes No
Indicate by check mark if disclosure of delinquent filers pursuant to Item 405 of Regulation S-K is not contained herein, and will not becontained, to the best of registrant's knowledge, in definitive proxy or information statements incorporated by reference in Part III of thisForm 10-K or any amendment to this Form 10-K.
Indicate by check mark whether the registrant is a large accelerated filer, an accelerated filer, a non-accelerated filer or a smaller reportingcompany (as defined in Rule 12b-2 of the Exchange Act).Large accelerated filer Accelerated filer Non-accelerated filer Smaller reporting company
Indicate by check mark whether the registrant is a shell company (as defined in Rule 12b-2 of the Exchange Act). Yes No
The aggregate market value of the voting stock held by non-affiliates amounted to $215 billion on December 31, 2015.
There were 2,668,751,125 shares of Common Stock outstanding as of July 31, 2016.
Documents Incorporated by ReferencePortions of the Proxy Statement for the 2016 Annual Meeting of Shareholders which will be filed within one hundred and twenty daysof the fiscal year ended June 30, 2016 (2016 Proxy Statement) are incorporated by reference into Part III of this report to the extentdescribed herein.
FORM 10-K TABLE OF CONTENTS PagePART I Item 1. Business 1
Item 1A. Risk Factors 2Item 1B. Unresolved Staff Comments 6Item 2. Properties 6Item 3. Legal Proceedings 6Item 4. Mine Safety Disclosure 6
Executive Officers of the Registrant 7PART II Item 5. Market for Registrant's Common Equity, Related Stockholder Matters and Issuer Purchases
of Equity Securities 8Item 6. Selected Financial Data 10Item 7. Management's Discussion and Analysis of Financial Condition and Results of Operations 11Item 7A. Quantitative and Qualitative Disclosures About Market Risk 30Item 8. Financial Statements and Supplementary Data 31
Management's Report and Reports of Independent Registered Public Accounting Firm 31Consolidated Statements of Earnings 34Consolidated Statements of Comprehensive Income 35Consolidated Balance Sheets 36Consolidated Statements of Shareholders' Equity 37Consolidated Statements of Cash Flows 38Notes to Consolidated Financial Statements 39
Note 1: Summary of Significant Accounting Policies 39Note 2: Segment Information 41Note 3: Supplemental Financial Information 43Note 4: Goodwill and Intangible Assets 44Note 5: Income Taxes 46Note 6: Earnings Per Share 48Note 7: Stock-based Compensation 48Note 8: Postretirement Benefits and Employee Stock Ownership Plan 50Note 9: Risk Management Activities and Fair Value Measurements 54Note 10: Short-term and Long-term Debt 57Note 11: Accumulated Other Comprehensive Income/(Loss) 58Note 12: Commitments and Contingencies 59Note 13: Discontinued Operations 59Note 14: Quarterly Results (Unaudited) 64
Item 9. Changes in and Disagreements with Accountants on Accounting and Financial Disclosure 65Item 9A. Controls and Procedures 65Item 9B. Other Information 65
PART III Item 10. Directors, Executive Officers and Corporate Governance 65Item 11. Executive Compensation 65Item 12. Security Ownership of Certain Beneficial Owners and Management and Related Stockholder
Matters 66Item 13. Certain Relationships and Related Transactions and Director Independence 67Item 14. Principal Accountant Fees and Services 67
PART IV Item 15. Exhibits and Financial Statement Schedules 67Signatures 70Exhibit Index 71

The Procter & Gamble Company 1
PART I
Item 1. Business.
Additional information required by this item is incorporatedherein by reference to Management's Discussion and Analysis(MD&A); and Notes 1 and 2 to our Consolidated FinancialStatements. Unless the context indicates otherwise, the termsthe "Company," "P&G," "we," "our" or "us" as used hereinrefer to The Procter & Gamble Company (the registrant) andits subsidiaries.
The Procter & Gamble Company is focused on providingbranded consumer packaged goods of superior quality andvalue to improve the lives of the world's consumers. TheCompany was incorporated in Ohio in 1905, having been builtfrom a business founded in 1837 by William Procter and JamesGamble. Today, our products are sold in more than 180countries and territories.
Throughout this Form 10-K, we incorporate by referenceinformation from other documents filed with the Securities andExchange Commission (SEC).
The Company'sAnnual Report on Form 10-K, quarterly reportson Form 10-Q and current reports on Form 8-K, andamendments thereto, are filed electronically with the SEC. TheSEC maintains an internet site that contains these reports at:www.sec.gov. You can also access these reports through linksfrom our website at: www.pginvestor.com.
Copies of these reports are also available, without charge, bycontacting Wells Fargo, 1100 Centre Pointe Curve, Suite 101,Mendota, MN 55120-4100.
Financial Information about Segments
As of June 30, 2016 the Company has five reportable segmentsunder U.S. GAAP: Beauty; Grooming; Health Care; Fabric &Home Care; and Baby, Feminine & Family Care. Many of thefactors necessary for understanding these businesses aresimilar. Operating margins of the individual businesses varydue to the nature of materials and processes used tomanufacture the products, the capital intensity of the businessesand differences in selling, general and administrative expensesas a percentage of net sales. Net sales growth by business isalso expected to vary slightly due to the underlying growth ofthe markets and product categories in which they operate.While none of our reportable segments are highly seasonal,components within certain reportable segments, such asAppliances (Grooming), are seasonal.
Additional information about our reportable segments can befound in the MD&A and Note 2 to our Consolidated FinancialStatements.
Narrative Description of Business
Business Model. Our business model relies on the continuedgrowth and success of existing brands and products, as well asthe creation of new products. The markets and industrysegments in which we offer our products are highlycompetitive. Our products are sold in more than 180 countries
and territories primarily through mass merchandisers, grocerystores, membership club stores, drug stores, department stores,distributors, baby stores, specialty beauty stores, e-commerce,high-frequency stores and pharmacies. We utilize our superiormarketing and online presence to win with consumers at the"zero moment of truth" - when they are searching forinformation about a brand or product. We work collaborativelywith our customers to improve the in-store presence of ourproducts and win the "first moment of truth" - when a consumeris shopping in the store. We must also win the "second momentof truth" - when a consumer uses the product, evaluates howwell it met his or her expectations and decides whether it wasa good value. We believe we must continue to provide new,innovative products and branding to the consumer in order togrow our business. Research and product developmentactivities, designed to enable sustained organic growth,continued to carry a high priority during the past fiscal year.
Key Product Categories. Information on key productcategories can be found in Note 2 to our Consolidated FinancialStatements.
Key Customers. Our customers include mass merchandisers,grocery stores, membership club stores, drug stores,department stores, distributors, baby stores, specialty beautystores, e-commerce, high-frequency stores and pharmacies.Sales to Wal-Mart Stores, Inc. and its affiliates representapproximately 15% of our total revenue in 2016, 2015 and2014. No other customer represents more than 10% of our netsales. Our top ten customers account for approximately 35%of our total sales in 2016, 2015 and 2014. The nature of ourbusiness results in no material backlog orders or contracts withthe government. We believe our practices related to workingcapital items for customers and suppliers are consistent withthe industry segments in which we compete.
Sources and Availability of Materials. Almost all of the rawand packaging materials used by the Company are purchasedfrom others, some of which are single-source suppliers. Weproduce certain raw materials, primarily chemicals, for furtheruse in the manufacturing process. In addition, fuel, natural gasand derivative products are important commodities consumedin our manufacturing process and in the transportation of inputmaterials and of finished product to customers. The prices wepay for materials and other commodities are subject tofluctuation. When prices for these items change, we may ormay not pass the change to our customers. The Companypurchases a substantial variety of other raw and packagingmaterials, none of which is material to our business taken as awhole.
Trademarks and Patents. We own or have licenses underpatents and registered trademarks which are used in connectionwith our activity in all businesses. Some of these patents orlicenses cover significant product formulation and processesused to manufacture our products. The trademarks areimportant to the overall marketing and branding of ourproducts. All major trademarks in each business are registered.

2 The Procter & Gamble Company
In part, our success can be attributed to the existence andcontinued protection of these trademarks, patents and licenses.
Competitive Condition. The markets in which our productsare sold are highly competitive. Our products compete againstsimilar products of many large and small companies, includingwell-known global competitors. In many of the markets andindustry segments in which we sell our products we competeagainst other branded products as well as retailers' private-labelbrands. We are well positioned in the industry segments andmarkets in which we operate, often holding a leadership orsignificant market share position. We support our productswith advertising, promotions and other marketing vehicles tobuild awareness and trial of our brands and products inconjunction with an extensive sales force. We believe thiscombination provides the most efficient method of marketingfor these types of products. Product quality, performance, valueand packaging are also important differentiating factors.
Research and Development Expenditures. Research anddevelopment expenditures enable us to develop technologiesand obtain patents across all categories in order to meet theneeds and improve the lives of our consumers. Research anddevelopment expenses were $1.9 billion in 2016, $2.0 billionin 2015 and $1.9 billion in 2014 (reported in Net earnings fromcontinuing operations).
Expenditures forEnvironmental Compliance. Expendituresfor compliance with federal, state and local environmental lawsand regulations are fairly consistent from year to year and arenot material to the Company. No material change is expectedin fiscal year 2017.
Employees. Total number of employees is an estimate of totalCompany employees excluding interns, co-ops and employeesof joint ventures as of the years ended June 30. The numberof employees includes manufacturing and non-manufacturingemployees. A discussion of progress on non-manufacturingenrollment objectives is included in Note 3 to our ConsolidatedFinancial Statements. The number of employees includesemployees of discontinued operations.
Total Number of Employees
2016 105,0002015 110,0002014 118,0002013 121,0002012 126,0002011 129,000
Financial Information about Foreign and DomesticOperations. Net sales in the U.S. account for 41% of total netsales. No other individual country exceeds 10% of total netsales. Operations outside the U.S. are generally characterizedby the same conditions discussed in the description of thebusiness above and may be affected by additional factorsincluding changing currency values, different rates of inflation,economic growth and political and economic uncertainties anddisruptions.
Our sales by geography for the fiscal years ended June 30 wereas follows:
2016 2015 2014
North America (1) 44% 41% 39%Europe 23% 24% 26%Asia Pacific 9% 8% 8%Greater China 8% 9% 9%IMEA (2) 8% 8% 8%Latin America 8% 10% 10%
(1) NorthAmerica includes results for the United States, Canada andPuerto Rico only.
(2) IMEA includes India, Middle East and Africa.
Net sales and total assets in the United States andinternationally were as follows (in billions):
Net Sales (years ended June 30) United States International
2016 $27.0 $38.32015 $26.8 $43.92014 $26.7 $47.7
Total Assets (years ended June 30)
2016 $64.4 $62.72015 $65.0 $64.52014 $68.8 $75.5
Item 1A. Risk Factors.
We discuss our expectations regarding future performance,events and outcomes, such as our business outlook andobjectives in this Form 10-K, quarterly reports, press releasesand other written and oral communications. All statements,except for historical and present factual information, are“forward-looking statements” and are based on financial dataand business plans available only as of the time the statementsare made, which may become outdated or incomplete. Weassume no obligation to update any forward-lookingstatements as a result of new information, future events or otherfactors. Forward-looking statements are inherently uncertain,and investors must recognize that events could significantlydiffer from our expectations.
The following discussion of “risk factors” identifies significantfactors that may adversely affect our business, operations,financial position or future financial performance. Thisinformation should be read in conjunction with the MD&Aandthe Consolidated Financial Statements and related Notesincorporated in this report. The following discussion of risksis not all inclusive, but is designed to highlight what we believeare important factors to consider when evaluating ourexpectations. These and other factors could cause our futureresults to differ from those in the forward-looking statementsand from historical trends.

The Procter & Gamble Company 3
Our business is subject to numerous risks as a result of ourhaving significant operations and sales in internationalmarkets, including foreign currency fluctuations, currencyexchange or pricing controls and localized volatility.
We are a global company, with operations in approximately 70countries and products sold in more than 180 countries andterritories around the world. We hold assets, incur liabilities,earn revenues and pay expenses in a variety of currencies otherthan the U.S. dollar, and our operations outside the U.S.generate a significant portion of our net revenue. Fluctuationsin exchange rates for foreign currencies, such as the recentvolatility in the Russian ruble, may reduce the U.S. dollar valueof revenues, profits and cash flows we receive from non-U.S.markets, increase our supply costs (as measured in U.S. dollars)in those markets, negatively impact our competitiveness inthose markets or otherwise adversely impact our businessresults or financial condition. Moreover, discriminatory orconflicting fiscal policies in different countries could adverselyaffect our results. See also the Results of Operations and CashFlow, Financial Condition and Liquidity sections of the MD&Aand Note 9 to our Consolidated Financial Statements.
We also have sizable businesses and maintain local currencycash balances in a number of foreign countries with exchange,import authorization, pricing or other controls, includingArgentina, Egypt, Nigeria and Ukraine. Our results ofoperations and financial condition could be adversely impactedif we are unable to successfully manage such controls, continueexisting business operations and repatriate earnings fromoverseas, or if new or increased tariffs, quotas, exchange orprice controls, trade barriers or similar restrictions are imposedon our business outside the U.S.
Additionally, our business, operations or employees may beadversely affected by political volatility, labor marketdisruptions or other crises or vulnerabilities in individualcountries or regions, including political instability or upheaval,broad economic instability or sovereign risk related to a defaultby or deterioration in the credit worthiness of localgovernments, particularly in emerging markets.
Uncertain global economic conditions may adverselyimpact demand for our products or cause our customersand other business partners to suffer financial hardship,which could adversely impact our business.
Our business could be negatively impacted by reduced demandfor our products related to one or more significant local,regional or global economic disruptions, such as: a slow-downin the general economy; reduced market growth rates; tightercredit markets for our suppliers, vendors or customers; or theinability to conduct day-to-day transactions through ourfinancial intermediaries to pay funds to or collect funds fromour customers, vendors and suppliers. Additionally, economicconditions may cause our suppliers, distributors, contractorsor other third party partners to suffer financial difficulties thatthey cannot overcome, resulting in their inability to provide uswith the materials and services we need, in which case ourbusiness and results of operations could be adversely affected.Customers may also suffer financial hardships due to economic
conditions such that their accounts become uncollectible or aresubject to longer collection cycles. If we are unable to generatesufficient income and cash flow, it could affect the Company’sability to achieve expected share repurchase and dividendpayments.
Disruptions in credit markets or changes to our creditratings may reduce our access to credit.
Adisruption in the credit markets or a downgrade of our currentcredit rating could increase our future borrowing costs andimpair our ability to access capital and credit markets on termscommercially acceptable to us, which could adversely affectour liquidity and capital resources or significantly increase ourcost of capital.
Disruption in our global supply chain may negativelyimpact our business results.
Our ability to meet our customers’ needs and achieve costtargets depends on our ability to maintain key manufacturingand supply arrangements, including execution of ourpreviously-announced supply chain simplifications and certainsole supplier or sole manufacturing plant arrangements. Theloss or disruption of such manufacturing and supplyarrangements, including for issues such as labor disputes, lossor impairment of key manufacturing sites, inability to procuresufficient raw or input materials, natural disasters, acts of waror terrorism or other external factors over which we have nocontrol, could interrupt product supply and, if not effectivelymanaged and remedied, have an adverse impact on ourbusiness, financial condition or results of operations.
Our businesses face cost fluctuations and pressures thatcould affect our business results.
Our costs are subject to fluctuations, particularly due tochanges in the prices of commodities and raw materials andthe costs of labor, transportation, energy, pension andhealthcare. Therefore, our business results are dependent, inpart, on our continued ability to manage these fluctuationsthrough pricing actions, cost saving projects and sourcingdecisions, while maintaining and improving margins andmarket share. Failure to manage these fluctuations couldadversely impact our financial results.
Our ability to meet our growth targets depends onsuccessful product, marketing and operations innovationand successful responses to competitive innovation.
We are a consumer products company that relies on continuedglobal demand for our brands and products. Achieving ourbusiness results depends, in part, on successfully developing,introducing and marketing new products and on makingsignificant improvements to our equipment and manufacturingprocesses. The success of such innovation depends on ourability to correctly anticipate customer and consumeracceptance and trends, to obtain, maintain and enforcenecessary intellectual property protections and to avoidinfringing upon the intellectual property rights of others. Wemust also be able to successfully respond to technologicaladvances made by, and intellectual property rights granted to,competitors. Failure to continually innovate, improve and

4 The Procter & Gamble Company
respond to competitive moves could compromise ourcompetitive position and adversely impact our results.
The ability to achieve our business objectives is dependenton how well we can compete with our local and globalcompetitors in new and existing markets and channels.
The consumer products industry is highly competitive. Acrossall of our categories, we compete against a wide variety ofglobal and local competitors. As a result, we experienceongoing competitive pressures in the environments in whichwe operate, as well as challenges in maintaining profit margins.To address these challenges, we must be able to successfullyrespond to competitive factors, including pricing, promotionalincentives and trade terms. In addition, evolving sales channelsand business models may affect customer and consumerpreferences as well as market dynamics, which, for example,may be seen in the growing consumer preference for shoppingonline. Failure to successfully respond to competitive factorsand effectively compete in growing saleschannels and businessmodels, particularly e-commerce, could negatively impact ourresults.
A significant change in customer relationships or incustomer demand for our products could have a significantimpact on our business.
We sell most of our productsvia retail customers, which includemass merchandisers, grocery stores, membership club stores,drug stores, department stores, distributors, baby stores,specialty beauty stores, e-commerce, high-frequency storesand pharmacies. Our success is dependent on our ability tosuccessfully manage relationships with our retail tradecustomers, which includes our ability to offer trade terms thatare mutually acceptable and are aligned with our pricing andprofitability targets. Continued consolidation among our retailcustomers could create significant cost and margin pressure onour business, and our business performance could suffer if wecannot reach agreement with a key customer based on our tradeterms and principles. Our business could also be negativelyimpacted if a key customer were to significantly reduce theinventory level of our products or experience a significantbusiness disruption.
If the reputation of the Company or one or more of ourbrands erodes significantly, it could have a material impacton our financial results.
The Company's reputation, and the reputation of our brands,form the foundation of our relationships with key stakeholdersand other constituencies, including consumers, customers andsuppliers. The quality and safety of our products are criticalto our business. Many of our brands have worldwiderecognition, and our financial success is directly dependent onthe success of our brands. The success of our brands can sufferif our marketing plans or product initiatives do not have thedesired impact on a brand's image or its ability to attractconsumers. Our results could also be negatively impacted ifone of our brands suffers substantial harm to its reputation dueto a significant product recall, product-related litigation,changing consumer perceptions of certain ingredients,allegations of product tampering or the distribution and sale of
counterfeit products. Additionally, negative or inaccuratepostings or comments on social media or networking websitesabout the Company or one of its brands could generate adversepublicity that could damage the reputation of our brands or theCompany. If we are unable to effectively manage real orperceived issues, including concerns about safety, quality,ingredients, efficacy or similar matters, sentiments toward theCompany or our products could be negatively impacted andour financial results could suffer. Our Company also devotessignificant time and resources to programs that are consistentwith our corporate values and are designed to protect andpreserve our reputation, such as social responsibility andenvironmental sustainability. If these programs are notexecuted as planned or suffer negative publicity, theCompany's reputation and financial results could be adverselyimpacted.
We rely on third parties in many aspects of our business,which creates additional risk.
Due to the scale and scope of our business, we must rely onrelationships with third parties, including our suppliers,distributors, contractors, joint venture partners or externalbusiness partners, for certain functions. If we are unable toeffectively manage our third party relationships and theagreements under which our third party partners operate, ourfinancial results could suffer. Additionally, while we havepolicies and procedures for managing these relationships, theyinherently involve a lesser degree of control over businessoperations, governance and compliance, thereby potentiallyincreasing our financial, legal, reputational and operationalrisk.
An information security incident, including acybersecurity breach, or the failure of one or more keyinformation technology systems, networks, hardware,processes, associated sites or service providers could havea material adverse impact on our business or reputation.
We rely extensively on information technology (IT) systems,networks and services, including internet sites, data hostingand processing facilities and tools, physical security systemsand other hardware, software and technical applications andplatforms, some of which are managed, hosted, provided and/or used by third-parties or their vendors, to assist in conductingour business. The various uses of these IT systems, networksand services include, but are not limited to:• ordering and managing materials from suppliers;• converting materials to finished products;• shipping products to customers;• marketing and selling products to consumers;• collecting, transferring, storing, and/or processing
customer, consumer, employee, vendor, investor,regulatory, and other stakeholder information andpersonal data;
• summarizing and reporting results of operations;• hosting, processing and sharing, as appropriate,
confidential and proprietary research, business plans andfinancial information;

The Procter & Gamble Company 5
• collaborating via an online and efficient means of globalbusiness communications;
• complying with regulatory, legal and tax requirements;• providing data security; and• handling other processes necessary to manage our
business.
Numerous and evolving information security threats, includingadvanced persistent cybersecurity threats, pose a risk to thesecurity of our IT systems, networks and services, as well asto the confidentiality, availability and integrity of our data andthe availability and integrity of our critical business operations.As cybersecurity threats rapidly evolve in sophistication andbecome more prevalent across the industry globally, theCompany is continually increasing its sensitivity and attentionto these threats. We continue to assess potential threats andmake investments seeking to address these threats, includingmonitoring of networks and systems and upgrading skills,employee training and security policies for the Company andits third-party providers. However, because the techniquesused in these attacks change frequently and may be difficult todetect for periods of time, we may face difficulties inanticipating and implementing adequate preventativemeasures. Our IT databases and systems and our third partyproviders' databases and systems have been, and will likelycontinue to be, subject to computer viruses or other maliciouscodes, unauthorized access attempts, denial of service attacks,phishing and other cyber-attacks. To date, we have seen nomaterial impact on our business or operations from theseattacks; however, we cannot guarantee that our security effortsor the security efforts of our third party providers will preventbreaches or breakdowns to our or our third-party providers’databases or systems. If the IT systems, networks or serviceproviders we rely upon fail to function properly or causeoperational outages or aberrations, or if we or one of our third-party providers suffer a loss, significant unavailability of ordisclosure of our business or stakeholder information, due toany number of causes, ranging from catastrophic events orpower outages to improper data handling or security breaches,and our business continuity plans do not effectively addressthese failures on a timely basis, we may be exposed toreputational, competitive and business harm as well aslitigation and regulatory action. The costs and operationalconsequences of responding to breaches and implementingremediation measures could be significant.
We must successfully manage compliance with legislation,regulation and enforcement, as well as pending legalmatters in the U.S. and abroad.
Our business is subject to a wide variety of laws and regulationsacross all of the countries in which we do business, includingthose laws and regulations involving intellectual property,product liability, marketing, antitrust, privacy, environmental,employment, anti-bribery or anti-corruption (such as the U.S.Foreign Corrupt Practices Act), tax or other matters. Rapidlychanging laws, regulations and related interpretations,including changes in accounting standards, as well asincreased enforcement actions, create challenges for theCompany, including our compliance and ethics programs and
may alter the environment in which we do business, whichcould adversely impact our financial results. If we are unableto continue to meet these challenges and comply with all laws,regulations and related interpretations, it could negativelyimpact our reputation and our business results. Failure tosuccessfully manage regulatory and legal matters and resolvesuch matters without significant liability or damage to ourreputation may materially adversely impact our results ofoperations and financial position. Furthermore, if pendinglegal matters result in fines or costs in excess of the amountsaccrued to date, that may also materially impact our results ofoperations and financial position.
Changes in applicable tax regulations could negativelyaffect our financial results.
The Company is subject to taxation in the U.S. and numerousforeign jurisdictions. Because the U.S. maintains a worldwidecorporate tax system, the foreign and U.S. tax systems aresomewhat interdependent. For example, certain income thatis earned and taxed in countries outside the U.S. is not taxedin the U.S., provided those earnings are indefinitely reinvestedoutside the U.S. If those same foreign earnings are insteadrepatriated to the U.S., additional residual U.S. taxation willlikely occur, due to the U.S.’s worldwide tax system and higherU.S. corporate tax rate. The U.S. is considering corporate taxreform that may significantly change the corporate tax rate andthe U.S. international tax rules. Additionally, longstandinginternational tax norms that determine each country’sjurisdiction to tax cross-border international trade are evolvingas a result of the Base Erosion and Profit Shifting project(“BEPS") undertaken by the G8, G20 and Organization forEconomic Cooperation and Development ("OECD"). As theseand other tax laws and related regulations change, our financialresults could be materially impacted. Given theunpredictability of these possible changes and their potentialinterdependency, it is very difficult to assess whether theoverall effect of such potential tax changes would becumulatively positive or negative for our earnings and cashflow, but such changes could adversely impact our financialresults.
If we are unable to successfully execute our portfoliooptimization strategy, as well as successfully manageongoing acquisition, joint venture and divestitureactivities, it could adversely impact our business.
InAugust 2014, the Company announced a plan to significantlystreamline our product portfolio by divesting, discontinuing orconsolidating about 100 non-strategic brands, resulting in aportfolio of about 65 brands. The Company has announcedthe Beauty Brands transaction with Coty and completed a seriesof other transactions that will substantially complete this plan.Our ability to successfully execute our portfolio optimizationstrategy could impact our results.
In addition, as a company that manages a portfolio of consumerbrands, our ongoing business model includes a certain level ofacquisition, joint venture and divestiture activities. We mustbe able to successfully manage the impacts of these activities,while at the same time delivering against our business

6 The Procter & Gamble Company
objectives. Specifically, our financial results could beadversely impacted by the dilutive impacts from the loss ofearnings associated with divested brands. Our financial resultscould also be impacted in the event of acquisitions or jointventure activities if: 1) changes in the cash flows or othermarket-based assumptions cause the value of acquired assetsto fall below book value, or 2) we are not able to deliver theexpected cost and growth synergies associated with suchacquisitions and joint ventures, which could also have animpact on goodwill and intangible assets.
Our business results depend on our ability to successfullymanage productivity improvements and ongoingorganizational change.
Our financial projections assume certain ongoing productivityimprovements and cost savings, including staffing adjustmentsas well as employee departures. Failure to deliver theseplanned productivity improvements and cost savings, whilecontinuing to invest in business growth, could adversely impactour financial results. Additionally, successfully executingmanagement transitions at leadership levels of the Companyand retention of key employees is critical to our businesssuccess. We are generally a build-from-within company andour success is dependent on identifying, developing andretaining key employees to provide uninterrupted leadershipand direction for our business. This includes developing andretaining organizational capabilities in key growth marketswhere the depth of skilled or experienced employees may belimited and competition for these resources is intense, as wellas continuing the development and execution of robustleadership succession plans.
The United Kingdom’s departure from the EuropeanUnion could adversely impact our business and financialresults.
On June 23, 2016, the United Kingdom held a referendum inwhich a majority of voters voted for the United Kingdom toexit the European Union (“Brexit”), the announcement ofwhich resulted in significant currency exchange ratefluctuations and volatility in global stock markets. It isexpected that the British government will commencenegotiations to determine the terms of Brexit. Given the lackof comparable precedent, the implications of Brexit or howsuch implications might affect the Company are unclear. Brexitcould, among other things, disrupt trade and the free movementof goods, services and people between the United Kingdomand the European Union or other countries as well as createlegal and global economic uncertainty. These and otherpotential implications of Brexit could adversely affect theCompany’s business and financial results.
Item 1B. Unresolved Staff Comments.
None.
Item 2. Properties.
In the U.S., we own and operate 24 manufacturing sites locatedin 18 different states or territories. In addition, we own andoperate 97 manufacturing sites in 38 other countries. Many ofthe domestic and international sites manufacture products formultiple businesses. Beauty products are manufactured at 34of these locations; Grooming products at 21; Health Careproducts at 17; Fabric & Home Care products at 46; and Baby,Feminine & Family Care at 42. Management believes that theCompany's manufacturing sites are adequate to support thebusiness and that the properties and equipment have been wellmaintained.
Item 3. Legal Proceedings.
The Company is subject, from time to time, to certain legalproceedings and claims arising out of our business, whichcover a wide range of matters, including antitrust and traderegulation, product liability, advertising, contracts,environmental issues, patent and trademark matters, labor andemployment matters and tax. See Note 12 to our ConsolidatedFinancial Statements for information on certain legalproceedings for which there are contingencies.
This item should be read in conjunction with the Company'sRisk Factors in Part I, Item 1A for additional information.
Item 4. Mine Safety Disclosure.
Not applicable.

The Procter & Gamble Company 7
EXECUTIVE OFFICERS OF THE REGISTRANT
The names, ages and positions held by the Executive Officers of the Company on August 9, 2016, are:
Name Position AgeFirst Elected toOfficer Position
David S. Taylor Chairman of the Board, President and Chief ExecutiveOfficer 58 2013
Jon R. Moeller Chief Financial Officer 52 2009
Steven D. Bishop Group President - Global Health Care 52 2016
Giovanni Ciserani Group President - Global Fabric and Home Care and GlobalBaby and Feminine Care 54 2013
Mary Lynn Ferguson-McHugh Group President - Global Family Care and Global BrandCreation and Innovation, P&G Ventures 56 2016
Patrice Louvet Group President - Global Beauty 51 2016
Charles E. Pierce Group President - Global Grooming 59 2016
Carolyn M. Tastad Group President - North America Selling and MarketOperations 55 2014
Mark F. Biegger Chief Human Resources Officer 54 2012
Gary A. Coombe President - Europe Selling and Market Operations 52 2014
Kathleen B. Fish Chief Technology Officer 59 2014
Deborah P. Majoras Chief Legal Officer and Secretary 52 2010
Juan Fernando Posada President - Latin America Selling and Market Operations 54 2015
Matthew Price President - Greater China Selling and Market Operations 50 2015
Marc S. Pritchard Chief Brand Officer 56 2008
Mohamed Samir President - India, Middle East and Africa (IMEA) Sellingand Market Operations 49 2014
Jeffrey K. Schomburger Global Sales Officer 54 2015
Valarie L. Sheppard Senior Vice President, Comptroller and Treasurer 52 2005
Yannis Skoufalos Global Product Supply Officer 59 2011
Magesvaran Suranjan President - Asia Pacific Selling and Market Operations 46 2015
All the Executive Officers named above have been employed by the Company for more than the past five years.

8 The Procter & Gamble Company
PART II
Item 5. Market for Registrant's Common Equity, Related Stockholder Matters and Issuer Purchases of Equity Securities.
ISSUER PURCHASES OF EQUITY SECURITIES
PeriodTotal Number of
Shares Purchased (1)Average Price
Paid per Share (2)
Total Number ofShares Purchased as
Part of PubliclyAnnounced Plans or
Programs (3)
Approximate Dollar Value ofShares that May Yet Be
Purchased Under Our ShareRepurchase Program
4/1/2016 - 4/30/2016 — — — (3)
5/1/2016 - 5/31/2016 6,152,153 $81.27 6,152,153 (3)
6/1/2016 - 6/30/2016 — — — (3)
Total 6,152,153 $81.27 6,152,153 (3)
(1) The total number of shares purchased for the three months ended June 30, 2016 was 6,152,153. All transactions were made in the openmarket with large financial institutions. This table excludes shares withheld from employees to satisfy minimum tax withholdingrequirements on option exercises and other equity-based transactions. The Company administers cashless exercises through an independentthird party and does not repurchase stock in connection with cashless exercises.
(2) Average price paid per share is calculated on a settlement basis and excludes commission.(3) OnApril 26, 2016, the Company stated that in fiscal year 2016 the Company planned to reduce Company shares outstanding by approximately
$8 to $9 billion, through a combination of direct share repurchases and shares that were exchanged in the Duracell transaction (see Note13 to our Consolidated Financial Statements), notwithstanding any purchases under the Company's compensation and benefit plans. Theshare repurchases were authorized pursuant to a resolution issued by the Company's Board of Directors and were financed through acombination of operating cash flows and issuance of long-term and short-term debt. The total value of the shares purchased under the sharerepurchase plan and exchanged in the Duracell transaction was $8.2 billion. The share repurchase plan ended on June 30, 2016.
Additional information required by this item can be found in Part III, Item 12 of this Form 10-K.
SHAREHOLDER RETURN PERFORMANCE GRAPHSMarket and Dividend InformationP&G has been paying a dividend for 126 consecutive years since its original incorporation in 1890 and has increased its dividendfor 60 consecutive years. Over the past five years, the dividend has increased at an annual compound average rate of 5%.Nevertheless, as in the past, further dividends will be considered after reviewing dividend yields, profitability expectations andfinancing needs and will be declared at the discretion of the Company's Board of Directors.
(in dollars; split-adjusted) 1956 1966 1976 1986 1996 2006 2016
Dividends per share $ 0.01 $ 0.03 $ 0.06 $ 0.16 $ 0.40 $ 1.15 $ 2.66

The Procter & Gamble Company 9
Quarterly Dividends
Quarter Ended 2015 - 2016 2014 - 2015
September 30 $0.6629 $0.6436December 31 0.6629 0.6436March 31 0.6629 0.6436June 30 0.6695 0.6629
Common Stock Price Range
Quarter Ended 2015 - 2016 2014 - 2015High Low High Low
September 30 $ 82.55 $ 65.02 $ 85.40 $ 77.29December 31 81.23 71.30 93.89 81.57March 31 83.87 74.46 91.78 80.82June 30 84.80 79.10 84.20 77.10
P&G trades on the New York Stock Exchange and NYSE Euronext-Paris under the stock symbol PG. There were approximately2.9 million common stock shareowners, including shareowners of record, participants in the P&G Shareholder Investment Program,participants in P&G stock ownership plans and beneficial owners with accounts at banks and brokerage firms, as of June 30, 2016.
Shareholder Return
The following graph compares the cumulative total return of P&G’s common stock for the five-year period ended June 30, 2016,against the cumulative total return of the S&P 500 Stock Index (broad market comparison) and the S&P 500 Consumer StaplesIndex (line of business comparison). The graph and table assume $100 was invested on June 30, 2011, and that all dividends werereinvested.
Cumulative Value of $100 Investment, through June 30Company Name/Index 2011 2012 2013 2014 2015 2016
P&G $ 100 $ 100 $ 129 $ 136 $ 140 $ 156S&P 500 Index 100 105 127 158 170 177S&P 500 Consumer Staples Index 100 115 135 155 170 202

10 The Procter & Gamble Company
Item 6. Selected Financial Data.
The information required by this item is incorporated by reference to Note 1 and Note 2 to our Consolidated Financial Statements.
Financial Summary (Unaudited)
Amounts in millions, except per share amounts 2016 2015 2014 2013 2012 2011
Net sales $ 65,299 $ 70,749 $ 74,401 $ 73,910 $ 73,138 $ 70,464Gross profit 32,390 33,693 35,371 35,858 35,254 35,110Operating income 13,441 11,049 13,910 13,051 12,495 13,849Net earnings from continuing operations 10,027 8,287 10,658 10,346 8,864 10,509Net earnings/(loss) from discontinued operations 577 (1,143) 1,127 1,056 2,040 1,418Net earnings attributable to Procter & Gamble 10,508 7,036 11,643 11,312 10,756 11,797Net earnings margin from continuing operations 15.4% 11.7% 14.3% 14.0% 12.1% 14.9%Basic net earnings per common share: (1)
Earnings from continuing operations $ 3.59 $ 2.92 $ 3.78 $ 3.65 $ 3.08 $ 3.62Earnings/(loss) from discontinued operations 0.21 (0.42) 0.41 0.39 0.74 0.50
Basic net earnings per common share $ 3.80 $ 2.50 $ 4.19 $ 4.04 $ 3.82 $ 4.12Diluted net earnings per common share: (1)
Earnings from continuing operations $ 3.49 $ 2.84 $ 3.63 $ 3.50 $ 2.97 $ 3.46Earnings/(loss) from discontinued operations 0.20 (0.40) 0.38 0.36 0.69 0.47
Diluted net earnings per common share $ 3.69 $ 2.44 $ 4.01 $ 3.86 $ 3.66 $ 3.93Dividends per common share $ 2.66 $ 2.59 $ 2.45 $ 2.29 $ 2.14 $ 1.97Research and development expense $ 1,879 $ 1,991 $ 1,910 $ 1,867 $ 1,874 $ 1,812Advertising expense 7,243 7,180 7,867 8,188 7,839 7,713Total assets 127,136 129,495 144,266 139,263 132,244 138,354Capital expenditures 3,314 3,736 3,848 4,008 3,964 3,306Long-term debt 18,945 18,327 19,807 19,111 21,080 22,033Shareholders' equity $ 57,983 $ 63,050 $ 69,976 $ 68,709 $ 64,035 $ 68,001
(1) Basic net earnings per common share and Diluted net earnings per common share are calculated based on Net earnings attributable toProcter & Gamble.
The Procter & Gamble Company 11
Item 7. Management's Discussion and Analysis of Financial Condition and Results of Operations.
Management's Discussion and Analysis
Forward-Looking Statements
Certain statements in this report, other than purely historicalinformation, including estimates, projections, statementsrelating to our business plans, objectives and expectedoperating results and the assumptions upon which thosestatements are based, are “forward-looking statements” withinthe meaning of the Private Securities Litigation Reform Act of1995, Section 27A of the Securities Act of 1933 andSection 21E of the Securities Exchange Act of 1934. Forward-looking statements may appear throughout this report,including, without limitation, in the following sections:“Management's Discussion and Analysis” and “Risk Factors.”These forward-looking statements generally are identified bythe words “believe,” “project,” “expect,” “anticipate,”“estimate,” “intend,” “strategy,” “future,” “opportunity,”“plan,” “may,” “should,” “will,” “would,” “will be,” “willcontinue,” “will likely result” and similar expressions.Forward-looking statements are based on current expectationsand assumptions, which are subject to risks and uncertaintiesthat may cause results to differ materially from those expressedor implied in the forward-looking statements. A detaileddiscussion of risks and uncertainties that could cause resultsand events to differ materially from such forward-lookingstatements is included in the section titled "EconomicConditions and Uncertainties" and the section titled “RiskFactors” (Item 1A of this Form 10-K). Forward-lookingstatements are made as of the date of this report, and weundertake no obligation to update or revise publicly anyforward-looking statements, whether because of newinformation, future events or otherwise.
The purpose of Management's Discussion and Analysis(MD&A) is to provide an understanding of Procter & Gamble'sfinancial condition, results of operations and cash flows byfocusing on changes in certain key measures from year to year.The MD&Ais provided as a supplement to, and should be readin conjunction with, our Consolidated Financial Statementsand accompanying notes. The MD&A is organized in thefollowing sections:• Overview• Summary of 2016 Results• Economic Conditions and Uncertainties• Results of Operations• Segment Results• Cash Flow, Financial Condition and Liquidity• Significant Accounting Policies and Estimates• Other Information
Throughout the MD&A, we refer to measures used bymanagement to evaluate performance, including unit volumegrowth, net sales and net earnings. We also refer to a numberof financial measures that are not defined under accountingprinciples generally accepted in the United States of America(U.S. GAAP), including organic sales growth, core earningsper share (Core EPS), adjusted free cash flow and adjusted free
cash flow productivity. Organic sales growth is net salesgrowth excluding the impacts of the Venezueladeconsolidation, acquisitions, divestitures and foreignexchange from year-over-year comparisons. Core EPS isdiluted net earnings per share from continuing operationsexcluding certain items that are not judged to be part of theCompany's sustainable results or trends. Adjusted free cashflow is operating cash flow less capital spending and certaindivestiture impacts. Adjusted free cash flow productivity isthe ratio of adjusted free cash flow to net earnings excludingcertain one-time items. We believe these measures provide ourinvestors with additional information about our underlyingresults and trends, as well as insight to some of the metricsused to evaluate management. The explanation at the end ofthe MD&A provides more details on the use and the derivationof these measures.
Management also uses certain market share and marketconsumption estimates to evaluate performance relative tocompetition despite some limitations on the availability andcomparability of share and consumption information.References to market share and market consumption in theMD&A are based on a combination of vendor-reportedconsumption and market size data, as well as internal estimates.All market share references represent the percentage of salesin dollar terms on a constant currency basis of our products,relative to all product sales in the category.
OVERVIEW
P&G is a global leader in fast-moving consumer goods,focused on providing branded consumer packaged goods ofsuperior quality and value to our consumers around the world.Our products are sold in more than 180 countries and territoriesprimarily through mass merchandisers, grocery stores,membership club stores, drug stores, department stores,distributors, baby stores, specialty beauty stores, e-commerce,high-frequency storesand pharmacies. We have on-the-groundoperations in approximately 70 countries.
Our market environment is highly competitive with global,regional and local competitors. In many of the markets andindustry segments in which we sell our products, we competeagainst other branded products as well as retailers' private-labelbrands. Additionally, many of the product segments in whichwe compete are differentiated by price tiers (referred to assuper-premium, premium, mid-tier and value-tier products).We are well positioned in the industry segments and marketsin which we operate, often holding a leadership or significantmarket share position.

12 The Procter & Gamble Company
ORGANIZATIONAL STRUCTUREOur organizational structure is comprised of Global Business Units (GBUs), Selling and Market Operations (SMOs), GlobalBusiness Services (GBS) and Corporate Functions (CF).
Global Business UnitsOur GBUs are organized into ten product categories. Under U.S. GAAP, the GBUs underlying the ten product categories areaggregated into five reportable segments: Beauty; Grooming; Health Care; Fabric & Home Care; and Baby, Feminine &Family Care. The GBUs are responsible for developing overall brand strategy, new product upgrades and innovations andmarketing plans. The following provides additional detail on our reportable segments and the ten product categories and brandcomposition within each segment.
Reportable Segments% of
Net Sales 1% of Net
Earnings 1 Product Categories (Sub-Categories) Major Brands
Beauty 18% 20%
Hair Care (Conditioner, Shampoo, Styling Aids,Treatments)
Head & Shoulders,Pantene, Rejoice
Skin and Personal Care (Antiperspirant andDeodorant, Personal Cleansing, Skin Care)
Olay, Old Spice,Safeguard, SK-II
Grooming 11% 15%Grooming 2 (Shave Care - Female Blades & Razors,Male Blades & Razors, Pre- and Post-ShaveProducts, Other Shave Care; Appliances)
Braun, Fusion, Gillette,Mach3, Prestobarba,Venus
Health Care 11% 12%
Oral Care (Toothbrushes, Toothpaste, Other OralCare) Crest, Oral-B
Personal Health Care (Gastrointestinal, RapidDiagnostics, Respiratory, Vitamins/Minerals/Supplements, Other Personal Health Care)
Prilosec, Vicks
Fabric & Home Care 32% 27%
Fabric Care (Fabric Enhancers, Laundry Additives,Laundry Detergents) Ariel, Downy, Gain, Tide
Home Care (Air Care, Dish Care, P&GProfessional, Surface Care)
Cascade, Dawn, Febreze,Mr. Clean, Swiffer
Baby, Feminine &Family Care 28% 26%
Baby Care (Baby Wipes, Diapers and Pants) Luvs, Pampers
Feminine Care (Adult Incontinence, Feminine Care) Always, Tampax
Family Care (Paper Towels, Tissues, Toilet Paper) Bounty, Charmin(1) Percent of Net sales and Net earnings from continuing operations for the year ended June 30, 2016 (excluding results held in Corporate).(2) The Grooming product category is comprised of the Shave Care and Appliances GBUs.
Recent Developments: As of June 30, 2015, the Companydeconsolidated our Venezuelan subsidiaries and beganaccounting for our investment in those subsidiaries using thecost method of accounting. This change resulted in a fiscal2015 one-time after-tax charge of $2.1 billion ($0.71 per share).Beginning in fiscal 2016, our financial results only includesales of finished goods to our Venezuelan subsidiaries to theextent we receive cash payments from Venezuela (expected tobe largely through the DIPRO and DICOM exchange market).Accordingly, we no longer include the results of ourVenezuelan subsidiaries' operations in reporting periodsfollowing fiscal 2015 (see Note 1 to the Consolidated FinancialStatements and additional discussion in the MD&A under"Venezuela Impacts" in Results of Operations).InAugust 2014, the Company announced a plan to significantlystreamline our product portfolio by divesting, discontinuing orconsolidating about 100 non-strategic brands. The resultingportfolio of about 65 key brands are in 10 category-basedbusinesses where P&G has leading market positions, strongbrands and consumer-meaningful product technologies.
During fiscal 2016, the company completed the divestiture ofits Batteries business. The Batteries business had historicallybeen part of the Company’s Fabric & Home Care reportablesegment. The results of the Batteries business are presentedas discontinued operations and, as such, are excluded from bothcontinuing operations and segment results for all periodspresented. Additionally, the Batteries balance sheet positionsas of June 30, 2015 are presented as held for sale in theConsolidated Balance Sheets.On July 9, 2015, the Company announced the signing of adefinitive agreement to divest four product categories, to CotyInc. ("Coty"). Coty's offer was $12.5 billion. The divestiturewas initially comprised of 43 of the Company's beauty brands("Beauty Brands"), including the global salon professional haircare and color, retail hair color, cosmetics and fine fragrancebusinesses, along with select hair styling brands. Subsequentto signing, two of the fine fragrance brands, Dolce Gabbanaand Christina Aguilera, were excluded from the divestiture.While the ultimate form of the transaction has not yet beendecided, the Company’s current preference is for a Reverse

The Procter & Gamble Company 13
Morris Trust split-off transaction in which P&G shareholderscould elect to participate in an exchange offer to exchange theirP&G shares for Coty shares. The Company expects tocomplete this transaction in October 2016. The results of theBeauty Brands are now presented as discontinued operationsand, as such, are excluded from both continuing operations andsegment results for all periods presented. Additionally, theBeauty Brands' balance sheet positions as of June 30, 2016 andJune 30, 2015 are presented as held for sale in the ConsolidatedBalance Sheets.During fiscal 2015, the Company completed the divestiture ofits Pet Care business. The gain on the transaction was notmaterial. The results of the Pet Care business are presented asdiscontinued operations and, as such, are excluded from bothcontinuing operations and segment results for all periodspresented.With these transactions and other recent minor branddivestitures, the Company will have substantially completedthe strategic portfolio reshaping program.Beauty: We are a global market leader in the beauty category.Most of the beauty markets in which we compete are highlyfragmented with a large number of global and localcompetitors. We compete in skin and personal care and in haircare. In skin and personal care, we offer a wide variety ofproducts, ranging from deodorants to personal cleansing to skincare, such as our Olay brand, which is one of the top facial skincare brands in the world with over 7% global market share. Inhair care, we compete in the retail channel. We are the globalmarket leader in the retail hair care market with over 20%global market share primarily behind our Pantene and Head &Shoulders brands.Grooming: We compete in Shave Care and Appliances. InShave Care, we are the global market leader in the blades andrazors market. Our global blades and razors market share isnearly 65%, primarily behind the Gillette franchise includingFusion, Mach3, Prestobarba and Venus. Our appliances, suchas electric razors and epilators, are sold under the Braun brandin a number of markets around the world where we competeagainst both global and regional competitors. We hold over20% of the male shavers market and nearly 45% of the femaleepilators market.Health Care: We compete in oral care and personal healthcare. In oral care, there are several global competitors in themarket and we have the number two market share position withnearly 20% global market share behind our Oral-B and Crestbrands. In personal health care, we are a top ten competitor ina large, highly fragmented industry, primarily behindrespiratory treatments (Vicks brand), nonprescriptionheartburn medications (Prilosec OTC brand) and digestivewellness products (Metamucil, Pepto Bismol, and Alignbrands). Nearly all of our sales outside the U.S. in personalhealth care are generated through the PGT Healthcarepartnership with Teva Pharmaceuticals Ltd.Fabric & Home Care: This segment is comprised of a varietyof fabric care products including laundry detergents, additivesand fabric enhancers; and home care products includingdishwashing liquids and detergents, surface cleaners and air
fresheners. In fabric care, we generally have the number oneor number two market share position in the markets in whichwe compete and are the global market leader with nearly 30%global market share, primarily behind our Tide, Ariel andDowny brands. Our global home care market share is nearly25% across the categories in which we compete.Baby, Feminine & Family Care: In baby care, we competemainly in diapers, pants and baby wipes with nearly 30% globalmarket share. We are the number one or number two baby carecompetitor in most of the key markets in which we compete,primarily behind Pampers, the Company's largest brand, withannual net sales of nearly $9 billion. We are the global marketleader in the feminine care category with over 25% globalmarket share, primarily behind Always. We also compete inthe adult incontinence category in certain markets, achievingover 10% market share in the markets where we compete. Ourfamily care business is predominantly a North Americanbusiness comprised largely of the Bounty paper towel andCharmin toilet paper brands. U.S. market shares are over 40%for Bounty and over 25% for Charmin.Selling and Market OperationsOur SMOs are responsible for developing and executing go-to-market plans at the local level. The SMOs include dedicatedretail customer, trade channel and country-specific teams. OurSMOs are organized under six regions comprised of NorthAmerica, Europe, Latin America, Asia Pacific, Greater Chinaand India, Middle East and Africa (IMEA). Throughout theMD&A, we reference business results in developed markets,which are comprised of North America, Western Europe andJapan, and developing markets which are all other markets notincluded in developed.Global Business ServicesGBS provides technology, processes and standard data toolsto enable the GBUs and the SMOs to better understand thebusiness and better serve consumers and customers. The GBSorganization is responsible for providing world-class solutionsat a low cost and with minimal capital investment.Corporate FunctionsCF provides company-level strategy and portfolio analysis,corporate accounting, treasury, tax, external relations,governance, human resources and legal, as well as othercentralized functional support.
STRATEGIC FOCUSP&G aspires to serve the world’s consumers better than ourbest competitors in every category and in every country inwhich we compete, and, as a result, deliver total shareholderreturn in the top one-third of our peer group. Delivering andsustaining leadership levels of shareholder value creationrequires balanced top-line growth, bottom-line growth andstrong cash generation.Our strategic choices are focused on winning with consumers.The consumers who purchase and use our products are at thecenter of everything we do. We increase the number of users- and the usage - of our brands when we win at the zero, firstand second moments of truth: when consumers research our

14 The Procter & Gamble Company
categories and brands, purchase them in a store or online anduse them in their homes.Winning with consumers around the world and against our bestcompetitors requires innovation. Innovation has always been,and continues to be, P&G’s lifeblood. Innovation requiresconsumer insights and technology advancements that lead toproduct improvements, improved marketing andmerchandising programs and game-changing inventions thatcreate new brands and categories.Productivity improvement is critical to delivering our balancedtop-line growth, bottom-line growth and value creationobjectives. Productivity improvement and sales growthreinforce and fuel each other. We are driving productivityimprovement across all elements of cost, including cost ofgoods sold, marketing and promotional expenses and non-manufacturing overhead. Productivity improvements and costsavings are being reinvested in product and packagingimprovements, brand awareness-building advertising andtrial-building sampling programs, increased sales coverageand R&D programs.We are improving operational effectiveness and organizationalculture through enhanced clarity of roles and responsibilities,accountability and incentive compensation programs.
The Company has undertaken an effort to focus and strengthenits business portfolio to compete in categories and with brandsthat are structurally attractive and that play to P&G's strengths.The ongoing portfolio of businesses consists of 10 productcategories. These are categories where P&G has leadingmarket positions, strong brands and consumer-meaningfulproduct technologies.We believe these strategies are right for the long-term healthof the Company and our objective of delivering totalshareholder return in the top one-third of our peer group.The Company expects the delivery of the following long-termannual financial targets will result in total shareholder returnsin the top third of the competitive peer group:• Organic sales growth above market growth rates in the
categories and geographies in which we compete;• Core EPS growth of mid-to-high single digits; and• Adjusted free cash flow productivity of 90% or greater.In periods with significant macroeconomic pressures, weintend to maintain a disciplined approach to investing so as notto sacrifice the long-term health of our businesses to meet short-term objectives in any given year.
SUMMARY OF 2016 RESULTS
Amounts in millions, except per share amounts 2016Change vs.Prior Year 2015
Change vs.Prior Year 2014
Net sales $ 65,299 (8)% $ 70,749 (5)% $ 74,401Operating income 13,441 22 % 11,049 (21)% 13,910Net earnings from continuing operations 10,027 21 % 8,287 (22)% 10,658Net earnings/(loss) from discontinued operations 577 N/A (1,143) N/A 1,127Net earnings attributable to Procter & Gamble 10,508 49 % 7,036 (40)% 11,643Diluted net earnings per common share 3.69 51 % 2.44 (39)% 4.01Diluted net earnings per share from continuing operations 3.49 23 % 2.84 (22)% 3.63Core EPS 3.67 (2)% 3.76 (2)% 3.85Cash flow from operating activities 15,435 6 % 14,608 5 % 13,958
• Net sales decreased 8% to $65.3 billion including anegative 6% impact from foreign exchange.
Organic sales increased 1%, as increased pricing waspartially offset by a reduction in organic volume.Unit volume decreased 3%. Volume decreased lowsingle digits in Grooming, Health Care, Fabric &Home Care and Baby, Feminine & Family Care.Volume decreased mid-single digits in Beauty.Organic volume declined 1%.
• Net earnings from continuing operations increased $1.7billion or 21% in fiscal 2016 due to a $2.1 billion after-tax charge in the prior year related to the deconsolidationof our Venezuelan subsidiaries and improved grossmargin, partially offset by the earnings impact of thedecline in net sales. Foreign exchange impacts negativelyaffected net earnings from continuing operations by $880million or approximately 11%.
• Net earnings from discontinued operations increased $1.7billion due primarily to the net impact of a gain on the saleof our Batteries business in fiscal 2016 and higherimpairment charges on that business in the prior period.
• Net earnings attributable to Procter & Gamble were $10.5billion, an increase of $3.5 billion or 49% versus the prioryear due to the aforementioned increases in net earningsfrom both continuing and discontinued operations.
• Diluted net earnings per share increased 51% to $3.69.Diluted net earnings per share from continuingoperations increased 23% to $3.49.Core EPS decreased 2% to $3.67.
• Cash flow from operating activities was $15.4 billion.Adjusted free cash flow was $12.1 billion.Adjusted free cash flow productivity was 115%.

The Procter & Gamble Company 15
ECONOMIC CONDITIONS AND UNCERTAINTIES
We discuss expectations regarding future performance, eventsand outcomes, such as our business outlook and objectives, inannual and quarterly reports, press releases and other writtenand oral communications. All such statements, except forhistorical and present factual information, are "forward-looking statements" and are based on financial data and ourbusiness plans available only as of the time the statements aremade, which may become out-of-date or incomplete. Weassume no obligation to update any forward-lookingstatements as a result of new information, future events or otherfactors. Forward-looking statements are inherently uncertainand investors must recognize that events could be significantlydifferent from our expectations. For more information on risksthat could impact our results, refer to Item 1A Risk Factors inthis Form 10-K.
Global Economic Conditions. Current macroeconomicfactors remain dynamic, and any causes of market sizecontraction, such as reduced GDP in commodity-producingeconomies as commodity prices decline, greater politicalunrest in the Middle East and Eastern Europe, further economicinstability in the European Union, political instability in certainLatin American markets and economic slowdowns in Japanand China, could reduce our sales or erode our operatingmargin, in either case reducing our earnings.
Changes in Costs. Our costs are subject to fluctuations,particularly due to changes in commodity prices and our ownproductivity efforts. We have significant exposures to certaincommodities, in particular certain oil-derived materials likeresins, and volatility in the market price of these commodityinput materials has a direct impact on our costs. If we areunable to manage commodity fluctuations through pricingactions, cost savings projects and sourcing decisions as wellas through consistent productivity improvements, it mayadversely impact our gross margin, operating margin and netearnings. Sales could also be adversely impacted followingpricing actions if there is a negative impact on consumption ofour products. We strive to implement, achieve and sustain costimprovement plans, including outsourcing projects, supplychain optimization and general overhead and workforceoptimization. As discussed later in the MD&A, we initiatedcertain non-manufacturing overhead reduction projects alongwith manufacturing and other supply chain cost improvementsprojects in 2012. If we are not successful in executing thesechanges, there could be a negative impact on our operatingmargin and net earnings.
Foreign Exchange. We have both translation and transactionexposure to the fluctuation of exchange rates. Translationexposures relate to exchange rate impacts of measuring incomestatements of foreign subsidiaries that do not use the U.S. dollaras their functional currency. Transaction exposures relate to1) the impact from input costs that are denominated in acurrency other than the local reporting currency and 2) therevaluation of transaction-related working capital balancesdenominated in currencies other than the functional currency.In 2016, 2015 and 2014, the U.S. dollar has strengthened versusa number of foreign currencies leading to lower sales and
earnings from these foreign exchange impacts. Certaincountries experiencing significant exchange rate fluctuations,likeArgentina, Brazil, Canada, Egypt, Mexico, Nigeria, Russiaand Turkey have had, and could have, a significant impact onour sales, costs and earnings. Increased pricing in response tothese fluctuations in foreign currency exchange rates mayoffset portions of the currency impacts, but could also have anegative impact on consumption of our products, which wouldaffect our sales.
Government Policies. Our net earnings could be affected bychanges in U.S. or foreign government tax policies. Forexample, the U.S. may consider corporate tax reform that couldsignificantly impact the corporate tax rate and change the U.S.tax treatment of international earnings. Additionally, weattempt to carefully manage our debt and currency exposurein certain countries with currency exchange, importauthorization and pricing controls, such as Argentina, Egypt,Nigeria and Ukraine. Changes in government policies in theseareas might cause an increase or decrease in our sales, operatingmargin and net earnings.
RESULTS OF OPERATIONS
The key metrics included in our discussion of our consolidatedresults of operations include net sales, gross margin, selling,general and administrative costs (SG&A), other non-operatingitems and income taxes. The primary factors driving year-over-year changes in net sales include overall market growthin the categories in which we compete, product initiatives, thelevel of initiatives and other activities by competitors,geographic expansion and acquisition and divestiture activity,all of which drive changes in our underlying unit volume, aswell as pricing actions (which can also indirectly impactvolume), changes in product and geographic mix and foreigncurrency impacts on sales outside the U.S.
Most of our cost of products sold and SG&Aare to some extentvariable in nature. Accordingly, our discussion of theseoperating costs focuses primarily on relative margins ratherthan the absolute year-over-year changes in total costs. Theprimary drivers of changes in gross margin are input costs(energy and other commodities), pricing impacts, geographicmix (for example, gross margins in developed markets aregenerally higher than in developing markets for similarproducts), product mix (for example, the Beauty segment hashigher gross margins than the Company average), foreignexchange rate fluctuations (in situations where certain inputcosts may be tied to a different functional currency than theunderlying sales), the impacts of manufacturing savingsprojects and to a lesser extent scale impacts (for costs that arefixed or less variable in nature). The primary drivers of SG&Aare marketing-related costs and non-manufacturing overheadcosts. Marketing-related costs are primarily variable in nature,although we may achieve some level of scale benefit over timedue to overall growth and other marketing efficiencies.Overhead costs are also variable in nature, but on a relativebasis, less so than marketing costs due to our ability to leverageour organization and systems infrastructures to supportbusiness growth. Accordingly, we generally experience morescale-related impacts for these costs.

16 The Procter & Gamble Company
The Company is in the midst of a productivity and cost savingsplan to reduce costs in the areas of supply chain, marketingand overhead expenses. The plan is designed to accelerate costreductions by streamlining management decision making,manufacturing and other work processes to fund theCompany's growth strategy.
Net Sales
Fiscal year 2016 compared with fiscal year 2015
Net sales decreased 8% to $65.3 billion in 2016 on a 3%decrease in unit volume versus the prior year period. Volumedecreased low single digits in Grooming, Health Care, Fabric& Home Care and Baby, Feminine & Family Care anddecreased mid-single digits in Beauty. Volume increased lowsingle digits in developed regions and declined high singledigits in developing regions, in part due to increased pricingto address foreign exchange devaluations and due to theVenezuela deconsolidation and minor brand divestitures.Organic volume declined mid-single digits in developingmarkets. Unfavorable foreign exchange reduced net sales by
6%, while higher pricing drove a 1% favorable impact on netsales. Organic volume decreased 1% and organic sales grew1% driven by higher pricing.
Fiscal year 2015 compared with fiscal year 2014
Net sales decreased 5% to $70.7 billion in 2015 on a 1%decrease in unit volume versus the prior year period. Volumegrew low single digits in Fabric & Home Care. Volumedecreased low single digits in Baby, Feminine & Family Care,Grooming, Health Care and Beauty. Volume increased lowsingle digits in developed regions and declined low singledigits in developing regions due, in part, to increased pricingto address foreign exchange devaluations. Unfavorableforeign exchange reduced net sales by 6%, while higher pricingdrove a 2% favorable impact on net sales. Favorable productmix impact of 1% was offset by acquisition and divestitureactivity. Organic volume decreased 1% and organic sales grew2% driven by higher pricing.
Operating Costs
Comparisons as a percentage of net sales; Years ended June 30 2016Basis Point
Change 2015Basis Point
Change 2014
Gross margin 49.6% 200 47.6% 10 47.5%Selling, general and administrative expense 29.0% (10) 29.1% 30 28.8%Operating margin 20.6% 500 15.6% (310) 18.7%Earnings from continuing operations before income taxes 20.5% 490 15.6% (260) 18.2%Net earnings from continuing operations 15.4% 370 11.7% (260) 14.3%Net earnings attributable to Procter & Gamble 16.1% 620 9.9% (570) 15.6%
Fiscal year 2016 compared with fiscal year 2015Gross margin increased 200 basis points to 49.6% of net salesin 2016. Gross margin increased primarily due to:• a 210 basis point positive impact from manufacturing cost
savings,• a 110 basis point benefit from lower commodity costs and• a 70 basis point benefit of higher pricing.These impacts were partially offset by:• a 70 basis point negative impact from unfavorable foreign
exchange,• a 70 basis point decrease due to unfavorable product mix
caused by the disproportionate decline of higher marginsegments like Beauty and by product form mix within thesegments,
• a 20 basis point decrease from negative scale impacts dueto lower volume and
• a 20 basis point decline due to incremental restructuringactivity.
Total SG&A decreased 8% to $18.9 billion primarily due toreduced overhead spending and a decrease in foreign exchangetransaction charges. SG&A as a percentage of net salesdeclined 10 basis points to 29.0%, as the negative scale
impacts of lower net sales and inflationary impacts were morethan offset by cost savings efforts, mainly in overheadspending, and lower foreign exchange transactional charges.• Marketing spending as a percentage of net sales increased
90 basis points due to the negative scale impacts fromreduced sales.
• Overhead costs as a percentage of net sales decreased 20basis points, as 90 basis points of productivity savingswere partially offset by wage inflation, increased salespersonnel in certain businesses, investments in researchand development and the negative scale impacts fromreduced sales.
• Lower foreign exchange transactional charges reducedSG&A as a percentage of net sales by approximately 70basis points. A pre-deconsolidation balance sheetremeasurement charge in Venezuela in the base perioddrove 20 basis points of this decline. The balance of thereduction relates to lower transactional charges fromrevaluing receivables and payables from transactionsdenominated in a currency other than a local entity’sfunctional currency.

The Procter & Gamble Company 17
Fiscal year 2015 compared with fiscal year 2014Gross margin increased 10 basis points to 47.6% of net salesin 2015. Gross margin benefited from:• a 200 basis point impact from manufacturing cost savings
and• a 90 basis point benefit from higher pricing.
These impacts were partially offset by:• a 110 basis point impact from unfavorable geographic and
product mix, primarily from declines in the higher thanaverage margin Beauty and Grooming segments as wellas within the Fabric & Home Care and Groomingsegments,
• a 50 basis point impact from unfavorable foreignexchange,
• a 40 basis point impact from costs related to initiatives andcapacity investments,
• a 30 basis point impact from higher restructuring costs and• smaller impacts from lower volume scale and higher
commodity costs.
Total SG&A decreased 4% to $20.6 billion, as reducedoverhead and marketing spending was partially offset byincreased foreign exchange transaction charges. SG&A as apercentage of net sales increased 30 basis points to 29.1%, asthe negative scale impacts of lower net sales and inflationaryimpacts were partially offset by cost savings efforts.• Marketing spending as a percentage of net sales decreased
60 basis points behind lower spending due to efficiencyefforts.
• Overhead spending as a percentage of net sales increased50 basis points as productivity savings of 60 basis pointsfrom reduced overhead spending were more than offsetby wage inflation, investments in research anddevelopment, the negative scale impacts of lower net salesand higher restructuring costs.
• Increased foreign exchange transaction charges addedapproximately 40 basis points to SG&A as a percentageof net sales, as current year foreign currency transactioncharges (from revaluing receivables and payablesdenominated in a currency other than a local entity’sfunctional currency) were partially offset by lower year-on-year charges for Venezuela remeasurement anddevaluation.
During fiscal 2015, the Company incurred a $2.0 billion ($2.1billion after tax) charge related to the deconsolidation of itsVenezuelan subsidiaries. See the “Venezuela Impacts” later inthe Results of Operations section.
Non-Operating Items
Fiscal year 2016 compared with fiscal year 2015• Interest expense was $579 million in 2016, a decrease of
$47 million versus the prior year due to lower average debtbalances.
• Interest income was $182 million in 2016, an increase of$33 million versus the prior year primarily due toincreasing cash, cash equivalents and investmentsecurities balances.
• Other non-operating income, which primarily includesdivestiture gains and investment income, decreased $115million to $325 million, due primarily to lower gains onminor brand divestitures. In 2016, we had approximately$300 million in minor brand divestiture gains, includingEscudo and certain hair care brands in Europe and IMEA.The prior year acquisition and divestiture activitiesincluded approximately $450 million in divestiture gains,including Zest, Camay, Fekkai and Wash & Go hair carebrands and Vaposteam.
Fiscal year 2015 compared with fiscal year 2014• Interest expense was $626 million in 2015 a decrease of
$83 million versus the prior year due to lower average debtbalances and a decrease in weighted average interest rates.
• Interest income was $149 million in 2015, an increase of$50 million versus the prior year due to an increase in cash,cash equivalents and investment securities.
• Other non-operating income increased $231 million to$440 million, primarily due to minor brand divestituregains. In 2015, we had approximately $450 million inminor brand divestiture gains, including Zest, Camay,Fekkai and Wash & Go hair care brands and Vaposteam.The prior year acquisition and divestiture activitiesincluded approximately $150 million in divestiture gains,primarily related to the sale of our bleach businesses inEurope, IMEA and Latin America, our Pert hair carebusiness in Latin America and MDVIP.
Income Taxes
Fiscal year 2016 compared with fiscal year 2015
The effective tax rate on continuing operations increased 30basis points to 25.0% in 2016 mainly due to a 260 basis pointnegative impact from the unfavorable geographic mix ofearnings, a 130 basis point impact in the current year from theestablishment of valuation allowances on deferred tax assetsrelated to net operating loss carryforwards and the impact offavorable discrete adjustments related to uncertain income taxpositions (which netted to 55 basis points in the current yearversus 85 basis points in the prior year), partially offset by a400 basis point decrease related to the prior year non-deductibility of the Venezuelan deconsolidation charge.
Fiscal year 2015 compared with fiscal year 2014
The effective tax rate on continuing operations increased 360basis points to 24.7% in 2015 mainly due to the non-deductibility of the $2.0 billion Venezuelan deconsolidationcharge. The rate increase caused by lower favorable discreteadjustments related to uncertain income tax positions (the netbenefit was 80 basis points in fiscal 2015 versus 170 basispoints in fiscal 2014) was largely offset by a decrease relatedto favorable geographic earnings mix.
Net Earnings
Fiscal year 2016 compared with fiscal year 2015
Net earnings from continuing operations increased $1.7 billionor 21% to $10.0 billion primarily due to the base period chargeof $2.1 billion after-tax related to the deconsolidation of

18 The Procter & Gamble Company
Venezuelan subsidiaries. Earnings also declined due to theimpact of the decline in net sales in fiscal 2016, partially offsetby improved gross margin and the reduction in SG&A. Foreignexchange impacts reduced net earnings by about $880 millionin 2016 due to weakening of certain key currencies against theU.S. dollar, primarily in Argentina, Brazil, Canada, Mexicoand Russia. This impact includes both transactional chargesas discussed above in Operating Costs and translationalimpacts from converting earnings from foreign subsidiaries toU.S. dollars.
Net earnings from discontinued operations improved $1.7billion in 2016 to $577 million. Batteries drove a $2.1 billionimprovement due primarily to a $1.8 billion reduction in after-tax impairment charges in the Batteries business ($350 millionin the current year compared to $2.1 billion in the base period)and a $422 million after-tax gain in the current period from thesale of the Batteries business. This was partially offset by adecrease in the earnings of the Beauty Brands (see Note 4 tothe Consolidated Financial Statements).
Net earnings attributable to Procter & Gamble increased $3.5billion, or 49% to $10.5 billion.
Diluted net earnings per share from continuing operationsincreased $0.65, or 23%, to $3.49 due to the increase in netearnings and a decline in the average number of sharesoutstanding. Diluted net earnings per share from discontinuedoperations were $0.20 primarily resulting from the gain on thesale of the Batteries business. This was an improvement of$0.60 per share versus the prior year. Diluted net earnings pershare increased $1.25, or 51%, to $3.69.
Core EPS decreased 2% to $3.67. Core EPS in fiscal year 2016represents diluted net earnings per share from continuingoperations excluding charges for certain European legalmatters and incremental restructuring related to ourproductivity and cost savings plan. The decline was driven byreduced net sales and foreign exchange impacts, partially offsetby gross margin expansion.
Fiscal year 2015 compared with fiscal year 2014
Net earnings from continuing operations decreased $2.4 billionor 22% to $8.3 billion due to the $2.1 billion after-tax chargerelated to the deconsolidation of Venezuelan subsidiaries andthe decline in net sales, partially offset by reduced SG&A.Foreign exchange impacts negatively affected net earnings byapproximately $1.3 billion in 2015 due to the weakening ofcertain key currencies against the U.S. dollar, primarily inRussia, Ukraine, Venezuela and Argentina, partially offset bylower after-tax charges related to balance sheet remeasurementcharges in Venezuela.
Net earnings from discontinued operations decreased $2.3billion in 2015 due primarily to $2.1 billion of after-taximpairment charges in our Batteries business (see Note 4 tothe Consolidated Financial Statements) and the absence offiscal 2015 earnings from our divested Pet Care business. Netearnings attributable to Procter & Gamble decreased $4.6billion, or 40% to $7.0 billion.
Diluted net earnings per share from continuing operationsdecreased $0.79, or 22%, to $2.84 due to the decrease in netearnings. We had a diluted net loss per share from discontinuedoperations of $0.40 due primarily to the impairment chargeson the Batteries business. This was a reduction of $0.78 pershare versus the prior year. Diluted net earnings per sharedecreased $1.57, or 39%, to $2.44.
Core EPS decreased 2% to $3.76. Core EPS represents dilutednet earnings per share from continuing operations excludingcharges for Venezuelan deconsolidation, balance sheetremeasurement charges from foreign exchange policy changesand devaluation in Venezuela, charges for certain Europeanlegal matters and incremental restructuring related to ourproductivity and cost savings plan. The decline was driven byreduced net sales, partially offset by minor brand divestituregains.
Venezuela Impacts
There are a number of currency and other operating controlsand restrictions in Venezuela, which have evolved over timeand may continue to evolve in the future. These evolvingconditions resulted in an other-than-temporary lack ofexchangeability between the Venezuelan bolivar and U.S.dollar and restricted our Venezuelan operations’ ability to paydividends or pay for certain raw and package materials,finished goods and services denominated in U.S. dollars. Foraccounting purposes, this resulted in a lack of control over ourVenezuelan subsidiaries. Therefore, in accordance with theapplicable accounting standards for consolidation, effectiveJune 30, 2015, we deconsolidated our Venezuelan subsidiariesand began accounting for our investment in those subsidiariesusing the cost method of accounting. This resulted in a write-off of all of the net assets of our Venezuelan subsidiaries, alongwith Venezuela related assets held by other subsidiaries.Beginning with the first quarter of fiscal 2016, our financialresults only include sales of finished goods to our Venezuelansubsidiaries to the extent we receive payments from Venezuela.Accordingly, we no longer include the results of ourVenezuelan subsidiaries’ operations in our financial results.

The Procter & Gamble Company 19
SEGMENT RESULTSSegment results reflect information on the same basis we use for internal management reporting and performance evaluation. Theresults of these reportable segments do not include certain non-business unit specific costs such as interest expense, investingactivities and certain restructuring and asset impairment costs. These costs are reported in our Corporate segment and are includedas part of our Corporate segment discussion. Additionally, as described in Note 2 to the Consolidated Financial Statements, weapply blended statutory tax rates in the segments. Eliminations to adjust segment results to arrive at our effective tax rate areincluded in Corporate. All references to net earnings throughout the discussion of segment results refer to net earnings fromcontinuing operations.
Net Sales Change Drivers 2016 vs. 2015*
Volume withAcquisitions &
Divestitures
VolumeExcluding
Acquisitions &Divestitures
ForeignExchange Price Mix Other**
Net SalesGrowth
Beauty (5 )% (2 )% (6 )% 2 % — % — % (9 )%Grooming (2 )% (2 )% (9 )% 5 % (2)% — % (8 )%Health Care (2 )% (2 )% (6 )% 2 % 1 % — % (5 )%Fabric & Home Care (1 )% 1 % (6 )% — % — % — % (7 )%Baby, Feminine & Family Care (3 )% (2 )% (6 )% — % — % — % (9 )%TOTAL COMPANY (3)% (1)% (6)% 1% — % —% (8)%
Net Sales Change Drivers 2015 vs. 2014*
Volume withAcquisitions &
Divestitures
VolumeExcluding
Acquisitions &Divestitures
ForeignExchange Price Mix Other**
Net SalesGrowth
Beauty (3 )% (2 )% (5 )% 2 % — % — % (6 )%Grooming (3 )% (3 )% (8 )% 4 % — % — % (7 )%Health Care (1 )% (1 )% (5 )% 2 % 3 % — % (1 )%Fabric & Home Care 1 % 1 % (6 )% 1 % — % (1 )% (5 )%Baby, Feminine & Family Care (1 )% (1 )% (6 )% 2 % 2 % — % (3 )%TOTAL COMPANY (1)% (1)% (6)% 2% 1% (1)% (5)%
* Net sales percentage changes are approximations based on quantitative formulas that are consistently applied.** Other includes the sales mix impact from acquisitions and divestitures and rounding impacts necessary to reconcile volume to net sales.
BEAUTY
($ millions) 2016Changevs. 2015 2015
Changevs. 2014
Volume N/A (5)% N/A (3)%Net sales $11,477 (9)% $12,608 (6)%Net earnings $1,975 (9)% $2,181 (5)%% of net sales 17.2% (10) bps 17.3% 10 bps
Fiscal year 2016 compared with fiscal year 2015
Beauty net sales decreased 9% to $11.5 billion during the fiscalyear on a 5% decrease in unit volume. Unfavorable foreignexchange reduced net sales by 6%. Price increases had a 2%positive impact on net sales. Organic sales were unchangedon organic volume that decreased 2%. Global market share ofthe Beauty segment decreased 1.0 points. Volume decreasedlow single digits in developed markets and decreased highsingle digits in developing markets.
• Volume in Hair Care was down mid-single digits.Developed markets declined mid-single digits due tocompetitive activity while developing markets declinedmid-single digits driven by increased pricing, theVenezuela deconsolidation and minor brand divestitures.Global market share of the hair care category decreasedmore than a point.
• Volume in Skin and Personal Care decreased high singledigits, while organic volume decreased low single digits,with the difference attributable to the Camay and Zestbrand divestitures and the Venezuela deconsolidation.Organic volume was unchanged in developed regions ascommercial innovation was offset by ongoing competitiveactivity. Organic volume declined mid-single digits indeveloping regions primarily due to increased pricing andcompetitive activity. Global market share of the skin andpersonal care category decreased nearly a point.

20 The Procter & Gamble Company
Net earnings decreased 9% to $2.0 billion primarily due to thereduction in net sales, along with a 10 basis-point decrease innet earnings margin. Net earnings margin decreased due to anincrease in SG&A as a percentage of net sales, largely offsetby gross margin expansion. Gross margin improved due toproductivity savings, increased pricing and lower commoditycosts, partially offset by negative mix. SG&A as a percentageof net sales increased as lower marketing and overheadspending from the Company's focus on efficiencies was morethan offset by the negative scale impacts from the reduction insales.
Fiscal year 2015 compared with fiscal year 2014
Beauty net sales decreased 6% to $12.6 billion in 2015 on a3% decrease in unit volume. Organic sales were unchangedon a 2% decline in organic volume. Unfavorable foreignexchange reduced net sales by 5%. Increased pricing was abenefit of 2%. Global market share of the Beauty segmentdecreased 0.6 points. Volume decreased low single digits indeveloped markets and was down mid-single digits indeveloping markets.• Volume in Hair Care decreased low single digits in both
developed and developing markets following minordivestitures and competitive activity. Global market shareof the hair care category was down more than half a point.
• Volume in Skin and Personal Care was down mid-singledigits, driven by a high single-digits decline in developingmarkets, primarily due to decreases in skin care andpersonal cleansing due to ongoing competitive activity.Volume was unchanged in developed markets. Globalmarket share of the skin and personal care category wasdown half a point.
Net earnings decreased 5% to $2.2 billion primarily due tolower volume and the currency-driven reduction in net sales.Net earnings margin increased 10 basis points primarily dueto a reduction in SG&A as a percent of sales, behind lowerspending from the Company's focus on marketing efficiencies.
GROOMING
($ millions) 2016Change vs.
2015 2015Changevs. 2014
Volume N/A (2)% N/A (3)%Net sales $6,815 (8)% $7,441 (7)%Net earnings $1,548 (13)% $1,787 (9)%% of net sales 22.7% (130) bps 24.0% (40) bps
Fiscal year 2016 compared with fiscal year 2015Grooming net sales decreased 8% to $6.8 billion during thefiscal year on a 2% decrease in unit volume. Unfavorableforeign exchange reduced net sales by 9%. Price increases inShave Care contributed 5% to net sales. Unfavorable productmix decreased net sales by 2% due to a higher relative mix ofdisposable razors, which have lower than segment averageselling prices compared to system razor cartridges. Organicsales increased 2%. Global market share of the Groomingsegment decreased 1.1 points. Volume decreased low singledigits in developed and developing regions.
• Shave Care volume decreased low single digits in bothdeveloped and developing regions due to competitiveactivity and increased pricing. Global market share of theshave care category decreased more than half a point.
• Volume in Appliances was up mid-single digits due to amid-single-digit increase in developed regions fromproduct innovation. Volume in developing regionsincreased low single digits due to growth from productinnovation, partially offset by reductions due to increasedpricing. Global market share of the Appliances categorydecreased more than half a point.
Net earnings decreased 13% to $1.5 billion due to the reductionin net sales and a 130 basis-point decrease in net earningsmargin. Net earnings margin decreased due to increasedSG&A as a percentage of net sales partially offset by a lowertax rate. Gross margin was unchanged as the benefits ofincreased pricing and productivity efforts were largely offsetby unfavorable foreign exchange impacts and negative productmix caused by an increase in the proportion of disposable razorsales compared to system razor cartridges. SG&A as apercentage of net sales increased due to increased marketingspending and the negative scale impact of lower net sales. Thetax rate declined due to the geographic mix of earnings.
Fiscal year 2015 compared with fiscal year 2014
Grooming net sales decreased 7% to $7.4 billion in 2015 on a3% decrease in unit volume. Organic sales increased 1%. Priceincreases in blades and razors and appliances contributed 4%to net sales while unfavorable foreign exchange reduced netsales by 8%. Global market share of the Grooming segmentdecreased 0.1 points versus year ago. Volume decreased lowsingle digits in both developed and developing regions.• Shave Care volume decreased low single digits due to a
mid-single-digit decline in developed regions from lowertrade inventory levels and a low-single digit decrease indeveloping regions following increased pricing. Globalmarket share of the shave care category was up slightly.
• Volume in Appliances increased mid-single digits due tomid-single-digit growth in developed markets and lowsingle-digit growth in developing markets behind productinnovation and market growth. Global market share ofthe Appliances category was flat.
Net earnings decreased 9% to $1.8 billion due to the declinein net sales and a 40 basis-point decrease in net earningsmargin. Net earnings margin decreased due to higher SG&Aspending as a percent of sales. Decreased spending due tomarketing efficiencies and overhead reductions did not keeppace with the currency-driven reduction in net sales. Grossmargin was unchanged as negative geographic mix from adisproportionate decline in developed regions was offset bymanufacturing cost savings.

The Procter & Gamble Company 21
HEALTH CARE
($ millions) 2016Changevs. 2015 2015
Changevs. 2014
Volume N/A (2)% N/A (1)%Net sales $7,350 (5)% $7,713 (1)%Net earnings $1,250 7% $1,167 8%% of net sales 17.0% 190 bps 15.1% 120 bps
Fiscal year 2016 compared with fiscal year 2015
Health Care net sales were down 5% to $7.4 billion during thefiscal year on a 2% decrease in unit volume. Unfavorableforeign exchange reduced net sales by 6%. Price increasescontributed 2% to net sales, mainly in developing markets.Favorable geographic mix increased net sales 1%, primarilydriven by a decline in Oral Care volume in developing regions,which have lower than segment average selling prices. Organicsales increased 2%. Global market share of the Health Caresegment decreased 0.7 points. Volume was up low single digitsin developed regions and declined high single digits indeveloping regions.• Oral Care volume declined low single digits due to a high
single-digit decrease in developing regions caused byincreased pricing, competitive activity and reducedcustomer inventory. Volume in developed regionsincreased low single digits driven by product innovation.Global market share of the oral care category was downless than a point.
• Volume in Personal Health Care decreased mid-singledigits primarily due to a mid-single-digit decrease indeveloped regions driven by competitive activity and aweak cough/cold season. Volume in developing marketsdecreased low single digits due to increased pricing.Global market share of the personal health care categorydecreased half a point.
Net earnings increased 7% to $1.3 billion as the reduction innet sales was more than offset by a 190 basis-point increase innet earnings margin. Gross margin increased primarily due tomanufacturing cost savings and increased pricing. SG&A asa percentage of net sales decreased primarily due to reducedmarketing spending from the focus on productivity and costsavings efforts.
Fiscal year 2015 compared with fiscal year 2014
Health Care net sales declined 1% to $7.7 billion in 2015 on a1% decline in unit volume. Organic sales increased 4%.Favorable geographic and product mix increased net sales 3%,primarily driven by Oral Care growth in developed markets,which has higher average sales prices. Increased pricing added2% to net sales. Unfavorable foreign exchange reduced netsales by 5%. Global market share of the Health Care segmentdecreased 0.3 points. Volume increased low single digits indeveloped regions but decreased mid-single digits indeveloping regions.• Oral Care volume decreased low single digits as a mid-
single-digit decline in developing regions due tocompetitive activity and following increased pricing was
partially offset by a low single-digit increase in developedregions from product innovation. Global market share ofthe oral care category was flat.
• Volume in Personal Health Care decreased low singledigits due to a low single-digit decrease in developedregions from competitive activity. Volume in developingmarkets was unchanged. Global market share of thepersonal health care category was down about a point.
Net earnings increased 8% to $1.2 billion as the reduction innet sales was more than offset by a 120 basis-point increase innet earnings margin. Net earnings margin increased due togross margin expansion and reduced SG&A spending as apercentage of net sales. Gross margin increased primarily dueto the impact of higher pricing and manufacturing cost savings.SG&A declined as a percentage of net sales due to a focus onmarketing spending efficiencies.
FABRIC & HOME CARE
($ millions) 2016Changevs. 2015 2015
Changevs. 2014
Volume N/A (1)% N/A 1%Net sales $20,730 (7)% $22,274 (5)%Net earnings $2,778 5% $2,634 (5)%% of net sales 13.4% 160 bps 11.8% —
Fiscal year 2016 compared with fiscal year 2015
Fabric & Home Care net sales for the fiscal year were down7% to $20.7 billion on unit volume that declined 1%.Unfavorable foreign exchange reduced net sales by 6%.Organic sales increased 1% on a 1% increase in organicvolume, which excludes minor brand divestitures and theVenezuela deconsolidation. Global market share of the Fabric& Home Care segment decreased 0.2 points. Volume increasedmid-single digits in developed regions and was down highsingle digits in developing regions.• Fabric Care volume declined low single digits due to a
double-digit decrease in developing regions driven byincreased pricing, reduced distribution of less profitablebrands, minor brand divestitures and the Venezueladeconsolidation. Organic volume in developing regionsdecreased high single digits. Volume in developedmarkets increased mid-single digits due to innovation andincreased marketing. Global market share of the fabriccare category was flat.
• Home Care volume increased low single digits.Developed market volume increased low single digits asbenefits from product innovation more than offset impactsfrom competitive activity. This was partially offset by alow single-digit decrease in developing regions followingincreased pricing. Global market share of the home carecategory was down slightly.
Net earnings increased 5% to $2.8 billion behind a 160 basis-point increase in net earnings margin, which more than offsetthe reduction in net sales. Net earnings margin increased dueto gross margin expansion, partially offset by increased SG&Aas a percentage of net sales. Increased gross margin was drivenby manufacturing cost savings and lower commodity costs.

22 The Procter & Gamble Company
SG&Aas a percentage of net sales increased due to an increasein marketing spending and the negative scale impacts from thereduction in net sales.
Fiscal year 2015 compared with fiscal year 2014
Fabric & Home Care net sales decreased 5% to $22.3 billionin 2015 on a 1% increase in unit volume. Organic salesincreased 2%. Unfavorable foreign exchange reduced net salesby 6%, while pricing added 1% to net sales, mix was neutral,and minor brand divestitures had a negative impact of about1%. Global market share of the Fabric & Home Care segmentdecreased 0.1 points. Volume increased low single digits indeveloped regions and was unchanged in developing regions.• Fabric Care volume increased low single digits due to low
single-digit growth in developed regions behind marketgrowth and product innovation. Volume was unchangedin developing regions. Global market share of the fabriccare category was flat.
• Home Care volume was unchanged as decreases due tocompetitive activity, mainly in developed markets, wereoffset by increases from product innovation and expandeddistribution. Global market share of the home carecategory was down nearly half a point.
Net earnings decreased 5% to $2.6 billion due to the net salesreduction. Gross margin was unchanged as negative productmix impacts from investments to expand new innovationsglobally were offset by manufacturing cost savings. SG&A asa percent of net sales was unchanged as lower spending due tomarketing and overhead efficiencies kept pace with reducedsales.BABY, FEMININE & FAMILY CARE
($ millions) 2016Changevs. 2015 2015
Changevs. 2014
Volume N/A (3)% N/A (1)%Net sales $18,505 (9)% $20,247 (3)%Net earnings $2,650 (10)% $2,938 —%% of net sales 14.3% (20) bps 14.5% 50 bps
Fiscal year 2016 compared with fiscal year 2015
Baby, Feminine & Family Care net sales decreased 9% to $18.5billion during the fiscal year on a 3% decline in unit volume.Unfavorable foreign exchange reduced net sales by 6%.Organic sales declined 1% on a 2% decline in organic volume.Global market share of the Baby, Feminine & Family Caresegment decreased 1.1 points. Volume increased low singledigits in developed regions and decreased double digits indeveloping regions.• Volume in Baby Care was down mid-single digits due to
a high single-digit decrease in developing regions causedby price increases in the previous fiscal year, theVenezueladeconsolidation and competitive activity. Organic volumein developing markets was down mid-single digits.Volume was up low single digits in developed regions asproduct innovation and market growth more than offsetcompetitive activity. Global market share of the baby care
category decreased less than two points, primarilyattributable to developing markets.
• Volume in Feminine Care declined low single digits dueto a mid-single-digit decrease in developing regionscaused by competitive activity and price increases in theprevious fiscal year, partially offset by market growth. Indeveloped regions, volume was unchanged. Globalmarket share of the feminine care category decreased morethan half a point.
• Volume in Family Care decreased low single digits due toa double-digit decline in developing regions driven by thediscontinuation of non-strategic products. Volume indeveloped regions increased low single digits due toproduct innovation and increased merchandising. In theU.S., all-outlet share of the family care category decreasednearly half a point.
Net earnings decreased 10% to $2.7 billion primarily due tothe reduction in net sales. Net earnings margin decreased 20basis points as higher gross margin was more than offset by anincrease in SG&A as a percentage of net sales and a higher taxrate. Gross margin increased driven by manufacturing costsavings and lower commodity costs, partially offset bynegative product mix. SG&A as a percentage of net salesincreased due to the negative scale impact from the reductionin net sales. The higher tax rate versus the prior year was dueto the geographic mix of earnings.
Fiscal year 2015 compared with fiscal year 2014
Baby, Feminine & Family Care net sales were down 3% to$20.2 billion in 2015 on a 1% decline in unit volume. Organicsales were up 3%. Price increases, primarily in Baby Care,increased net sales by 2%. Favorable geographic mix fromhigher developed market volume in both Feminine Care andBaby Care and from product mix in Feminine Care increasednet sales by 2%. Unfavorable foreign exchange reduced netsales by 6%. Global market share of the Baby, Feminine &Family Care segment decreased 0.6 points. Volume increasedlow single digits in developed regions and decreased highsingle digits in developing regions.• Volume in Baby Care decreased low single digits due to
a mid-single-digit decrease in developing regionsfollowing increased pricing, partially offset by a lowsingle-digit increase in developed regions from productinnovation. Global market share of the baby care categorydecreased less than a point.
• Volume in Feminine Care decreased low single digits ashigh single-digit decline in developing regions due tocompetition and increased pricing was partially offset bya mid-single-digit increase in developed regions fromproduct innovation, including the entry into the femaleadult incontinence category. Global market share of thefeminine care category was flat.
• Volume in Family Care was unchanged as low single-digitgrowth in developed regions was offset by a double-digitdecline in developing regions due to discontinuation oflower priced product offerings. In the U.S., all-outlet shareof the family care category decreased less than a point.

The Procter & Gamble Company 23
Net earnings were unchanged at $2.9 billion as the reductionin net sales was offset by a 50 basis-point increase in netearnings margin. Net earnings margin increased due to highergross margin, partially offset by an increase in SG&A as apercent of net sales. The increase in gross margin was drivenby higher pricing and manufacturing cost savings, partiallyoffset by foreign exchange. SG&A as a percent of net salesincreased as spending reductions did not keep pace with thecurrency-driven decline in sales.
CORPORATE
($ millions) 2016Changevs. 2015 2015
Changevs. 2014
Net sales $422 (9)% $466 (37)%Net loss $(174) N/A $(2,420) N/A
Corporate includes certain operating and non-operatingactivities not allocated to specific business segments. Theseinclude: the incidental businesses managed at the corporatelevel; financing and investing activities; other generalcorporate items; the gains and losses related to certain divestedbrands and categories; certain restructuring-type activities tomaintain a competitive cost structure, including manufacturingand workforce optimization; certain significant assetimpairment and deconsolidation charges; and certain balancesheet impacts from significant foreign exchange devaluations.Corporate also includes reconciling items to adjust theaccounting policies used in the segments to U.S. GAAP. Themost significant reconciling item includes income taxes toadjust from blended statutory rates that are reflected in thesegments to the overall Company effective tax rate.
Fiscal year 2016 compared with fiscal year 2015
Corporate net sales decreased $44 million during the fiscalyear. Corporate net earnings from continuing operationsimproved by approximately $2.2 billion during the fiscal year,primarily due to the $2.1 billion Venezuela deconsolidationcharge in the prior fiscal year and lower foreign currencytransactional charges. Additional discussion of these itemsimpacting net earnings in Corporate are included in the Resultsof Operations section.
Fiscal year 2015 compared with fiscal year 2014
Net sales in Corporate decreased by $271 million in 2015primarily due to the prior year divestiture of the MDVIPbusiness. Corporate net expenses from continuing operationsincreased $2.0 billion in 2015, primarily due to the chargerelated to the deconsolidation of the Venezuelan subsidiaries,increased foreign exchange transactional charges andincremental restructuring charges, which were partially offsetby gains on minor brand divestitures.
Productivity and Cost Savings Plan
In 2012, the Company initiated a productivity and cost savingsplan to reduce costs and better leverage scale in the areas ofsupply chain, research and development, marketing andoverheads. The plan was designed to accelerate cost reductionsby streamlining management decision making, manufacturing
and other work processes to fund the Company's growthstrategy.
As part of this plan, the Company expects to incurapproximately $5.5 billion in before-tax restructuring costsover a six-year period (from fiscal 2012 through fiscal 2017).Through the end of fiscal 2016, 89% of the expected costs havebeen incurred. Savings generated from the restructuring costsare difficult to estimate, given the nature of the activities, thetiming of the execution and the degree of reinvestment.Overall, these costs and other non-manufacturing enrollmentreductions are expected to deliver approximately $3.0 billionin annual before-tax gross savings. The cumulative before-taxsavings realized through 2016 were approximately $2.4billion.
Restructuring accruals of $315 million as of June 30, 2016 areclassified as current liabilities. During fiscal 2016, 51% of therestructuring charges incurred either have been or will besettled with cash. Consistent with our historical policies forongoing restructuring-type activities, the resulting charges arefunded by and included within Corporate for segmentreporting.
In addition to our restructuring programs, we have additionalongoing savings efforts in our supply chain, marketing andoverhead areas that yield additional benefits to our operatingmargins.
Refer to Note 3 to our Consolidated Financial Statements formore details on the restructuring program and to the OperatingCosts section of the MD&A for more information about thetotal benefit to operating margins from our total savings efforts.
CASH FLOW, FINANCIAL CONDITION ANDLIQUIDITY
We believe our financial condition continues to be of highquality, as evidenced by our ability to generate substantial cashfrom operations and to readily access capital markets atcompetitive rates.
Operating cash flow provides the primary source of cash tofund operating needs and capital expenditures. Excessoperating cash is used first to fund shareholder dividends.Other discretionary uses include share repurchases andacquisitions to complement our portfolio of businesses, brandsand geographies. As necessary, we may supplement operatingcash flow with debt to fund these activities. The overall cashposition of the Company reflects our strong business resultsand a global cash management strategy that takes into accountliquidity management, economic factors and taxconsiderations.
Operating Cash Flow
Fiscal year 2016 compared with fiscal year 2015Operating cash flow was $15.4 billion in 2016, a 6% increasefrom the prior year. Net earnings, adjusted for non-cash items(depreciation and amortization, share-based compensation,deferred income taxes, loss/(gain) on sale of businesses andimpairment charges) generated $13.6 billion of operating cash

24 The Procter & Gamble Company
flow. Working capital and other impacts generated $1.8 billionof operating cash flow.• Reduced accounts receivable generated $35 million of
cash due to improved collection results partially offset bysales mix. The number of days sales outstanding increased1 day due to foreign exchange impacts.
• Lower inventory generated $116 million of cash mainlydue to supply chain optimizations and lower commoditycosts. Inventory days on hand increased 4 days primarilydue to foreign exchange impacts.
• Accounts payable, accrued and other liabilities increased,generating $1.3 billion in operating cash flow, of whichapproximately $0.8 billion was driven by extendedpayment terms with our suppliers. The balance wasprimarily driven by an increase in fourth quarter marketingactivity versus the prior year. These items, along with theimpact of foreign exchange, drove a 24 day increase indays payable outstanding. Although difficult to projectdue to market and other dynamics, we anticipate similarcash flow benefits from the extended payment terms withsuppliers over the next fiscal year.
• Other operating assets and liabilities generated $204million of cash.
Fiscal year 2015 compared with fiscal year 2014Operating cash flow was $14.6 billion in 2015, a 5% increasefrom the prior year. Operating cash flows resulted primarilyfrom net earnings, adjusted for non-cash items (depreciationand amortization, share-based compensation, deferred incometaxes, impairment charges, gains on sale of businesses and theVenezuela deconsolidation charge) and a decrease in workingcapital, partially offset by the impact of other operating assetsand liabilities.• Reduced accounts receivable generated $349 million of
cash due to changes in customer terms and improvedcollection results. The number of days sales outstandingdecreased 5 days due to foreign exchange impacts andimprovements in collection results and customer terms.
• Lower inventory generated $313 million of cash mainlydue to supply chain optimizations and lower commoditycosts. Inventory days on hand decreased 7 days due toforeign exchange impacts, supply chain optimizations andlower commodity costs.
• Accounts payable, accrued and other liabilities increased,generating $928 million in operating cash flow primarilydriven by extended payment terms.
• Other operating assets and liabilities utilized $976 millionof cash primarily due to the elimination of the deferred taximpacts associated with the Pet Care divestiture.
Adjusted Free Cash Flow. We view adjusted free cash flowas an important measure because it is a factor impacting theamount of cash available for dividends, share repurchases,acquisitions and other discretionary investment. It is definedas operating cash flow less capital expenditures and excludingcertain divestiture impacts (tax payments in the prior year forthe Pet Care divestiture) and is one of the measures used toevaluate senior management and determine their at-riskcompensation.
Fiscal year 2016 compared with fiscal year 2015Adjusted free cash flow was $12.1 billion in 2016, an increaseof 4% versus the prior year. The increase was driven by theincrease in operating cash flows and decrease in capitalspending. Adjusted free cash flow productivity, defined as theratio of adjusted free cash flow to net earnings excluding theimpairment charges and gain on the sale of the Batteriesbusiness, was 115% in 2016.Fiscal year 2015 compared with fiscal year 2014Adjusted free cash flow was $11.6 billion in 2015, an increaseof 15% versus the prior year. The increase was driven by theincrease in operating cash flows. Adjusted free cash flowproductivity, defined as the ratio of adjusted free cash flow tonet earnings excluding impairment charges on the Batteriesbusiness and the Venezuelan deconsolidation charge, was102% in 2015.
Investing Cash Flow
Fiscal year 2016 compared with fiscal year 2015Net investing activities consumed $5.6 billion in cash in 2016mainly due to capital spending, divestiture transactions and netpurchases of short-term investments, partially offset by salesor maturities of short-term investments.Fiscal year 2015 compared with fiscal year 2014Net investing activities consumed $2.9 billion in cash in 2015mainly due to capital spending, net purchases of available-for-sale securities and a reduction in cash due to Venezueladeconsolidation, partially offset by asset sales.Capital Spending. Capital expenditures, primarily to supportcapacity expansion, innovation and cost efficiencies, were $3.3billion in 2016 and $3.7 billion in 2015. Capital spending asa percentage of net sales decreased 20 basis points to 5.1% in2016. Capital spending as a percentage of net sales was 5.3%in 2015.Acquisitions. Acquisition activity was not material in 2016 or2015.Proceeds from Divestitures and Other Asset Sales. Proceedsfrom asset sales in 2016 contributed $432 million in cash,primarily from plant asset sales and other minor branddivestitures. Proceeds from asset sales contributed $4.5 billionin cash in 2015 primarily from the sale of our Pet Care business,the sale of our Chinese battery venture, and other minor branddivestitures.
Financing Cash Flow
Dividend Payments. Our first discretionary use of cash isdividend payments. Dividends per common share increased3% to $2.66 per share in 2016. Total dividend payments tocommon and preferred shareholders were $7.4 billion in 2016and $7.3 billion in 2015. In April 2016, the Board of Directorsdeclared an increase in our quarterly dividend from $0.6629to $0.6695 per share on Common Stock and Series A and BESOP Convertible Class A Preferred Stock. This represents a1% increase compared to the prior quarterly dividend and isthe 60th consecutive year that our dividend has increased. We

The Procter & Gamble Company 25
have paid a dividend for 126 years, every year since ourincorporation in 1890.Long-Term and Short-Term Debt. We maintain debt levelswe consider appropriate after evaluating a number of factors,including cash flow expectations, cash requirements forongoing operations, investment and financing plans (includingacquisitions and share repurchase activities) and the overallcost of capital. Total debt was $30.6 billion as of June 30, 2016and $30.3 billion as of June 30, 2015.Treasury Purchases. Total share repurchases were $4.0 billionin 2016 and $4.6 billion in 2015. In addition, the cash infusionof $1.7 billion in the Batteries divestiture was reflected as apurchase of treasury stock.
Liquidity
At June 30, 2016, our current assets exceeded current liabilitiesby $3.0 billion largely due to current assets and currentliabilities of the Beauty Brands business held for sale.Excluding current assets and current liabilities of the BeautyBrands business held for sale, our current liabilities exceededcurrent assets by $1.8 billion, largely due to short-termborrowings under our commercial paper program. Weanticipate being able to support our short-term liquidity andoperating needs largely through cash generated fromoperations. The Company regularly assesses its cash needsand the available sources to fund these needs. As of June 30,2016, $11.0 billion of the Company’s cash, cash equivalentsand marketable securities is held off-shore by foreignsubsidiaries. Amounts held by foreign subsidiaries aregenerally subject to U.S. income taxation on repatriation to theU.S. We do not expect restrictions or taxes on repatriation ofcash held outside of the U.S. to have a material effect on ouroverall liquidity, financial condition or the results of operationsfor the foreseeable future. Of the June 30, 2016 balance of off-shore cash, cash equivalents and marketable securities, themajority relates to various Western European countries. As ofJune 30, 2016, we did not have material cash, cash equivalentsand marketable securities balances in any country subject toexchange controls that significantly restrict our ability toaccess or repatriate the funds.
We utilize short- and long-term debt to fund discretionaryitems, such as acquisitions and share repurchases. We havestrong short- and long-term debt ratings, which have enabled,and should continue to enable, us to refinance our debt as itbecomes due at favorable rates in commercial paper and bondmarkets. In addition, we have agreements with a diverse groupof financial institutions that, if needed, should providesufficient credit funding to meet short-term financingrequirements.
On June 30, 2016, our short-term credit ratings were P-1(Moody's) and A-1+ (Standard & Poor's), while our long-termcredit ratings were Aa3 (Moody's) and AA- (Standard &Poor's), all with a stable outlook.
We maintain bank credit facilities to support our ongoingcommercial paper program. The current facility is an $8.0billion facility split between a $3.2 billion five-year facilityand a $4.8 billion 364-day facility, which expire in November2020 and November 2016, respectively. The 364-day facilitycan be extended for certain periods of time as specified in theterms of the credit agreement. These facilities are currentlyundrawn and we anticipate that they will remain undrawn.These credit facilities do not have cross-default or ratingstriggers, nor do they have material adverse events clauses,except at the time of signing. In addition to these creditfacilities, we have an automatically effective registrationstatement on Form S-3 filed with the SEC that is available forregistered offerings of short- or long-term debt securities. Foradditional details on debt see Note 10 to the ConsolidatedFinancial Statements.
Guarantees and Other Off-Balance Sheet Arrangements
We do not have guarantees or other off-balance sheet financingarrangements, including variable interest entities, which webelieve could have a material impact on financial condition orliquidity.

26 The Procter & Gamble Company
Contractual Commitments
The following table provides information on the amount and payable date of our contractual commitments as of June 30, 2016.
Amounts in millions Total Less Than 1 Year 1-3 Years 3-5 Years After 5 Years
RECORDED LIABILITIESTotal debt $ 30,221 $ 11,635 $ 3,660 $ 3,467 $ 11,459Capital leases 45 16 21 5 3Uncertain tax positions (1) 247 247 — — —OTHERInterest payments relating to long-term debt 6,439 684 1,249 979 3,527Operating leases (2) 1,563 237 464 360 502Minimum pension funding (3) 640 215 425 — —Purchase obligations (4) 1,794 881 391 234 288TOTAL CONTRACTUAL COMMITMENTS $ 40,949 $ 13,915 $ 6,210 $ 5,045 $ 15,779
(1) As of June 30, 2016, the Company's Consolidated Balance Sheet reflects a liability for uncertain tax positions of $1.2 billion, including$343 million of interest and penalties. Due to the high degree of uncertainty regarding the timing of future cash outflows of liabilities foruncertain tax positions beyond one year, a reasonable estimate of the period of cash settlement beyond twelve months from the balancesheet date of June 30, 2016, cannot be made.
(2) Operating lease obligations are shown net of guaranteed sublease income.(3) Represents future pension payments to comply with local funding requirements. These future pension payments assume the Company
continues to meet its future statutory funding requirements. Considering the current economic environment in which the Company operates,the Company believes its cash flows are adequate to meet the future statutory funding requirements. The projected payments beyond fiscalyear 2019 are not currently determinable.
(4) Primarily reflects future contractual payments under various take-or-pay arrangements entered into as part of the normal course of business.Commitments made under take-or-pay obligations represent future purchases in line with expected usage to obtain favorable pricing. Thisincludes service contracts for information technology, human resources management and facilities management activities that have beenoutsourced. While the amounts listed represent contractual obligations, we do not believe it is likely that the full contractual amount wouldbe paid if the underlying contracts were canceled prior to maturity. In such cases, we generally are able to negotiate new contracts orcancellation penalties, resulting in a reduced payment. The amounts do not include other contractual purchase obligations that are not take-or-pay arrangements. Such contractual purchase obligations are primarily purchase orders at fair value that are part of normal operationsand are reflected in historical operating cash flow trends. We do not believe such purchase obligations will adversely affect our liquidityposition.
SIGNIFICANT ACCOUNTING POLICIES ANDESTIMATESIn preparing our financial statements in accordance with U.S.GAAP, there are certain accounting policies that may requirea choice between acceptable accounting methods or mayrequire substantial judgment or estimation in their application.These include income taxes, certain employee benefits andgoodwill and intangible assets. We believe these accountingpolicies, and others set forth in Note 1 to the ConsolidatedFinancial Statements, should be reviewed as they are integralto understanding the results of operations and financialcondition of the Company.The Company has discussed the selection of significantaccounting policies and the effect of estimates with the AuditCommittee of the Company's Board of Directors.Income TaxesOur annual tax rate is determined based on our income,statutory tax rates and the tax impacts of items treateddifferently for tax purposes than for financial reportingpurposes. Also inherent in determining our annual tax rate arejudgments and assumptions regarding the recoverability of
certain deferred tax balances, primarily net operating loss andother carryforwards, and our ability to uphold certain taxpositions.Realization of net operating losses and other carryforwards isdependent upon generating sufficient taxable income in theappropriate jurisdiction prior to the expiration of thecarryforward periods, which involves business plans, planningopportunities and expectations about future outcomes.Although realization is not assured, management believes it ismore likely than not that our deferred tax assets, net of valuationallowances, will be realized.We operate in multiple jurisdictions with complex tax policyand regulatory environments. In certain of these jurisdictions,we may take tax positions that management believes aresupportable, but are potentially subject to successful challengeby the applicable taxing authority. These interpretationaldifferences with the respective governmental taxing authoritiescan be impacted by the local economic and fiscal environment.Our operating principles are that our tax structure is based onour business operating model, such that profits are earned inline with the business substance and functions of the variouslegal entities. However, we may have income tax exposurerelated to the determination of the appropriate transfer prices

The Procter & Gamble Company 27
for our various cross-border transactions. We obtain advancerulings with tax authorities to support our positions, wherepossible, to help manage these exposures. Nonetheless, manyof the underlying transactions are subject to audit, resulting inuncertainty until the ultimate audit resolution. We evaluate ourtax positions and establish liabilities in accordance with theapplicable accounting guidance on uncertainty in incometaxes. We review these tax uncertainties in light of changingfacts and circumstances, such as the progress of tax audits, andadjust them accordingly. We have a number of audits in processin various jurisdictions. Although the resolution of these taxpositions is uncertain, based on currently availableinformation, we believe that the ultimate outcomes will nothave a material adverse effect on our financial position, resultsof operations or cash flows.Because there are a number of estimates and assumptionsinherent in calculating the various components of our taxprovision, certain changes or future events such as changes intax legislation, geographic mix of earnings, completion of taxaudits or earnings repatriation plans could have an impact onthose estimates and our effective tax rate. For additional detailson the Company's income taxes, see Note 5 to the ConsolidatedFinancial Statements.Employee BenefitsWe sponsor various post-employment benefits throughout theworld. These include pension plans, both defined contributionplans and defined benefit plans, and other post-employmentbenefit (OPEB) plans, consisting primarily of health care andlife insurance for retirees. For accounting purposes, the definedbenefit pension and OPEB plans require assumptions toestimate the projected and accumulated benefit obligations,including the following variables: discount rate; expectedsalary increases; certain employee-related factors, such asturnover, retirement age and mortality; expected return onassets; and health care cost trend rates. These and otherassumptions affect the annual expense and obligationsrecognized for the underlying plans. Our assumptions reflectour historical experiences and management's best judgmentregarding future expectations. As permitted by U.S. GAAP,the net amount by which actual results differ from ourassumptions is deferred. If this net deferred amount exceeds10% of the greater of plan assets or liabilities, a portion of thedeferred amount is included in expense for the following year.The cost or benefit of plan changes, such as increasing ordecreasing benefits for prior employee service (prior servicecost), is deferred and included in expense on a straight-linebasis over the average remaining service period of theemployees expected to receive benefits.The expected return on plan assets assumption impacts ourdefined benefit expense, since many of our defined benefitpension plans and our primary OPEB plan are partially funded.The process for setting the expected rates of return is describedin Note 8 to the Consolidated Financial Statements. For 2016,the average return on assets assumptions for pension plan assetsand OPEB assets was 7.2% and 8.3%, respectively. A changein the rate of return of 100 basis points for both pension andOPEB assets would impact annual after-tax benefit expense byapproximately $100 million.
Since pension and OPEB liabilities are measured on adiscounted basis, the discount rate impacts our plan obligationsand expenses. Discount rates used for our U.S. defined benefitpension and OPEB plans are based on a yield curve constructedfrom a portfolio of high quality bonds for which the timing andamount of cash outflows approximate the estimated payoutsof the plan. For our international plans, the discount rates areset by benchmarking against investment grade corporate bondsrated AA or better. The average discount rate on the definedbenefit pension plans and OPEB plans of 2.1% and 3.6%,respectively, represents a weighted average of local rates incountries where such plans exist. A 100 basis point change inthe pension discount rate would impact annual after-tax definedbenefit pension expense by approximately $200 million. Achange in the OPEB discount rate of 100 basis points wouldimpact annual after-tax OPEB expense by approximately $86million. For additional details on our defined benefit pensionand OPEB plans, see Note 8 to the Consolidated FinancialStatements.Goodwill and Intangible AssetsSignificant judgment is required to estimate the fair value ofintangible assets and in assigning their respective useful lives.Accordingly, we typically obtain the assistance of third-partyvaluation specialists for significant tangible and intangibleassets. The fair value estimates are based on availablehistorical information and on future expectations andassumptions deemed reasonable by management, but areinherently uncertain.We typically use an income method to estimate the fair valueof intangible assets, which is based on forecasts of the expectedfuture cash flows attributable to the respective assets.Significant estimates and assumptions inherent in thevaluations reflect a consideration of other marketplaceparticipants, and include the amount and timing of future cashflows (including expected growth rates and profitability), theunderlying product or technology life cycles, economicbarriers to entry, a brand's relative market position and thediscount rate applied to the cash flows. Unanticipated marketor macroeconomic events and circumstances may occur, whichcould affect the accuracy or validity of the estimates andassumptions.Determining the useful life of an intangible asset also requiresjudgment. Certain brand intangible assets are expected to haveindefinite lives based on their history and our plans to continueto support and build the acquired brands. Other acquiredintangible assets (e.g., certain trademarks or brands, customerrelationships, patents and technologies) are expected to havedeterminable useful lives. Our assessment as to brands thathave an indefinite life and those that have a determinable lifeis based on a number of factors including competitiveenvironment, market share, brand history, underlying productlife cycles, operating plans and the macroeconomicenvironment of the countries in which the brands are sold. Ourestimates of the useful lives of determinable-lived intangibleassets are primarily based on these same factors. All of ouracquired technology and customer-related intangible assets areexpected to have determinable useful lives.

28 The Procter & Gamble Company
The costs of determinable-lived intangible assets are amortizedto expense over their estimated lives. The value of indefinite-lived intangible assets and residual goodwill is not amortized,but is tested at least annually for impairment. Our impairmenttesting for goodwill is performed separately from ourimpairment testing of indefinite-lived intangible assets. Wetest goodwill for impairment by reviewing the book valuecompared to the fair value at the reporting unit level. We testindividual indefinite-lived intangible assets by comparing thebook values of each asset to the estimated fair value. Wedetermine the fair value of our reporting units and indefinite-lived intangible assets based on the income approach. Underthe income approach, we calculate the fair value of ourreporting units and indefinite-lived intangible assets based onthe present value of estimated future cash flows. Considerablemanagement judgment is necessary to evaluate the impact ofoperating and macroeconomic changes and to estimate futurecash flows to measure fair value. Assumptions used in ourimpairment evaluations, such as forecasted growth rates andcost of capital, are consistent with internal projections andoperating plans. We believe such assumptions and estimatesare also comparable to those that would be used by othermarketplace participants.Most of our goodwill reporting units are comprised of acombination of legacy and acquired businesses and as a resulthave fair value cushions that, at a minimum, exceed two timestheir underlying carrying values. Certain of our continuinggoodwill reporting units, in particular Shave Care andAppliances, are comprised entirely of acquired businesses andas a result have fair value cushions that are not as high. Whileboth of these wholly-acquired reporting units have fair valuecushions that currently exceed the underlying carrying values,the Shave Care cushion, as well as certain of the relatedindefinite-lived intangible assets, have been reduced to below20% due in large part to significant currency devaluations ina number of countries relative to the U.S. dollar that began inrecent years and continued during fiscal 2016. As a result, thisunit is more susceptible to impairment risk from adversechanges in business operating plans and macroeconomicenvironment conditions, including any further significantdevaluation of major currencies relative to the U.S. dollar. Anysuch adverse changes in the future could reduce the underlyingcash flows used to estimate fair values and could result in adecline in fair value that could trigger future impairmentcharges of the business unit's goodwill and indefinite-livedintangibles.The business unit valuations used to test goodwill andintangible assets for impairment are dependent on a number ofsignificant estimates and assumptions, includingmacroeconomic conditions, overall category growth rates,competitive activities, cost containment and margin expansionand Company business plans. We believe these estimates andassumptions are reasonable. Changes to, or a failure to, achievethese business plans or a further deterioration of themacroeconomic conditions could result in a valuation thatwould trigger an impairment of the goodwill and intangibleassets of these businesses.
See Note 4 to the Consolidated Financial Statements foradditional discussion on goodwill and intangible assetimpairment testing results.New Accounting PronouncementsRefer to Note 1 to the Consolidated Financial Statements forrecently adopted accounting pronouncements and recentlyissued accounting pronouncements not yet adopted as ofJune 30, 2016.
OTHER INFORMATION
Hedging and Derivative Financial InstrumentsAs a multinational company with diverse product offerings,we are exposed to market risks, such as changes in interestrates, currency exchange rates and commodity prices. Weevaluate exposures on a centralized basis to take advantage ofnatural exposure correlation and netting. Except withinfinancing operations, we leverage the Company's diversifiedportfolio of exposures as a natural hedge and prioritizeoperational hedging activities over financial marketinstruments. To the extent we choose to further managevolatility associated with the net exposures, we enter intovarious financial transactions which we account for using theapplicable accounting guidance for derivative instruments andhedging activities. These financial transactions are governedby our policies covering acceptable counterparty exposure,instrument types and other hedging practices. See Note 9 tothe Consolidated Financial Statements for a discussion of ouraccounting policies for derivative instruments.
Derivative positions are monitored using techniques includingmarket valuation, sensitivity analysis and value-at-riskmodeling. The tests for interest rate, currency rate andcommodity derivative positions discussed below are based onthe CorporateManager™ value-at-risk model using a one-yearhorizon and a 95% confidence level. The model incorporatesthe impact of correlation (the degree to which exposures movetogether over time) and diversification (from holding multiplecurrency, commodity and interest rate instruments) andassumes that financial returns are normally distributed.Estimates of volatility and correlations of market factors aredrawn from the RiskMetrics™ dataset as of June 30, 2016. Incases where data is unavailable in RiskMetrics™, a reasonableproxy is included.
Our market risk exposures relative to interest rates, currencyrates and commodity prices, as discussed below, have notchanged materially versus the previous reporting period. Inaddition, we are not aware of any facts or circumstances thatwould significantly impact such exposures in the near term.
Interest Rate Exposure on Financial Instruments. Interestrate swaps are used to hedge exposures to interest ratemovement on underlying debt obligations. Certain interest rateswaps denominated in foreign currencies are designated tohedge exposures to currency exchange rate movements on ourinvestments in foreign operations. These currency interest rateswaps are designated as hedges of the Company's foreign netinvestments.

The Procter & Gamble Company 29
Based on our interest rate exposure as of and during the yearended June 30, 2016, including derivative and otherinstruments sensitive to interest rates, we believe a near-termchange in interest rates, at a 95% confidence level based onhistorical interest rate movements, would not materially affectour financial statements.
Currency Rate Exposure on Financial Instruments. Becausewe manufacture and sell products and finance operations in anumber of countries throughout the world, we are exposed tothe impact on revenue and expenses of movements in currencyexchange rates. Corporate policy prescribes the range ofallowable hedging activity. To manage the exchange rate riskassociated with the financing of our operations, we primarilyuse forward contracts with maturities of less than 18 months.In addition, we enter into certain currency swaps withmaturities of up to five years to hedge our exposure to exchangerate movements on intercompany financing transactions.
Based on our currency rate exposure on derivative and otherinstruments as of and during the year ended June 30, 2016, webelieve, at a 95% confidence level based on historical currencyrate movements, the impact on such instruments of a near-termchange in currency rates would not materially affect ourfinancial statements.
Commodity Price Exposure on Financial Instruments. Weuse raw materials that are subject to price volatility caused byweather, supply conditions, political and economic variablesand other unpredictable factors. We may use futures, optionsand swap contracts to manage the volatility related to the aboveexposures.
As of and during the years ended June 30, 2016 and June 30,2015, we did not have any commodity hedging activity.
Measures Not Defined By U.S. GAAP
Our discussion of financial results includes several "non-GAAP" financial measures. We believe that these measuresprovide useful perspective of underlying business trends (i.e.trends excluding non-recurring or unusual items) and resultsand provide a supplemental measure of year-on-year results.The non-GAAP measures described below are used bymanagement in making operating decisions, allocatingfinancial resources and for business strategy purposes. Thesemeasures may be useful to investors as they providesupplemental information about business performance andprovide investors a view of our business results through theeyes of management. These measures are also used to evaluatesenior management and are a factor in determining their at-risk compensation. These non-GAAP measures are notintended to be considered by the user in place of the relatedGAAP measure, but rather as supplemental information to ourbusiness results. These non-GAAP measures may not be thesame as similar measures used by other companies due topossible differences in method and in the items or events beingadjusted. These measures include:
Organic Sales Growth. Organic sales growth is a non-GAAPmeasure of sales growth excluding the impacts of theVenezuela deconsolidation, acquisitions, divestitures and
foreign exchange from year-over-year comparisons. Webelieve this measure provides investors with a supplementalunderstanding of underlying sales trends by providing salesgrowth on a consistent basis, and this measure is used inassessing achievement of management goals for at-riskcompensation.
The following tables provide a numerical reconciliation oforganic sales growth to reported net sales growth:
Year endedJune 30, 2016
Net SalesGrowth
ForeignExchange
Impact
Acquisition/Divestiture
Impact*
OrganicSales
Growth
Beauty (9 )% 6 % 3 % — %Grooming (8 )% 9 % 1 % 2 %Health Care (5 )% 6 % 1 % 2 %Fabric & HomeCare (7 )% 6 % 2 % 1 %Baby, Feminine& Family Care (9 )% 6 % 2 % (1)%TOTALCOMPANY (8)% 6% 3% 1 %
Year endedJune 30, 2015
Net SalesGrowth
ForeignExchange
Impact
Acquisition/Divestiture
Impact*
OrganicSales
Growth
Beauty (6 )% 5 % 1 % — %Grooming (7 )% 8 % — % 1 %Health Care (1 )% 5 % — % 4 %Fabric & HomeCare (5 )% 6 % 1 % 2 %Baby, Feminine& Family Care (3 )% 6 % — % 3 %TOTALCOMPANY (5)% 6% 1% 2 %
* Acquisition/Divestiture Impact also includes the impact of theVenezuela deconsolidation and the rounding impacts necessary toreconcile net sales to organic sales.
Core EPS. Core EPS is a measure of the Company's dilutednet earnings per share from continuing operations adjusted asindicated. Management views these non-GAAP measures as auseful supplemental measure of Company performance overtime. The table below provides a reconciliation of reviseddiluted net earnings per share to Core EPS, including thefollowing reconciling items:• Incremental restructuring: While the Company has and
continues to have an ongoing level of restructuringactivities, beginning in 2012 we began a $10 billionstrategic productivity and cost savings initiative thatincludes incremental restructuring activities. This resultsin incremental restructuring charges to accelerateproductivity efforts and cost savings. The charges includeonly the incremental portion of the restructuring costs.
• Venezuela deconsolidation charge: For accountingpurposes, evolving conditions resulted in a lack of controlover our Venezuelan subsidiaries. Therefore, in

30 The Procter & Gamble Company
accordance with the applicable accounting standards forconsolidation, effective June 30, 2015, we deconsolidatedour Venezuelan subsidiaries and began accounting for ourinvestment in those subsidiaries using the cost method ofaccounting. The charge was incurred to write off our netassets related to Venezuela.
• Charges for certain European legal matters: Severalcountries in Europe issued separate complaints allegingthat the Company, along with several other companies,engaged in violations of competition laws in prior periods.The Company established Legal Reserves related to thesecharges. Management does not view these charges asindicative of underlying business results.
• Venezuela Balance Sheet Remeasurement & DevaluationImpacts: Venezuela is a highly inflationary economyunder U.S. GAAP. Prior to deconsolidation, thegovernment enacted episodic changes to currencyexchange mechanisms and rates, which resulted incurrency remeasurement charges for non-dollardenominated monetary assets and liabilities held by ourVenezuelan subsidiaries.
We do not view the above items to be part of our sustainableresults, and their exclusion from core earnings measuresprovides a more comparable measure of year-on-year results.
Years ended June 30 2016 2015 2014Diluted net earnings per share -continuing operations $3.49 $2.84 $3.63Incremental restructuring charges 0.18 0.17 0.11Venezuela balance sheetdevaluation impacts — 0.04 0.09Charges for European legal matters — 0.01 0.02Venezuelan deconsolidation — 0.71 —Rounding — (0.01) —CORE EPS $3.67 $3.76 $3.85Core EPS Growth (2)% (2)% 5%
* All reconciling items are presented net of tax. Tax effects arecalculated consistent with the nature of the underlying transaction.
Adjusted Free Cash Flow. Adjusted free cash flow is definedas operating cash flow less capital spending excluding taxpayments related to the divestiture of the discontinued Petbusiness. Adjusted free cash flow represents the cash that theCompany is able to generate after taking into account plannedmaintenance and asset expansion. We view adjusted free cashflow as an important measure because it is one factor used indetermining the amount of cash available for dividends, sharerepurchases, acquisitions and other discretionary investment.
The following table provides a numerical reconciliation ofadjusted free cash flow ($ millions):
OperatingCashFlow
CapitalSpending
FreeCashFlow
Divestitureimpacts*
AdjustedFree
Cash Flow
2016 $ 15,435 $ (3,314) $ 12,121 $ — $ 12,1212015 14,608 (3,736) 10,872 729 11,6012014 13,958 (3,848) 10,110 — 10,110
* Divestiture impacts relate to tax payments for the Pet Caredivestiture in fiscal 2015.
Adjusted Free Cash Flow Productivity. Adjusted free cashflow productivity is defined as the ratio of adjusted free cashflow to net earnings excluding Batteries impairments, the gainon the sale of the Batteries business and Venezuela charges.We view adjusted free cash flow productivity as a usefulmeasure to help investors understand P&G’s ability to generatecash. Adjusted free cash flow productivity is used bymanagement in making operating decisions, in allocatingfinancial resources and for budget planning purposes. TheCompany's long-term target is to generate annual adjusted freecash flow productivity at or above 90 percent.
The following table provides a numerical reconciliation ofadjusted free cash flow productivity ($ millions):
NetEarnings
Gain onBatteries
Sale /Impairment
& Decon-solidationCharges
Net EarningsExcluding
Batteries Gain/Impairment &
Deconsolid-ation Charges
AdjustedFreeCashFlow
AdjustedFree
Cash FlowProductivity
2016 $10,604 $ (72) $ 10,532 $ 12,121 115%2015 7,144 4,187 11,331 11,601 102 %2014 11,785 — 11,785 10,100 86 %
Item 7A. Quantitative and Qualitative Disclosures AboutMarket Risk.
The information required by this item is incorporated byreference to the section entitled Other Information underManagement's Disclosure and Analysis, and Note 9 to theConsolidated Financial Statements.

The Procter & Gamble Company 31
Item 8. Financial Statements and Supplementary Data.
MANAGEMENT'S REPORT ON INTERNAL CONTROL OVER FINANCIAL REPORTING
Management is responsible for establishing and maintaining adequate internal control over financial reporting of The Procter &Gamble Company (as defined in Rule 13a-15(f) under the Securities Exchange Act of 1934, as amended). Our internal controlover financial reporting is designed to provide reasonable assurance regarding the reliability of financial reporting and thepreparation of financial statements for external purposes in accordance with generally accepted accounting principles in the UnitedStates of America.
Strong internal controls is an objective that is reinforced through our Worldwide Business Conduct Manual, which sets forth ourcommitment to conduct business with integrity, and within both the letter and the spirit of the law. Our people are deeply committedto our Purpose, Values, and Principles, which unite us in doing what’s right. Our system of internal controls includes writtenpolicies and procedures, segregation of duties, and the careful selection and development of employees. Additional key elementsof our internal control structure include our Global Leadership Council, which is actively involved in oversight of the businessstrategies, initiatives, results and controls, our Disclosure Committee, which is responsible for evaluating disclosure implicationsof significant business activities and events, our Board of Directors, which provides strong and effective corporate governance,and our Audit Committee, which reviews significant accounting policies, financial reporting and internal control matters.
The Company's internal control over financial reporting includes a Control Self-Assessment Program that is conducted annuallyfor critical financial reporting areas of the Company and is audited by our Global Internal Audit organization. Management takesthe appropriate action to correct any identified control deficiencies. Global Internal Audit also performs financial and complianceaudits around the world, provides training, and continuously improves our internal control processes.
Because of its inherent limitations, any system of internal control over financial reporting, no matter how well designed, may notprevent or detect misstatements due to the possibility that a control can be circumvented or overridden or that misstatements dueto error or fraud may occur that are not detected. Also, because of changes in conditions, internal control effectiveness may varyover time.
Management assessed the effectiveness of the Company's internal control over financial reporting as of June 30, 2016, usingcriteria established in Internal Control - Integrated Framework (2013) issued by the Committee of Sponsoring Organizations ofthe Treadway Commission (COSO) and concluded that the Company maintained effective internal control over financial reportingas of June 30, 2016, based on these criteria.
Deloitte & Touche LLP, an independent registered public accounting firm, has audited the effectiveness of the Company's internalcontrol over financial reporting as of June 30, 2016, as stated in their report which is included herein.
/s/ David S. Taylor
David S. Taylor
Chairman of the Board, President and Chief Executive Officer
/s/ Jon R. Moeller
Jon R. Moeller
Chief Financial Officer
August 9, 2016

32 The Procter & Gamble Company
REPORT OF INDEPENDENT REGISTERED PUBLIC ACCOUNTING FIRM
To the Board of Directors and Stockholders of The Procter & Gamble Company
Cincinnati, Ohio
We have audited the accompanying Consolidated Balance Sheets of The Procter & Gamble Company and subsidiaries (the"Company") as of June 30, 2016 and 2015, and the related Consolidated Statements of Earnings, Comprehensive Income,Shareholders' Equity, and Cash Flows for each of the three years in the period ended June 30, 2016. These financial statementsare the responsibility of the Company's management. Our responsibility is to express an opinion on these financial statementsbased on our audits.
We conducted our audits in accordance with the standards of the Public Company Accounting Oversight Board (United States).Those standards require that we plan and perform the audit to obtain reasonable assurance about whether the financial statementsare free of material misstatement. An audit includes examining, on a test basis, evidence supporting the amounts and disclosuresin the financial statements. An audit also includes assessing the accounting principles used and significant estimates made bymanagement, as well as evaluating the overall financial statement presentation. We believe that our audits provide a reasonablebasis for our opinion.
In our opinion, such Consolidated Financial Statements present fairly, in all material respects, the financial position of The Procter& Gamble Company and subsidiaries at June 30, 2016 and 2015, and the results of their operations and their cash flows for eachof the three years in the period ended June 30, 2016, in conformity with accounting principles generally accepted in the UnitedStates of America.
As discussed in Note 1 and Note 13 to the Consolidated Financial Statements, on July 1, 2015, the Company adopted the newaccounting guidance in ASU 2014-08, Presentation of Financial Statements (Topic 205) and Property, Plant, and Equipment(Topic 360): Reporting Discontinued Operations and Disclosures of Disposals of Components of an Entity.
We have also audited, in accordance with the standards of the Public Company Accounting Oversight Board (United States), theCompany's internal control over financial reporting as of June 30, 2016, based on the criteria established in Internal Control -Integrated Framework (2013) issued by the Committee of Sponsoring Organizations of the Treadway Commission and our reportdated August 9, 2016 expressed an unqualified opinion on the Company's internal control over financial reporting.
/s/ Deloitte & Touche LLP
Cincinnati, Ohio
August 9, 2016

The Procter & Gamble Company 33
REPORT OF INDEPENDENT REGISTERED PUBLIC ACCOUNTING FIRM
To the Board of Directors and Stockholders of The Procter & Gamble Company
Cincinnati, Ohio
We have audited the internal control over financial reporting of The Procter & Gamble Company and subsidiaries (the "Company")as of June 30, 2016, based on criteria established in Internal Control - Integrated Framework (2013) issued by the Committee ofSponsoring Organizations of the Treadway Commission. The Company's management is responsible for maintaining effectiveinternal control over financial reporting and for its assessment of the effectiveness of internal control over financial reporting,included in the accompanying Management's Report on Internal Control over Financial Reporting. Our responsibility is to expressan opinion on the Company's internal control over financial reporting based on our audit.
We conducted our audit in accordance with the standards of the Public Company Accounting Oversight Board (United States).Those standards require that we plan and perform the audit to obtain reasonable assurance about whether effective internal controlover financial reporting was maintained in all material respects. Our audit included obtaining an understanding of internal controlover financial reporting, assessing the risk that a material weakness exists, testing and evaluating the design and operatingeffectiveness of internal control based on the assessed risk, and performing such other procedures as we considered necessary inthe circumstances. We believe that our audit provides a reasonable basis for our opinion.
A company's internal control over financial reporting is a process designed by, or under the supervision of, the company's principalexecutive and principal financial officers, or persons performing similar functions, and effected by the company's board of directors,management, and other personnel to provide reasonable assurance regarding the reliability of financial reporting and the preparationof financial statements for external purposes in accordance with generally accepted accounting principles. A company's internalcontrol over financial reporting includes those policies and procedures that (1) pertain to the maintenance of records that, inreasonable detail, accurately and fairly reflect the transactions and dispositions of the assets of the company; (2) provide reasonableassurance that transactions are recorded as necessary to permit preparation of financial statements in accordance with generallyaccepted accounting principles, and that receipts and expenditures of the company are being made only in accordance withauthorizations of management and directors of the company; and (3) provide reasonable assurance regarding prevention or timelydetection of unauthorized acquisition, use, or disposition of the company's assets that could have a material effect on the financialstatements.
Because of the inherent limitations of internal control over financial reporting, including the possibility of collusion or impropermanagement override of controls, material misstatements due to error or fraud may not be prevented or detected on a timely basis.Also, projections of any evaluation of the effectiveness of the internal control over financial reporting to future periods are subjectto the risk that the controls may become inadequate because of changes in conditions, or that the degree of compliance with thepolicies or procedures may deteriorate.
In our opinion, the Company maintained, in all material respects, effective internal control over financial reporting as of June 30,2016, based on the criteria established in Internal Control - Integrated Framework (2013) issued by the Committee of SponsoringOrganizations of the Treadway Commission.
We have also audited, in accordance with the standards of the Public Company Accounting Oversight Board (United States), theConsolidated Financial Statements as of and for the year ended June 30, 2016 of the Company and our report dated August 9,2016 expressed an unqualified opinion on those financial statements and included an explanatory paragraph regarding theCompany’s adoption on July 1, 2015 of the new accounting guidance in ASU 2014-08, Presentation of Financial Statements (Topic205) and Property, Plant, and Equipment (Topic 360): Reporting Discontinued Operations and Disclosures of Disposals ofComponents of an Entity.
/s/ Deloitte & Touche LLP
Cincinnati, Ohio
August 9, 2016

34 The Procter & Gamble Company
See accompanying Notes to Consolidated Financial Statements.
Consolidated Statements of Earnings
Amounts in millions except per share amounts; Years ended June 30 2016 2015 2014
NET SALES $ 65,299 $ 70,749 $ 74,401Cost of products sold 32,909 37,056 39,030Selling, general and administrative expense 18,949 20,616 21,461Venezuela deconsolidation charge — 2,028 —OPERATING INCOME 13,441 11,049 13,910Interest expense 579 626 709Interest income 182 149 99Other non-operating income, net 325 440 209EARNINGS FROM CONTINUING OPERATIONS BEFORE INCOME TAXES 13,369 11,012 13,509Income taxes on continuing operations 3,342 2,725 2,851NET EARNINGS FROM CONTINUING OPERATIONS 10,027 8,287 10,658NET EARNINGS/(LOSS) FROM DISCONTINUED OPERATIONS 577 (1,143) 1,127NET EARNINGS 10,604 7,144 11,785Less: Net earnings attributable to noncontrolling interests 96 108 142NET EARNINGS ATTRIBUTABLE TO PROCTER & GAMBLE $ 10,508 $ 7,036 $ 11,643
BASIC NET EARNINGS PER COMMON SHARE: (1)
Earnings from continuing operations $ 3.59 $ 2.92 $ 3.78Earnings/(loss) from discontinued operations 0.21 (0.42) 0.41BASIC NET EARNINGS PER COMMON SHARE $ 3.80 $ 2.50 $ 4.19DILUTED NET EARNINGS PER COMMON SHARE: (1)
Earnings from continuing operations $ 3.49 $ 2.84 $ 3.63Earnings/(loss) from discontinued operations 0.20 (0.40) 0.38DILUTED NET EARNINGS PER COMMON SHARE $ 3.69 $ 2.44 $ 4.01DIVIDENDS PER COMMON SHARE $ 2.66 $ 2.59 $ 2.45
(1) Basic net earnings per common share and Diluted net earnings per common share are calculated on Net earnings attributable to Procter &Gamble.

The Procter & Gamble Company 35
See accompanying Notes to Consolidated Financial Statements.
Consolidated Statements of Comprehensive Income
Amounts in millions; Years ended June 30 2016 2015 2014
NET EARNINGS $ 10,604 $ 7,144 $ 11,785OTHER COMPREHENSIVE INCOME/(LOSS), NET OF TAX
Financial statement translation (1,679) (7,220) 1,044Unrealized gains/(losses) on hedges (net of $5, $739 and $(209) tax, respectively) 1 1,234 (347)Unrealized gains/(losses) on investment securities (net of $7, $0 and $(4) tax,respectively) 28 24 9Unrealized gains/(losses) on defined benefit retirement plans (net of $(621), $328and $(356) tax, respectively) (1,477) 844 (869)
TOTAL OTHER COMPREHENSIVE INCOME/(LOSS), NET OF TAX (3,127) (5,118) (163)TOTAL COMPREHENSIVE INCOME 7,477 2,026 11,622Less: Total comprehensive income attributable to noncontrolling interests 96 108 150TOTAL COMPREHENSIVE INCOME ATTRIBUTABLE TOPROCTER & GAMBLE $ 7,381 $ 1,918 $ 11,472

36 The Procter & Gamble Company
See accompanying Notes to Consolidated Financial Statements.
Consolidated Balance Sheets
Amounts in millions; Years ended June 30 2016 2015
AssetsCURRENT ASSETSCash and cash equivalents $ 7,102 $ 6,836Available-for-sale investment securities 6,246 4,767Accounts receivable 4,373 4,568INVENTORIES
Materials and supplies 1,188 1,266Work in process 563 525Finished goods 2,965 3,188
Total inventories 4,716 4,979Deferred income taxes 1,507 1,356Prepaid expenses and other current assets 2,653 2,708Current assets held for sale 7,185 4,432TOTAL CURRENT ASSETS 33,782 29,646PROPERTY, PLANT AND EQUIPMENT, NET 19,385 19,655GOODWILL 44,350 44,622TRADEMARKS AND OTHER INTANGIBLE ASSETS, NET 24,527 25,010NONCURRENT ASSETS HELD FOR SALE — 5,204OTHER NONCURRENT ASSETS 5,092 5,358TOTAL ASSETS $ 127,136 $ 129,495Liabilities and Shareholders' EquityCURRENT LIABILITIESAccounts payable $ 9,325 $ 8,138Accrued and other liabilities 7,449 8,091Current liabilities held for sale 2,343 1,543Debt due within one year 11,653 12,018TOTAL CURRENT LIABILITIES 30,770 29,790LONG-TERM DEBT 18,945 18,327DEFERRED INCOME TAXES 9,113 9,179NONCURRENT LIABILITIES HELD FOR SALE — 717OTHER NONCURRENT LIABILITIES 10,325 8,432TOTAL LIABILITIES 69,153 66,445SHAREHOLDERS' EQUITYConvertible Class A preferred stock, stated value $1 per share (600 shares authorized) 1,038 1,077Non-Voting Class B preferred stock, stated value $1 per share (200 shares authorized) — —Common stock, stated value $1 per share (10,000 shares authorized; shares issued:2016 - 4,009.2, 2015 - 4,009.2 ) 4,009 4,009Additional paid-in capital 63,714 63,852Reserve for ESOP debt retirement (1,290) (1,320)Accumulated other comprehensive income/(loss) (15,907) (12,780)Treasury stock, at cost (shares held: 2016 - 1,341.2, 2015 - 1,294.7) (82,176) (77,226)Retained earnings 87,953 84,807Noncontrolling interest 642 631TOTAL SHAREHOLDERS' EQUITY 57,983 63,050TOTAL LIABILITIES AND SHAREHOLDERS' EQUITY $ 127,136 $ 129,495

The Procter & Gamble Company 37
See accompanying Notes to Consolidated Financial Statements.
Consolidated Statements of Shareholders' Equity
Dollars in millions;Shares in thousands
CommonShares
OutstandingCommon
StockPreferred
Stock
Add-itionalPaid-InCapital
Reserve forESOP DebtRetirement
Accumu-latedOtherComp-
rehensiveIncome/(Loss)
TreasuryStock
RetainedEarnings
Non-controlling
Interest Total
BALANCE JUNE 30, 2013 2,742,327 $4,009 $1,137 $63,538 ($1,352) ($7,499) ($71,966) $80,197 $645 $68,709
Net earnings 11,643 142 11,785
Other comprehensive income (163) (163)
Dividends to shareholders:
Common (6,658) (6,658)
Preferred, net of tax benefits (253) (253)
Treasury purchases (74,987) (6,005) (6,005)
Employee plan issuances 40,288 364 2,144 2,508
Preferred stock conversions 3,178 (26) 4 22 —
ESOP debt impacts 12 61 73
Noncontrolling interest, net 5 (25) (20)
BALANCE JUNE 30, 2014 2,710,806 $4,009 $1,111 $63,911 ($1,340) ($7,662) ($75,805) $84,990 $762 $69,976
Net earnings 7,036 108 7,144
Other comprehensive loss (5,118) (5,118)
Dividends to shareholders:
Common (7,028) (7,028)
Preferred, net of tax benefits (259) (259)
Treasury purchases (54,670) (4,604) (4,604)
Employee plan issuances 54,100 156 3,153 3,309
Preferred stock conversions 4,335 (34) 4 30 —
ESOP debt impacts 20 68 88
Noncontrolling interest, net (219) (239) (458)
BALANCE JUNE 30, 2015 2,714,571 $4,009 $1,077 $63,852 ($1,320) ($12,780) ($77,226) $84,807 $631 $63,050
Net earnings 10,508 96 10,604
Other comprehensive loss (3,127) (3,127)
Dividends to shareholders:
Common (7,181) (7,181)
Preferred, net of tax benefits (255) (255)
Treasury purchases (1) (103,449) (8,217) (8,217)
Employee plan issuances 52,089 (144) 3,234 3,090
Preferred stock conversions 4,863 (39) 6 33 —
ESOP debt impacts 30 74 104
Noncontrolling interest, net (85) (85)
BALANCE JUNE 30, 2016 2,668,074 $4,009 $1,038 $63,714 ($1,290) ($15,907) ($82,176) $87,953 $642 $57,983(1) Includes $4,213 of treasury shares acquired in the divestiture of the Batteries business (see Note 13).

38 The Procter & Gamble Company
See accompanying Notes to Consolidated Financial Statements.
Consolidated Statements of Cash Flows
Amounts in millions; Years ended June 30 2016 2015 2014
CASH AND CASH EQUIVALENTS, BEGINNING OF YEAR $ 6,836 $ 8,548 $ 5,930OPERATING ACTIVITIESNet earnings 10,604 7,144 11,785Depreciation and amortization 3,078 3,134 3,141Share-based compensation expense 335 337 360Deferred income taxes (815) (803) (44)Gain on sale of businesses (41) (766) (154)Venezuela deconsolidation charge — 2,028 —Goodwill and intangible asset impairment charges 450 2,174 —Change in accounts receivable 35 349 87Change in inventories 116 313 8Change in accounts payable, accrued and other liabilities 1,285 928 1Change in other operating assets and liabilities 204 (976) (1,557)Other 184 746 331TOTAL OPERATING ACTIVITIES 15,435 14,608 13,958INVESTING ACTIVITIESCapital expenditures (3,314) (3,736) (3,848)Proceeds from asset sales 432 4,498 577Cash related to deconsolidated Venezuela operations — (908) —Acquisitions, net of cash acquired (186) (137) (24)Purchases of short-term investments (2,815) (3,647) (568)Proceeds from sales of short-term investments 1,354 1,203 24Cash transferred in Batteries divestiture (143) — —Restricted cash related to Beauty Brands divestiture (996) — —Change in other investments 93 (163) (261)TOTAL INVESTING ACTIVITIES (5,575) (2,890) (4,100)FINANCING ACTIVITIESDividends to shareholders (7,436) (7,287) (6,911)Change in short-term debt (418) (2,580) 3,304Additions to long-term debt 3,916 2,138 4,334Reductions of long-term debt (2,213) (3,512) (4,095)Treasury stock purchases (4,004) (4,604) (6,005)Treasury stock from cash infused in Batteries divestiture (1,730) — —Impact of stock options and other 2,672 2,826 2,094TOTAL FINANCING ACTIVITIES (9,213) (13,019) (7,279)EFFECT OF EXCHANGE RATE CHANGES ON CASH AND CASH EQUIVALENTS (381) (411) 39CHANGE IN CASH AND CASH EQUIVALENTS 266 (1,712) 2,618CASH AND CASH EQUIVALENTS, END OF YEAR $ 7,102 $ 6,836 $ 8,548SUPPLEMENTAL DISCLOSURECash payments for:
Interest $ 569 $ 678 $ 686Income taxes 3,730 4,558 3,320
Divestiture of Batteries business in exchange for shares of P&G stock (1) 4,213 — —Assets acquired through non-cash capital leases are immaterial for all periods.
(1) Includes $1,730 from cash infused into the Batteries business pursuant to the divestiture agreement (see Note 13).

The Procter & Gamble Company 39
Amounts in millions of dollars except per share amounts or as otherwise specified.
Notes to Consolidated Financial Statements
NOTE 1
SUMMARY OF SIGNIFICANT ACCOUNTINGPOLICIES
Nature of OperationsThe Procter & Gamble Company's (the "Company," "Procter& Gamble," "we" or "us") business is focused on providingbranded consumer packaged goods of superior quality andvalue. Our products are sold in more than 180 countries andterritories primarily through mass merchandisers, grocerystores, membership club stores, drug stores, department stores,distributors, baby stores, specialty beauty stores, e-commerce,high-frequency storesand pharmacies. We have on-the-groundoperations in approximately 70 countries.Basis of PresentationThe Consolidated Financial Statements include the Companyand its controlled subsidiaries. Intercompany transactions areeliminated. Prior year amounts have been reclassified toconform with current year presentation for amounts related tosegment reporting (see Note 2) and discontinued operations(see Note 13).There are a number of currency and other operating controlsand restrictions in Venezuela, which have evolved over timeand may continue to evolve in the future. These evolvingconditions resulted in an other-than-temporary lack ofexchangeability between the Venezuelan bolivar and U.S.dollar and restricted our Venezuelan operations’ ability to paydividends and satisfy certain other obligations denominated inU.S. dollars. For accounting purposes, this resulted in a lackof control over our Venezuelan subsidiaries. Therefore, inaccordance with the applicable accounting standards forconsolidation, effective June 30, 2015, we deconsolidated ourVenezuelan subsidiaries and began accounting for ourinvestment in those subsidiaries using the cost method ofaccounting. This resulted in a write-off of all of the net assetsof our Venezuelan subsidiaries, along with Venezuela relatedassets held by other subsidiaries. Beginning with the firstquarter of fiscal 2016, our financial results only include salesof finished goods to our Venezuelan subsidiaries to the extentwe receive payments from Venezuela. Accordingly, we nolonger include the results of our Venezuelan subsidiaries’operations in our financial results.Use of EstimatesPreparation of financial statements in conformity withaccounting principles generally accepted in the United Statesof America (U.S. GAAP) requires management to makeestimates and assumptions that affect the amounts reported inthe Consolidated Financial Statements and accompanyingdisclosures. These estimates are based on management's bestknowledge of current events and actions the Company mayundertake in the future. Estimates are used in accounting for,among other items, consumer and trade promotion accruals,restructuring reserves, pensions, post-employment benefits,stock options, valuation of acquired intangible assets, usefullives for depreciation and amortization of long-lived assets,
future cash flows associated with impairment testing forgoodwill, indefinite-lived intangible assets and other long-lived assets, deferred tax assets, uncertain income tax positionsand contingencies. Actual results may ultimately differ fromestimates, although management does not generally believesuch differences would materially affect the financialstatements in any individual year. However, in regard toongoing impairment testing of goodwill and indefinite-livedintangible assets, significant deterioration in future cash flowprojections or other assumptions used in estimating fair valuesversus those anticipated at the time of the initial valuations,could result in impairment charges that materially affect thefinancial statements in a given year.Revenue RecognitionSales are recognized when revenue is realized or realizable andhas been earned. Revenue transactions represent sales ofinventory. The revenue recorded is presented net of sales andother taxes we collect on behalf of governmental authorities.The revenue includes shipping and handling costs, whichgenerally are included in the list price to the customer. Ourpolicy is to recognize revenue when title to the product,ownership and risk of loss transfer to the customer, which canbe on the date of shipment or the date of receipt by the customer.A provision for payment discounts and product returnallowances is recorded as a reduction of sales in the same periodthe revenue is recognized.Trade promotions, consisting primarily of customer pricingallowances, merchandising funds and consumer coupons, areoffered through various programs to customers and consumers.Sales are recorded net of trade promotion spending, which isrecognized as incurred, generally at the time of the sale. Mostof these arrangements have terms of approximately one year.Accruals for expected payouts under these programs areincluded as accrued marketing and promotion in the Accruedand other liabilities line item in the Consolidated BalanceSheets.Cost of Products SoldCost of products sold is primarily comprised of direct materialsand supplies consumed in the manufacturing of product, aswell as manufacturing labor, depreciation expense and directoverhead expense necessary to acquire and convert thepurchased materials and supplies into finished product. Costof products sold also includes the cost to distribute products tocustomers, inbound freight costs, internal transfer costs,warehousing costs and other shipping and handling activity.Selling, General and Administrative ExpenseSelling, general and administrative expense (SG&A) isprimarily comprised of marketing expenses, selling expenses,research and development costs, administrative and otherindirect overhead costs, depreciation and amortization expenseon non-manufacturing assets and other miscellaneousoperating items. Research and development costs are chargedto expense as incurred and were $1.9 billion in 2016, $2.0billion in 2015 and $1.9 billion in 2014 (reported in Netearnings from continuing operations). Advertising costs,charged to expense as incurred, include worldwide television,

40 The Procter & Gamble Company
Amounts in millions of dollars except per share amounts or as otherwise specified.
print, radio, internet and in-store advertising expenses and were$7.2 billion in 2016, $7.2 billion in 2015 and $7.9 billion in2014 (reported in Net earnings from continuing operations).Non-advertising related components of the Company's totalmarketing spending include costs associated with consumerpromotions, product sampling and sales aids, which areincluded in SG&A, as well as coupons and customer tradefunds, which are recorded as reductions to Net sales.Other Non-Operating Income, NetOther non-operating income, net, primarily includes netacquisition and divestiture gains and investment income.Currency TranslationFinancial statements of operating subsidiaries outside the U.S.generally are measured using the local currency as thefunctional currency. Adjustments to translate those statementsinto U.S. dollars are recorded in Other comprehensive income(OCI). For subsidiaries operating in highly inflationaryeconomies, the U.S. dollar is the functional currency. Re-measurement adjustments for financial statements in highlyinflationary economies and other transactional exchange gainsand losses are reflected in earnings.Cash Flow PresentationThe Consolidated Statements of Cash Flows are prepared usingthe indirect method, which reconciles net earnings to cash flowfrom operating activities. Cash flows from foreign currencytransactions and operations are translated at an averageexchange rate for the period. Cash flows from hedgingactivities are included in the same category as the items beinghedged. Cash flows from derivative instruments designatedas net investment hedges are classified as financing activities.Realized gains and losses from non-qualifying derivativeinstruments used to hedge currency exposures resulting fromintercompany financing transactions are also classified asfinancing activities. Cash flows from other derivativeinstruments used to manage interest, commodity or othercurrency exposures are classified as operating activities. Cashpayments related to income taxes are classified as operatingactivities. Cash flows from the Company's discontinuedoperations are included in the Consolidated Statements of CashFlows.InvestmentsInvestment securities consist of readily marketable debt andequity securities. Unrealized gains or losses from investmentsclassified as trading, if any, are charged to earnings. Unrealizedgains or losses on securities classified as available-for-sale aregenerally recorded in OCI. If an available-for-sale security isother than temporarily impaired, the loss is charged to eitherearnings or OCI depending on our intent and ability to retainthe security until we recover the full cost basis and the extentof the loss attributable to the creditworthiness of the issuer.Investment securities are included as Available-for-saleinvestment securities and Other noncurrent assets in theConsolidated Balance Sheets.Investments in certain companies over which we exertsignificant influence, but do not control the financial andoperating decisions, are accounted for as equity method
investments. Other investments that are not controlled, andover which we do not have the ability to exercise significantinfluence, are accounted for under the cost method. Both equityand cost method investments are included as Other noncurrentassets in the Consolidated Balance Sheets.Inventory ValuationInventories are valued at the lower of cost or market value.Product-related inventories are maintained on the first-in, first-out method. The cost of spare part inventories is maintainedusing the average-cost method.Property, Plant and EquipmentProperty, plant and equipment is recorded at cost reduced byaccumulated depreciation. Depreciation expense is recognizedover the assets' estimated useful lives using the straight-linemethod. Machinery and equipment includes office furnitureand fixtures (15-year life), computer equipment and capitalizedsoftware (3- to 5-year lives) and manufacturing equipment (3-to 20-year lives). Buildings are depreciated over an estimateduseful life of 40 years. Estimated useful lives are periodicallyreviewed and, when appropriate, changes are madeprospectively. When certain events or changes in operatingconditions occur, asset lives may be adjusted and animpairment assessment may be performed on therecoverability of the carrying amounts.Goodwill and Other Intangible AssetsGoodwill and indefinite-lived intangible assets are notamortized, but are evaluated for impairment annually or moreoften if indicators of a potential impairment are present. Ourannual impairment testing of goodwill is performed separatelyfrom our impairment testing of indefinite-lived intangibleassets.We have acquired brands that have been determined to haveindefinite lives. Those assets are evaluated annually forimpairment. We evaluate a number of factors to determinewhether an indefinite life is appropriate, including thecompetitive environment, market share, brand history, productlife cycles, operating plans and the macroeconomicenvironment of the countries in which the brands are sold. Inaddition, when certain events or changes in operatingconditions occur, an additional impairment assessment isperformed and indefinite-lived assets may be adjusted to adeterminable life.The cost of intangible assets with determinable useful lives isamortized to reflect the pattern of economic benefitsconsumed, either on a straight-line or accelerated basis overthe estimated periods benefited. Patents, technology and otherintangible assets with contractual terms are generallyamortized over their respective legal or contractual lives.Customer relationships, brands and other non-contractualintangible assets with determinable lives are amortized overperiods generally ranging from 5 to 30 years. When certainevents or changes in operating conditions occur, an impairmentassessment is performed and remaining lives of intangibleassets with determinable lives may be adjusted.For additional details on goodwill and intangible assets seeNote 4.

The Procter & Gamble Company 41
Amounts in millions of dollars except per share amounts or as otherwise specified.
Fair Values of Financial InstrumentsCertain financial instruments are required to be recorded at fairvalue. Changes in assumptions or estimation methods couldaffect the fair value estimates; however, we do not believe anysuch changes would have a material impact on our financialcondition, results of operations or cash flows. Other financialinstruments, including cash equivalents, certain investmentsand short-term debt, are recorded at cost, which approximatesfair value. The fair values of long-term debt and financialinstruments are disclosed in Note 9.New Accounting Pronouncements and PoliciesIn May 2014, the FASB issued ASU 2014-09, “Revenue fromContracts with Customers (Topic 606)”. This guidanceoutlines a single, comprehensive model for accounting forrevenue from contracts with customers. We will adopt thestandard no later than July 1, 2018. While we are currentlyassessing the impact of the new standard, we do not expect thisnew guidance to have a material impact on our ConsolidatedFinancial Statements.On July 1, 2015, the Company adopted ASU 2014-08,"Presentation of Financial Statements (Topic 205) andProperty, Plant, and Equipment (Topic 360): ReportingDiscontinued Operations and Disclosures of Disposals ofComponents of an Entity". The guidance included newreporting and disclosure requirements for discontinuedoperations. For additional details on discontinued operations,see Note 13.In February 2016, the FASB issued ASU 2016-02, “Leases(Topic 842)”. The standard requires lessees to recognize leaseassets and lease liabilities on the balance sheet and requiresexpanded disclosures about leasing arrangements. We willadopt the standard no later than July 1, 2019. We are currentlyassessing the impact that the new standard will have on ourConsolidated Financial Statements. For additional details onour operating leases, see Note 12.In March 2016, the FASB issued ASU 2016-09, “StockCompensation (Topic 718): Improvements to Employee Share-Based Payment Accounting”. The standard amends severalaspects of the accounting for employee share-based paymenttransactions including the accounting for income taxes,forfeitures and statutory tax withholding requirements, as wellas classification in the statement of cash flows. We will adoptthe standard no later than July 1, 2017. While we are currentlyassessing the impact of the new standard, we do not expect thenew guidance to have a material impact on our ConsolidatedFinancial Statements.No other new accounting pronouncement issued or effectiveduring the fiscal year had or is expected to have a materialimpact on our Consolidated Financial Statements.
NOTE 2
SEGMENT INFORMATION
On July 9, 2015, the Company announced the signing of adefinitive agreement to divest four product categories, initiallycomprised of 43 of its beauty brands (“Beauty Brands”), whichwill be merged with Coty Inc. ("Coty"). The transaction
includes the global salon professional hair care and color, retailhair color, cosmetics and fine fragrance businesses, along withselect hair styling brands and is expected to close in October2016. In February 2016, the Company completed thedivestiture of its Batteries business to Berkshire Hathaway.The Company completed the divestiture of its Pet Carebusiness in the previous fiscal year. Each of these businessesare reported as discontinued operations for all periodspresented (see Note 13).
Under U.S. GAAP, our remaining Global Business Units(GBUs) are aggregated into five reportable segments: 1)Beauty, 2) Grooming, 3) Health Care, 4) Fabric & Home Careand 5) Baby, Feminine & Family Care. Our five reportablesegments are comprised of:• Beauty: Hair Care (Conditioner, Shampoo, Styling Aids,
Treatments); Skin and Personal Care (Antiperspirant andDeodorant, Personal Cleansing, Skin Care);
• Grooming: Shave Care (Female Blades & Razors, MaleBlades & Razors, Pre- and Post-Shave Products, OtherShave Care); Appliances;
• Health Care: Oral Care (Toothbrushes, Toothpaste, OtherOral Care); Personal Health Care (Gastrointestinal,Rapid Diagnostics, Respiratory, Vitamins/Minerals/Supplements, Other Personal Health Care);
• Fabric & Home Care: Fabric Care (Fabric Enhancers,LaundryAdditives, Laundry Detergents); Home Care (AirCare, Dish Care, P&G Professional, Surface Care ); and
• Baby, Feminine & Family Care: Baby Care (Baby Wipes,Diapers and Pants); Feminine Care (Adult Incontinence,Feminine Care); Family Care (Paper Towels, Tissues,Toilet Paper).
The accounting policies of the segments are generally the sameas those described in Note 1. Differences between thesepolicies and U.S. GAAP primarily reflect income taxes, whichare reflected in the segments using applicable blended statutoryrates. Adjustments to arrive at our effective tax rate areincluded in Corporate.
Corporate includes certain operating and non-operatingactivities that are not reflected in the operating results usedinternally to measure and evaluate the businesses, as well asitems to adjust management reporting principles to U.S. GAAP.Operating activities in Corporate include the results ofincidental businesses managed at the corporate level.Operating elements also include certain employee benefitcosts, the costs of certain restructuring-type activities tomaintain a competitive cost structure, including manufacturingand workforce optimization and other general Corporate items.The non-operating elements in Corporate primarily includeinterest expense, certain acquisition and divestiture gains andinterest and investing income.
Total assets for the reportable segments include those assetsmanaged by the reportable segment, primarily inventory, fixedassets and intangible assets. Other assets, primarily cash,accounts receivable, investment securities and goodwill, areincluded in Corporate.

42 The Procter & Gamble Company
Amounts in millions of dollars except per share amounts or as otherwise specified.
Our business units are comprised of similar product categories.Nine business units individually accounted for 5% or more ofconsolidated net sales as follows:
% of Sales by Business Unit*Years ended June 30 2016 2015 2014
Fabric Care 22% 22% 22%Baby Care 14% 15% 15%Hair Care 10% 11% 11%Home Care 10% 9% 9%Shave Care 9% 9% 10%Family Care 8% 8% 7%Oral Care 8% 8% 7%Skin and Personal Care 8% 7% 7%Feminine Care 6% 6% 6%All Other 5% 5% 6%TOTAL 100% 100% 100%
* % of sales by business unit excludes sales held in Corporate.
The Company had net sales in the U.S. of $27.0 billion, $26.8billion and $26.7 billion for the years ended June 30, 2016,2015 and 2014, respectively. Long-lived assets in the U.S.totaled $8.5 billion and $8.3 billion as of June 30, 2016 and2015, respectively. Long-lived assets consists of property,plant and equipment. No other country's net sales or long-livedassets exceed 10% of the Company totals.
Our largest customer, Wal-Mart Stores, Inc. and its affiliates,accounted for approximately 15% of consolidated net sales in2016, 2015 and 2014. No other customer represents more than10% of our consolidated net sales.
Global Segment Results Net Sales
Earnings/(Loss)from
ContinuingOperations
BeforeIncome Taxes
Net Earnings/(Loss) fromContinuingOperations
Depreciationand
AmortizationTotalAssets
CapitalExpenditures
BEAUTY (1) 2016 $ 11,477 $ 2,636 $ 1,975 $ 218 $ 3,888 $ 4352015 12,608 2,895 2,181 247 4,004 4112014 13,401 3,020 2,300 256 4,564 376
GROOMING 2016 6,815 2,009 1,548 451 22,819 3832015 7,441 2,374 1,787 540 23,090 3722014 8,009 2,589 1,954 576 23,767 369
HEALTH CARE 2016 7,350 1,812 1,250 204 5,139 2402015 7,713 1,700 1,167 202 5,212 2182014 7,798 1,597 1,083 199 5,879 253
FABRIC & HOME CARE 2016 20,730 4,249 2,778 531 6,919 6722015 22,274 4,059 2,634 547 7,155 9862014 23,506 4,264 2,770 539 7,938 1,057
BABY, FEMININE & FAMILYCARE 2016 18,505 4,042 2,650 886 9,863 1,261
2015 20,247 4,317 2,938 924 10,109 1,3372014 20,950 4,310 2,940 908 10,946 1,317
CORPORATE (1) (2) 2016 422 (1,379) (174) 788 78,508 3232015 466 (4,333) (2,420) 674 79,925 4122014 737 (2,271) (389) 663 91,172 476
TOTAL COMPANY 2016 $ 65,299 $ 13,369 $ 10,027 $ 3,078 $ 127,136 $ 3,3142015 70,749 11,012 8,287 3,134 129,495 3,7362014 74,401 13,509 10,658 3,141 144,266 3,848
(1) Prior year adjustments were made to total assets for the Beauty and Corporate reportable segments related to certain Beauty Brands trademarksincluded in the scope of the Beauty Brands transaction.
(2) The Corporate reportable segment includes depreciation and amortization, total assets and capital expenditures of the Pet Care and Batteriesbusinesses prior to their divestiture and of the Beauty Brands businesses.

The Procter & Gamble Company 43
Amounts in millions of dollars except per share amounts or as otherwise specified.
NOTE 3
SUPPLEMENTAL FINANCIAL INFORMATION
The components of property, plant and equipment were asfollows:
Years ended June 30 2016 2015
PROPERTY, PLANT AND EQUIPMENTBuildings $ 6,885 $ 6,949Machinery and equipment 29,506 29,420Land 769 763Construction in progress 2,706 2,931TOTAL PROPERTY, PLANTAND EQUIPMENT 39,866 40,063Accumulated depreciation (20,481) (20,408)PROPERTY, PLANT ANDEQUIPMENT, NET $ 19,385 $ 19,655
Selected components of current and noncurrent liabilities wereas follows:
Years ended June 30 2016 2015
ACCRUED AND OTHER LIABILITIES - CURRENTMarketing and promotion $ 2,820 $ 2,798Compensation expenses 1,457 1,390Restructuring reserves 315 389Taxes payable 397 845Legal and environmental 158 205Other 2,302 2,464TOTAL $ 7,449 $ 8,091
OTHER NONCURRENT LIABILITIESPension benefits $ 6,761 $ 5,247Other postretirement benefits 1,808 1,414Uncertain tax positions 952 1,016Other 804 755TOTAL $ 10,325 $ 8,432
RESTRUCTURING PROGRAMThe Company has historically incurred an ongoing annual levelof restructuring-type activities to maintain a competitive coststructure, including manufacturing and workforceoptimization. Before-tax costs incurred under the ongoingprogram have generally ranged from $250 to $500 annually.In fiscal 2012, the Company initiated an incrementalrestructuring program as part of a productivity and cost savingsplan to reduce costs in the areas of supply chain, research anddevelopment, marketing and overheads. The productivity andcost savings plan was designed to accelerate cost reductionsby streamlining management decision making, manufacturingand other work processes in order to help fund the Company'sgrowth strategy.The Company expects to incur approximately $5.5 billion inbefore-tax restructuring costs over a six year period (from fiscal
2012 through fiscal 2017), including costs incurred as part ofthe ongoing and incremental restructuring program. Theprogram includes a non-manufacturing overhead enrollmentreduction target of approximately 25% - 30% by the end offiscal 2017.Through fiscal 2016, the Company reduced non-manufacturing enrollment by approximately 14,200, orapproximately 24%. The reductions are enabled by theelimination of duplicate work, simplification through the useof technology and optimization of various functional andbusiness organizations. In addition, the plan includesintegration of newly acquired companies and the optimizationof the supply chain and other manufacturing processes.Restructuring costs incurred consist primarily of costs toseparate employees, asset-related costs to exit facilities andother costs. The Company incurred total restructuring chargesof approximately $977 and $1,068 for the years ended June 30,2016 and 2015, respectively. Approximately $202 and $338of these charges were recorded in SG&A for the years endedJune 30, 2016 and 2015, respectively and approximately $718and $614 of these charges were recorded in Cost of productssold for the years ended June 30, 2016 and 2015, respectively.The remainder of the charges were included in Net earningsfrom discontinued operations. Since the inception of thisrestructuring program, the Company has incurredapproximately $4.9 billion of the total expected restructuringcosts. Approximately $2.3 billion of these charges were relatedto separations, $1.4 billion were asset-related and $1.2 billionwere related to other restructuring-type costs. The followingtable presents restructuring activity for the years endedJune 30, 2016 and 2015:
Amounts in millions Separations
Asset-RelatedCosts Other Total
RESERVEJUNE 30, 2014 $ 353 $ — $ 28 $ 381Charges 516 289 263 1,068Cash spent (507) — (264) (771)Charges againstassets — (289) — (289)RESERVEJUNE 30, 2015 362 — 27 389Charges 262 432 283 977Cash spent (381) — (238) (619)Charges againstassets — (432) — (432)RESERVEJUNE 30, 2016 $ 243 $ — $ 72 $ 315
Separation CostsEmployee separation charges for the years ended June 30, 2016and 2015, related to severance packages for approximately2,770 and 4,820 employees, respectively. For the years endedJune 30, 2016 and 2015, these severance packages includedapproximately 920 and 2,340 non-manufacturing employees,respectively. The packages were predominantly voluntary andthe amounts were calculated based on salary levels and past

44 The Procter & Gamble Company
Amounts in millions of dollars except per share amounts or as otherwise specified.
service periods. Severance costs related to voluntaryseparations are generally charged to earnings when theemployee accepts the offer. Since its inception, therestructuring program has incurred separation charges relatedto approximately 17,070 employees, of which approximately9,540 are non-manufacturing overhead personnel.
Asset-Related CostsAsset-related costs consist of both asset write-downs andaccelerated depreciation. Asset write-downs relate to theestablishment of a new fair value basis for assets held-for-saleor disposal. These assets were written down to the lower oftheir current carrying basis or amounts expected to be realizedupon disposal, less minor disposal costs. Charges foraccelerated depreciation relate to long-lived assets that will betaken out of service prior to the end of their normal serviceperiod. These assets relate primarily to manufacturingconsolidations and technology standardizations. The asset-related charges will not have a significant impact on futuredepreciation charges.
Other CostsOther restructuring-type charges are incurred as a direct resultof the restructuring program. Such charges primarily includeemployee relocation related to separations and officeconsolidations, termination of contracts related to supply chainredesign and the cost to change internal systems and processesto support the underlying organizational changes.
Consistent with our historical policies for ongoingrestructuring-type activities, the restructuring program chargesare funded by and included within Corporate for bothmanagement and segment reporting. Accordingly, all of thecharges under the program are included within the Corporatereportable segment. However, for informative purposes, thefollowing table summarizes the total restructuring costs relatedto our reportable segments:
Years ended June 30 2016 2015
Beauty $ 72 $ 63Grooming 42 57Health Care 26 32Fabric & Home Care 250 197Baby, Feminine & Family Care 225 192Corporate (1) 362 527Total Company $ 977 $ 1,068
(1) Corporate includes costs related to allocated overheads,including charges related to our Sales and Market Operations,Global Business Services and Corporate Functions activities andcosts related to discontinued operations from our Batteries andBeauty Brands businesses.
NOTE 4
GOODWILL AND INTANGIBLE ASSETS
The change in the net carrying amount of goodwill by reportable segment was as follows:
Beauty GroomingHealthCare
Fabric &HomeCare
Baby,Feminine& Family
Care CorporateTotal
Company
GOODWILL at JUNE 30, 2014 - Gross $ 14,065 $ 22,097 $ 6,280 $ 1,981 $ 4,910 $ 2,554 $ 51,887Accumulated impairment losses at June 30, 2014 — (1,158) — — — — (1,158)
GOODWILL at JUNE 30, 2014 - Net 14,065 20,939 6,280 1,981 4,910 2,554 50,729Acquisitions and divestitures (136) — (6) (3) — (449) (594)Goodwill impairment charges — — — — — (2,064) (2,064)Translation and other (1,225) (1,320) (398) (104) (361) (41) (3,449)
GOODWILL at JUNE 30, 2015 - Gross (1) 12,704 20,777 5,876 1,874 4,549 2,064 47,844Accumulated impairment losses at June 30, 2015 (1) — (1,158) — — — (2,064) (3,222)
GOODWILL at JUNE 30, 2015 - Net 12,704 19,619 5,876 1,874 4,549 — 44,622Acquisitions and divestitures (2) — (2) — — — (4)Translation and other (57) (142) (34) (18) (17) — (268)
GOODWILL at JUNE 30, 2016 - Gross 12,645 20,635 5,840 1,856 4,532 — 45,508Accumulated impairment losses at June 30, 2016 — (1,158) — — — — (1,158)
GOODWILL at JUNE 30, 2016 - Net $ 12,645 $ 19,477 $ 5,840 $ 1,856 $ 4,532 $ — $ 44,350(1) Balances in Corporate segment reflect the gross value of the Batteries goodwill and the corresponding impairment charges recorded against
the business to reflect the value of BH's shares in P&G stock as of June 30, 2015. The Batteries business was divested in February 2016.
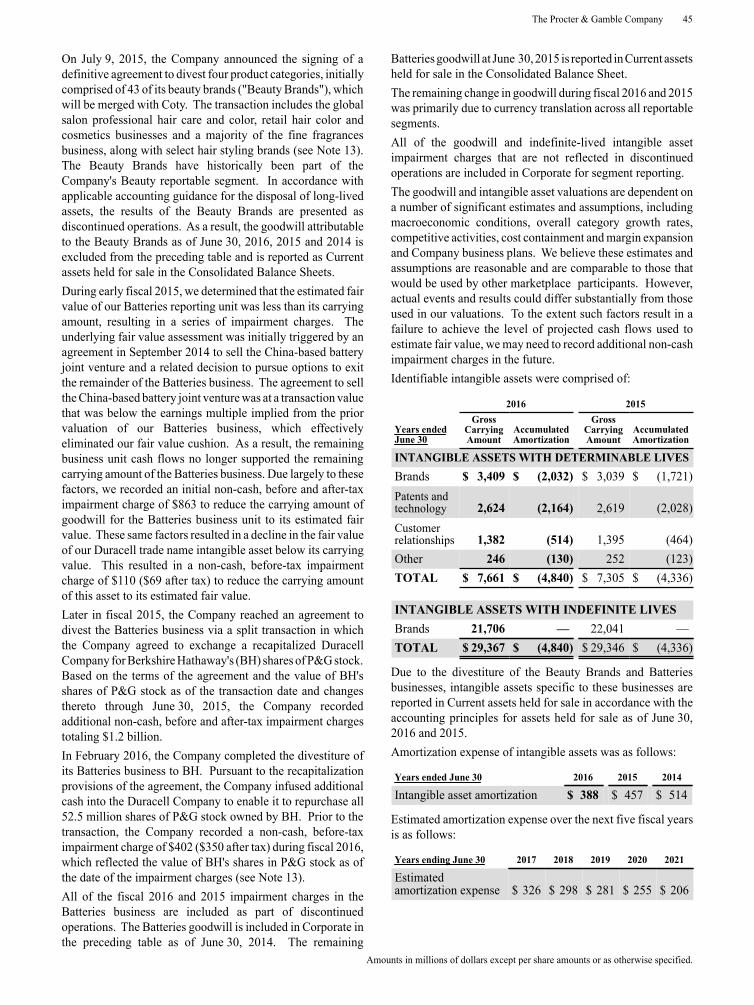
The Procter & Gamble Company 45
Amounts in millions of dollars except per share amounts or as otherwise specified.
On July 9, 2015, the Company announced the signing of adefinitive agreement to divest four product categories, initiallycomprised of 43 of its beauty brands ("Beauty Brands"), whichwill be merged with Coty. The transaction includes the globalsalon professional hair care and color, retail hair color andcosmetics businesses and a majority of the fine fragrancesbusiness, along with select hair styling brands (see Note 13).The Beauty Brands have historically been part of theCompany's Beauty reportable segment. In accordance withapplicable accounting guidance for the disposal of long-livedassets, the results of the Beauty Brands are presented asdiscontinued operations. As a result, the goodwill attributableto the Beauty Brands as of June 30, 2016, 2015 and 2014 isexcluded from the preceding table and is reported as Currentassets held for sale in the Consolidated Balance Sheets.During early fiscal 2015, we determined that the estimated fairvalue of our Batteries reporting unit was less than its carryingamount, resulting in a series of impairment charges. Theunderlying fair value assessment was initially triggered by anagreement in September 2014 to sell the China-based batteryjoint venture and a related decision to pursue options to exitthe remainder of the Batteries business. The agreement to sellthe China-based battery joint venture was at a transaction valuethat was below the earnings multiple implied from the priorvaluation of our Batteries business, which effectivelyeliminated our fair value cushion. As a result, the remainingbusiness unit cash flows no longer supported the remainingcarrying amount of the Batteries business. Due largely to thesefactors, we recorded an initial non-cash, before and after-taximpairment charge of $863 to reduce the carrying amount ofgoodwill for the Batteries business unit to its estimated fairvalue. These same factors resulted in a decline in the fair valueof our Duracell trade name intangible asset below its carryingvalue. This resulted in a non-cash, before-tax impairmentcharge of $110 ($69 after tax) to reduce the carrying amountof this asset to its estimated fair value.Later in fiscal 2015, the Company reached an agreement todivest the Batteries business via a split transaction in whichthe Company agreed to exchange a recapitalized DuracellCompany for Berkshire Hathaway's (BH) shares of P&G stock.Based on the terms of the agreement and the value of BH'sshares of P&G stock as of the transaction date and changesthereto through June 30, 2015, the Company recordedadditional non-cash, before and after-tax impairment chargestotaling $1.2 billion.In February 2016, the Company completed the divestiture ofits Batteries business to BH. Pursuant to the recapitalizationprovisions of the agreement, the Company infused additionalcash into the Duracell Company to enable it to repurchase all52.5 million shares of P&G stock owned by BH. Prior to thetransaction, the Company recorded a non-cash, before-taximpairment charge of $402 ($350 after tax) during fiscal 2016,which reflected the value of BH's shares in P&G stock as ofthe date of the impairment charges (see Note 13).All of the fiscal 2016 and 2015 impairment charges in theBatteries business are included as part of discontinuedoperations. The Batteries goodwill is included in Corporate inthe preceding table as of June 30, 2014. The remaining
Batteries goodwill at June 30, 2015 is reported in Current assetsheld for sale in the Consolidated Balance Sheet.The remaining change in goodwill during fiscal 2016 and 2015was primarily due to currency translation across all reportablesegments.All of the goodwill and indefinite-lived intangible assetimpairment charges that are not reflected in discontinuedoperations are included in Corporate for segment reporting.The goodwill and intangible asset valuations are dependent ona number of significant estimates and assumptions, includingmacroeconomic conditions, overall category growth rates,competitive activities, cost containment and margin expansionand Company business plans. We believe these estimates andassumptions are reasonable and are comparable to those thatwould be used by other marketplace participants. However,actual events and results could differ substantially from thoseused in our valuations. To the extent such factors result in afailure to achieve the level of projected cash flows used toestimate fair value, we may need to record additional non-cashimpairment charges in the future.Identifiable intangible assets were comprised of:
2016 2015
Years endedJune 30
GrossCarryingAmount
AccumulatedAmortization
GrossCarryingAmount
AccumulatedAmortization
INTANGIBLE ASSETS WITH DETERMINABLE LIVESBrands $ 3,409 $ (2,032) $ 3,039 $ (1,721)Patents andtechnology 2,624 (2,164) 2,619 (2,028)Customerrelationships 1,382 (514) 1,395 (464)Other 246 (130) 252 (123)TOTAL $ 7,661 $ (4,840) $ 7,305 $ (4,336)
INTANGIBLE ASSETS WITH INDEFINITE LIVESBrands 21,706 — 22,041 —TOTAL $ 29,367 $ (4,840) $ 29,346 $ (4,336)
Due to the divestiture of the Beauty Brands and Batteriesbusinesses, intangible assets specific to these businesses arereported in Current assets held for sale in accordance with theaccounting principles for assets held for sale as of June 30,2016 and 2015.Amortization expense of intangible assets was as follows:
Years ended June 30 2016 2015 2014
Intangible asset amortization $ 388 $ 457 $ 514
Estimated amortization expense over the next five fiscal yearsis as follows:
Years ending June 30 2017 2018 2019 2020 2021
Estimatedamortization expense $ 326 $ 298 $ 281 $ 255 $ 206

46 The Procter & Gamble Company
Amounts in millions of dollars except per share amounts or as otherwise specified.
NOTE 5
INCOME TAXES
Income taxes are recognized for the amount of taxes payablefor the current year and for the impact of deferred tax assetsand liabilities, which represent future tax consequences ofevents that have been recognized differently in the financialstatements than for tax purposes. Deferred tax assets andliabilities are established using the enacted statutory tax ratesand are adjusted for any changes in such rates in the period ofchange.
Earnings from continuing operations before income taxesconsisted of the following:
Years ended June 30 2016 2015 2014
United States $ 8,788 $ 8,496 $ 8,513International 4,581 2,516 4,996TOTAL $13,369 $11,012 $13,509
Income taxes on continuing operations consisted of thefollowing:
Years ended June 30 2016 2015 2014
CURRENT TAX EXPENSEU.S. federal $ 1,673 $ 2,127 $ 1,399International 1,483 1,142 1,252U.S. state and local 224 252 237
3,380 3,521 2,888DEFERRED TAX EXPENSEU.S. federal 33 (607) 145International and other (71) (189) (182)
(38) (796) (37)TOTAL TAX EXPENSE $ 3,342 $ 2,725 $ 2,851
A reconciliation of the U.S. federal statutory income tax rateto our actual income tax rate on continuing operations isprovided below:
Years ended June 30 2016 2015 2014
U.S. federal statutoryincome tax rate 35.0 % 35.0 % 35.0 %Country mix impacts offoreign operations (9.1)% (14.0)% (10.8)%Changes in uncertain taxpositions (0.5)% (0.9)% (1.7)%Venezuela deconsolidationcharge — % 6.6 % — %Other (0.4)% (2.0)% (1.4)%EFFECTIVE INCOMETAX RATE 25.0 % 24.7 % 21.1 %
Changes in uncertain tax positions represent changes in our netliability related to prior year tax positions. Country miximpacts of foreign operations includes the effects of foreignsubsidiaries' earnings taxed at ratesother than the U.S. statutoryrate, the U.S. tax impacts of non-U.S. earnings repatriation andany net impacts of intercompany transactions.
Tax benefits credited to shareholders' equity totaled $899 forthe year ended June 30, 2016. This primarily relates to theimpact of certain adjustments to pension obligations recordedin stockholders' equity and the impact of excess tax benefitsfrom the exercise of stock options. Tax costs charged toshareholders' equity totaled $634 for the year ended June 30,2015. This primarily relates to the tax effects of net investmenthedges and the impact of certain adjustments to pensionobligations recorded in stockholders' equity, partially offset byexcess tax benefits from the exercise of stock options.
We have undistributed earnings of foreign subsidiaries ofapproximately $49.0 billion at June 30, 2016, for whichdeferred taxes have not been provided. Such earnings areconsidered indefinitely invested in the foreign subsidiaries. Ifsuch earnings were repatriated, additional tax expense mayresult. However, the calculation of the amount of deferred U.S.income tax on these earnings is not practicable because of thelarge number of assumptions necessary to compute the tax.
A reconciliation of the beginning and ending liability foruncertain tax positions is as follows:
Years ended June 30 2016 2015 2014
BEGINNING OF YEAR $ 1,096 $ 1,437 $ 1,600Increases in tax positionsfor prior years 124 87 146Decreases in tax positionsfor prior years (97) (146) (296)Increases in tax positionsfor current year 97 118 142Settlements with taxingauthorities (301) (250) (135)Lapse in statute oflimitations (39) (27) (33)Currency translation (23) (123) 13END OF YEAR $ 857 $ 1,096 $ 1,437
Included in the total liability for uncertain tax positions atJune 30, 2016, is $589 that, depending on the ultimateresolution, could impact the effective tax rate in future periods.
The Company is present in approximately 140 taxablejurisdictions and, at any point in time, has 50-60 jurisdictionalaudits underway at various stages of completion. We evaluateour tax positions and establish liabilities for uncertain taxpositions that may be challenged by local authorities and maynot be fully sustained, despite our belief that the underlyingtax positions are fully supportable. Uncertain tax positions arereviewed on an ongoing basis and are adjusted in light ofchanging facts and circumstances, including progress of taxaudits, developments in case law and closing of statute oflimitations. Such adjustments are reflected in the tax provision

The Procter & Gamble Company 47
Amounts in millions of dollars except per share amounts or as otherwise specified.
as appropriate. We have tax years open ranging from 2008 andforward. We are generally not able to reliably estimate theultimate settlement amounts until the close of the audit. Basedon information currently available, we anticipate that over thenext 12 month period, audit activity could be completed relatedto uncertain tax positions in multiple jurisdictions for whichwe have accrued existing liabilities of approximately $250,including interest and penalties.
Accounting pronouncements require that, without discretion,we recognize the additional accrual of any possible relatedinterest and penalties relating to the underlying uncertain taxposition in income tax expense, unless the Company qualifiesfor a specific exception. As of June 30, 2016, 2015 and 2014,we had accrued interest of $323, $347 and $411 and accruedpenalties of $20, $19 and $32, respectively, which are notincluded in the above table. During the fiscal years endedJune 30, 2016, 2015 and 2014, we recognized $2, $15 and $(6)in interest benefit/(expense) and $(2), $13 and $2 in penaltiesbenefit/(expense), respectively. The net benefits recognizedresulted primarily from the favorable resolution of taxpositions for prior years.
Deferred income tax assets and liabilities were comprised ofthe following:
Years ended June 30 2016 2015
DEFERRED TAX ASSETSPension and postretirement benefits $ 2,226 $ 1,739Loss and other carryforwards 1,077 1,014Stock-based compensation 845 949Advance payments 515 281Accrued marketing and promotion 240 266Unrealized loss on financial andforeign exchange transactions 122 183Fixed assets 216 139Inventory 61 49Accrued interest and taxes 55 48Other 764 839Valuation allowances (467) (324)TOTAL $ 5,654 $ 5,183
DEFERRED TAX LIABILITIESGoodwill and other intangibleassets $ 9,461 $ 9,530Fixed assets 1,533 1,590Unrealized gain on financial andforeign exchange transactions 387 353Other 105 149TOTAL $ 11,486 $ 11,622
Net operating loss carryforwards were $3.2 billion and $3.1billion at June 30, 2016 and 2015, respectively. If unused, $1.0billion will expire between 2016 and 2035. The remainder,totaling $2.2 billion at June 30, 2016, may be carried forwardindefinitely.

48 The Procter & Gamble Company
Amounts in millions of dollars except per share amounts or as otherwise specified.
NOTE 6
EARNINGS PER SHARE
Net earnings attributable to Procter & Gamble less preferred dividends (net of related tax benefits) are divided by the weightedaverage number of common shares outstanding during the year to calculate Basic net earnings per common share. Diluted netearnings per common share are calculated to give effect to stock options and other stock-based awards (see Note 7) and assumeconversion of preferred stock (see Note 8).
Net earnings/(loss) attributable to Procter & Gamble and common shares used to calculate Basic and Diluted net earnings pershare were as follows:
Years ended June 30 2016 2015 2014
CONSOLIDATED AMOUNTS ContinuingOperations
Dis-continued
Operations TotalContinuingOperations
Dis-continued
Operations TotalContinuingOperations
Dis-continued
Operations Total
Net earnings/(loss) $10,027 $ 577 $10,604 $ 8,287 $ (1,143) $ 7,144 $10,658 $ 1,127 $11,785Net earnings attributable tononcontrolling interests (96) — (96) (98) (10) (108) (120) (22) (142)Net earnings/(loss) attributableto P&G (Diluted) 9,931 577 10,508 8,189 (1,153) 7,036 10,538 1,105 11,643Preferred dividends, net of tax (255) — (255) (259) — (259) (253) — (253)Net earnings/(loss) attributableto P&G available to commonshareholders (Basic) $ 9,676 $ 577 $10,253 $ 7,930 $ (1,153) $ 6,777 $10,285 $ 1,105 $11,390SHARES IN MILLIONSBasic weighted average commonshares outstanding 2,698.9 2,698.9 2,698.9 2,711.7 2,711.7 2,711.7 2,719.8 2,719.8 2,719.8Add: Effect of dilutive securities
Conversion of preferred shares(1) 103.9 103.9 103.9 108.6 108.6 108.6 112.3 112.3 112.3Impact of stock options andother unvested equity awards (2) 41.6 41.6 41.6 63.3 63.3 63.3 72.6 72.6 72.6
Diluted weighted averagecommon shares outstanding 2,844.4 2,844.4 2,844.4 2,883.6 2,883.6 2,883.6 2,904.7 2,904.7 2,904.7PER SHARE AMOUNTSBasic net earnings/(loss) percommon share (3) $ 3.59 $ 0.21 $ 3.80 $ 2.92 $ (0.42) $ 2.50 $ 3.78 $ 0.41 $ 4.19Diluted net earnings/(loss) percommon share (3) $ 3.49 $ 0.20 $ 3.69 $ 2.84 $ (0.40) $ 2.44 $ 3.63 $ 0.38 $ 4.01
(1) Despite being included currently in Diluted net earnings per common share, the actual conversion to common stock occurs when thepreferred shares are sold. Shares may only be sold after being allocated to the ESOP participants pursuant to the repayment of the ESOP'sobligations through 2035.
(2) Outstanding stock options of approximately 55 million in 2016, 8 million in 2015 and 9 million in 2014 were not included in the Dilutednet earnings per share calculation because the options were out of the money or to do so would have been antidilutive (i.e., the total proceedsupon exercise would have exceeded the market value of the underlying common shares).
(3) Basic net earnings per common share and Diluted net earnings per common share are calculated on Net earnings/(loss) attributable to Procter& Gamble.
NOTE 7
STOCK-BASED COMPENSATION
We have stock-based compensation plans under which weannually grant stock option, restricted stock unit (RSU) andperformance stock unit (PSU) awards to key managers anddirectors. Exercise prices on options granted have been, andcontinue to be, set equal to the market price of the underlyingshares on the date of the grant. Since September 2002, thegrantsof key manager stock option awardsvest after three years
and have a 10-year life. The key manager stock option awardsgranted from July 1998 through August 2002 vested after threeyearsand have a 15-year life. Key managers can elect to receiveup to the entire value of their option award in RSUs. Keymanager RSUs vest and are settled in shares of common stockfive years from the grant date. The awards provided to theCompany's directors are in the form of RSUs. In addition toour key manager and director grants, we make other minorstock option and RSU grants to employees for which the termsare not substantially different than key manager awards.

The Procter & Gamble Company 49
Amounts in millions of dollars except per share amounts or as otherwise specified.
Senior-level executives receive PSU awards. Under thisprogram, the number of PSUs that will vest three years afterthe respective grant date is based on the Company'sperformance relative to pre-established performance goalsduring that three year period.
Atotal of 185 million shares of common stock were authorizedfor issuance under the stock-based compensation planapproved by shareholders in 2014. Atotal of 125 million sharesremain available for grant under the 2014 plan. The disclosuresbelow include stock-based compensation related todiscontinued operations, which is not material in any periodpresented.
Years ended June 30 2016 2015 2014
STOCK-BASED COMPENSATION EXPENSEStock options $ 199 $ 223 $ 246RSUs and PSUs 143 114 114
Income tax benefit $ 85 $ 109 $ 127
In calculating the compensation expense for stock optionsgranted, we utilize a binomial lattice-based valuation model.Assumptions utilized in the model, which are evaluated andrevised to reflect market conditions and experience, were asfollows:
Years ended June 30 2016 2015 2014
Interest rate 0.7 - 1.9% 0.1 - 2.1% 0.1 - 2.8%Weightedaverage interestrate 1.8% 2.0% 2.5%Dividend yield 3.2% 3.1% 3.1%Expectedvolatility 15 - 17% 11 - 15% 15 - 17%Weightedaveragevolatility 16% 15% 16%Expected life inyears 8.3 8.3 8.2
Lattice-based option valuation models incorporate ranges ofassumptions for inputs and those ranges are disclosed in thepreceding table. Expected volatilities are based on acombination of historical volatility of our stock and impliedvolatilities of call options on our stock. We use historical datato estimate option exercise and employee termination patternswithin the valuation model. The expected life of optionsgranted isderived from the output of the option valuation modeland represents the average period of time that options grantedare expected to be outstanding. The interest rate for periodswithin the contractual life of the options is based on the U.S.Treasury yield curve in effect at the time of grant.
A summary of options, RSUs and PSUs outstanding under theplans as of June 30, 2016 and activity during the year thenended is presented below:
Options
Options(in
thousands)
WeightedAverageExercise
Price
WeightedAverage
Contract-ual Life in
Years
AggregateIntrinsic
Value
Outstanding,beginning ofyear 260,292 $ 63.74Granted 21,848 79.01Exercised (50,175) 49.40Canceled (1,568) 73.70OUTSTANDING,END OF YEAR 230,397 $ 68.02 5.1 $ 3,440EXERCISABLE 164,578 $ 62.63 3.6 $ 3,263
The weighted average grant-date fair value of options grantedwas $8.48, $9.38 and $10.01 per share in 2016, 2015 and 2014,respectively. The total intrinsic value of options exercised was$1,388, $1,814 and $1,152 in 2016, 2015 and 2014,respectively. The total grant-date fair value of options thatvested during 2016, 2015 and 2014 was $200, $241 and $319,respectively. At June 30, 2016, there was $186 ofcompensation cost that has not yet been recognized related tostock option grants. That cost is expected to be recognizedover a remaining weighted average period of 1.9 years. Cashreceived from options exercised was $2,332, $2,631 and$1,938 in 2016, 2015 and 2014, respectively. The actual taxbenefit realized for the tax deductions from option exercisestotaled $433, $519 and $338 in 2016, 2015 and 2014,respectively.
RSUs PSUs
Other stock-based awards
Units (inthousands)
WeightedAverage
Grant DateFair Value
Units (inthousands)
WeightedAverage
Grant DateFair Value
Non-vestedat July 1,2015 5,008 $ 64.78 1,188 $ 74.48Granted 1,855 66.32 571 73.02Vested (1,453) 61.64 (613) 71.68Forfeited (136) 67.17 — —Non-vestedat June 30,2016 5,274 $ 65.53 1,146 $ 75.25
At June 30, 2016, there was $202 of compensation cost thathas not yet been recognized related to restricted stock, RSUsand PSUs. That cost is expected to be recognized over aremaining weighted average period of 3.0 years. The total fairvalue of shares vested was $97, $79 and $95 in 2016, 2015 and2014, respectively.
We have no specific policy to repurchase common shares tomitigate the dilutive impact of options, RSUs and PSUs.However, we have historically made adequate discretionarypurchases, based on cash availability, market trends and otherfactors, to offset the impacts of such activity.

50 The Procter & Gamble Company
Amounts in millions of dollars except per share amounts or as otherwise specified.
NOTE 8POSTRETIREMENT BENEFITS AND EMPLOYEESTOCK OWNERSHIP PLANWe offer various postretirement benefits to our employees.Defined Contribution Retirement PlansWe have defined contribution plans which cover the majorityof our U.S. employees, as well as employees in certain othercountries. These plans are fully funded. We generally makecontributions to participants' accounts based on individual basesalaries and years of service. Total global defined contributionexpense was $292, $305 and $311 in 2016, 2015 and 2014,respectively.The primary U.S. defined contribution plan (the U.S. DC plan)comprises the majority of the expense for the Company'sdefined contribution plans. For the U.S. DC plan, thecontribution rate is set annually. Total contributions for thisplan approximated 14% of total participants' annual wages andsalaries in 2016 and 2015 and 15% in 2014.We maintain The Procter & Gamble Profit Sharing Trust(Trust) and Employee Stock Ownership Plan (ESOP) to
provide a portion of the funding for the U.S. DC plan and otherretiree benefits (described below). Operating details of theESOP are provided at the end of this Note. The fair value ofthe ESOP Series A shares allocated to participants reduces ourcash contribution required to fund the U.S. DC plan.Defined Benefit Retirement Plans and Other RetireeBenefitsWe offer defined benefit retirement pension plans to certainemployees. These benefits relate primarily to local plansoutside the U.S. and, to a lesser extent, plans assumed inprevious acquisitions covering U.S. employees.We also provide certain other retiree benefits, primarily healthcare and life insurance, for the majority of our U.S. employeeswho become eligible for these benefits when they meetminimum age and service requirements. Generally, the healthcare plans require cost sharing with retirees and pay a statedpercentage of expenses, reduced by deductibles and othercoverages. These benefits are primarily funded by ESOPSeries B shares and certain other assets contributed by theCompany.
Obligation and Funded Status. The following provides a reconciliation of benefit obligations, plan assets and funded status ofthese defined benefit plans:
Pension Benefits (1) Other Retiree Benefits (2)
Years ended June 30 2016 2015 2016 2015
CHANGE IN BENEFIT OBLIGATIONBenefit obligation at beginning of year (3) $ 15,951 $ 17,053 $ 4,904 $ 5,505Service cost 314 317 124 156Interest cost 466 545 219 240Participants' contributions 17 19 74 71Amendments 8 17 (40) (325)Actuarial loss/(gain) 1,927 524 589 (399)Acquisitions/(divestitures) (21) 7 (7) —Special termination benefits 6 11 12 23Currency translation and other (826) (1,908) (14) (134)Benefit payments (557) (634) (229) (233)BENEFIT OBLIGATION AT END OF YEAR (3) $ 17,285 $ 15,951 $ 5,632 $ 4,904
CHANGE IN PLAN ASSETSFair value of plan assets at beginning of year $ 10,605 $ 11,098 $ 3,470 $ 3,574Actual return on plan assets 630 1,016 408 10Acquisitions/(divestitures) (13) — — —Employer contributions 306 262 32 18Participants' contributions 17 19 74 71Currency translation and other (719) (1,156) (8) (6)ESOP debt impacts (4) — — 40 36Benefit payments (557) (634) (229) (233)FAIR VALUE OF PLAN ASSETS AT END OF YEAR $ 10,269 $ 10,605 $ 3,787 $ 3,470Reclassification of net obligation to held for sale liabilities 402 336 16 —FUNDED STATUS $ (6,614) $ (5,010) $ (1,829) $ (1,434)
(1) Primarily non-U.S.-based defined benefit retirement plans.(2) Primarily U.S.-based other postretirement benefit plans.(3) For the pension benefit plans, the benefit obligation is the projected benefit obligation. For other retiree benefit plans, the benefit obligation
is the accumulated postretirement benefit obligation.(4) Represents the net impact of ESOP debt service requirements, which is netted against plan assets for other retiree benefits.

The Procter & Gamble Company 51
Amounts in millions of dollars except per share amounts or as otherwise specified.
The underfunding of pension benefits is primarily a function of the different funding incentives that exist outside of the U.S. Incertain countries, there are no legal requirements or financial incentives provided to companies to pre-fund pension obligationsprior to their due date. In these instances, benefit payments are typically paid directly from the Company's cash as they becomedue.
Pension Benefits Other Retiree BenefitsYears ended June 30 2016 2015 2016 2015
CLASSIFICATION OF NET AMOUNT RECOGNIZEDNoncurrent assets $ 180 $ 276 $ — $ —Current liabilities (33) (39) (21) (20)Noncurrent liabilities (6,761) (5,247) (1,808) (1,414)NET AMOUNT RECOGNIZED $ (6,614) $ (5,010) $ (1,829) $ (1,434)AMOUNTS RECOGNIZED IN ACCUMULATED OTHER COMPREHENSIVE INCOME (AOCI)Net actuarial loss $ 6,088 $ 4,488 $ 2,247 $ 1,731Prior service cost/(credit) 270 300 (334) (346)NET AMOUNTS RECOGNIZED IN AOCI $ 6,358 $ 4,788 $ 1,913 $ 1,385
The accumulated benefit obligation for all defined benefit pension plans was $15,546 and $14,239 as of June 30, 2016 and 2015,respectively. Pension plans with accumulated benefit obligations in excess of plan assets and plans with projected benefit obligationsin excess of plan assets consisted of the following:
Accumulated Benefit ObligationExceeds the Fair Value of Plan Assets
Projected Benefit ObligationExceeds the Fair Value of Plan Assets
Years ended June 30 2016 2015 2016 2015
Projected benefit obligation $ 15,233 $ 13,411 $ 15,853 $ 14,057Accumulated benefit obligation 13,587 11,918 14,149 12,419Fair value of plan assets 8,082 7,931 8,657 8,435
Net Periodic Benefit Cost. Components of the net periodic benefit cost were as follows:
Pension Benefits Other Retiree BenefitsYears ended June 30 2016 2015 2014 2016 2015 2014
AMOUNTS RECOGNIZED IN NET PERIODIC BENEFIT COSTService cost $ 314 $ 317 $ 298 $ 124 $ 156 $ 149Interest cost 466 545 590 219 240 256Expected return on plan assets (731) (732) (701) (416) (406) (385)Prior service cost/(credit) amortization 29 30 26 (52) (20) (20)Net actuarial loss amortization 265 275 214 78 105 118Special termination benefits 6 11 5 12 23 9GROSS BENEFIT COST/(CREDIT) 349 446 432 (35) 98 127Dividends on ESOP preferred stock — — — (52) (58) (64)NET PERIODIC BENEFIT COST/(CREDIT) $ 349 $ 446 $ 432 $ (87) $ 40 $ 63CHANGE IN PLAN ASSETS AND BENEFIT OBLIGATIONS RECOGNIZED IN AOCINet actuarial loss/(gain) - current year $ 2,028 $ 240 $ 597 $ (3)Prior service cost/(credit) - current year 8 17 (40) (325)Amortization of net actuarial loss (265) (275) (78) (105)Amortization of prior service (cost)/credit (29) (30) 52 20Currency translation and other (172) (677) (3) (34)TOTAL CHANGE IN AOCI 1,570 (725) 528 (447)NET AMOUNTS RECOGNIZED IN PERIODICBENEFIT COST AND AOCI $ 1,919 $ (279) $ 441 $ (407)
Net periodic benefit costs include amounts related to discontinued operations, which are not material for any period.

52 The Procter & Gamble Company
Amounts in millions of dollars except per share amounts or as otherwise specified.
Amounts expected to be amortized from AOCI into net periodic benefit cost during the year ending June 30, 2017, are as follows:
Pension Benefits Other Retiree Benefits
Net actuarial loss $ 400 $ 126Prior service cost/(credit) 28 (45)
Assumptions. We determine our actuarial assumptions on an annual basis. These assumptions are weighted to reflect each countrythat may have an impact on the cost of providing retirement benefits. The weighted average assumptions used to determine benefitobligations recorded on the Consolidated Balance Sheets as of June 30, were as follows: (1)
Pension Benefits Other Retiree Benefits2016 2015 2016 2015
Discount rate 2.1% 3.1% 3.6% 4.5%Rate of compensation increase 2.9% 3.1% N/A N/AHealth care cost trend rates assumed for next year N/A N/A 7.2% 6.8%Rate to which the health care cost trend rate is assumed to decline (ultimatetrend rate) N/A N/A 4.9% 5.0%Year that the rate reaches the ultimate trend rate N/A N/A 2021 2021
(1) Determined as of end of year.
The weighted average assumptions used to determine net benefit cost recorded on the Consolidated Statement of Earnings for theyears ended June 30, were as follows: (1)
Pension Benefits Other Retiree BenefitsYears ended June 30 2016 2015 2014 2016 2015 2014
Discount rate 3.1% 3.5% 4.0% 4.5% 4.4% 4.8%Expected return on plan assets 7.2% 7.2% 7.2% 8.3% 8.3% 8.3%Rate of compensation increase 3.1% 3.2% 3.2% N/A N/A N/A
(1) Determined as of beginning of year and adjusted for acquisitions.
Several factors are considered in developing the estimate for the long-term expected rate of return on plan assets. For the definedbenefit retirement plans, these factors include historical rates of return of broad equity and bond indices and projected long-termrates of return obtained from pension investment consultants. The expected long-term rates of return for plan assets are 8 - 9%for equities and 5 - 6% for bonds. For other retiree benefit plans, the expected long-term rate of return reflects that the assets arecomprised primarily of Company stock. The expected rate of return on Company stock is based on the long-term projected returnof 8.5% and reflects the historical pattern of returns.
Assumed health care cost trend rates could have a significant effect on the amounts reported for the other retiree benefit plans. Aone percentage point change in assumed health care cost trend rates would have the following effects:
One-PercentagePoint Increase
One-PercentagePoint Decrease
Effect on the total service and interest cost components $ 80 $ (59)Effect on the accumulated postretirement benefit obligation 1,057 (809)
Plan Assets. Our investment objective for defined benefit retirement plan assets is to meet the plans' benefit obligations, whileminimizing the potential for future required Company plan contributions. The investment strategies focus on asset classdiversification, liquidity to meet benefit payments and an appropriate balance of long-term investment return and risk. Targetranges for asset allocations are determined by matching the actuarial projections of the plans' future liabilities and benefit paymentswith expected long-term rates of return on the assets, taking into account investment return volatility and correlations across assetclasses. Plan assets are diversified across several investment managers and are generally invested in liquid funds that are selectedto track broad market equity and bond indices. Investment risk is carefully controlled with plan assets rebalanced to targetallocations on a periodic basis and with continual monitoring of investment managers' performance relative to the investmentguidelines established with each investment manager.

The Procter & Gamble Company 53
Amounts in millions of dollars except per share amounts or as otherwise specified.
Our target asset allocation for the year ended June 30, 2016, and actual asset allocation by asset category as of June 30, 2016 and2015, were as follows:
Target Asset Allocation Actual Asset Allocation at June 30
Pension BenefitsOther Retiree
BenefitsPension Benefits Other Retiree Benefits
Asset Category 2016 2015 2016 2015
Cash 2% 2% 2% 2% 2% 1%Debt securities 55% 3% 55% 50% 4% 5%Equity securities 43% 95% 43% 48% 94% 94%TOTAL 100% 100% 100% 100% 100% 100%
The following tables set forth the fair value of the Company's plan assets as of June 30, 2016 and 2015 segregated by level withinthe fair value hierarchy (refer to Note 9 for further discussion on the fair value hierarchy and fair value principles). Collectivefunds are valued using the net asset value reported by the managers of the funds and as supported by the unit prices of actualpurchase and sale transactions. Company stock listed as Level 2 in the hierarchy represents preferred shares which are valuedbased on the value of Company common stock. The majority of our Level 3 pension assets are insurance contracts. Their fairvalues are based on their cash equivalent or models that project future cash flows and discount the future amounts to a presentvalue using market-based observable inputs, including credit risk and interest rate curves. There was no significant activity withinthe Level 3 pension and other retiree benefits plan assets during the years presented.
Pension Benefits Other Retiree Benefits
Years ended June 30Fair Value
Hierarchy Level 2016 2015Fair Value
Hierarchy Level 2016 2015
ASSETS AT FAIR VALUECash and cash equivalents 1 & 2 $ 262 $ 266 1 $ 70 $ 36Company stock (1) — — 2 3,545 3,239Collective fund - equity 2 4,381 5,054 2 14 17Collective fund - fixed income 2 5,498 5,162 2 158 178Other (2) 1 & 3 128 123 — —TOTAL ASSETS AT FAIR VALUE $ 10,269 $ 10,605 $ 3,787 $ 3,470
(1) Company stock is net of ESOP debt discussed below.(2) The Company's other pension and other retiree benefit plan assets measured at fair value are generally classified as Level 3 within the fair
value hierarchy. There are no material other pension and other retiree benefit plan asset balances classified as Level 1 within the fair valuehierarchy.
Cash Flows. Management's best estimate of cash requirementsand discretionary contributions for the defined benefitretirement plans and other retiree benefit plans for the yearending June 30, 2017, is $217 and $37, respectively. For thedefined benefit retirement plans, this is comprised of $93 inexpected benefit payments from the Company directly toparticipants of unfunded plans and $124 of expectedcontributions to funded plans. For other retiree benefit plans,this is comprised of $22 in expected benefit payments from theCompany directly to participants of unfunded plans and $15of expected contributions to funded plans. Expectedcontributions are dependent on many variables, including thevariability of the market value of the plan assets as comparedto the benefit obligation and other market or regulatoryconditions. In addition, we take into consideration our businessinvestment opportunities and resulting cash requirements.Accordingly, actual funding may differ significantly fromcurrent estimates.
Total benefit payments expected to be paid to participants,which include payments funded from the Company's assetsand payments from the plans are as follows:
Years ending June 30PensionBenefits
Other RetireeBenefits
EXPECTED BENEFIT PAYMENTS2017 $ 516 $ 1902018 527 2072019 537 2212020 550 2332021 588 244
2022 - 2026 3,232 1,365

54 The Procter & Gamble Company
Amounts in millions of dollars except per share amounts or as otherwise specified.
Employee Stock Ownership Plan
We maintain the ESOPto provide funding for certain employeebenefits discussed in the preceding paragraphs.
The ESOPborrowed $1.0 billion in 1989 and the proceeds wereused to purchase Series AESOP Convertible Class APreferredStock to fund a portion of the U.S. DC plan. Principal andinterest requirements of the borrowing were paid by the Trustfrom dividends on the preferred shares and from advancesprovided by the Company. The original borrowing of $1.0billion has been repaid in full, and advances from the Companyof $74 remain outstanding at June 30, 2016. Each share isconvertible at the option of the holder into one share of theCompany's common stock. The dividend for the current yearwas equal to the common stock dividend of $2.66 per share.The liquidation value is $6.82 per share.
In 1991, the ESOP borrowed an additional $1.0 billion. Theproceeds were used to purchase Series B ESOP ConvertibleClass A Preferred Stock to fund a portion of retiree health carebenefits. These shares, net of the ESOP's debt, are consideredplan assets of the other retiree benefits plan discussed above.Debt service requirements are funded by preferred stockdividends, cash contributions and advances provided by theCompany, of which $718 is outstanding at June 30, 2016. Eachshare is convertible at the option of the holder into one shareof the Company's common stock. The dividend for the currentyear was equal to the common stock dividend of $2.66 pershare. The liquidation value is $12.96 per share.
Our ESOP accounting practices are consistent with currentESOP accounting guidance, including the permissiblecontinuation of certain provisions from prior accountingguidance. ESOP debt, which is guaranteed by the Company,is recorded as debt (see Note 10) with an offset to the reservefor ESOP debt retirement, which is presented withinShareholders' equity. Advances to the ESOP by the Companyare recorded as an increase in the Reserve for ESOP debtretirement. Interest incurred on the ESOP debt is recorded asInterest expense. Dividends on all preferred shares, net ofrelated tax benefits, are charged to Retained earnings.
The series A and B preferred shares of the ESOP are allocatedto employees based on debt service requirements. The numberof preferred shares outstanding at June 30 was as follows:
Shares in thousands 2016 2015 2014
Allocated 39,241 42,044 44,465Unallocated 6,095 7,228 8,474TOTAL SERIES A 45,336 49,272 52,939
Allocated 23,925 23,074 22,085Unallocated 32,319 34,096 35,753TOTAL SERIES B 56,244 57,170 57,838
For purposes of calculating diluted net earnings per commonshare, the preferred shares held by the ESOP are consideredconverted from inception.
NOTE 9
RISK MANAGEMENTACTIVITIESAND FAIR VALUEMEASUREMENTS
As a multinational company with diverse product offerings,we are exposed to market risks, such as changes in interestrates, currency exchange rates and commodity prices. Weevaluate exposures on a centralized basis to take advantage ofnatural exposure correlation and netting. To the extent wechoose to manage volatility associated with the net exposures,we enter into various financial transactions that we account forusing the applicable accounting guidance for derivativeinstruments and hedging activities. These financialtransactions are governed by our policies covering acceptablecounterparty exposure, instrument types and other hedgingpractices.
At inception, we formally designate and document qualifyinginstruments as hedges of underlying exposures. We formallyassess, at inception and at least quarterly thereafter, whetherthe financial instruments used in hedging transactions areeffective at offsetting changes in either the fair value or cashflows of the related underlying exposures. Fluctuations in thevalue of these instruments generally are offset by changes inthe fair value or cash flows of the underlying exposures beinghedged. This is driven by the high degree of effectivenessbetween the exposure being hedged and the hedginginstrument. The ineffective portion of a change in the fair valueof a qualifying instrument is immediately recognized inearnings. The amount of ineffectiveness recognized wasimmaterial for all years presented.
Credit Risk Management
We have counterparty credit guidelines and normally enter intotransactions with investment grade financial institutions, to theextent commercially viable. Counterparty exposures aremonitored daily and downgrades in counterparty credit ratingsare reviewed on a timely basis. We have not incurred, and donot expect to incur, material credit losses on our riskmanagement or other financial instruments.
Substantially all of the Company's financial instruments usedin hedging transactions are governed by industry standardnetting and collateral agreements with counterparties. If theCompany's credit rating were to fall below the levels stipulatedin the agreements, the counterparties could demand eithercollateralization or termination of the arrangements. Theaggregate fair value of the instruments covered by thesecontractual features that are in a net liability position as ofJune 30, 2016, was not material. The Company has not beenrequired to post collateral as a result of these contractualfeatures.
Interest Rate Risk Management
Our policy is to manage interest cost using a mixture of fixed-rate and variable-rate debt. To manage this risk in a cost-efficient manner, we enter into interest rate swaps whereby weagree to exchange with the counterparty, at specified intervals,the difference between fixed and variable interest amountscalculated by reference to a notional amount.

The Procter & Gamble Company 55
Amounts in millions of dollars except per share amounts or as otherwise specified.
Interest rate swaps that meet specific accounting criteria areaccounted for as fair value or cash flow hedges. For fair valuehedges, the changes in the fair value of both the hedginginstruments and the underlying debt obligations areimmediately recognized in Interest expense. For cash flowhedges, the effective portion of the changes in fair value of thehedging instrument is reported in OCI and reclassified intoInterest expense over the life of the underlying debt obligation.The ineffective portion for both cash flow and fair valuehedges, which was not material for any year presented, wasimmediately recognized in Interest expense.
Foreign Currency Risk Management
We manufacture and sell our products and finance ouroperations in a number of countries throughout the world. Asa result, we are exposed to movements in foreign currencyexchange rates.
To manage the exchange rate risk primarily associated with thefinancing of our operations, we have historically used acombination of forward contracts, options and currency swaps.As of June 30, 2016, we had currency swaps with originalmaturities up to five years, which are intended to offset theeffect of exchange rate fluctuations on intercompany loansdenominated in foreign currencies. These swaps are accountedfor as cash flow hedges. The effective portion of the changesin fair value of these instruments is reported in OCI andreclassified into SG&Aand Interest expense in the same periodor periods during which the related hedged transactions affectearnings. The ineffective portion, which was not material forany year presented, was immediately recognized in SG&A.
The change in fair values of certain non-qualifying instrumentsused to manage foreign exchange exposure of intercompanyfinancing transactions and certain balance sheet items subjectto revaluation are immediately recognized in earnings,substantially offsetting the foreign currency mark-to-marketimpact of the related exposures.
Net Investment Hedging
We hedge certain net investment positions in foreignsubsidiaries. To accomplish this, we either borrow directly inforeign currencies and designate all or a portion of the foreigncurrency debt as a hedge of the applicable net investmentposition or we enter into foreign currency swaps that aredesignated as hedges of net investments. Changes in the fairvalue of these instruments are recognized in OCI to offset thechange in the value of the net investment being hedged. Theineffective portion of these hedges, which was not material inany year presented, was immediately recognized in Interestexpense.
Commodity Risk Management
Certain raw materials used in our products or productionprocesses are subject to price volatility caused by weather,supply conditions, political and economic variables and otherunpredictable factors. To manage the volatility related toanticipated purchases of certain of these materials, we havehistorically, on a limited basis, used futures and options withmaturities generally less than one year and swap contracts withmaturities up to five years. As of and during the years endedJune 30, 2016 and 2015, we did not have any commodityhedging activity.
Insurance
We self-insure for most insurable risks. However, we purchaseinsurance for Directors and Officers Liability and certain othercoverage where it is required by law or by contract.
Fair Value Hierarchy
Accounting guidance on fair value measurements for certainfinancial assets and liabilities requires that financial assets andliabilities carried at fair value be classified and disclosed inone of the following categories:• Level 1: Quoted market prices in active markets for
identical assets or liabilities.• Level 2: Observable market-based inputs or unobservable
inputs that are corroborated by market data.• Level 3: Unobservable inputs reflecting the reporting
entity's own assumptions or external inputs from inactivemarkets.
When applying fair value principles in the valuation of assetsand liabilities, we are required to maximize the use of quotedmarket prices and minimize the use of unobservable inputs.The Company has not changed its valuation techniques usedin measuring the fair value of any financial assets or liabilitiesduring the year. Our fair value estimates take into considerationthe credit risk of both the Company and our counterparties.
When active market quotes are not available for financial assetsand liabilities, we use industry standard valuation models.Where applicable, these models project future cash flows anddiscount the future amounts to a present value using market-based observable inputs including credit risk, interest ratecurves, foreign currency rates and forward and spot prices forcurrencies. In circumstances where market-based observableinputs are not available, management judgment is used todevelop assumptions to estimate fair value. Generally, the fairvalue of our Level 3 instruments is estimated as the net presentvalue of expected future cash flows based on external inputs.

56 The Procter & Gamble Company
Amounts in millions of dollars except per share amounts or as otherwise specified.
The following table sets forth the Company's financial assets as of June 30, 2016 and 2015 that were measured at fair value on arecurring basis during the period:
Fair Value AssetYears ended June 30 2016 2015
Investments:U.S. government securities $ 4,839 $ 3,495Corporate bond securities 1,407 1,272Other investments 28 30
TOTAL $ 6,274 $ 4,797
Investment securities are presented in Available-for-sale investment securities and Other noncurrent assets. The amortized costof the U.S. government securities with maturities less than one year was $292 and $700 as of June 30, 2016 and 2015, respectively.The amortized cost of the U.S. government securities with maturities between one and five years was $4,513 and $2,789 as ofJune 30, 2016 and 2015, respectively. The amortized cost of corporate bond securities with maturities of less than a year was$382 and $221 as of June 30, 2016 and 2015, respectively. The amortized cost of corporate bond securities with maturities betweenone and five years was $1,018 and $1,052 as of June 30, 2016 and 2015, respectively. The Company's investments measured atfair value are generally classified as Level 2 within the fair value hierarchy. There are no material investment balances classifiedas either Level 1 or Level 3 within the fair value hierarchy. Fair values are generally estimated based upon quoted market pricesfor similar instruments.
The fair value of long-term debt was $24,362 and $23,127 as of June 30, 2016 and 2015, respectively. This includes the currentportion ($2,761 and $2,776 as of June 30, 2016 and 2015, respectively) of debt instruments. Certain long-term debt is recordedat fair value. Certain long-term debt is not recorded at fair value on a recurring basis, but is measured at fair value for disclosurepurposes. Long-term debt with fair value of $2,331 and $2,180 as of June 30, 2016 and 2015, respectively, is classified as Level2 within the fair value hierarchy. All remaining long-term debt is classified as Level 1 within the fair value hierarchy. Fair valuesare generally estimated based on quoted market prices for identical or similar instruments.
Disclosures about Derivative Instruments
The notional amounts and fair values of qualifying and non-qualifying financial instruments used in hedging transactions as ofJune 30, 2016 and 2015 are as follows:
Years ended June 30Notional Amount Fair Value Asset Fair Value (Liability)
2016 2015 2016 2015 2016 2015
DERIVATIVES IN CASH FLOW HEDGING RELATIONSHIPSForeign currency contracts $ 798 $ 951 $ 94 $ 312 $ (63) $ —DERIVATIVES IN FAIR VALUE HEDGING RELATIONSHIPSInterest rate contracts $ 4,993 $ 7,208 $ 371 $ 172 $ — $ (13)DERIVATIVES IN NET INVESTMENT HEDGING RELATIONSHIPSNet investment hedges $ 3,013 $ 537 $ 28 $ 96 $ (115) $ (1)DERIVATIVES NOT DESIGNATED AS HEDGING INSTRUMENTSForeign currency contracts $ 6,482 $ 6,610 $ 28 $ 13 $ (38) $ (68)
All derivative assets are presented in Prepaid expenses and other current assets or Other noncurrent assets. All derivative liabilitiesare presented in Accrued and other liabilities or Other noncurrent liabilities. The total notional amount of contracts outstandingat the end of the period is indicative of the level of the Company's derivative activity during the period. The decrease in thenotional balance of interest rate fair value hedges is due to the maturity of fixed rate debt and underlying swaps in the currentperiod. The increase in the notional balance of net investment hedges primarily reflects a movement into Euro cross currencyswaps due to lower interest rates in the current period. All of the Company's derivative assets and liabilities measured at fair valueare classified as Level 2 within the fair value hierarchy.
The Company recognizes transfers between levels within the fair value hierarchy, if any, at the end of each quarter. There wereno transfers between levels during the periods presented. In addition, there was no significant activity within the Level 3 assetsand liabilities during the periods presented. Except for the impairment charges related to our Batteries business (see Note 4), therewere no significant assets or liabilities that were re-measured at fair value on a non-recurring basis during the years ended June 30,2016 and 2015.

The Procter & Gamble Company 57
Amounts in millions of dollars except per share amounts or as otherwise specified.
Amount of Gain/(Loss)Recognized in AOCI
on Derivatives (Effective Portion)Years ended June 30 2016 2015
DERIVATIVES IN CASH FLOW HEDGINGRELATIONSHIPSInterest rate contracts $ (2) $ (1)Foreign currency contracts — 5TOTAL $ (2) $ 4DERIVATIVES IN NET INVESTMENT HEDGINGRELATIONSHIPSNet investment hedges $ (53) $ 60
During the next 12 months, the amount of the June 30, 2016AOCI balance that will be reclassified to earnings is expectedto be immaterial. The amounts of gains and losses included inearnings from qualifying and non-qualifying financialinstruments used in hedging transactions for the years endedJune 30, 2016 and 2015 were as follows:
Amount of Gain/(Loss)Reclassified from
AOCI into EarningsYears ended June 30 2016 2015
DERIVATIVES IN CASH FLOW HEDGINGRELATIONSHIPSInterest rate contracts $ 3 $ 6Foreign currency contracts (106) 152TOTAL $ (103) $ 158
Amount of Gain/(Loss)Recognized in Earnings
Years ended June 30 2016 2015
DERIVATIVES IN FAIR VALUE HEDGINGRELATIONSHIPSInterest rate contracts $ 212 $ (9)Debt (212) 9TOTAL $ — $ —DERIVATIVES IN NET INVESTMENT HEDGINGRELATIONSHIPSNet investment hedges $ (2) $ (1)DERIVATIVES NOT DESIGNATED AS HEDGINGINSTRUMENTSForeign currency contracts (1) $ (120) $ (987)
(1) The gain or loss on non-qualifying foreign currency contractssubstantially offsets the foreign currency mark-to-market impactof the related exposure.
NOTE 10SHORT-TERM AND LONG-TERM DEBT
Years ended June 30 2016 2015DEBT DUE WITHIN ONE YEARCurrent portion of long-term debt $ 2,760 $ 2,772Commercial paper 8,690 8,807Other 203 439TOTAL $ 11,653 $ 12,018Short-term weighted averageinterest rates (1) 0.2% 0.3%
(1) Short-term weighted average interest rates include the effects ofinterest rate swaps discussed in Note 9.
Years ended June 30 2016 2015LONG-TERM DEBT1.45% USD note due August 2016 $ 1,000 $ 1,0000.75% USD note due November 2016 500 500Floating rate USD note dueNovember 2016 500 5005.13% EUR note due October 2017 1,221 1,2311.60% USD note due November 2018 1,000 1,0004.70% USD note due February 2019 1,250 1,2501.90% USD note due November 2019 550 5500.28% JPY note due May 2020 973 8184.13% EUR note due December 2020 666 6719.36% ESOP debentures due2016-2021(1) 498 5721.85% USD note due February 2021 600 —2.00% EUR note due November 2021 833 8392.30% USD note due February 2022 1,000 1,0002.00% EUR note due August 2022 1,110 1,1193.10% USD note due August 2023 1,000 1,0001.13% EUR note due November 2023 1,388 —2.70% USD note due February 2026 600 —4.88% EUR note due May 2027 1,110 1,1196.25% GBP note due January 2030 670 7865.50% USD note due February 2034 500 5005.80% USD note due August 2034 600 6005.55% USD note due March 2037 1,400 1,400Capital lease obligations 45 52All other long-term debt 2,691 4,592Current portion of long-term debt (2,760) (2,772)TOTAL $18,945 $18,327Long-term weighted average interestrates (2) 3.1% 3.2%
(1) Debt issued by the ESOP is guaranteed by the Company and isrecorded as debt of the Company, as discussed in Note 8.
(2) Long-term weighted average interest rates include the effects ofinterest rate swaps discussed in Note 9.
Long-term debt maturities during the next five fiscal years are asfollows:
Years ending June 30 2017 2018 2019 2020 2021Debt maturities $2,760 $1,323 $2,357 $2,099 $1,387
The Procter & Gamble Company fully and unconditionallyguarantees the registered debt and securities issued by its 100%owned finance subsidiaries.

58 The Procter & Gamble Company
Amounts in millions of dollars except per share amounts or as otherwise specified.
NOTE 11
ACCUMULATED OTHER COMPREHENSIVE INCOME/(LOSS)
The table below presents the changes in Accumulated other comprehensive income/(loss) (AOCI), including the reclassificationsout of Accumulated other comprehensive income/(loss) by component:
Changes in Accumulated Other Comprehensive Income/(Loss) by Component
HedgesInvestmentSecurities
Pension and OtherRetiree Benefits
Financial StatementTranslation Total
BALANCE at JUNE 30, 2014 $ (3,876) $ (18) $ (5,165) $ 1,397 $ (7,662)OCI before reclassifications (1) 1,390 26 563 (7,475) (5,496)Amounts reclassified from AOCI (2) (5) (6) (156) (2) 281 255 378Net current period OCI 1,234 24 844 (7,220) (5,118)
BALANCE at JUNE 30, 2015 (2,642) 6 (4,321) (5,823) (12,780)OCI before reclassifications (3) (103) 29 (1,710) (1,679) (3,463)Amounts reclassified from AOCI (4) (5) 104 (1) 233 — 336Net current period OCI 1 28 (1,477) (1,679) (3,127)
BALANCE at JUNE 30, 2016 $ (2,641) $ 34 $ (5,798) $ (7,502) $ (15,907)(1) Net of tax (benefit) / expense of $741, $1 and $219 for gains/losses on hedges, investment securities and pension and other retiree benefit
items, respectively, for the period ended June 30, 2015.(2) Net of tax (benefit) / expense of $(2), $(1), and $109 for gains/losses on hedges, investment securities and pension and other retiree benefit
items, respectively, for the period ended June 30, 2015.(3) Net of tax (benefit) / expense of $6, $7, and $(708) for gains/losses on hedges, investment securities and pension and other retiree benefit
items, respectively, for the period ended June 30, 2016.(4) Net of tax (benefit) / expense of $(1), $0, and $87 for gains/losses on hedges, investment securities and pension and other retiree benefit
items, respectively, for the period ended June 30, 2016.(5) See Note 9 for classification of gains and losses from hedges in the Consolidated Statements of Earnings. Gains and losses on investment
securities are reclassified from AOCI into Other non-operating income, net. Gains and losses on pension and other retiree benefits arereclassified from AOCI into Cost of products sold and SG&A, and are included in the computation of net periodic pension cost (see Note8 for additional details).
(6) Amounts reclassified from AOCI for financial statement translation relate to the foreign currency losses written off as part of thedeconsolidation of our Venezuelan subsidiaries in fiscal 2015. These losses were reclassified into the Venezuela deconsolidation charge inthe Consolidated Statements of Earnings.

The Procter & Gamble Company 59
Amounts in millions of dollars except per share amounts or as otherwise specified.
NOTE 12
COMMITMENTS AND CONTINGENCIES
Guarantees
In conjunction with certain transactions, primarily divestitures,we may provide routine indemnifications (e.g.,indemnification for representations and warranties andretention of previously existing environmental, tax andemployee liabilities) for which terms range in duration and, insome circumstances, are not explicitly defined. The maximumobligation under some indemnifications is also not explicitlystated and, as a result, the overall amount of these obligationscannot be reasonably estimated. Other than obligationsrecorded as liabilities at the time of divestiture, we have notmade significant payments for these indemnifications. Webelieve that if we were to incur a loss on any of these matters,the loss would not have a material effect on our financialposition, results of operations or cash flows.
In certain situations, we guarantee loans for suppliers andcustomers. The total amount of guarantees issued under sucharrangements is not material.
Off-Balance Sheet Arrangements
We do not have off-balance sheet financing arrangements,including variable interest entities, that have a material impacton our financial statements.
Purchase Commitments and Operating Leases
We have purchase commitments for materials, supplies,services and property, plant and equipment as part of the normalcourse of business. Commitments made under take-or-payobligations are as follows:
Years endingJune 30 2017 2018 2019 2020 2021
Thereafter
Purchaseobligations $ 881 $ 221 $ 170 $ 129 $ 105 $ 288
Such amounts represent future purchases in line with expectedusage to obtain favorable pricing. This includes purchasecommitments related to service contracts for informationtechnology, human resources management and facilitiesmanagement activities that have been outsourced to third-partysuppliers. Due to the proprietary nature of many of ourmaterials and processes, certain supply contracts containpenalty provisions for early termination. We do not expect toincur penalty payments under these provisions that wouldmaterially affect our financial position, results of operationsor cash flows.
We also lease certain property and equipment for varyingperiods. Future minimum rental commitments under non-cancelable operating leases, net of guaranteed subleaseincome, are as follows:
Years endingJune 30 2017 2018 2019 2020 2021
Thereafter
Operatingleases $ 237 $ 240 $ 224 $ 206 $ 154 $ 502
Litigation
We are subject to various legal proceedings and claims arisingout of our business which cover a wide range of matters suchas antitrust, trade and other governmental regulations, productliability, patent and trademark, advertising, contracts,environmental, labor and employment and tax.
While considerable uncertainty exists, in the opinion ofmanagement and our counsel, the ultimate resolution of thevarious lawsuits and claims will not materially affect ourfinancial position, results of operations or cash flows.
We are also subject to contingencies pursuant to environmentallaws and regulations that in the future may require us to takeaction to correct the effects on the environment of priormanufacturing and waste disposal practices. Based oncurrently available information, we do not believe the ultimateresolution of environmental remediation will materially affectour financial position, results of operations or cash flows.
NOTE 13
DISCONTINUED OPERATIONS
On July 9, 2015, the Company announced the signing of adefinitive agreement to divest four product categories whichwill be merged with Coty. The divestiture was initiallycomprised of 43 of the Company's beauty brands (“BeautyBrands”), including the global salon professional hair care andcolor, retail hair color, cosmetics and fine fragrance businesses,along with select hair styling brands. Subsequent to signing,the fine fragrance brands of Dolce & Gabbana and ChristinaAguilera were excluded from the divestiture. In connectionwith the decision to exclude these brands, the Companyrecorded a non-cash, before-tax impairment charge indiscontinued operations of approximately $48 ($42 after tax)in fiscal 2016 in order to record the Dolce & Gabbana licenseintangible asset at its revised estimated net realizable value.On May 11, 2016, the Company entered into a separatetransaction to sell the Christina Aguilera brand prior to orconcurrent with the expected close date of the Coty transaction.On June 30, 2016, Dolce & Gabbana and the Shiseido Groupannounced the signing of the worldwide license agreement forthe Dolce & Gabbana beauty business. The Company willtransition out of the Dolce & Gabbana license upon theeffectiveness of the new license, which is expected to occurprior to or concurrent with the expected close of the Cotytransaction. In connection with this transition, the Companyagreed to pay a termination payment of $83 ($76 after tax).This termination payment charge is included in discontinuedoperations for the year ended June 30, 2016.
While the ultimate form of the Beauty Brands transaction hasnot yet been decided, the Company’s current preference is fora Reverse Morris Trust split-off transaction in which P&Gshareholders could elect to participate in an exchange offer toexchange their P&G shares for shares of a new corporation thatwould hold the Beauty Brands (excluding Dolce & Gabbanaand Christina Aguilera) and then immediately exchange thoseshares for Coty shares. The Company expects to close thetransaction in October 2016.

60 The Procter & Gamble Company
Amounts in millions of dollars except per share amounts or as otherwise specified.
Coty’s offer for the Beauty Brands, which was accepted by theCompany, was $12.5 billion. The final value of the transactionwill be determined at closing. Based on Coty’s stock price andoutstanding shares and equity grants as of June 30, 2016, thevalue of the transaction was approximately $13.1 billion. Thevalue is comprised of approximately 411 million shares, or54% of the diluted equity of the newly combined company,valued at approximately $10.7 billion and the assumption ofdebt of $2.4 billion by the entity holding the Beauty Brands(excluding Dolce & Gabbana and Christina Aguilera)immediately prior to close of the transaction. The assumeddebt is expected to vary between $3.9 billion and $1.9 billion,depending on a $22.06 to $27.06 per share collar of Coty’sstock based on the trading price prior to the close of thetransaction, but will be subject to other contractual valuationadjustments.
In February 2016, the Company completed the divestiture ofits Batteries business to Berkshire Hathaway (BH) via a splittransaction, in which the Company exchanged the DuracellCompany, which the Company had infused with additionalcash, to repurchase all 52.5 million shares of P&G stock ownedby BH. During the fiscal year ended June 30, 2016, theCompany recorded non-cash, before-tax goodwill andindefinite-lived asset impairment charges of $402 ($350 aftertax), to reduce the Batteries carrying value to the total estimatedproceeds based on the value of BH’s shares in P&G stock atthe time of the impairment charges (see Note 4). The Companyrecorded an after-tax gain on the final transaction of $422 toreflect a subsequent increase in the final value of the BH’sshares in P&G stock. The total value of the transaction was$4.2 billion representing the value of the Duracell business andthe cash infusion. The cash infusion of $1.7 billion wasreflected as a purchase of treasury stock.
On July 31, 2014, the Company completed the divestiture ofits Pet Care operations in North America, Latin America, andother selected countries to Mars, Incorporated (Mars) for $2.9billion in an all-cash transaction. Under the terms of theagreement, Mars acquired our branded pet care products, ourmanufacturing sites in the United States and the majority ofthe employees working in the Pet Care business. Theagreement included an option for Mars to acquire the Pet Carebusiness in several additional countries, which was alsocompleted in fiscal 2015. The European Union countries werenot included in the agreement with Mars.
In December 2014, the Company completed the divestiture ofits Pet Care operations in Western Europe to Spectrum Brandsin an all-cash transaction. Under the terms of the agreement,Spectrum Brands acquired our branded pet care products, ourmanufacturing site in the Netherlands and the majority of theemployees working in the Western Europe Pet Care business.The one-time after-tax impact of these transactions is notmaterial.
In accordance with applicable accounting guidance for thedisposal of long-lived assets, the results of the Beauty Brands,Batteries and Pet Care businesses are presented as discontinuedoperations and, as such, have been excluded from bothcontinuing operations and segment results for all periodspresented. Additionally, the Beauty Brands, Batteries and PetCare businesses' balance sheet positions are presented as assetsand liabilities held for sale in the Consolidated Balance Sheets.The Beauty Brands were historically part of the Company'sBeauty reportable segment. The Batteries business washistorically part of the Company's Fabric & Home Carereportable segment. The Pet Care business was historically partof the Company's Health Care reportable segment.
On July 1, 2015, the Company adopted ASU 2014-08, which included new reporting and disclosure requirements for discontinuedoperations. The new requirements are effective for discontinued operations occurring on or after the adoption date, which includesthe Beauty Brands divestiture. All other discontinued operations prior to July 1, 2015 are reported based on the previous disclosurerequirements for discontinued operations, including the Batteries and Pet Care divestitures.
The following table summarizes Net earnings/(loss) from discontinued operations and reconciles to the Consolidated Statementsof Earnings:
Years ended June 30 2016 2015 2014
Beauty Brands $ 336 $ 643 $ 660Batteries 241 (1,835) 389Pet Care — 49 78Net earnings/(loss) from discontinued operations $ 577 $ (1,143) $ 1,127

The Procter & Gamble Company 61
Amounts in millions of dollars except per share amounts or as otherwise specified.
The following table summarizes total assets and liabilities held for sale and reconciles to the Consolidated Balance Sheets:
Years ended June 30 2016 2015Beauty Brands Beauty Brands Batteries Total
Current assets held for sale $ 7,185 $ 922 $ 3,510 $ 4,432Noncurrent assets held for sale — 5,204 — 5,204Total assets held for sale $ 7,185 $ 6,126 $ 3,510 $ 9,636
Current liabilities held for sale $ 2,343 $ 356 $ 1,187 $ 1,543Noncurrent liabilities held for sale — 717 — 717Total liabilities held for sale $ 2,343 $ 1,073 $ 1,187 $ 2,260
The following is selected financial information included in Net earnings/(loss) from discontinued operations for the Beauty Brands:
Beauty BrandsYears ended June 30 2016 2015 2014
Net sales $ 4,910 $ 5,530 $ 6,109Cost of products sold 1,621 1,820 1,980Selling, general and administrative expense 2,763 2,969 3,299Intangible asset impairment charges 48 — —Interest expense 32 — 1Interest income 2 2 2Other non-operating income/(loss), net 9 91 (3)Earnings from discontinued operations before income taxes $ 457 $ 834 $ 828Income taxes on discontinued operations 121 191 168Net earnings/(loss) from discontinued operations $ 336 $ 643 $ 660
Included in Net earnings/(loss) from discontinued operations is $112 of transition costs that were incurred for the fiscal year endedJune 30, 2016.
The following is selected financial information included in cash flows from discontinued operations for the Beauty Brands:
Beauty BrandsYears ended June 30 2016 2015 2014
NON-CASH OPERATING ITEMSDepreciation and amortization $ 106 $ 125 $ 127Gain on sale of businesses 8 86 —Goodwill and intangible asset impairment charges 48 — —CASH FLOWS FROM INVESTING ACTIVITIESCapital expenditures $ 114 $ 106 $ 108

62 The Procter & Gamble Company
Amounts in millions of dollars except per share amounts or as otherwise specified.
The major components of assets and liabilities of the Beauty Brands held for sale are provided below. The assets and liabilitiesheld for sale will evolve up to the closing date for normal operational changes as well as contractual adjustments including theassumption of debt, pension plan funding and other provisions.
Beauty BrandsYears ended June 30 2016 (1) 2015
Cash $ 40 $ 9Restricted cash 996 (2) —Accounts receivable 384 293Inventories 494 476Prepaid expenses and other current assets 126 144Property, plant and equipment, net 629 613 (3)
Goodwill and intangible assets, net 4,411 4,513 (3)
Other noncurrent assets 105 78 (3)
Total current assets held for sale $ 7,185 $ 922Total noncurrent assets held for sale — 5,204Total assets held for sale $ 7,185 $ 6,126
Accounts payable $ 148 $ 118Accrued and other liabilities 384 238Noncurrent deferred tax liabilities 370 352 (3)
Long-term debt 996 (2) —Other noncurrent liabilities 445 365 (3)
Total current liabilities held for sale $ 2,343 $ 356Total noncurrent liabilities held for sale — 717Total liabilities held for sale $ 2,343 $ 1,073
(1) The Company expects the Beauty Brands transaction to close in October 2016. Therefore, for the period ended June 30, 2016, all assetsand liabilities held for sale are reported as current assets and liabilities held for sale on the Consolidated Balance Sheets.
(2) On January 26, 2016, Beauty Brands drew on its Term B loan of $1.0 billion. The proceeds will be held in restricted cash in escrow untilthe anticipated legal integration activities prior to close. Beauty Brands has received additional debt funding commitments with a consortiumof lenders of $3.5 billion.
(3) Amounts as of June 30, 2015, are reflected as part of the noncurrent assets and liabilities held for sale.

The Procter & Gamble Company 63
Amounts in millions of dollars except per share amounts or as otherwise specified.
Following is selected financial information included in Net earnings/(loss) from discontinued operations for the Batteries and PetCare businesses:
Net Sales
EarningsBefore
ImpairmentCharges andIncome Taxes
ImpairmentCharges
Income Tax(Expense)/
Benefit
Gain/(Loss) onSale Before
Income Taxes
Income Tax(Expense)/Benefit on
Sale
Net Earnings/(Loss) from
DiscontinuedOperations
Batteries 2016 $ 1,517 $ 266 $ (402) $ (45) $ (288) $ 710 (1) $ 2412015 2,226 479 (2,174) (140) — — (1,835)2014 2,552 548 — (159) — — 389
Pet Care 2016 — — — — — — —2015 251 — — (4) 195 (142) 492014 1,475 130 — (52) — — 78
Total 2016 $ 1,517 $ 266 $ (402) $ (45) $ (288) $ 710 (1) $ 2412015 2,477 479 (2,174) (144) 195 (142) (1,786)2014 4,027 678 — (211) — — 467
(1) The income tax benefit of the Batteries divestiture primarily represents the reversal of underlying deferred tax balances.
The major components of assets and liabilities of the Batteries business held for sale were as follows:
BatteriesYear ended June 30 2015
Cash $ 25Accounts receivable 245Inventories 304Prepaid expenses and other current assets 28Property, plant and equipment, net 496Goodwill and intangible assets, net 2,389Other noncurrent assets 23
Total assets held for sale $ 3,510
Accounts payable $ 195Accrued and other liabilities 194Long-term debt 18Noncurrent deferred tax liabilities 780
Total liabilities held for sale $ 1,187

64 The Procter & Gamble Company
Amounts in millions of dollars except per share amounts or as otherwise specified.
NOTE 14
QUARTERLY RESULTS (UNAUDITED)
Quarters Ended Sep 30 Dec 31 Mar 31 Jun 30 Total Year
NET SALES 2015-2016 $ 16,527 $ 16,915 $ 15,755 $ 16,102 $ 65,2992014-2015 18,771 18,495 16,930 16,553 70,749
OPERATING INCOME 2015-2016 3,768 3,853 3,318 2,502 13,4412014-2015 3,633 3,579 3,025 812 (1) 11,049
GROSS MARGIN 2015-2016 50.7% 50.0% 49.8% 47.9% 49.6%2014-2015 48.1 % 48.3 % 47.3 % 46.6 % 47.6 %
NET EARNINGS:Net earnings from continuing operations 2015-2016 $ 2,777 $ 2,905 $ 2,337 $ 2,008 $ 10,027
2014-2015 2,716 2,674 2,401 496 (1) 8,287Net earnings/(loss) from discontinuedoperations 2015-2016 (142) 323 446 (50) 577
2014-2015 (696) (276) (213) 42 (1,143)Net earnings attributable to Procter & Gamble 2015-2016 2,601 3,206 2,750 1,951 10,508
2014-2015 1,990 2,372 2,153 521 7,036DILUTED NET EARNINGS PERCOMMON SHARE: (2)
Earnings from continuing operations 2015-2016 $ 0.96 $ 1.01 $ 0.81 $ 0.71 $ 3.492014-2015 0.93 0.92 0.82 0.17 2.84
Earnings/(loss) from discontinued operations 2015-2016 (0.05) 0.11 0.16 (0.02) 0.202014-2015 (0.24) (0.10) (0.07) 0.01 (0.40)
Net earnings 2015-2016 0.91 1.12 0.97 0.69 3.692014-2015 0.69 0.82 0.75 0.18 2.44
(1) The Company recorded a one-time Venezuela deconsolidation charge of $2.0 billion before tax ($2.1 billion after tax) in the quarter-endedJune 30, 2015. This impact is discussed more fully in Note 1.
(2) Diluted net earnings per share is calculated on Net earnings attributable to Procter & Gamble.

The Procter & Gamble Company 65
Item 9. Changes in and Disagreements with Accountants onAccounting and Financial Disclosure.
Not applicable.
Item 9A. Controls and Procedures.
Evaluation of Disclosure Controls and Procedures.
The Company's President and Chief Executive Officer, DavidS. Taylor, and the Company's Chief Financial Officer, Jon R.Moeller, performed an evaluation of the Company's disclosurecontrols and procedures (as defined in Rules 13a-15(e) and15d-15(e) of the Securities Exchange Act of 1934 (ExchangeAct)) as of the end of the period covered by this Annual Reporton Form 10-K.
Messrs.Taylor and Moeller have concluded that the Company'sdisclosure controls and procedures were effective to ensurethat information required to be disclosed in reports we file orsubmit under the Exchange Act is (1) recorded, processed,
summarized and reported within the time periods specified inSecurities and Exchange Commission rules and forms, and(2) accumulated and communicated to our management,including Messrs. Taylor and Moeller, to allow their timelydecisions regarding required disclosure.
Changes in Internal Control over Financial Reporting.
There were no changes in our internal control over financialreporting that occurred during the Company's fourth fiscalquarter that have materially affected, or are reasonably likelyto materially affect, the Company's internal control overfinancial reporting.
Item 9B. Other Information.
Not applicable.
PART III
Item 10. Directors, Executive Officers and CorporateGovernance.
The Board of Directors has determined that the followingmembers of the Audit Committee are independent and areAudit Committee financial experts as defined by SEC rules:Ms. Patricia A. Woertz (Chair) and Mr. Kenneth I. Chenault.
The information required by this item is incorporated byreference to the following sections of the 2016 Proxy Statementfiled pursuant to Regulation 14A: the section entitled Electionof Directors; the section entitled Corporate Governance, up tobut not including the subsection entitled Board Engagementand Attendance; the subsections of the Corporate Governancesection entitled Code of Ethics, entitled Director Nominationsfor Inclusion in the 2017 Proxy Statement and entitledShareholder Recommendations of Board Nominees andCommittee Process for Recommending Board Nominees; andthe section entitled Section 16(a) Beneficial OwnershipReporting Compliance. Pursuant to Instruction 3 of Item 401(b) of Regulation S-K, Executive Officers of the Registrant arereported in Part I of this report.
Item 11. Executive Compensation.
The information required by this item is incorporated byreference to the following sections of the 2016 Proxy Statementfiled pursuant to Regulation 14A: the subsections of theCorporate Governance section entitled Committees of theBoard and entitled Compensation Committee Interlocks andInsider Participation; and the portion beginning with thesection entitled Director Compensation up to but not includingthe section entitled Security Ownership of Management andCertain Beneficial Owners.

66 The Procter & Gamble Company
Item 12. Security Ownership of Certain Beneficial Owners and Management and Related Stockholder Matters.
The following table gives information about the Company's common stock that may be issued upon the exercise of options,warrants and rights under all of the Company's equity compensation plans as of June 30, 2016. The table includes the followingplans: The Procter & Gamble 1992 Stock Plan; The Procter & Gamble 1993 Non-Employee Directors' Stock Plan; The Procter &Gamble Future Shares Plan; The Procter & Gamble 2001 Stock and Incentive Compensation Plan; The Procter & Gamble 2003Non-Employee Directors' Stock Plan; The Gillette Company 2004 Long-Term Incentive Plan; The Procter & Gamble 2009 Stockand Incentive Compensation Plan; The Procter & Gamble 2013 Non-Employee Directors' Stock Plan; and The Procter & Gamble2014 Stock and Incentive Compensation Plan.
Plan Category
(a)Number of securities tobe issued upon exerciseof outstanding options,
warrants and rights
(b)Weighted-
average exerciseprice of outstanding
options, warrants andrights
(c)Number of securities
remaining available forfuture issuance under
equity compensation plans(excluding securities
reflected in column (a))
Equity compensation plans approved bysecurity holders (1)
Options 226,562,300 $68.1722 (2)
Restricted Stock Units (RSUs)/PerformanceStock Units (PSUs) 11,125,863 N/A (2)
Equity compensation plans not approved bysecurity holders (3)
Options 4,030,317 59.2781 (4)
GRAND TOTAL 241,718,480 $68.0167 (5) 125,037,146(1) Includes The Procter & Gamble 1992 Stock Plan; The Procter & Gamble 1993 Non-Employee Directors' Stock Plan; The Procter & Gamble
2001 Stock and Incentive Compensation Plan; The Procter & Gamble 2003 Non-Employee Directors' Stock Plan; The Procter & Gamble2009 Stock and Incentive Compensation Plan; The Procter & Gamble 2013 Non-Employee Directors' Stock Plan; and The Procter & Gamble2014 Stock and Incentive Compensation Plan.
(2) Of the plans listed in (1), only The Procter & Gamble 2014 Stock and Incentive Compensation Plan allow for future grants of securities.The maximum number of shares that may be granted under this plan is 185 million shares. Stock options and stock appreciation rights arecounted on a one for one basis while full value awards (such as RSUs and PSUs) will be counted as 5 shares for each share awarded. Totalshares available for future issuance under this plan is 125 million.
(3) Includes The Procter & Gamble Future Shares Plan and The Gillette Company 2004 Long-Term Incentive Plan.(4) None of the plans listed in (3) allow for future grants of securities.(5) Weighted average exercise price of outstanding options only.
The Procter & Gamble Future Shares Plan
On October 14, 1997, the Company's Board of Directorsapproved The Procter & Gamble Future Shares Plan pursuantto which options to purchase shares of the Company's commonstock may be granted to employees worldwide. The purposeof this plan is to advance the interests of the Company by givingsubstantially all employees a stake in the Company's futuregrowth and success and to strengthen the alignment of interestsbetween employees and the Company's shareholders throughincreased ownership of shares of the Company's stock. Theplan has not been submitted to shareholders for approval.
Subject to adjustment for changes in the Company'scapitalization, the number of shares to be granted under theplan is not to exceed 17 million shares. Under the plan'sregulations, recipients are granted options to acquire 100 sharesof the Company's common stock at an exercise price equal tothe average price of the Company's common stock on the dateof the grant. These options vest five years after the date ofgrant and expire ten years following the date of grant. If a
recipient leaves the employ of the Company prior to the vestingdate for a reason other than disability, retirement or specialseparation (as defined in the plan), then the award is forfeited.
At the time of the first grant following Board approval of theplan, each employee of the Company not eligible for an awardunder the 1992 Stock Plan was granted options for 100 shares.From the date of this first grant through June 30, 2003, eachnew employee of the Company has also received options for100 shares. Following the grant of options on June 30, 2003,the Company suspended this part of the plan. The planterminated on October 13, 2007.
The Gillette Company 2004 Long-Term Incentive Plan
Shareholders of The Gillette Company approved The GilletteCompany 2004 Long-Term Incentive Plan on May 20, 2004,and the plan was assumed by the Company upon the mergerbetween The Procter & Gamble Company and The GilletteCompany. All options became immediately vested andexercisable on October 1, 2005 as a result of the merger. Afterthe merger, all outstanding options became options to purchase

The Procter & Gamble Company 67
shares of The Procter & Gamble Company subject to anexchange ratio of .975 shares of P&G stock per share of Gillettestock. Only employees previously employed by The GilletteCompany prior to October 1, 2005 are eligible to receive grantsunder this plan.
The plan was designed to attract, retain and motivateemployees of The Gillette Company and, until the effectivedate of the merger between The Gillette Company and TheProcter & Gamble Company, non-employee members of theGillette Board of Directors. Under the plan, eligibleparticipants are: (i) granted or offered the right to purchasestock options, (ii) granted stock appreciation rights and/or(iii) granted shares of the Company's common stock orrestricted stock units (and dividend equivalents). Subject toadjustment for changes in the Company's capitalization andthe addition of any shares authorized but not issued orredeemed under The Gillette Company 1971 Stock OptionPlan, the number of shares to be granted under the plan is notto exceed 19,000,000 shares.
Except in the case of death of the recipient, all stock optionsand stock appreciation rights must expire no later than ten yearsfrom the date of grant. The exercise price for all stock optionsgranted under the plan must be equal to or greater than the fairmarket value of the Company's stock on the date of grant. Anycommon stock awarded under the plan may be subject torestrictions on sale or transfer while the recipient is employed,as the committee administering the plan may determine.
If a recipient of a grant leaves the Company while holding anunexercised option or right: (1) any unexercisable portionsimmediately become void, except in the case of death,retirement, special separation (as those terms are defined in the
plan) or any grants as to which the Compensation Committeeof the Board of Directors has waived the terminationprovisions; and (2) any exercisable portions immediatelybecome void, except in the case of death, retirement, specialseparation, voluntary resignation that is not for Good Reason(as those terms are defined in the plan) or any grants as to whichthe Compensation Committee of the Board of Directors haswaived the termination provisions.
Additional information required by this item is incorporatedby reference to the 2016 Proxy Statement filed pursuant toRegulation 14A, beginning with the section entitled SecurityOwnership of Management and Certain Beneficial Owners andup to but not including the section entitled Section 16(a)Beneficial Ownership Reporting Compliance.
Item 13. Certain Relationships and Related Transactions andDirector Independence.
The information required by this item is incorporated byreference to the following sections of the 2016 Proxy Statementfiled pursuant to Regulation 14A: the subsections of theCorporate Governance section entitled Director Independenceand Review and Approval of Transactions with RelatedPersons.
Item 14. Principal Accountant Fees and Services.
The information required by this item is incorporated byreference to the following section of the 2016 Proxy Statementfiled pursuant to Regulation 14A: Report of the AuditCommittee, which ends with the subsection entitled ServicesProvided by Deloitte.
PART IV
Item 15. Exhibits and Financial Statement Schedules.
1. Financial Statements:
The following Consolidated Financial Statements of TheProcter & Gamble Company and subsidiaries, management'sreport and the reports of the independent registered publicaccounting firm are incorporated by reference in Part II, Item 8of this Form 10-K.• Management's Report on Internal Control over Financial
Reporting• Report of Independent Registered PublicAccounting Firm
on Internal Control over Financial Reporting• Report of Independent Registered PublicAccounting Firm
on Consolidated Financial Statements• Consolidated Statements of Earnings - for years ended
June 30, 2016, 2015 and 2014
• Consolidated Statements of Other ComprehensiveIncome - for years ended June 30, 2016, 2015 and 2014
• Consolidated Balance Sheets - as of June 30, 2016 and2015
• Consolidated Statements of Shareholders' Equity - foryears ended June 30, 2016, 2015 and 2014
• Consolidated Statements of Cash Flows - for years endedJune 30, 2016, 2015 and 2014
• Notes to Consolidated Financial Statements
2. Financial Statement Schedules:
These schedules are omitted because of the absence of theconditions under which they are required or because theinformation is set forth in the Consolidated FinancialStatements or Notes thereto.
68 The Procter & Gamble Company
EXHIBITS
Exhibit (2-1) - First, Second and Third Amendments to the Transaction Agreement dated as of July 8, 2015 among The Procter & GambleCompany, Coty Inc., Galleria Co. and Green Acquisition Sub Inc. + **
Exhibit (3-1) - Amended Articles of Incorporation (as amended by shareholders at the annual meeting on October 11, 2011 andconsolidated by the Board of Directors on April 8, 2016). +
(3-2) - Regulations (as approved by the Board of Directors on April 8, 2016, pursuant to authority granted by shareholders at theannual meeting on October 13, 2009). +
Exhibit (4-1) - Indenture, dated as of September 3, 2009, between the Company and Deutsche Bank Trust Company Americas, as Trustee(Incorporated by reference to Exhibit (4-1) of the Company's Annual Report on Form 10-K for the year ended June 30,2015).
Exhibit (10-1) - The Procter & Gamble 2001 Stock and Incentive Compensation Plan (as amended on August 17, 2007), which wasoriginally adopted by shareholders at the annual meeting on October 9, 2001 (Incorporated by reference to Exhibit (10-1)of the Company's Form 10-Q for the quarter ended March 31, 2013), and related correspondence and terms and conditions(Incorporated by reference to Exhibit (10-1) of the Company's Form 10-Q for the quarter ended December 31, 2013).*
(10-2) - The Procter & Gamble 1992 Stock Plan (as amended December 11,2001), which was originally adopted by the shareholdersat the annual meeting on October 12, 1992 (Incorporated by reference to Exhibit (10-2) of the Company's Annual Reporton Form 10-K for the year ended June 30, 2013).*
(10-3) - The Procter & Gamble Executive Group Life Insurance Policy (Incorporated by reference to Exhibit (10-3) of theCompany's Annual Report on Form 10-K for the year ended June 30, 2013).*
(10-4) - The Procter & Gamble Deferred Compensation Plan for Directors (as amended December 12, 2006), which was originallyadopted by the Board of Directors on September 9, 1980 (Incorporated by reference to Exhibit (10-4) of the Company'sAnnual Report on Form 10-K for the year ended June 30, 2012).*
(10-5) - The Procter & Gamble 1993 Non-Employee Directors' Stock Plan (as amended September 10, 2002), which was originallyadopted by the shareholders at the annual meeting on October 11, 1994 (Incorporated by reference to Exhibit (10-5) ofthe Company's Annual Report on Form 10-K for the year ended June 30, 2013).*
(10-6) - Summary of the Company’s Key Manager Long-Term Incentive Program +; related correspondence and terms andconditions (Incorporated by reference to Exhibit (10-6) of the Company's Form 10-Q for the quarter ended September 30,2015).*
(10-7) - The Procter & Gamble Future Shares Plan (as adjusted for the stock split effective May 21, 2004), which was originallyadopted by the Board of Directors on October 14, 1997 (Incorporated by reference to Exhibit (10-7) of the Company'sAnnual Report on Form 10-K for the year ended June 30, 2015).*
(10-8) - The Procter & Gamble 2003 Non-Employee Directors' Stock Plan (as amended in August 2007), which was originallyadopted by the shareholders at the annual meeting on October 14, 2003, and related correspondence and terms and conditions(Incorporated by reference to Exhibit (10-1) of the Company's Form 10-Q for the quarter ended September 30, 2012).*
(10-9) - The Procter & Gamble Company Executive Deferred Compensation Plan (Incorporated by reference to Exhibit (10-4) ofthe Company's Form 10-Q for the quarter ended December 31, 2013).*
(10-10) - Summary of the Company's Short TermAchievement Reward Program +; related correspondence and terms and conditions(Incorporated by reference to Exhibit (10-2) of the Company's Form 10-Q for the quarter ended September 30, 2015).*
(10-11) - Company's Forms of Separation Agreement & Release (Incorporated by reference to Exhibit (10-1) of the Company'sForm 10-Q for the quarter ended March 31, 2015).*
(10-12) - Summary of personal benefits available to certain officers and non-employee directors (Incorporated by reference toExhibit (10-1) of the Company's Form 10-Q for the quarter ended September 30, 2013).*
(10-13) - The Gillette Company 2004 Long-Term Incentive Plan (as amended on August 14, 2007) (Incorporated by reference toExhibit (10-4) of the Company's Form 10-Q for the quarter ended September 30, 2012).*
(10-14) - The Gillette Company Executive Life Insurance Program (Incorporated by reference to Exhibit (10-15) of the Company'sAnnual Report on Form 10-K for the year ended June 30, 2012).*
(10-15) - The Gillette Company Personal Financial Planning Reimbursement Program (Incorporated by reference to Exhibit (10-16)of the Company's Annual Report on Form 10-K for the year ended June 30, 2012).*
(10-16) - The Gillette Company Senior Executive Financial Planning Program (Incorporated by reference to Exhibit (10-17) of theCompany's Annual Report on Form 10-K for the year ended June 30, 2012).*
(10-17) - The Gillette Company Estate Preservation (Incorporated by reference to Exhibit (10-18) of the Company's Annual Reporton Form 10-K for the year ended June 30, 2012).*
(10-18) - The Gillette Company Deferred Compensation Plan (Incorporated by reference to Exhibit (10-19) of the Company'sAnnualReport on Form 10-K for the year ended June 30, 2012).*
The Procter & Gamble Company 69
(10-19) - Senior Executive Recoupment Policy (Incorporated by reference to Exhibit (10-20) of the Company's Annual Report onForm 10-K for the year ended June 30, 2012).*
(10-20) - The Gillette Company Deferred Compensation Plan (for salary deferrals prior to January 1, 2005) as amended throughAugust 21, 2006 (Incorporated by reference to Exhibit (10-21) of the Company's Annual Report on Form 10-K for theyear ended June 30, 2012).*
(10-21) - The Procter & Gamble 2009 Stock and Incentive Compensation Plan, which was originally adopted by shareholders atthe annual meeting on October 13, 2009 (Incorporated by reference to Exhibit (10-3) of the Company's Form 10-Q forthe quarter ended December 31, 2011), and the Regulations of the Compensation and Leadership Development Committeefor The Procter & Gamble 2009 Stock and Incentive Compensation Plan, The Procter & Gamble 2001 Stock and IncentiveCompensation Plan, The Procter & Gamble 1992 Stock Plan, The Procter & Gamble 1992 Stock Plan (Belgium Version),The Gillette Company 2004 Long-Term Incentive Plan and the Gillette Company 1971 Stock Option Plan (Incorporatedby reference to Exhibit (10-1) of the Company's Form 10-Q for the quarter ended December 31, 2012).*
(10-22) - The Procter & Gamble 2009 Stock and Incentive Compensation Plan - Additional terms and conditions and relatedcorrespondence (Incorporated by reference to Exhibit (10-2) of the Company Form 10-Q for the quarter ended December31, 2013).*
(10-23) - The Procter & Gamble Performance Stock Program Summary +; related correspondence and terms and conditions(Incorporated by reference to Exhibit (10-4) of the Company's Form 10-Q for the quarter ended September 30, 2015).*
(10-24) - The Procter & Gamble 2013 Non-Employee Directors' Stock Plan (Incorporated by reference to Exhibit 10-3 of theCompany's Form 10-Q for the quarter ended December 31, 2013).*
(10-25) - The Procter & Gamble 2014 Stock and Incentive Compensation Plan, which was originally adopted by shareholders atthe annual meeting on October 14, 2014 +; and the Regulations of the Compensation and Leadership DevelopmentCommittee for The Procter & Gamble 2014 Stock and Incentive Compensation Plan (Incorporated by reference to Exhibit(10-2) of the Company's Form 10-Q for the quarter ended March 31, 2015).*
(10-26) - The Procter & Gamble 2014 Stock and Incentive Compensation Plan - Additional terms and conditions (Incorporated byreference to Exhibit (10-9) of the Company's Form 10-Q for the quarter ended September 30, 2015), and The Procter &Gamble 2014 Stock and Incentive Compensation Plan - Related correspondence (Incorporated by reference to Exhibit(10-1) of the Company's Form 10-Q for the quarter ended December 31, 2015).*
(10-27) - Summary of the Company’s Retirement Plan Restoration Program +; and related correspondence and terms and conditions(Incorporated by reference to Exhibit (10-8) of the Company's Form 10-Q for the quarter ended September 30, 2015).*
Exhibit (12) - Computation of Ratio of Earnings to Fixed Charges. +
Exhibit (21) - Subsidiaries of the Registrant. +
Exhibit (23) - Consent of Independent Registered Public Accounting Firm. +
Exhibit (31) - Rule 13a-14(a)/15d-14(a) Certifications. +
Exhibit (32) - Section 1350 Certifications. +
Exhibit (99-1) - Summary of Directors and Officers Insurance Program. +
101.INS (1) XBRL Instance Document101.SCH (1) XBRL Taxonomy Extension Schema Document101.CAL (1) XBRL Taxonomy Extension Calculation Linkbase Document101.DEF (1) XBRL Taxonomy Definition Linkbase Document101.LAB (1) XBRL Taxonomy Extension Label Linkbase Document101.PRE (1) XBRL Taxonomy Extension Presentation Linkbase Document
(1) Pursuant to Rule 406T of Regulation S-T, these interactive data files are deemed not filed or part of a registration statementor prospectus for purposes of Sections 11 or 12 of the Securities Act of 1933 or Section 18 of the Securities Exchange Actof 1934 and otherwise are not subject to liability.
* Compensatory plan or arrangement.+ Filed herewith.
** Schedules and similar attachments of the Third Amendment have been omitted pursuant to Item 601(b)(2) of RegulationS-K. These exhibits and attachments consist of (I) Attachment to Schedule 1.05(b)(ii) Excluded Trademarks, (II)Attachment 3-C to Schedule 1.05(a)(vii) Additional Caldera Domain Names, (III) Parent Shared Technology LicenseAgreement, (IV) Section 1.05(a)(xx) Acquired Codes, (V) Section 5.21(k) Shared Codes and (VI) Exhibit R GalleriaBusiness Acquired Plans. The Company agrees to furnish supplementally to the SEC, upon request, a copy of all omittedschedules and attachments.

70 The Procter & Gamble Company
SIGNATURES
Pursuant to the requirements of Section 13 or 15(d) of the Securities Exchange Act of 1934, the registrant has duly caused thisreport to be signed on its behalf by the undersigned, thereunto duly authorized in the city of Cincinnati, State of Ohio.
THE PROCTER & GAMBLE COMPANY
By /s/ DAVID S. TAYLOR(David S. Taylor)Chairman of the Board, President and Chief Executive OfficerAugust 9, 2016
Pursuant to the requirements of the Securities Exchange Act of 1934, this report has been signed below by the following personsin the capacities and on the dates indicated.
Signature Title Date
/s/ DAVID S. TAYLOR(David S. Taylor)
Chairman of the Board, President and ChiefExecutive Officer (Principal Executive Officer) August 9, 2016
/s/ JON R. MOELLER(Jon R. Moeller)
Chief Financial Officer(Principal Financial Officer) August 9, 2016
/s/ VALARIE L. SHEPPARD(Valarie L. Sheppard)
Senior Vice President, Comptroller & Treasurer(Principal Accounting Officer) August 9, 2016
/s/ FRANCIS S. BLAKE(Francis S. Blake) Director August 9, 2016
/s/ ANGELA F. BRALY(Angela F. Braly) Director August 9, 2016
/s/ KENNETH I. CHENAULT(Kenneth I. Chenault) Director August 9, 2016
/s/ SCOTT D. COOK(Scott D. Cook) Director August 9, 2016
/s/ SUSAN DESMOND-HELLMANN(Susan Desmond-Hellmann) Director August 9, 2016
/s/ TERRY J. LUNDGREN(Terry J. Lundgren) Director August 9, 2016
/s/ W. JAMES MCNERNEY, JR.(W. James McNerney, Jr.) Director August 9, 2016
/s/ MARGARET C. WHITMAN(Margaret C. Whitman) Director August 9, 2016
/s/ PATRICIA A. WOERTZ(Patricia A. Woertz) Director August 9, 2016
/s/ ERNESTO ZEDILLO(Ernesto Zedillo) Director August 9, 2016

The Procter & Gamble Company 71
EXHIBIT INDEX
Exhibit (2-1) - First, Second and Third Amendments to the Transaction Agreement dated as of July 8, 2015 among The Procter & GambleCompany, Coty Inc., Galleria Co. and Green Acquisition Sub Inc. + **
Exhibit (3-1) - Amended Articles of Incorporation (as amended by shareholders at the annual meeting on October 11, 2011 andconsolidated by the Board of Directors on April 8, 2016). +
(3-2) - Regulations (as approved by the Board of Directors on April 8, 2016, pursuant to authority granted by shareholders at theannual meeting on October 13, 2009). +
Exhibit (4-1) - Indenture, dated as of September 3, 2009, between the Company and Deutsche Bank Trust Company Americas, as Trustee(Incorporated by reference to Exhibit (4-1) of the Company's Annual Report on Form 10-K for the year ended June 30,2015).
Exhibit (10-1) - The Procter & Gamble 2001 Stock and Incentive Compensation Plan (as amended on August 17, 2007), which wasoriginally adopted by shareholders at the annual meeting on October 9, 2001 (Incorporated by reference to Exhibit (10-1)of the Company's Form 10-Q for the quarter ended March 31, 2013), and related correspondence and terms and conditions(Incorporated by reference to Exhibit (10-1) of the Company's Form 10-Q for the quarter ended December 31, 2013).
(10-2) - The Procter & Gamble 1992 Stock Plan (as amended December 11,2001), which was originally adopted by the shareholdersat the annual meeting on October 12, 1992 (Incorporated by reference to Exhibit (10-2) of the Company's Annual Reporton Form 10-K for the year ended June 30, 2013).
(10-3) - The Procter & Gamble Executive Group Life Insurance Policy (Incorporated by reference to Exhibit (10-3) of theCompany's Annual Report on Form 10-K for the year ended June 30, 2013).
(10-4) - The Procter & Gamble Deferred Compensation Plan for Directors (as amended December 12, 2006), which was originallyadopted by the Board of Directors on September 9, 1980 (Incorporated by reference to Exhibit (10-4) of the Company'sAnnual Report on Form 10-K for the year ended June 30, 2012).
(10-5) - The Procter & Gamble 1993 Non-Employee Directors' Stock Plan (as amended September 10, 2002), which was originallyadopted by the shareholders at the annual meeting on October 11, 1994 (Incorporated by reference to Exhibit (10-5) ofthe Company's Annual Report on Form 10-K for the year ended June 30, 2013).
(10-6) - Summary of the Company’s Key Manager Long-Term Incentive Program +; related correspondence and terms andconditions (Incorporated by reference to Exhibit (10-6) of the Company's Form 10-Q for the quarter ended September 30,2015).
(10-7) - The Procter & Gamble Future Shares Plan (as adjusted for the stock split effective May 21, 2004), which was originallyadopted by the Board of Directors on October 14, 1997 (Incorporated by reference to Exhibit (10-7) of the Company'sAnnual Report on Form 10-K for the year ended June 30, 2015).
(10-8) - The Procter & Gamble 2003 Non-Employee Directors' Stock Plan (as amended in August 2007), which was originallyadopted by the shareholders at the annual meeting on October 14, 2003, and related correspondence and terms and conditions(Incorporated by reference to Exhibit (10-1) of the Company's Form 10-Q for the quarter ended September 30, 2012).
(10-9) - The Procter & Gamble Company Executive Deferred Compensation Plan (Incorporated by reference to Exhibit (10-4) ofthe Company's Form 10-Q for the quarter ended December 31, 2013).
(10-10) - Summary of the Company's Short TermAchievement Reward Program +; related correspondence and terms and conditions(Incorporated by reference to Exhibit (10-2) of the Company's Form 10-Q for the quarter ended September 30, 2015).
(10-11) - Company's Forms of Separation Agreement & Release (Incorporated by reference to Exhibit (10-1) of the Company'sForm 10-Q for the quarter ended March 31, 2015).
(10-12) - Summary of personal benefits available to certain officers and non-employee directors (Incorporated by reference toExhibit (10-1) of the Company's Form 10-Q for the quarter ended September 30, 2013).
(10-13) - The Gillette Company 2004 Long-Term Incentive Plan (as amended on August 14, 2007) (Incorporated by reference toExhibit (10-4) of the Company's Form 10-Q for the quarter ended September 30, 2012).
(10-14) - The Gillette Company Executive Life Insurance Program (Incorporated by reference to Exhibit (10-15) of the Company'sAnnual Report on Form 10-K for the year ended June 30, 2012).
(10-15) - The Gillette Company Personal Financial Planning Reimbursement Program (Incorporated by reference to Exhibit (10-16)of the Company's Annual Report on Form 10-K for the year ended June 30, 2012).
(10-16) - The Gillette Company Senior Executive Financial Planning Program (Incorporated by reference to Exhibit (10-17) of theCompany's Annual Report on Form 10-K for the year ended June 30, 2012).
(10-17) - The Gillette Company Estate Preservation (Incorporated by reference to Exhibit (10-18) of the Company's Annual Reporton Form 10-K for the year ended June 30, 2012).
(10-18) - The Gillette Company Deferred Compensation Plan (Incorporated by reference to Exhibit (10-19) of the Company'sAnnualReport on Form 10-K for the year ended June 30, 2012).

72 The Procter & Gamble Company
(10-19) - Senior Executive Recoupment Policy (Incorporated by reference to Exhibit (10-20) of the Company's Annual Report onForm 10-K for the year ended June 30, 2012).
(10-20) - The Gillette Company Deferred Compensation Plan (for salary deferrals prior to January 1, 2005) as amended throughAugust 21, 2006 (Incorporated by reference to Exhibit (10-21) of the Company's Annual Report on Form 10-K for theyear ended June 30, 2012).
(10-21) - The Procter & Gamble 2009 Stock and Incentive Compensation Plan, which was originally adopted by shareholders atthe annual meeting on October 13, 2009 (Incorporated by reference to Exhibit (10-3) of the Company's Form 10-Q forthe quarter ended December 31, 2011), and the Regulations of the Compensation and Leadership Development Committeefor The Procter & Gamble 2009 Stock and Incentive Compensation Plan, The Procter & Gamble 2001 Stock and IncentiveCompensation Plan, The Procter & Gamble 1992 Stock Plan, The Procter & Gamble 1992 Stock Plan (Belgium Version),The Gillette Company 2004 Long-Term Incentive Plan and the Gillette Company 1971 Stock Option Plan (Incorporatedby reference to Exhibit (10-1) of the Company's Form 10-Q for the quarter ended December 31, 2012).
(10-22) - The Procter & Gamble 2009 Stock and Incentive Compensation Plan - Additional terms and conditions and relatedcorrespondence (Incorporated by reference to Exhibit (10-2) of the Company Form 10-Q for the quarter ended December31, 2013).
(10-23) - The Procter & Gamble Performance Stock Program Summary +; related correspondence and terms and conditions(Incorporated by reference to Exhibit (10-4) of the Company's Form 10-Q for the quarter ended September 30, 2015).
(10-24) - The Procter & Gamble 2013 Non-Employee Directors' Stock Plan (Incorporated by reference to Exhibit 10-3 of theCompany's Form 10-Q for the quarter ended December 31, 2013).
(10-25) - The Procter & Gamble 2014 Stock and Incentive Compensation Plan, which was originally adopted by shareholders atthe annual meeting on October 14, 2014 +; and the Regulations of the Compensation and Leadership DevelopmentCommittee for The Procter & Gamble 2014 Stock and Incentive Compensation Plan (Incorporated by reference to Exhibit(10-2) of the Company's Form 10-Q for the quarter ended March 31, 2015).
(10-26) - The Procter & Gamble 2014 Stock and Incentive Compensation Plan - Additional terms and conditions (Incorporated byreference to Exhibit (10-9) of the Company's Form 10-Q for the quarter ended September 30, 2015), and The Procter &Gamble 2014 Stock and Incentive Compensation Plan - Related correspondence (Incorporated by reference to Exhibit(10-1) of the Company's Form 10-Q for the quarter ended December 31, 2015).
(10-27) - Summary of the Company’s Retirement Plan Restoration Program +; related correspondence and terms and conditions(Incorporated by reference to Exhibit (10-8) of the Company's Form 10-Q for the quarter ended September 30, 2015).
Exhibit (12) - Computation of Ratio of Earnings to Fixed Charges. +
Exhibit (21) - Subsidiaries of the Registrant. +
Exhibit (23) - Consent of Independent Registered Public Accounting Firm. +
Exhibit (31) - Rule 13a-14(a)/15d-14(a) Certifications. +
Exhibit (32) - Section 1350 Certifications. +
Exhibit (99-1) - Summary of Directors and Officers Insurance Program. +
101.INS (1) XBRL Instance Document101.SCH (1) XBRL Taxonomy Extension Schema Document101.CAL (1) XBRL Taxonomy Extension Calculation Linkbase Document101.DEF (1) XBRL Taxonomy Definition Linkbase Document101.LAB (1) XBRL Taxonomy Extension Label Linkbase Document101.PRE (1) XBRL Taxonomy Extension Presentation Linkbase Document
(1) Pursuant to Rule 406T of Regulation S-T, these interactive data files are deemed not filed or part of a registration statementor prospectus for purposes of Sections 11 or 12 of the Securities Act of 1933 or Section 18 of the Securities Exchange Actof 1934 and otherwise are not subject to liability.
+ Filed herewith.** Schedules and similar attachments of the Third Amendment have been omitted pursuant to Item 601(b)(2) of Regulation
S-K. These exhibits and attachments consist of (I) Attachment to Schedule 1.05(b)(ii) Excluded Trademarks, (II)Attachment 3-C to Schedule 1.05(a)(vii) Additional Caldera Domain Names, (III) Parent Shared Technology LicenseAgreement, (IV) Section 1.05(a)(xx) Acquired Codes, (V) Section 5.21(k) Shared Codes and (VI) Exhibit R GalleriaBusiness Acquired Plans. The Company agrees to furnish supplementally to the SEC, upon request, a copy of all omittedschedules and attachments.
BRANDS
For information on our portfolio ofbrands and our latest innovations,please visit www.pg.com/brandsand www.pginnovation.com.
CITIZENSHIP
P&G is committed to being a goodcorporate citizen and always doing theright thing. We focus our citizenshipefforts in five areas: governance,community impact, diversity andinclusion, environmental sustainabilityand gender equality. To learn more,please visit www.pg.com.
CORPORATE HEADQUARTERS
The Procter & Gamble CompanyP.O. Box 599Cincinnati, OH 45201-0599
P&G DIRECT STOCK PURCHASE PLAN
The Procter & Gamble Direct StockPurchase Plan (DSPP) is a direct stockpurchase and dividend reinvestment plan.The DSPP is open to current P&Gshareholders as well as new investorsand is designed to encourage long-terminvestment in P&G by providing aconvenient and economical way topurchase P&G stock and reinvestdividends. Highlights of the plan include:
• Minimum initial investment—$250• Weekly purchases• 24/7 online account access• Optional cash investment—minimum $50• Administered by Wells Fargo
Shareowner Services
For complete information on the DSPP,please read the Plan Prospectus. TheProspectus and online Plan Applicationare available at www.pgshareholder.comor by contacting Wells FargoShareowner Services.
GIVING THE GIFT OF P&G STOCK
Did you know that you can give P&Gstock to your children, grandchildren,nieces, nephews and friends? Many ofour long-time shareholders know what agreat gift P&G stock makes for a specialperson on a special occasion. You canmake the gift by transferring shares fromyour account or by purchasing shares forthe recipient through the DSPP. Please visitwww.pgshareholder.com or contact WellsFargo Shareowner Services for details.
SHAREOWNER SERVICES
Wells Fargo Shareowner Services servesas transfer and dividend paying agentfor P&G Common Stock and Administratorof the Procter & Gamble Direct StockPurchase Plan. Registered shareholdersand Plan participants needing accountassistance with share transfers, planpurchases/sales, lost stock certificates,etc., should contact Wells FargoShareowner Services at:
Website: www.pgshareholder.comE-mail: www.pgshareholder.comClick Contact Us under the Email section.Phone (M–F, 7am–7pm CST):1-800-742-6253 or 1-651-450-4064
TRANSFER AGENT
Wells Fargo Shareowner Services1110 Centre Pointe Curve, Suite 101Mendota Heights, MN 55120-4100
REGISTRAR
Wells Fargo Shareowner ServicesP.O. Box 64874St. Paul, MN 55164-0874
EXCHANGE LISTINGS
New York Stock ExchangeNYSE Euronext-Paris
STOCK SYMBOL
PG
ANNUAL MEETING
The next annual meeting of shareholderswill be held on Tuesday, October 11, 2016.A full transcript of the meeting will beavailable from Susan Felder, AssistantSecretary. Ms. Felder can be reached at1 P&G Plaza, Cincinnati, OH 45202-3315.
FORM 10-K
Shareholders may obtain a copy of P&G’s2016 report to the Securities and ExchangeCommission on Form 10-K at no chargeby going to www.pginvestor.com or bysending a written request to Wells FargoShareowner Services, P.O. Box 64874,St. Paul, MN 55164-0874.
The most recent certifications by ourChief Executive and Chief FinancialOfficers pursuant to Section 302 of theSarbanes-Oxley Act of 2002 are filedas exhibits to our Form 10-K for the fiscalyear ended June 30, 2016. We have alsofiled with the New York Stock Exchangethe most recent Annual CEO certificationas required by Section 303A.12(a) ofthe New York Stock Exchange ListedCompany Manual.
Company and Shareholder InformationP&G’S PURPOSE
We will provide branded products and services of superior quality and value that improve the lives ofthe world’s consumers, now and for generations to come. As a result, consumers will reward us withleadership sales, profit and value creation, allowing our people, our shareholders and the communitiesin which we live and work to prosper. To learn more, please visit www.pg.com.
The Procter & Gamble Company • 73

Global Company LeadershipDavid S. TaylorChairman of the Board, President and Chief Executive Officer*
*On June 1, 2016, P&G announced the retirement of Executive Chairman A.G. Lafley effective June 30, 2016, and the appointment of David S. Taylor as Chairman of the Boardeffective July 1, 2016. Taylor assumed the position of Chairman of the Board in addition to his role as President and CEO.
BUSINESS UNITS
Steven D. BishopGroup President – Global Health Care
Giovanni CiseraniGroup President – Global Fabric& Home Care and Global Babyand Feminine Care
Mary Lynn Ferguson-McHughGroup President – Global Family Care andGlobal Brand Creation and Innovation,P&G Ventures
Thomas M. FinnPresident – Global Personal Health Care
Fama FranciscoPresident – Global Feminine Care
Colleen E. JayPresident – Beauty Specialty Business
Shailesh JejurikarPresident – Global Fabric Careand Brand Building Organization,Global Fabric & Home Care
R. Alexandra KeithPresident – Global Skin & Personal Care
Patrice LouvetGroup President – Global Beauty
Charles E. PierceGroup President – Global Grooming
George TsourapasPresident – Global Home Careand P&G Professional
SELLING AND MARKET OPERATIONS
Gary A. CoombePresident – Europe
Henry KaramanoukianSenior Vice President –Go-to-Market, China
Juan Fernando PosadaPresident – Latin America
Matthew PricePresident – Greater China
Mohamed SamirPresident – India, Middle East and Africa
Magesvaran SuranjanPresident – Asia Pacific
Carolyn M. TastadGroup President – North America
THE FOLLOWING COMPANY OFFICERS RETIRED DURING THE 2015–16 FISCAL YEAR:
A.G. Lafley, Tarek N. Farahat, Hatsunori Kiriyama, Martin Riant
COMPANY OPERATIONS
Mark BieggerChief Human Resources Officer
Linda Clement-HolmesChief Information Officer
Philip J. DuncanGlobal Design Officer
Kathleen B. FishChief Technology Officer
William P. GipsonSenior Vice President – Global Diversityand Research & Development,Asia Innovation Centers
Deborah P. MajorasChief Legal Officer and Secretary
Jon R. MoellerChief Financial Officer
Julio N. NemethPresident – Global Business Services
Marc S. PritchardChief Brand Officer
Jeffrey K. SchomburgerGlobal Sales Officer
Valarie L. SheppardSenior Vice President,Comptroller and Treasurer
Kirti V. SinghVice President – Global Consumer& Market Knowledge
Yannis SkoufalosGlobal Product Supply Officer
74 • The Procter & Gamble Company

Board of DirectorsFrancis S. BlakeFormer Chairman of the Board and Chief Executive Officer ofThe Home Depot, Inc. (national retailer). Director since 2015.Also a Director of Delta Airlines and Macy’s, Inc. Age 67. Memberof the Audit and Governance & Public Responsibility Committees.
Angela F. BralyFormer Chair of the Board, President and Chief Executive Officerof WellPoint, Inc. (healthcare insurance), now known as Anthem.Director since 2009. Also a Director of Lowe’s Companies, Inc.,Brookfield Asset Management, and Exxon Mobil Corporation.Age 55. Chair of the Governance & Public ResponsibilityCommittee and member of the Audit Committee.
Kenneth I. ChenaultChairman and Chief Executive Officer of the AmericanExpress Company (global services, payments and travel).Director since 2008. Also a Director of International BusinessMachines Corporation. Age 65. Member of the Audit andCompensation & Leadership Development Committees.
Scott D. CookChairman of the Executive Committee of the Board of Intuit Inc.(software and web services). Director since 2000. Age 64.Chair of the Innovation & Technology Committee and memberof the Compensation & Leadership Development Committee.
Susan Desmond-HellmannChief Executive Officer of the Bill & Melinda Gates Foundation(private foundation supporting U.S. education, global healthand development, and community giving in the PacificNorthwest). Former Chancellor and Arthur and Toni Rembe RockDistinguished Professor, University of California, San Francisco.Director since 2010. Also a Director of Facebook, Inc. Age 59.Member of the Audit and Innovation & Technology Committees.
Terry J. LundgrenChairman and Chief Executive Officer of Macy’s, Inc.(national retailer). Director since 2013. Age 64. Member ofthe Compensation & Leadership Development and Innovation& Technology Committees.
W. James McNerney, Jr.Senior Advisor at Clayton, Dubilier & Rice (private equityinvestment firm). Former Chairman of the Board, Presidentand Chief Executive Officer of The Boeing Company (aerospace,commercial jetliners and military defense systems). Directorsince 2003. Also a Director of International Business MachinesCorporation. Age 67. Lead Director, Chair of the Compensation& Leadership Development Committee and member of theGovernance & Public Responsibility Committee.
David S. TaylorChairman of the Board, President and Chief Executive Officerof the Company. Director since 2015. Age 58.
Margaret C. WhitmanPresident and Chief Executive Officer of Hewlett PackardEnterprise (multinational information technology enterprise).Former Chairman of the Board, President and Chief ExecutiveOfficer of the Hewlett-Packard Company. Director since 2011.Also Chairman of the Board of HP, Inc. Age 60. Member ofthe Compensation & Leadership Development and Innovation& Technology Committees.
Patricia A. WoertzRetired Chairman of the Board and former Chief Executive Officerof Archer Daniels Midland Company (agricultural processorsof oilseeds, corn, wheat and cocoa, etc.). Director since 2008.Also a Director of Royal Dutch Shell plc and 3M Company. Age 63.Chair of the Audit Committee and member of the Governance& Public Responsibility Committee.
Ernesto ZedilloFormer President of Mexico. Director of the Center for the Studyof Globalization and Professor of International Economics andPolitics at Yale University. Director since 2001. Also a Director ofAlcoa Inc., Citigroup, Inc. and Promotora de Informaciones S.A.Age 64. Member of the Governance & Public Responsibilityand Innovation & Technology Committees.
The Board of Directors has four committees: Audit, Compensation & Leadership Development,Governance & Public Responsibility, Innovation & Technology
The Procter & Gamble Company • 75

LEADERSHIP
P&G is widely recognized as one of the world’s leadingcompanies and as a great company for leaders.
• #21, Fortune’s World’s Most Admired Companies• #32, Forbes’ America’s Most Reputable Companies• #35, Barron’s World’s Most Respected Companies• #9, Chief Executive Magazine’s 40 Best Companies for Leaders• #23, LinkedIn’s Global Top Attractors
INNOVATION
P&G brands consistently deliver meaningful, relevant innovationsto consumers. This commitment earned P&G eight of the top25 spots on the IRI New Product Pacesetters™ Report for the mostsuccessful non-food product launches of 2015. P&G innovationsmaking the list were Tide Simply Clean and Fresh (#3), AlwaysDiscreet (#4), Gillette Fusion ProGlide with FlexBall Technology(#8), Gillette Venus Swirl (#9), Febreze Unstopables (#12),Tide Ultra Stain Release (#13), Gillette Venus Embrace Sensitive(#21), and Crest/Oral-B 3D White Brilliance (#25). Since thefirst IRI New Product Pacesetters™ Report in 1995, P&G hashad more than 170 products make the top 25 list in non-foodcategories—more than our six largest competitors combined.
At the 63rd Cannes Lions International Festival of Creativity,one of the world’s premier events to inspire and recognizecreativity in branded communications, P&G and our agencieswere awarded 21 Lions across nine brands, including Ariel,Pantene, SK-II, Old Spice and Gillette. Campaigns like Ariel’sDads #ShareTheLoad, Gillette’s Go Ask Dad and SK-II’sMarriage Market Takeover reflect our choice to raise thebar on creativity, because it is key to unlocking growth forour brands, and because the consumers we serve aroundthe world deserve our very best.
CITIZENSHIP
P&G is committed to being a good corporate citizen andalways doing the right thing.
GovernanceThe foundation for all our citizenship efforts is goodgovernance, which we define as doing the right thing,improving transparency, building collaborative partnerships,respecting human and labor rights, and sourcing responsibly.
• Scored a perfect 100 on the Human Rights CampaignFoundation 2016 Corporate Equality Index
• Named a Supply Chain Master by the GartnerSupply Chain Top 25
Community ImpactWe believe deeply in supporting communities around theworld through our people, products and community impactprograms, with our efforts recognized in many parts of theworld. A few highlights:
• P&G Thailand received the American Chamber of CommerceCorporate Social Responsibility (CSR) Excellence Recognitionfor the fifth consecutive year.
• P&G’s Russia partnership with SOS Children’s Villages,supporting children left without parental care, was namedin a national contest as the Best Social Project of Russia.
• In the U.S., Tide Loads of Hope — a mobile laundromatproviding the basic comfort of clean clothing for those affectedby disaster—was named to PR News’ CSR Hall of Fame.
Diversity and InclusionP&G is a very diverse company, with nearly 150 nationalitiesin our global workforce. The more we mirror the diversity ofour consumers, the better equipped we are to understandand serve them.
• #5, DiversityInc’s Top Companies for Global Diversity
• #13, DiversityInc’s Top 50 Companies for Diversity
• For the ninth year in a row, P&G spent more than $2 billionwith minority- and women-owned businesses. Since 2005,P&G has been a member of the Billion Dollar Roundtable,a forum of companies spending more than $1 billion annuallywith diverse suppliers.
Environmental SustainabilityP&G is focused on driving positive change in the areas ofclimate, water and waste. Our work in this area has beenrecognized with inclusion on Corporate ResponsibilityMagazine’s 100 Best Corporate Citizens List, the MSCISustainability Index, and the FTSE4Good Index, on whichP&G has been named since the index’s inception.
Gender EqualityWe want to help build a better world free of gender bias, withequal representation and an equal voice for women and men.
• Working Mother Best Companies for MulticulturalWomen, Top 5
• Working Mother 100 Best Companies
• National Association for Female Executives,Top 60 Companies for Executive Women
Des
ign:
Mad
ison
Des
ign
RecognitionP&G’s unwavering commitments to leadership, innovation and citizenship resulted in a varietyof awards and recognitions this year.
76 • The Procter & Gamble Company

Citizenship at P&GP&G is committed to being a good corporate citizen and always doing the right thing.
We are and want to be known as a company that is governed responsibly and behaves ethically, that is open and transparent in its business dealings, that supports good causes and protects the environment, and that provides an appealing place to work where our employees are treated well and are given the opportunity to be all they can be. By growing our company responsibly, we earn the trust on which our business is based and we build the relationships on which our future depends.
We focus our citizenship efforts in five areas: governance, community impact, diversity and inclusion, environmental sustainability and gender equality.
GOVERNANCE
The foundation for all our citizenship efforts is good governance, which we define as doing the right thing, improving transparency, building collaborative partnerships, respecting human and labor rights and sourcing responsibly.
COMMUNITY IMPACT
We believe deeply in supporting communities around the world through our people, products and community impact programs. For example, the P&G Children’s Safe Drinking Water (CSDW) Program has delivered more than 10 billion liters of clean drinking water, working with more than 150 partners to help people in more than 85 countries. We also have a robust global disaster relief program that brings health and hygiene products and the comforts of home to those who need them most.
DIVERSITY AND INCLUSION
P&G is a very diverse company. There are nearly 150 nationalities represented in our workforce around the world. We have operations in about 70 countries and we sell our products in more than 180 countries and territories. The more we mirror the diversity of our consumers, the better equipped we are to understand and serve them. We get the full value of our diversity with a highly inclusive culture. We view diversity and inclusion as a business strategy — and an undeniable way to win.
ENVIRONMENTAL SUSTAINABILITY
P&G is focused on driving positive change in the areas of climate, water and waste. We’ve established our long-term vision in these areas with short-term goals to ensure we stay on track. We work hard to offer consumers superior branded products that require no trade-offs in performance, value or environmental impact.
GENDER EQUALITY
We want to help build a better world free of gender bias, with equal representation and an equal voice for women and men. We are leveraging our insights to uncover gender bias where it exists, and then we’re taking action to eliminate that bias as fully as we can. We’re doing this through our brands, with our corporate voice and with our people.
GOVERNANCEENVIRONMENTAL SUSTAINABILITY
COMMUNITY IMPACT
DIVERSITY AND INCLUSION
GENDER EQUALITY
The paper utilized in the printing of this annual report is certified to the FSC® Standards, which promotes environmentally appropriate, socially beneficial and economically viable management of the world’s forests.

© 2016 Procter & Gamble00387131