p i development research news - philippine institute for development ... · eralized through...
TRANSCRIPT
Editor's Notes
Vol. XXIX No.1 January - February 2011 ISSN 0115-9097
P H I L I P P I N E
I N S T I T U T E F O R
D E V E L O P M E N T
S T U D I E S
Surian sa mga Pag-aaral Pangkaunlaran ng Pi l ip inas
DEVELOPMENTDEVELOPMENTDEVELOPMENTDEVELOPMENTDEVELOPMENTRESEARCH NEWSRESEARCH NEWSRESEARCH NEWSRESEARCH NEWSRESEARCH NEWS
The PhilippineEconomy in 2010 and
Prospects for 2011Josef T. Yap*
15 Financing development in a postcrisisworld
What's Inside
After slowing down in 2008 and 2009—owing primarily to the reper-cussions of the 2008 Global Financial and Economic Crisis—the Phil-ippine economy grew rapidly in 2010. Gross domestic product (GDP)
posted a growth of 7.3 percent in 2010 compared to only 1.1 percent in theprevious year (Table 1). Economic growth is comparable to the 2007 figure,which is not surprising since election spending provided a boost to eco-nomic activity in both years.
All initial forecasts missed the sharp economic rebound (Table 2). Evenrevised forecasts were lower than the actual outcome. This implies thatanalysts have overlooked factors that contributed to economic growth. Hope-fully, the positive impact of these factors will continue in the near future.
Policy issues in the medium term relate mainly to diversifying sources ofeconomic growth. On the expenditure side, there must be more balance infavor of investment and away from consumption. On the production side,exports have to be more diversified and backward linkages to the domesticmanufacturing sector have to be strengthened. This will allow greater em-ployment in the more productive sectors of the economy.
* President, Philippine Institute for Development Studies. The sections on economic performance in 2010were largely lifted from Chapter 1 of the PIDS 2010 Economic Policy Monitor, which was coauthored byRuperto M. Majuca, a Senior Research Fellow at PIDS. The excellent research assistance of Ms. Kris A.Francisco, Research Analyst II at PIDS, is gratefully acknowledged. Likewise, the author would like toacknowledge the excellent contribution of Aubrey D. Tabuga and Celia M. Reyes who wrote the Box onPoverty and Economic Growth. The usual disclaimer applies.
With a new government in place and amid all thedevelopments that have taken place in the pasttwo years and that are happening at the moment,what prospects are in store for the Philippineeconomy in 2011?
Dr. Josef T. Yap, PIDS president, in his usual re-view of the Philippine economy in the previousyear and outlook for the year ahead, provides ananalysis of what to anticipate based on outcomesand developments in the various economic sec-tors in 2010. Stressing the point about the sharprebound in the Philippine economy in 2010, some-thing that all initial and even revised forecasts for2010 missed, Yap expressed the hope that thepositive impact of factors that contributed to suchrebound can and will continue in 2011 and thecoming years.
This, however, will depend on how the new ad-ministration will address the risks that will comeits way from the potential higher inflation due tothe expected higher food and fuel prices; the vola-tile capital inflows; and the continuing fiscal defi-cit. With rising poverty also remaining to be a majorchallenge, macroeconomic policies and programs,according to the analysis, should center not onlyin trying to achieve high (and sustained) economicgrowth but also in putting into effect redistribu-tive efforts to contain poverty.
The bottomline is that all these require a greatdeal of institutional strengthening and politicalwill. This, in itself, is perhaps the biggest chal-lenge. DRN

DEVELOPMENT RESEARCH NEWS January - February 20112
Table 1: Selected macroeconomic indicators, PhilippinesAnnual growth rates and share to GDPAt constant 1985 prices, in percent unless otherwise stated
1/ Figure for imports is for Jan–Nov 2010; Full year data for imports are still not availableSource: National Accounts of the Philippines, National Statistical Coordination Board; Selected Philippine Economic Indicators, Bangko Sentral ng Pilipinas; National StatisticsOffice; Forecasts of J.T. Yap.
Forecast2011
5.55.9
3.0
7.6
15.0
7.0
7.5
6.8
5.7
3.0
6.5
6.0
6.5
7.0
3.0
5.5
3.0
12.0
15.012.0
4.0
4.2
43.0
Gross National ProductGross Domestic Product
Agriculture, Fisheryand Forestry(share to GDP)
Agriculture and fishery
Forestry
Industry Sector(share to GDP)
Mining and quarrying
Manufacturing
Construction
Electricity, Gas and Water
Service Sector(share to GDP)
Transport, communicationand storage
Trade
Finance
Ownership of dwellingsand real estate
Private services
Government services
Personal ConsumptionExpenditure(share to GDP)
Government Consumption(share to GDP)
Capital Formation(share to GDP)
Exports (nominal $)Imports (nominal $)
Inflation (2000=100) (average)
91-Day Treasury Bill Rate (average)
Nominal Exchange Rate (P/$ average)
2006
6.1 5.4
3.8 18.8
3.9 18.7
(3.9) 0.1
4.5 32.5
(6.1) 1.5
4.6 24.0
7.3 3.9
6.4 3.1
6.7 48.7
6.3 8.7
6.1 16.9
11.4 5.6
5.7 4.7
6.9 8.4
4.7 4.3
5.5 78.3
6.1 6.4
2.7 17.2
14.9 9.2
5.5
5.4
51.3
2007
6.9 7.1
4.8 18.4
4.8 18.3
(0.4) 0.1
6.8 32.4
26.1 1.7
2.9 23.1
23.7 4.5
6.7 3.1
8.1 49.2
8.3 8.8
8.3 17.1
12.9 6.0
5.8 4.6
8.4 8.5
2.6 4.1
5.9 77.4
11.6 6.6
14.9 18.4
6.4 7.2
2.8
3.4
46.1
2008
6.2 3.8
3.2 18.3
3.2 18.2
1.7 0.1
5.0 32.8
1.9 1.7
4.3 23.2
7.8 4.6
7.3 3.2
3.3 48.9
4.2 8.9
1.2 16.7
2.5 5.9
5.7 4.7
4.9 8.6
5.5 4.2
4.7 78.1
3.2 6.6
1.7 18.1
(2.8) 2.2
9.3
5.4
44.5
2009
4.0 1.1
0.0 18.1
0.0 18.0
(4.5) 0.1
(0.9) 32.1
21.5 2.0
(4.4) 22.0
9.8 5.0
(2.9) 3.1
2.8 49.8
0.6 8.8
1.0 16.7
5.9 6.2
(0.3) 4.7
6.4 9.1
6.1 4.3
4.1 80.5
10.9 7.1
(5.7) 17.0
(21.7)(24.1)
3.2
4.2
47.6
2010
7.2 7.3
(0.5) 16.8
(0.3) 16.7
(34.4) 0.1
12.1 33.6
18.4 2.3
12.3 23.0
10.5 5.2
8.5 3.1
7.1 49.7
1.9 8.4
10.7 17.2
6.5 6.1
6.8 4.6
8.8 9.2
1.7 4.1
5.3 79.0
2.7 6.8
17.0 18.5
33.727.11/
3.8
3.73
45.1
2005
5.3 4.9
2.0 19.1
2.0 19.0
4.1 0.1
3.8 32.8
9.3 1.7
5.3 24.2
(5.9) 3.8
2.5 3.1
6.8 48.1
7.3 8.7
5.6 16.8
13.6 5.3
5.3 4.7
7.5 8.3
3.0 4.4
4.8 78.3
1.6 6.3
(8.8) 17.6
4.0 7.7
7.0
6.4
55.1
DEVELOPMENT RESEARCH NEWS 3 January - February 2011
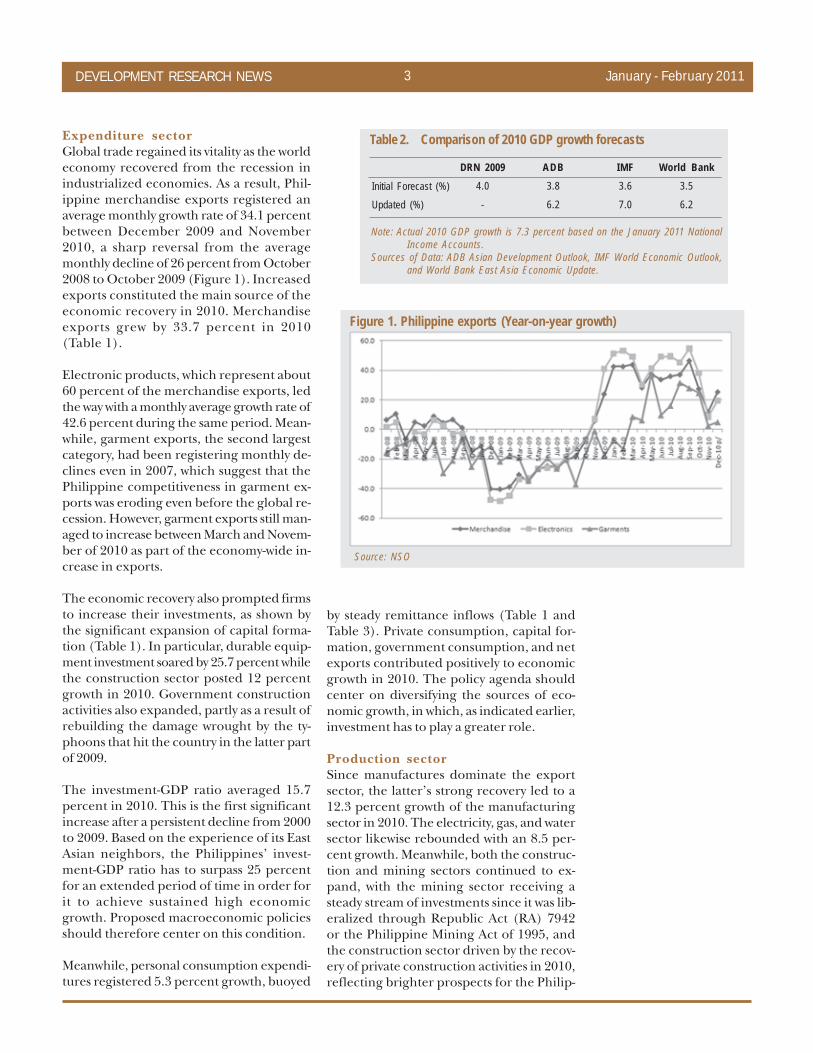
Expenditure sectorGlobal trade regained its vitality as the worldeconomy recovered from the recession inindustrialized economies. As a result, Phil-ippine merchandise exports registered anaverage monthly growth rate of 34.1 percentbetween December 2009 and November2010, a sharp reversal from the averagemonthly decline of 26 percent from October2008 to October 2009 (Figure 1). Increasedexports constituted the main source of theeconomic recovery in 2010. Merchandiseexports grew by 33.7 percent in 2010(Table 1).
Electronic products, which represent about60 percent of the merchandise exports, ledthe way with a monthly average growth rate of42.6 percent during the same period. Mean-while, garment exports, the second largestcategory, had been registering monthly de-clines even in 2007, which suggest that thePhilippine competitiveness in garment ex-ports was eroding even before the global re-cession. However, garment exports still man-aged to increase between March and Novem-ber of 2010 as part of the economy-wide in-crease in exports.
The economic recovery also prompted firmsto increase their investments, as shown bythe significant expansion of capital forma-tion (Table 1). In particular, durable equip-ment investment soared by 25.7 percent whilethe construction sector posted 12 percentgrowth in 2010. Government constructionactivities also expanded, partly as a result ofrebuilding the damage wrought by the ty-phoons that hit the country in the latter partof 2009.
The investment-GDP ratio averaged 15.7percent in 2010. This is the first significantincrease after a persistent decline from 2000to 2009. Based on the experience of its EastAsian neighbors, the Philippines’ invest-ment-GDP ratio has to surpass 25 percentfor an extended period of time in order forit to achieve sustained high economicgrowth. Proposed macroeconomic policiesshould therefore center on this condition.
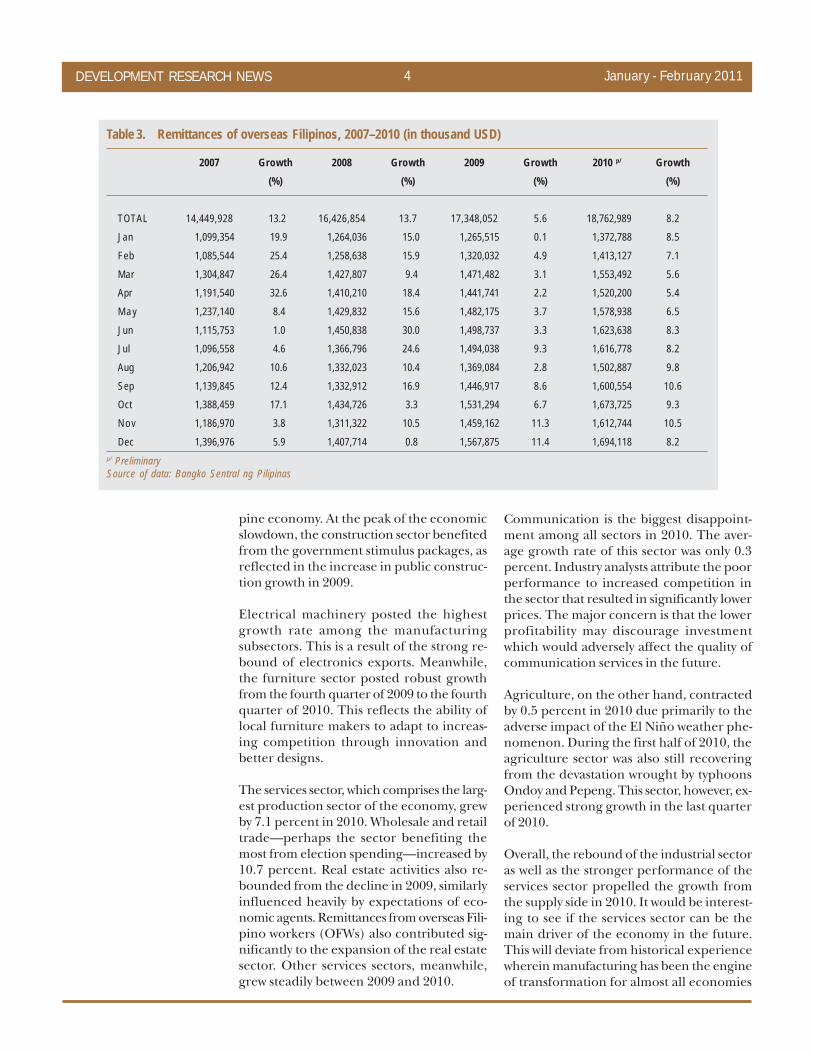
Meanwhile, personal consumption expendi-tures registered 5.3 percent growth, buoyed
by steady remittance inflows (Table 1 andTable 3). Private consumption, capital for-mation, government consumption, and netexports contributed positively to economicgrowth in 2010. The policy agenda shouldcenter on diversifying the sources of eco-nomic growth, in which, as indicated earlier,investment has to play a greater role.
Production sectorSince manufactures dominate the exportsector, the latter’s strong recovery led to a12.3 percent growth of the manufacturingsector in 2010. The electricity, gas, and watersector likewise rebounded with an 8.5 per-cent growth. Meanwhile, both the construc-tion and mining sectors continued to ex-pand, with the mining sector receiving asteady stream of investments since it was lib-eralized through Republic Act (RA) 7942or the Philippine Mining Act of 1995, andthe construction sector driven by the recov-ery of private construction activities in 2010,reflecting brighter prospects for the Philip-
Figure 1. Philippine exports (Year-on-year growth)
Source: NSO
Note: Actual 2010 GDP growth is 7.3 percent based on the January 2011 NationalIncome Accounts.
Sources of Data: ADB Asian Development Outlook, IMF World Economic Outlook,and World Bank East Asia Economic Update.
Initial Forecast (%)Updated (%)
DRN 20094.0
-
ADB3.8
6.2
IMF3.6
7.0
Table 2. Comparison of 2010 GDP growth forecasts
World Bank3.5
6.2
DEVELOPMENT RESEARCH NEWS January - February 20114
pine economy. At the peak of the economicslowdown, the construction sector benefitedfrom the government stimulus packages, asreflected in the increase in public construc-tion growth in 2009.
Electrical machinery posted the highestgrowth rate among the manufacturingsubsectors. This is a result of the strong re-bound of electronics exports. Meanwhile,the furniture sector posted robust growthfrom the fourth quarter of 2009 to the fourthquarter of 2010. This reflects the ability oflocal furniture makers to adapt to increas-ing competition through innovation andbetter designs.
The services sector, which comprises the larg-est production sector of the economy, grewby 7.1 percent in 2010. Wholesale and retailtrade—perhaps the sector benefiting themost from election spending—increased by10.7 percent. Real estate activities also re-bounded from the decline in 2009, similarlyinfluenced heavily by expectations of eco-nomic agents. Remittances from overseas Fili-pino workers (OFWs) also contributed sig-nificantly to the expansion of the real estatesector. Other services sectors, meanwhile,grew steadily between 2009 and 2010.
Communication is the biggest disappoint-ment among all sectors in 2010. The aver-age growth rate of this sector was only 0.3percent. Industry analysts attribute the poorperformance to increased competition inthe sector that resulted in significantly lowerprices. The major concern is that the lowerprofitability may discourage investmentwhich would adversely affect the quality ofcommunication services in the future.
Agriculture, on the other hand, contractedby 0.5 percent in 2010 due primarily to theadverse impact of the El Niño weather phe-nomenon. During the first half of 2010, theagriculture sector was also still recoveringfrom the devastation wrought by typhoonsOndoy and Pepeng. This sector, however, ex-perienced strong growth in the last quarterof 2010.
Overall, the rebound of the industrial sectoras well as the stronger performance of theservices sector propelled the growth fromthe supply side in 2010. It would be interest-ing to see if the services sector can be themain driver of the economy in the future.This will deviate from historical experiencewherein manufacturing has been the engineof transformation for almost all economies
TOTALJan
Feb
MarApr
M a y
JunJul
Aug
SepOct
Nov
Dec
2007
14,449,928 1,099,354
1,085,544
1,304,847 1,191,540
1,237,140
1,115,753 1,096,558
1,206,942
1,139,845 1,388,459
1,186,970
1,396,976
Growth(%)
13.2 19.9
25.4
26.4 32.6
8.4
1.0 4.6
10.6
12.4 17.1
3.8
5.9
2008
16,426,854 1,264,036
1,258,638
1,427,807 1,410,210
1,429,832
1,450,838 1,366,796
1,332,023
1,332,912 1,434,726
1,311,322
1,407,714
Growth(%)
13.7 15.0
15.9
9.4 18.4
15.6
30.0 24.6
10.4
16.9 3.3
10.5
0.8
2009
17,348,052 1,265,515
1,320,032
1,471,482 1,441,741
1,482,175
1,498,737 1,494,038
1,369,084
1,446,917 1,531,294
1,459,162
1,567,875
2010 p/
18,762,989 1,372,788
1,413,127
1,553,492 1,520,200
1,578,938
1,623,638 1,616,778
1,502,887
1,600,554 1,673,725
1,612,744
1,694,118
Growth(%)
8.28.5
7.1
5.65.4
6.5
8.38.2
9.8
10.69.3
10.5
8.2
Growth(%)
5.60.1
4.9
3.12.2
3.7
3.39.3
2.8
8.66.7
11.3
11.4
Table 3. Remittances of overseas Filipinos, 2007–2010 (in thousand USD)
p/ PreliminarySource of data: Bangko Sentral ng Pilipinas

DEVELOPMENT RESEARCH NEWS 5 January - February 2011
in the world. The government needs to ad-dress this issue after the necessary back-ground studies have been made.
EmploymentThe unemployment rate was generally lowerin 2010 compared to 2009. Election-relatedactivities contributed to the decline of theunemployment rate to 7.3 percent in the firstquarter of 2010, compared with the 7.7 per-cent level in the previous year. However, inthe second quarter of 2010, unemploymentincreased to 8.0 percent compared with 7.5percent during the same period in 2009. Itwas not until the third quarter of 2010 thatthe employment sector overcame the effectsof the crisis, with the unemployment rate de-clining to 6.9 percent from 7.6 percent ofthe same period in the previous year (Table4). Underemployment, on the other hand,showed some improvement in the middlequarters and was steady in the last quarter.
The data on labor turnover rates reveal thedynamics and details of job creation and joblosses (Table 5). Labor turnover rate is thedifference between the hiring rate and theseparation rate. As defined in the Labor Turn-over Survey of the Bureau of Labor and Em-ployment Statistics (BLES), hiring rate re-fers to the total additions to employmentduring the quarter divided by the total em-ployment. Separation rate, on the otherhand, is the total number of separations orterminations of employment that occurredduring the period, divided by the total em-ployment. The figures are reported on aquarterly basis and refer to large enterprisesin Metro Manila.
In the first quarter of 2010, the hiring rateincreased marginally to 10.2 percent, from9.3 percent in the first quarter of 2009. At
the same time, however, the separation ratealso increased to 11.1 percent as comparedwith 9.0 percent a year ago. As such, the la-bor turnover rate was -0.9 percent. This wasthe only time, though, that the labor turn-over rate turned negative in the period be-tween the first quarter of 2009 and the sec-ond quarter of 2010. This is consistent withthe observation that the Philippine economywas not severely affected by the 2008 crisis.One reason perhaps is that the governmentwas able to put in place active labor marketinterventions in terms of job creation, skillstraining, and employment services. A con-crete example of these interventions is theComprehensive Livelihood and EmergencyEmployment Program (CLEEP), which wasimplemented “to protect the most vulner-able sectors (poor, hungry, returning expa-
Unemployment
Underemployment
Jan
7.7
18.2
Apr7.5
18.9
Jul7.6
19.8
Oct
7.1
19.4
Jan
7.3
19.7
Apr
8
17.8
Jul
6.9
17.9
Oct
7.1 /p
19.6 /p
Table 4: Employment status
Source: BLESNote: p/ Estimates for October 2010 are preliminary and may change
2009 2010
Election-related activities contributed to the decline of the unemployment rate inthe first quarter of 2010. Photo: Jamila Bracamonte

DEVELOPMENT RESEARCH NEWS January - February 20116
SECTOR
All Sectoral Groups
Agriculture, Fishery, and ForestryAgriculture, Hunting, and Forestry
Fishing
IndustryMining and Quarrying
Manufacturing
Electricity, Gas, and Water SupplyConstruction
Services
Wholesale and Retail Trade andRelated Services
Hotels and Restaurants
Transport, Storage, andCommunications
Financial Intermediation
Real Estate, Renting, and BusinessActivities
Private Education Services
Health and Social Work (Private)Other Community, Social, and
Personal Service Activities
3RD QUARTER
AccessionRate
9.29
3.643.22
4.04
13.4117
9.82
3.0523.16
8.13
16.69
9.09
3.26
2.9
7.82
1
4.95
12.25
SeparationRate
9.02
1.572.09
1.07
10.0214.63
11.2
3.578.19
8.8
16.38
5.76
4.88
3.25
9.61
1.28
3.74
11.61
PercentDifference
0.27
2.071.13
2.97
3.392.37
-1.38
-0.5314.98
-0.67
0.31
3.33
-1.63
-0.36
-1.79
-0.28
1.21
0.64
AccessionRate
9.74
3.212.76
3.57
14.6719.31
12.73
3.721.88
8.33
10.26
10.66
3.63
3.62
10.76
10.4
4.45
15.23
SeparationRate
7.53
4.533.13
5.64
10.812.23
10.49
2.0513.55
6.58
9.65
8.68
3.42
2.85
7.92
5.97
5.17
6.96
PercentDifference
2.21
-1.32-0.37
-2.07
3.877.08
2.24
1.658.33
1.75
0.61
1.98
0.21
0.78
2.84
4.42
-0.72
8.28
AccessionRate
9.99
7.359.96
5.07
13.9315.98
12.32
2.3221.1
8.89
9.74
8.99
4.29
2.6
11.79
2.57
5.5
15.09
SeparationRate
9.62
5.877.31
4.62
14.8514.46
12.22
1.7325.6
8.16
1.39
6.22
3.62
2.78
11.16
1.69
3.95
13.02
PercentDifference
0.37
1.482.65
0.45
-0.921.52
0.1
0.58-4.5
0.72
2.52
2.76
0.67
-0.17
0.63
0.88
1.55
2.06
1ST QUARTER
Table 5a: Statistics on labor turnover rates in large enterprises in Metro Manila by industry, 2009 (in %)
Notes: Details may not add up to total due to rounding of figures
2ND QUARTER
triates, workers in the export industry, out-of-school youth) from the threats and conse-quences of reduced or lost income as a con-sequence of the global economic crisis.”
The manufacturing sector, the sector hard-est hit by the crisis, experienced an increasein its separation rate to 24.5 percent in thefirst quarter of 2010, from the 11.2 percentmark in 2009. The labor turnover rate for thissector in the first quarter of 2010 was -6.41percent, marking the third time in the pastfive quarters that the number for this sectorturned negative. In the second quarter of2010, the turnover rate for the manufactur-ing sector turned positive. The constructionsector, however, recorded a -8.1 percent netturnover rate for the period, as the separation
rate increased for this sector to 17.5 percentfrom 13.6 percent rate a year ago (Table 5).
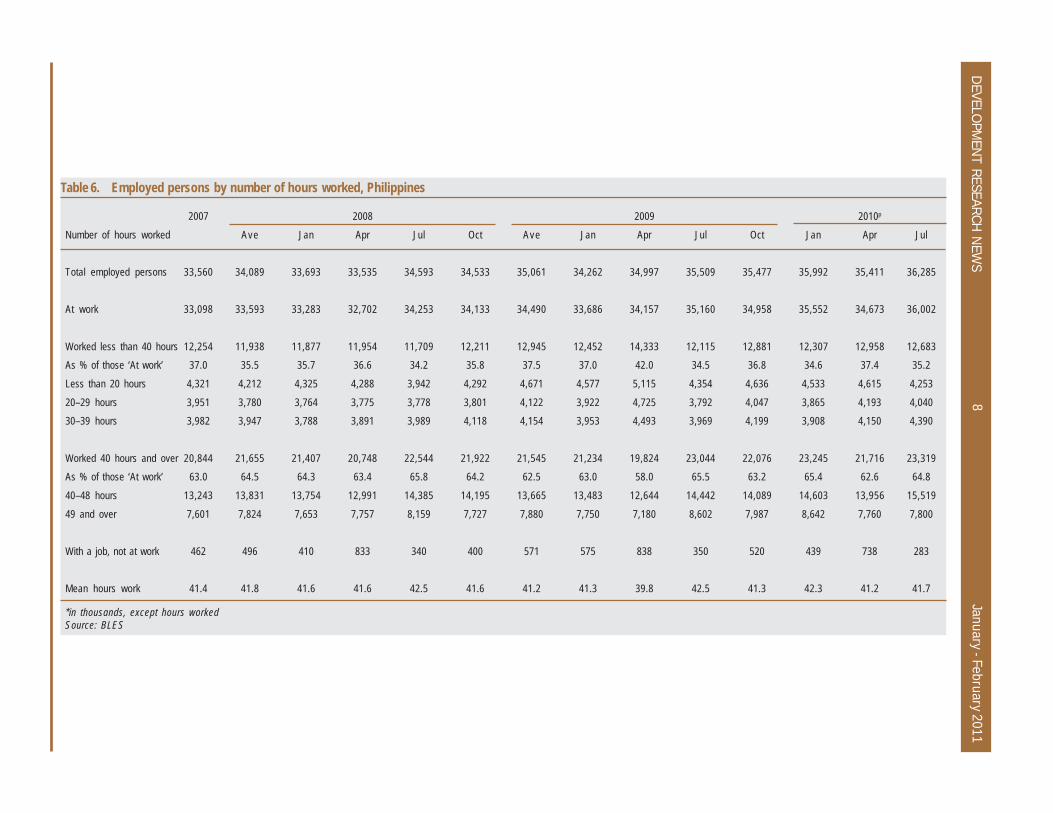
In terms of the quality of employment, theBLES data show that for the first quarter of2010, the proportion of those who worked“full-time” increased to 65.4 percent, from63.0 percent in the same period in 2009. Thisis also higher than the rate in the first quar-ter of 2008, which was 64.3 percent (Table6). In the second quarter of 2010, althoughthe ratio of full-time workers increased to62.6 percent from the 58 percent ratio of thesecond quarter of 2009, this ratio was mar-ginally lower than the ratio for the secondquarter of 2008, which was 63.4 percent. Inthe third quarter of 2010, meanwhile, theproportion of full-time workers reached 64.8

DEVELOPMENT RESEARCH NEWS 7 January - February 2011
percent, almost the same ratio as that of thesame period of 2008 (Table 6).
From the data on unemployment rate andfull-time employment, it can be concludedthat the recession still had residual effectsuntil the second quarter of 2010. The firstquarter of 2010, on the other hand, appearsto have benefitted from election-related ac-tivities.
Inflation, interest rates, and assetpricesInterest rates had shown a general declinein response to the looser policy stance of theBangko Sentral ng Pilipinas (BSP) whichstarted to cut policy rates on December 18,2008 that reached a cumulative total of 200
SECTOR
All Sectoral Groups
Agriculture, Fishery, and ForestryAgriculture, Hunting, and Forestry
Fishing
IndustryMining and Quarrying
Manufacturing
Electricity, Gas, and Water SupplyConstruction
Services
Wholesale and Retail Trade andRelated Services
Hotels and Restaurants
Transport, Storage, andCommunications
Financial Intermediation
Real Estate, Renting, and BusinessActivities
Private Education Services
Health and Social Work (Private)Other Community, Social, and
Personal Service Activities
3RD QUARTER
AccessionRate
10.23
4.942.71
5.63
14.7523.94
18.11
3.105.07
9.07
6.42
7.41
4.45
1.26
15.46
1.67
5.13
9.59
SeparationRate
11.11
4.821.61
5.80
19.669.92
24.52
3.238.12
8.88
8.32
9.83
3.32
2.88
13.60
2.38
5.96
9.64
PercentDifference
-0.88
0.121.10
-0.18
-0.4914.02
-6.41
-0.13-3.05
0.19
-1.90
-2.42
1.13
-1.62
1.86
-0.71
-0.82
-0.06
AccessionRate
13.52
5.161.61
6.13
14.2021.62
16.11
2.779.42
13.42
8.78
12.26
5.58
3.22
21.74
9.69
6.11
10.50
SeparationRate
10.66
4.350.99
5.26
15.1616.05
15.01
1.7717.51
9.72
7.17
12.99
4.11
2.36
15.15
7.40
4.96
8.89
PercentDifference
2.86
0.810.62
0.86
-0.975.57
1.10
1.00-8.09
3.70
1.61
-0.73
1.47
0.86
6.59
2.30
1.14
1.63
AccessionRate
12.11
5.115.01
5.15
16.3420.32
16.35
2.2617.91
11.25
8.48
13.01
6.05
3.66
17.02
5.42
5.89
9.79
SeparationRate
7.88
6.926.51
7.07
12.4324.24
13.71
1.239.13
6.92
6.30
10.98
3.57
2.87
9.61
2.42
4.20
8.74
PercentDifference
4.22
-1.81-1.51
-1.91
3.91-3.91
2.64
1.038.78
4.33
2.18
2.02
2.47
0.79
7.41
3.00
1.69
1.06
1ST QUARTER
Table 5b: Statistics on labor turnover rates in large enterprises in Metro Manila by industry, 2010 (in %)
2ND QUARTER
Source: BLES
basis points (Table 7). Based on BSP defini-tion, repurchase (RP) rate refers to the ratewhen BSP uses its RP facility to lend to banksto accommodate their temporary liquidity re-quirements. Reverse repurchase (RRP) rate,on the other hand, refers to the interest rateapplied when BSP is allowed to siphon offliquidity from the banking system on a rela-tively temporary basis. As of September 2010,when the rates for the RP and RRP facilitiesstood at 6.0 percent and 4.0 percent, respec-tively, the average lending rate stood at 7.5percent and T-bills rate at 4.3 percent.
The relatively subdued inflation—which av-eraged 3.8 percent in 2010—indicates thata relatively loose monetary policy can be main-tained for the time being.
DEVELO
PMENT RESEARCH
NEWS
January - February 20118
Number of hours worked
Total employed persons
At work
Worked less than 40 hoursAs % of those ‘At work’
Less than 20 hours
20–29 hours30–39 hours
Worked 40 hours and overAs % of those ‘At work’
40–48 hours
49 and over
With a job, not at work
Mean hours work
2007
33,560
33,098
12,25437.0
4,321
3,9513,982
20,84463.0
13,243
7,601
462
41.4
Ave
34,089
33,593
11,93835.5
4,212
3,7803,947
21,65564.5
13,831
7,824
496
41.8
Jan
33,693
33,283
11,87735.7
4,325
3,7643,788
21,40764.3
13,754
7,653
410
41.6
Apr
33,535
32,702
11,95436.6
4,288
3,7753,891
20,74863.4
12,991
7,757
833
41.6
Jul
34,593
34,253
11,70934.2
3,942
3,7783,989
22,54465.8
14,385
8,159
340
42.5
Oct
34,533
34,133
12,21135.8
4,292
3,8014,118
21,92264.2
14,195
7,727
400
41.6
Ave
35,061
34,490
12,94537.5
4,671
4,1224,154
21,54562.5
13,665
7,880
571
41.2
Jan
34,262
33,686
12,45237.0
4,577
3,9223,953
21,23463.0
13,483
7,750
575
41.3
Apr
34,997
34,157
14,33342.0
5,115
4,7254,493
19,82458.0
12,644
7,180
838
39.8
Jul
35,509
35,160
12,11534.5
4,354
3,7923,969
23,04465.5
14,442
8,602
350
42.5
Oct
35,477
34,958
12,88136.8
4,636
4,0474,199
22,07663.2
14,089
7,987
520
41.3
Jan
35,992
35,552
12,30734.6
4,533
3,8653,908
23,24565.4
14,603
8,642
439
42.3
Apr
35,411
34,673
12,95837.4
4,615
4,1934,150
21,71662.6
13,956
7,760
738
41.2
Jul
36,285
36,002
12,68335.2
4,253
4,0404,390
23,31964.8
15,519
7,800
283
41.7
2008 2009 2010p
Table 6. Employed persons by number of hours worked, Philippines
*in thousands, except hours workedSource: BLES

DEVELOPMENT RESEARCH NEWS 9 January - February 2011
Table 7: Interest rates
2008
2009
2010
Jan
Feb
MarApr
M a y
JunJul
Aug
SepOct
Nov
Dec
Jan
FebMar
Apr
M a yJun
Jul
AugSep
Oct
NovDec
JanFeb
Mar
AprM a y
Jun
JulAug
Sep
OctNov
Dec
T-bills (All
Maturities)
6.45.0
5.3
N.T.5.9
6.9
6.76.4
6.9
6.66.4
6.8
6.34.5
5.0
4.64.7
4.5
4.54.6
4.3
4.24.3
4.2
4.34.3
4.0
4.24.3
4.2
4.14.1
4.2
4.34.3
4.3
4.12.9
1.89
Average Lending
Rate8.8
8.6
8.28.5
7.8
8.58.5
8.6
9.09.1
9.5
9.49.3
8.5
10.28.6
9.5
8.68.6
8.4
8.67.0
8.5
8.67.9
8.2
N.A.8.0
7.6
8.07.7
7.8
7.77.7
7.7
7.57.8
7.2
N.A.
RP
7.8
N.T.
7.0N.T.
N.T.
N.T.N.T.
N.T.
N.T.N.T.
8.0
8.08.0
6.6
N.T.N.T.
6.86.8
N.T.
N.T.6.3
N.T.
N.T.N.T.
6.0
N.T.6.0
6.0
N.T.N.T.
N.T.
N.T.N.T.
N.T.
N.T.N.T.
N.T.
N.T.N.T.
RRP
5.4
5.2
5.05.0
5.0
5.05.2
5.5
5.86.0
6.0
6.05.9
4.4
5.55.0
4.8
4.64.5
4.3
4.14.0
4.0
4.04.0
4.0
4.04.0
4.0
4.04.0
4.0
4.04.0
4.0
4.04.0
4.0
4.0
Source: BSP, NSCB* N.T. - No transaction; N.A. -Not available

DEVELOPMENT RESEARCH NEWS January - February 201110
The Philippine stock market reflected thedevelopments in the global economy. Afterthe subprime crisis erupted in the UnitedStates (US), the Philippine stock exchangeindex (PSEi) fell sharply and bottomed inthe first quarter of 2009 (Figure 2). But itstaged a strong recovery thereafter, reachinga historical high of 4,397.30 on November 4,2010. Apart from the global economic recov-ery, the Philippine stock market, along withthose of other emerging market economies,benefited from a surge in capital inflows.
Meanwhile, the exchange rate appreciatedby an average of 5.5 percent in 2010. This isa phenomenon across emerging markets asthey cope with the quantitative easing in theUS. In case currencies appreciate too sharply,though, regional monetary cooperationwould be required since measures at the in-
dividual country level to counter unwar-ranted appreciation are difficult to imple-ment. For the Philippine peso, for instance,while its appreciation has been relativelymild compared with other economies in EastAsia, it should be noted that the BSP none-theless has limited resources to intervene inthe foreign exchange market in case the situ-ation would warrant it.
Global economic outlookRecovery from the global recession in 2009 wasfairly robust. World economic output is esti-mated to have expanded by 5 percent in 2010after contracting by 0.6 percent in the previ-ous year (Table 8). Timely stimulus packages,especially in the advanced economies, andappropriate policy responses to the fiscal andfinancial crises in the periphery of the euroarea contributed significantly to the recovery.
Figure 2. Philippine stock exchange index
Source: PSE
Table 8: Global economic outlook (output growth in percent)
WorldUS
Japan
Euro ZoneChina
2008
2.8
0.0-1.2
0.5
9.6
2009
-0.6
-2.6-6.3
-4.1
9.2
2010
5.0
2.84.3
1.8
10.3
2011 a
4.3
2.91.8
1.3
9.6
2011 b
4.2
2.31.5
1.5
9.6
2011 c
4.4
3.01.6
1.5
9.6
2012
4.5
2.71.8
1.7
9.5
Notes: a - July 2010 forecast b - October 2010 forecast c - January 2011 forecastSource: IMF World Economic Outlook Update, January 25, 2011.
DEVELOPMENT RESEARCH NEWS 11 January - February 2011
In the US and Japan, private consumptionexpenditure has responded to the stimuluspackages while growth in domestic demandin Germany offset the slowdown in the pe-riphery of the euro area. Stronger-than-ex-pected economic growth in 2010 has led tobetter prospects for 2011. Forecasts were ini-tially downgraded in October 2010 but wererevised upward in January 2011 (Table 8).Nevertheless, it is only the US where outputgrowth in 2011 is predicted to be higher thanin 2010.
One reason growth is expected to pick upin the US is the second round of quantita-tive easing (QE2), wherein the Federal Re-serve will purchase $600 billion in longer-dated US Treasuries from November 2010to June 2011. The injection of liquidity isexpected to lower both nominal and reallong-term interest rates. This will then en-courage both consumption and investmentexpenditures. The larger supply of US dol-lars will also weaken the currency providinga boost to exports. However, the US economyis still fragile with a high unemployment rateand lingering uncertainty with regard to theforeclosure process in the housing market.The resulting balance sheet problems onhouseholds will continue to be a drag on eco-nomic growth and GDP growth in 2012 isexpected to be lower than in 2011.
In Japan, the sharp appreciation of the yenhas adversely affected net exports. Moreover,increased consumption demand in 2010 waslargely a result of frontloading of expendi-tures in anticipation of an increase in ciga-rette taxes and the phasing out of the gov-ernment subsidy for fuel-efficient cars. Ag-gregate demand is also constrained by thegeneral deflationary trend, as economicagents delay expenditures in anticipation oflower prices. Output growth in 2011 and2012 is projected to be less than half of thegrowth rate in 2010.
The euro area has the greatest downside risksin terms of output growth. Countries at theperiphery are still struggling with sovereigndebt issues and there is therefore little fiscalspace to support expansion. The IMF alsoexplains that “the risk of financial turmoilspreading from the periphery to the core of
Europe is a by-product of continuing weak-ness among financial institutions in many ofthe region’s advanced economies, and a lackof transparency about their exposures. As aresult, financial institutions and sovereignsare closely linked, with spillovers betweenthe two sectors occurring in both directions.”
Economic growth in 2011 and 2012 is ex-pected to be lower than in 2010 as advancedeconomies continue to consolidate their fis-cal positions and address vulnerabilities.Meanwhile, China is expected to continuewith its rapid economic expansion. In 2010,China overtook Japan to become the secondlargest economy in the world.
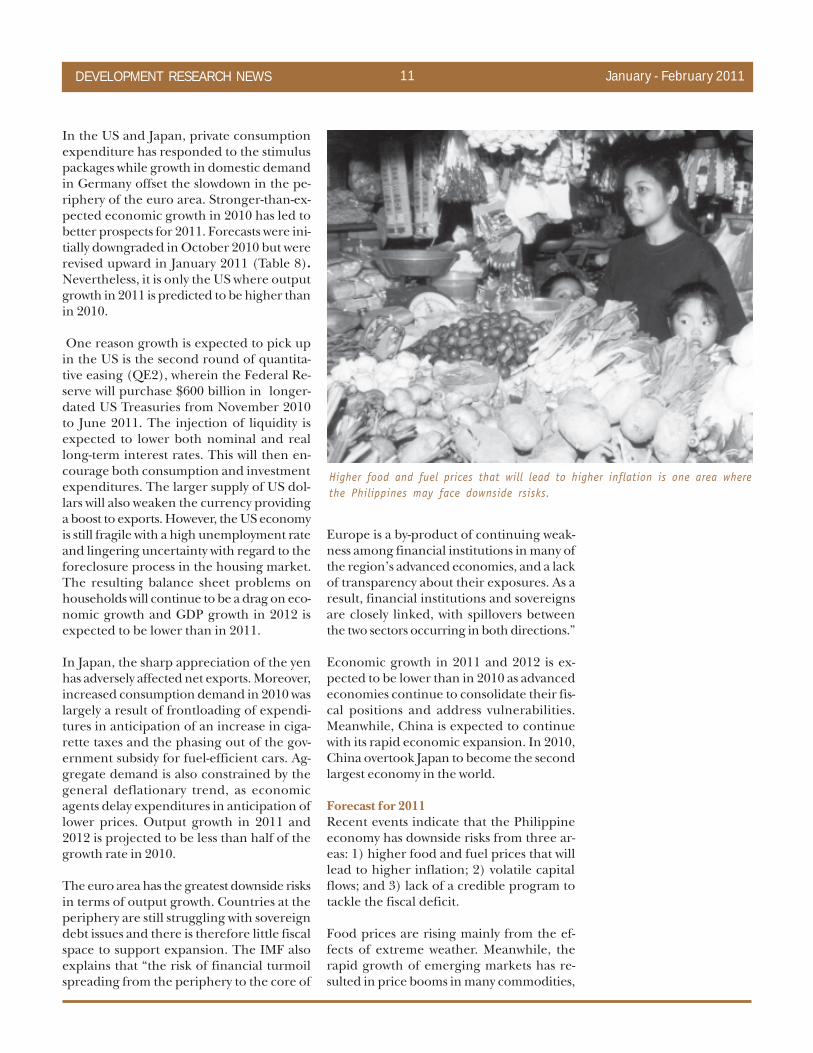
Forecast for 2011Recent events indicate that the Philippineeconomy has downside risks from three ar-eas: 1) higher food and fuel prices that willlead to higher inflation; 2) volatile capitalflows; and 3) lack of a credible program totackle the fiscal deficit.
Food prices are rising mainly from the ef-fects of extreme weather. Meanwhile, therapid growth of emerging markets has re-sulted in price booms in many commodities,
Higher food and fuel prices that will lead to higher inflation is one area wherethe Philippines may face downside rsisks.
DEVELOPMENT RESEARCH NEWS January - February 201112
including fuel. The latter has also been re-acting to events in the Middle East. In 2009,the United Nations Conference on Tradeand Development (UNCTAD) criticizedwhat it described as the financialization ofcommodity markets wherein excess globalliquidity led to speculation in commodities,including those considered as basic. Hence,QE2 in the US may have also contributed torising global inflation.
Inflation in January 2011 was recorded at 3.5percent which is lower than the figure a yearago, which was 4.3 percent. However, a turn-around is expected soon as the relatively lowinflation in the first quarter of 2011 is due tothe high base last year. For 2011, inflation isforecast at 4 percent, higher than the aver-age of 3.8 percent in 2010.
As of February 2011, the stock index has beenon a downward trend (Figure 2). The aver-age exchange rate in the first 45 days of 2011was 44.06, which is higher than the 43.96 av-erage in December of 2010. The reversal inthe stock prices and exchange rate from thetrend in the last few months of 2010 is evi-dence of the volatility of international capi-tal flows. Addressing this volatility may ham-per the BSP’s ability to effectively implementits inflation targeting program.
A major reason for the relatively low invest-ment rate in the Philippines is the lack offiscal space that would enable policymakersto address supply side constraints. The pri-mary example of a supply side constraint ispoor physical infrastructure. Recently, thegovernment launched the Public-PrivatePartnership (PPP) program. Through thiscontractual arrangement, the private sectorcan provide financial support and expertisein implementing government projects moreefficiently while the government can focus
on its core responsibilities such as projectprioritization.
However, significant reforms in tax adminis-tration are still required to generate ad-equate resources that will help address thesupply-side constraints. This strategy re-quires a great deal of institutional strength-ening and political will. The new Presidentwon handily on an election campaign an-chored on anticorruption. He should thususe the strong mandate to implement toughreform measures. In the medium term, pov-erty alleviation will be the main focus of eco-nomic programs. The higher poverty inci-dence in 2006 and 2009 compared with 2003should be a major cause of concern. This is-sue is discussed in more detail in Box 1.
Given the downside risks and the absence ofelection spending this year, GDP growth willbe lower in 2011 compared to 2010. How-ever, there will be a recovery in the agricul-ture sector and manufacturing growth willremain robust due to external demand. Foodmanufacturing should experience highergrowth in 2011 due to the better perfor-mance of the agriculture sector. Remittanceswill continue to provide a steady source ofincome, which will contribute to slightlyhigher growth in consumption. There willbe a marked slowdown in the services sector,mainly due to the “election effect.” Thegrowth rate is expected to drop to 5.7 per-cent in 2011 compared to 7.1 percent in2010.
Finally, the overall GDP growth is forecast at5.9 percent in 2011. This is lower than thetarget of the National Economic and Devel-opment Authority (NEDA) which is 7–8 per-cent but higher than the forecasts of IMF,Asian Development Bank, and the WorldBank.
Given the downside risks and the absence of election spending this year, GDP growth will be lower in2011 compared to 2010. However, there will be a recovery in the agriculture sector and manufacturinggrowth will remain robust due to external demand. Food manufacturing should experience highergrowth in 2011 due to the better performance of the agriculture sector. Remittances will continue toprovide a steady source of income, which will contribute to slightly higher growth in consumption.
DRN

DEVELOPMENT RESEARCH NEWS 13 January - February 2011
Box 1. Poverty and economic growth
Poverty incidence in the Philippines has been continuously rising in recent years.The 2009 official estimates of the National Statistical Coordination Board (NSCB)
put the poverty headcount ratio at 26.5 percent, higher than that of 2006 (26.4%),and 2003 (24.9%).1 This represents a major setback in the country’s effort to reducepoverty as part of its commitments in the Millennium Development Goals (MDGs).
The rise in the poverty rate, particularly between 2003 and 2006, was decomposedby Reyes et al. (2010) to determine which factor—growth or redistribution—led to thepoverty rate increase. The growth component refers to the change, in percentagepoints, in the poverty rate that is attributed to changes in the mean income whileholding the income distribution constant. The redistribution component, on the otherhand, refers to the change in the poverty rate that is attributed to changes in theincome distribution while holding the mean income constant. The study found thatthe rise in the poverty rate was due to the combined effects of the lack of real growthand worsening income distribution, with the growth component being the more domi-nant of the two factors.
Table B1 shows the results of the decomposition analysis. The main focus is for theperiod 2003 to 2006 when the poverty rate rose by 2.847 percentage points. It isshown that the change in poverty incidence of 2.849 points came from a growthcomponent of 2.388, a redistribution component of 0.343, and an interaction term of0.118, which accounts for the changes not exclusively attributable to either of thetwo factors. Three main points arise from this result. First is that real income did notgrow but instead shrank and therefore contributed to the increase in poverty rate.
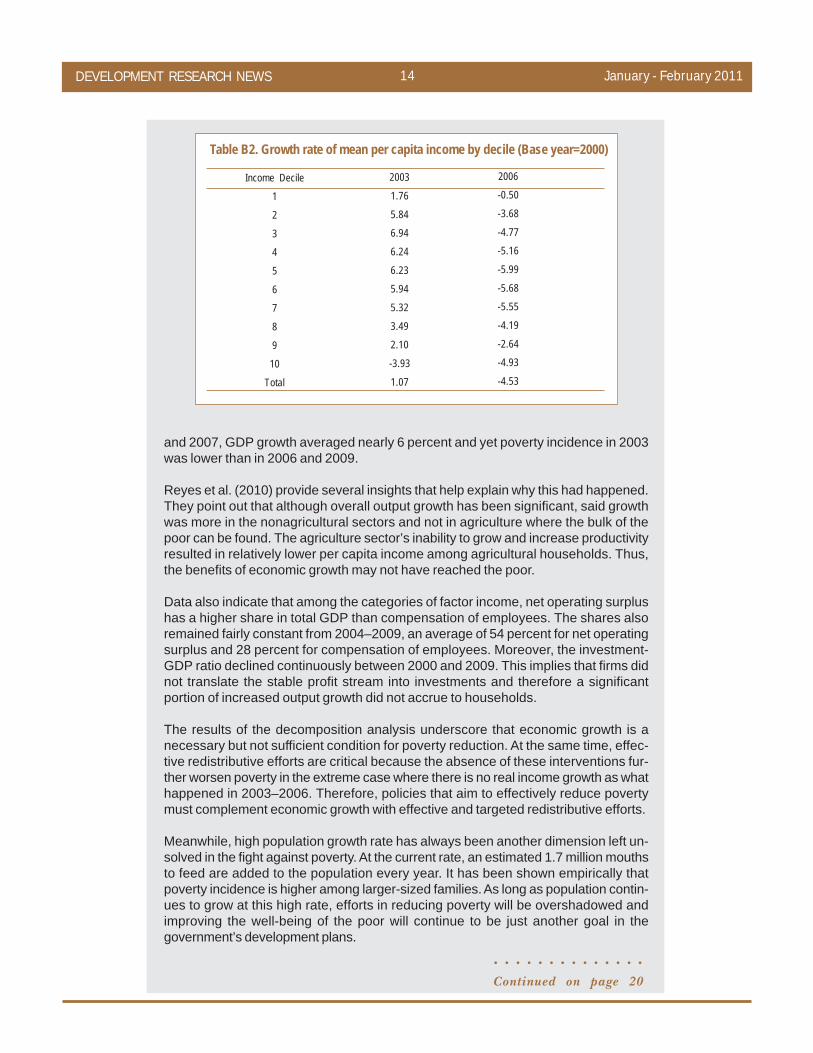
Table B2 shows that the mean income in all deciles declined between 2003 and2006. On average, the mean per capita income of the population went down by 4.53percent. Second, income distribution changed in a way that left the poor worse off.Lastly, between the two factors, the lack of growth was the dominant factor that ledto the poverty increase in 2006.
These results are rather intriguing because the National Income Accounts data showedthat between 2003 and 2006, real GDP grew by 5.4 percent annually. Between 2004
Period
2000–20032003–2006
2000–2006
Change in
Poverty Incidence
-3.0522.849
-0.203
Growth
component
-0.5732.388
1.719
Redistribution
component
-2.5750.343
-2.057
Interaction
component
0.0960.118
0.135
Table B1. Decomposition of poverty by component, 2000–2006 a/
a/ Real income data are based on 2000 prices; uses the old methodology of poverty estimation butnevertheless has the same trend as that of the new estimatesSource of basic data: FamilyIncome and Expenditure Survey (FIES), National Statistics Office
1 These refer to new estimates released by the NSCB using the improved methodology on poverty measurement.The old series has a trend that is similar to this. In the decomposition analysis of poverty discussed in this Box,the old poverty estimation methodology was used.
DEVELOPMENT RESEARCH NEWS January - February 201114
and 2007, GDP growth averaged nearly 6 percent and yet poverty incidence in 2003was lower than in 2006 and 2009.
Reyes et al. (2010) provide several insights that help explain why this had happened.They point out that although overall output growth has been significant, said growthwas more in the nonagricultural sectors and not in agriculture where the bulk of thepoor can be found. The agriculture sector’s inability to grow and increase productivityresulted in relatively lower per capita income among agricultural households. Thus,the benefits of economic growth may not have reached the poor.
Data also indicate that among the categories of factor income, net operating surplushas a higher share in total GDP than compensation of employees. The shares alsoremained fairly constant from 2004–2009, an average of 54 percent for net operatingsurplus and 28 percent for compensation of employees. Moreover, the investment-GDP ratio declined continuously between 2000 and 2009. This implies that firms didnot translate the stable profit stream into investments and therefore a significantportion of increased output growth did not accrue to households.
The results of the decomposition analysis underscore that economic growth is anecessary but not sufficient condition for poverty reduction. At the same time, effec-tive redistributive efforts are critical because the absence of these interventions fur-ther worsen poverty in the extreme case where there is no real income growth as whathappened in 2003–2006. Therefore, policies that aim to effectively reduce povertymust complement economic growth with effective and targeted redistributive efforts.
Meanwhile, high population growth rate has always been another dimension left un-solved in the fight against poverty. At the current rate, an estimated 1.7 million mouthsto feed are added to the population every year. It has been shown empirically thatpoverty incidence is higher among larger-sized families. As long as population contin-ues to grow at this high rate, efforts in reducing poverty will be overshadowed andimproving the well-being of the poor will continue to be just another goal in thegovernment’s development plans.
Table B2. Growth rate of mean per capita income by decile (Base year=2000)
Income Decile1
2
34
5
67
8
910
Total
2003
1.76
5.846.94
6.24
6.235.94
5.32
3.492.10
-3.93
1.07
2006-0.50
-3.68
-4.77-5.16
-5.99
-5.68-5.55
-4.19
-2.64-4.93
-4.53
○ ○ ○ ○ ○ ○ ○ ○ ○ ○ ○ ○ ○ ○
Continued on page 20

DEVELOPMENT RESEARCH NEWS 15 January - February 2011
Financing development in a postcrisis world
How could the world community fi-nance development in a milieumuch scarred by the Global Finan-
cial Crisis? Many papers on this concern werepresented in the 12th annual conference ofthe Global Development Network (GDN)held at Bogota, Colombia.
The Universidad de los Andes hosted theconference which lasted from January 13–15, 2011, with President Juan Manuel Santosof Colombia and former President ErnestoZedillo of Mexico formally opening the event.The gathering also honored winners of itsannual competition on research and devel-opment projects.
“Innovation is needed and options are onthe table to help make the financial systemwork for development…We need to under-stand clearly the feasibility of the proposals,”stated Gerardo della Paolera, GDN Presi-dent, and George Mavrotas, GDN ChiefEconomist, in their opinion piece.
Discussions took off from the following back-drop. While the worst of the Global Reces-sion had passed, the crisis left many nationsin a deep bind. Enormous deficit spendingmorphed into a debt burden for the westernworld. As such, many donors could not fulfilltheir aid commitments. Flows of externalcapital were very volatile, and they tended toconcentrate on certain emerging markets.
By Dennis M. Arroyo*
Remittances and private capital flows werefalling for some nations. The developmentfinance system had become more complex:donors proliferated, and a new group of do-nors with new aid modalities emerged. Frag-mentation problems also remained in theaid scene.
How then could the nations of the world fi-nance development in this setting? How*Dennis M. Arroyo is a Fellow at the Social Weather Stations.
The 12th Annual Conference of the Global Development Network (GDN) was heldat Bogota, Colombia on 13–15 January 2011. Attending the Opening Ceremonyare (L-R): Colombian Finance Minister Juan Carlos Echeverry; GDN Board of Direc-tors Chairman Ernesto Zedillo; Colombian President H.E. Juan Manuel Santos;Universidad de los Andes Colombia President Carlos Argulo Galvis; and GDN PresidentGerardo della Paolera. Source: www.gdnet.org.

DEVELOPMENT RESEARCH NEWS January - February 201116
could they still support the Millennium De-velopment Goals (MDGs)? The GDN Con-ference thus scanned the environment andlooked into various problems and solutions.What follows is a tour of the issues discussed.
Rich supply of finance, but recklesslendingTake the issue of supply of finance—that initself is not a problem. According to FrancoisBourguignon, Director of the Paris Schoolof Economics, financing has become widelyavailable for the developing world over thepast few years. The main concern now washow to allocate it: find the most appropriatefinance scheme to get nations to avoid thepoverty trap and to maximize their social re-turn.
Indeed, the rich supply of finance could beproblematic in its own way. Asli Demirguc-Kunt of the World Bank deplored the phe-nomenon of reckless expansion of access tofinancing. An “important lesson from therecent crisis,” she noted, was that “irrespon-sible expansion of access can be very costly.”For the sake of sustainability, the State mustformulate and enforce regulation, sheadded.
The international financial institutions(IFIs) in turn would be crucial in the regula-tion and sustainability of the financial sys-
tem. Roberto Steiner, Director ofFedesarrollo in Colombia, said that devel-oped nations should comply more strictlywith the rules set by the IFIs.
Foreign aid still mattersAn issue related to supply was official devel-opment assistance (ODA) or foreign aid.Was aid fading away in importance, dwarfedby other financial flows? Not quite in theAsian case, according to Prof. Kaoru Hayashiof Bunkyo University, Japan. Speaking in thesession handled by the East Asia Develop-ment Network, he noted that aid had lost itssignificance only in a few nations like Thai-land and Malaysia. The importance of ODAin Asia differed according to the level of de-velopment of the recipient countries. Aidwas much needed in Vietnam, Laos and Cam-bodia. To a lesser degree, it was still neededin the Philippines and Indonesia. Hayashielaborated on the subject via his model ofhow countries graduated from aid.
Aid is really about geopoliticsThe economists in the conference benefit-ted from a political perspective on the issue.Prof. Helen Milner of Princeton probedODA through the lenses of geopolitics. Shestressed that aid was an integral part of coun-tries’ foreign policy. For example, France andJapan remitted the most aid to former Afri-can colonies and to Asia due to their geopo-litical interests.
Changes in the global political arena werenow transforming aid, she reported. An ‘in-ternational aid regime’ was created by the‘traditional donors’ (USA, Japan, WesternEurope) during the last two decades viaagreements such as the DAC principles, theParis Declaration, the Monterrey Consensus,the MDGs, and the Accra Agenda. But newdonors emerged like China, Brazil, and In-dia, and they did not seem to comply withthese guidelines.
Another speaker challenged the stereotypeof the emerging donors. “Emerging donorshave tended to be portrayed as blatant, unre-strained seekers after their own short-terminterests, in stark contrast to traditional do-nors who have elaborated an edifice of insti-tutional self-restraint,” noted Jin Sato of theUniversity of Tokyo. However, he found that
Was aid fading away in importance, dwarfed by other financial flows? Not quitein the Asian case, according to Prof. Kaoru Hayashi of Bunkyo Univers ity,Japan. Photo: Ma. Aileen Garcia
DEVELOPMENT RESEARCH NEWS 17 January - February 2011
the new donors bore many similarities withthe old ones. And from the point of view ofthe recipients, the emerging set providedhealthy competition to the traditional do-nors.
Getting creative in raising fundsDespite the ample supply of finance, creativemeasures were mentioned for raising morefunds for development. Ernest Aryeetey ofthe University of Ghana discussed a menu ofinnovative options.
An environmental tax to address the truecosts of externalities, for one, could yieldsome $50 billion. In the process, the worldwould enjoy a double dividend: lower car-bon emissions and more funding for theMDGs. Second was the famous Tobin tax, ora levy for global currency transactions. Theinterest here was more for raising revenuesthan for lowering volatility. The Tobin taxshould net $28 billion.
Third, reintroduce a development focus tothe Special Drawing Rights (SDRs) of theInternational Monetary Fund (IMF). Thatshould yield $38 billion, but the move wouldraise a few questions: who would pay for theinterest for SDRs, and what would the effectsbe on the macro economy?
Fourth, there was the British suggestion tofrontload aid into a fund.
Fifth, there were huge private donations avail-able for development goals. The challengethen was how to increase private aid whileensuring that it conformed to what govern-ments wanted.
Sixth, a novel alternative was the lottery, afast-growing phenomenon, which mightyield $6 billion. The trick was to refocus lot-teries toward global events. It might be pos-sible to thus ride on national lotteries.
Remittances are helpful, but chan-nel them to investmentFinally, in Aryeetey’s list, there were remit-tances from migrant workers. These showedmuch potential, as rising remittances ap-peared correlated with falling poverty. Theconcern here was that remittances were of-ten channeled to household consumption
and so, one should find ways to redirect theflows into investment.
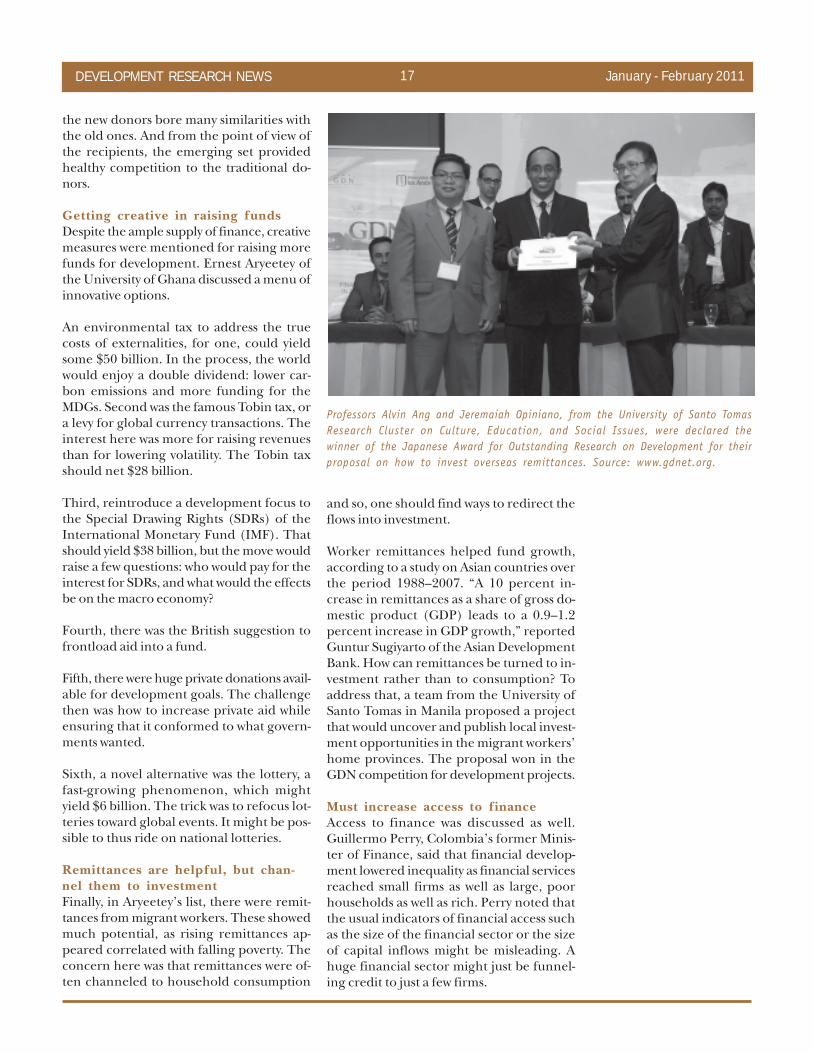
Worker remittances helped fund growth,according to a study on Asian countries overthe period 1988–2007. “A 10 percent in-crease in remittances as a share of gross do-mestic product (GDP) leads to a 0.9–1.2percent increase in GDP growth,” reportedGuntur Sugiyarto of the Asian DevelopmentBank. How can remittances be turned to in-vestment rather than to consumption? Toaddress that, a team from the University ofSanto Tomas in Manila proposed a projectthat would uncover and publish local invest-ment opportunities in the migrant workers’home provinces. The proposal won in theGDN competition for development projects.
Must increase access to financeAccess to finance was discussed as well.Guillermo Perry, Colombia’s former Minis-ter of Finance, said that financial develop-ment lowered inequality as financial servicesreached small firms as well as large, poorhouseholds as well as rich. Perry noted thatthe usual indicators of financial access suchas the size of the financial sector or the sizeof capital inflows might be misleading. Ahuge financial sector might just be funnel-ing credit to just a few firms.
Professors Alvin Ang and Jeremaiah Opiniano, from the University of Santo TomasResearch Cluster on Culture, Education, and Social Issues, were declared thewinner of the Japanese Award for Outstanding Research on Development for theirproposal on how to invest overseas remittances. Source: www.gdnet.org.

DEVELOPMENT RESEARCH NEWS January - February 201118
Moreover, noted Perry, opening up to inter-national financial markets did not help re-duce inequality nor fuel growth becausesometimes, only the large firms had accessto financial services. Financial integrationcould indirectly increase access if it helpeddevelop a broad domestic financial system.However, integration depended on the qual-ity of the existing financial institutions andthe strength of the domestic financial sectorwhen economies were opened. Hence, pre-mature financial integration might lead to asmaller financial sector.
Community banks could be helpful in ex-panding access, added Iftekhar Hasan, Di-rector of the International Center for Finan-cial Research. They brought financial servicesto small and medium enterprises (SMEs)and loans to various population groups. Us-ing statistical analysis, Hasan found that “rela-tively healthy small banks are associated withbetter overall economic performance.”
Using cash transfers to enhancefinancial accessAn interesting means to improve people’saccess to finance was floated by FabrizioCoricelli of the Paris School of Economics. Itwas to connect social cash transfer programs(like conditional cash transfers) to financialservices. That would slash administrativecosts for the banks, thereby making it moreattractive for them to do business with the
poorer clients. The social transfers and fi-nancial instruments should complementeach other to improve the saving behavior oflow-income groups.
Microfinance can use some tweakingMicrofinance is a key intervention for wid-ening access to finance. The conference hasnoted its ability to raise the incomes of thepoor, to empower them, and to give themmore freedom. It offers social protection andstops people from falling back into povertytraps.
However, speakers posed a few caveats. Oneproblem was that clients faced high levels ofuncertainty due to complex procedures andhigh operating costs, according to Prof. Vic-tor Murinde of Birmingham University. “Theregulations play a vital role in the develop-ment of the microfinance sector and candetermine the nature of the social protec-tion provided by the sector,” he said.
The impact of microfinance also varied bysubpopulation, said Dean Yang, AssociateProfessor at the University of Michigan. Hisresearch on microfinance in South Indiafound that those who already had businessesinvested in durables and scrimped on theirconsumption. But those who did not havenor want a business tended to spend moreon consumption. Yang also saw the need toexplore other kinds of financial services tocater to a wider segment of society. Savingsschemes, insurance, and remittances mightoffer opportunities.
The state should also take care about impos-ing its heavy hand on microfinance. This les-son was learned from the present crisis inmicrofinance in the Indian state of AndhraPradesh. An enforced process of lendingresulted in growing numbers of borrowersbeing unable to repay their loans. Accord-ing to Prof. Stefan Klonner from the SouthAsia Institute, the government thus man-dated a moratorium on repayments in Octo-ber 2010. Major microfinance companies re-acted by halting new loans and choosing tooperate instead in other states of India.
The papers and presentations can be down-loaded at the website of the Global Develop-ment Network: www.gdnet.org.
Microfinance is a key intervention for widening access to finance. Theconference has noted the ability of microfinance to raise the incomes ofthe poor, to empower them, and to give them more freedom. Source:www.gdnet.org.
DRN
DEVELOPMENT RESEARCH NEWS 19 January - February 2011
PN 2010-01How Do Philippine Provinces Farein Terms of Human Development?PIDS Research Information Staff
PN 2010-02Why Cement Prices Remain Highdespite Zero TariffsAldaba, Rafaelita M.
PN 2010-03Examining Recent Trends in Poverty,Inequality, and VulnerabilityAlbert, Jose Ramon G.,Ramos, AndrePhilippe
PN 2010-04 (Policy Brief)Hilots Getting on Board Facility-based DeliveriesLavado, Rouselle F.
PN 2010-05 (Policy Brief)Is PhilHealth’s Sponsored ProgramReaching the Poorest of the Poor?Lavado, Rouselle F.
PN 2010-06 (Policy Brief)Children Suffer from MultipleDimensions of PovertyReyes, Celia M,Tabuga, Aubrey D.
PN 2010-07 (Policy Brief)A Glimpse at the School DropoutProblemOrbeta, Aniceto Jr. C.
PN 2010-08 (Policy Brief)Proliferation of Street Children: aThreat to the MDGsCuenca, Janet S.
PN 2010-09 (Policy Brief)Schooling Disparities: an Early Life
PIDS Policy Notes in 2010The Policy Notes are observations/analyses written by PIDS researchers on certain policy issues. The treatise is holisticin approach and aims to provide useful inputs for decisionmaking. The Notes are circulated to the highest levels ofdecisionmakers in the country. The following titles were released in 2010:
Lever for Better (or Worse) Equity inthe FutureOrbeta, Aniceto Jr. C.
PN 2010-10 (Policy Brief)Localizing Child Protection: Doesthe Local Council for the Protectionof Children Matter?Cuenca, Janet S.
PN 2010-11Addressing Constraints to Agricul-tural Finance to Boost Food Produc-t ionLlanto, Gilberto M.
PN 2010-12Weather and Climate-related Disas-ters: the Cost of InactionIsrael, Danilo C.
PN 2010-13Investing in Local Roads for betterMobility of People, Goods, andServicesLlanto, Gilberto M.
PN 2010-14Supporting Innovative Small andMedium Enterprises: New Ideas fromTaiwan and KoreaLlanto, Gilberto M.
PN 2010-15How Are DOH Hospitals Funded?Lavado, Rouselle F.,
PN 2010-16Understanding the Recent Rise inPoverty Incidence: a Look at Growthand Income Distribution EffectsTabuga, Aubrey D.,Mina, Christian D.,Reyes,Celia M.,Asis, Ronina D.,Datu, Maria Blesila G.
DEVELOPMENT RESEARCH NEWS January - February 201120
DEVELOPMENT RESEARCH NEWSVol. XXIX No. 1
January - February 2011ISSN 0115 - 9097
Editorial Board: Dr. Josef T. Yap,
President; Mr. Mario C. Feranil, OIC
Vice-President and Director for Project
Services and Development; Ms. Jenni-
fer P.T. Liguton, Director for Research
Information; Ms. Andrea S. Agcaoili,
Director for Operations and Finance;
Atty. Roque A. Sorioso, Legal Consult-
ant.
Staff: Jennifer P.T. Liguton, Editor-
in-Chief; Ma. Aileen A. Garcia, Issue
Editor; Claudette S. Malana, Ma.
Gizelle G. Manuel, and Analia P.
Quion, Writers; Jane C. Alcantara
and Edwin S. Martin, Contributors;
Valentina V. Tolentino and Rossana
P. Cleofas, Exchange; Delia S.
Romero, Gerald Jay S. Libiran,
Necita Z. Aquino and Michael A.
Caturan, Circulation and Subscription;
Ma. Aileen A. Garcia, Layout.
STAFF BOX DEVELOPMENT RESEARCH NEWS is a bimonthly
publication of the PHILIPPINE INSTITUTE FORDEVELOPMENT STUDIES (PIDS). It highlights the findings
and recommendations of PIDS research projects and important
policy issues discussed during PIDS seminars. PIDS is a nonstock,
nonprofit government research institution engaged in long-term,
policy-oriented research. This publication is part of the Institute's
program to disseminate information to promote the use of research findings. The views and opinions
expressed here are those of the authors and do not necessarily reflect those of the Institute. Inquiries
regarding any of the studies contained in this publication, or any of the PIDS papers, as well as suggestions
or comments are welcome. Please address all correspondence and inquiries to:
Research Information StaffPhilippine Institute for Development Studies
Fifth floor, NEDA sa Makati Bldg., 106 Amorsolo Street, Legaspi Village
1229 Makati City, Philippines
Telephone numbers 894-2584 and 893-9585 up to 893-9592
Telefax numbers (632) 893-9589 and 816-1091
E-mail address: [email protected]
Reentered as second class mail at the Makati Central Post Office under Permit No. PS-570-04 NCR. Valid
until December 31, 2011. Annual subscription rates are: P200.00 for local subscribers and US$20.00 for
foreign subscribers. All rates are inclusive of mailing and handling costs. Prices may change without prior
notice.
Moreover, more effective interventions are urgently needed. There has not been alarge-scale poverty reduction program implemented during the period 2003–2006, soto speak. The Kalahi Prototype Projects, which focused on asset reform, improve-ment of basic amenities, resettlement, and help for conflict areas, are mostly relevantonly to the chronic poor. The poor at any point in time are not a homogenous group;they consist of the chronic poor (those who are consistently poor) and the transientpoor (those who were previously nonpoor). There are significant movements in and outof poverty, suggesting the vulnerability of certain segments of the population to shocks.
This highlights the importance of safety nets to help vulnerable populations from fall-ing into poverty. This suggests that different strategies should be implemented towardhelping the chronic poor and the transient poor.
In summary, what matters in poverty reduction is not just economic growth but thenature of expansion that takes place. To effectively reduce poverty, an inclusive growthcoupled with effective redistributive efforts is necessary. Increasing rural incomes byimproving nonfarm income opportunities is a key to reducing poverty in the rural ar-eas. Ensuring income security of families for them to weather effects of economicshocks is one important policy option. Provision of safety nets like health and cropinsurance will help the poor from falling deeper into the poverty trap and the nonpoorinto becoming poor in times of crises.
Source: Reyes, C.M., C.D. Mina, A.D. Tabuga, R.D. Asis, and M.B.G. Datu. 2010. Understanding the recent risein poverty incidence: a look at growth and income distribution effects. PIDS Policy Notes No. 2010-16.Makati City: Philippine Institute for Development Studies.
○ ○ ○ ○ ○ ○ ○ ○ ○ ○ ○ ○ ○ ○ ○ ○ ○
Box 1. Poverty.....from p. 14
DRN