p overty centre - ipc ig - international policy centre for ... · many are calling for further...
TRANSCRIPT
EXPANDING THE SOCIAL SECURITY NET
IN SOUTH AFRICA: OPPORTUNITIES,
CHALLENGES AND CONSTRAINTS
Kalie Pauw and Liberty MncubeDevelopment Policy Research Unit (DPRU),
University of Cape Town
The views expressed in IPC publications are those of the authors and do notnecessarily reflect the views of IPC, IPEA or UNDP.
CASH TRANSFER RESEARCH PROGRAMME
COUNTRY STUDY
overty CentreINTERNATIONALP
The International Poverty Centre is jointly supported by the Brazilian Institute for Applied Economic Research (IPEA)and the Bureau for Development Policy, United Nations Development Programme, New York.
Country Study number 8 July, 2007

Copyright© 2007
International Poverty CentreUnited Nations Development Programme
International Poverty CentreSBS – Ed. BNDES,10o andar70076 900 Brasilia DFBrazil
povertycentre@undp-povertycentre.orgwww.undp-povertycentre.orgTelephone +55 61 2105 5000Fax +55 61 2105 5001
Rights and Permissions
All rights reserved.
The text and data in this publication may be reproduced as long as the source is cited.Reproductions for commercial purposes are forbidden.
The International Poverty Centre disseminates these Country Studies of the Cash Transfer ResearchProgramme to encourage the exchange of ideas about development issues. These studies are signed bythe authors and should be cited accordingly. The findings, interpretations, and conclusions that theyexpress are those of the authors. They do not necessarily represent the views of the International PovertyCentre, IPEA or the United Nations Development Programme, its Administrator, Directors, or the countriesthey represent.
Country Studies of the Cash Transfer Research Programme are available online at http://www.undp-povertycentre.org and subscriptions can be requested by email to [email protected]
COUNTRY STUDY PUBLISHED BY THE INTERNATIONAL POVERTY CENTRE
EXPANDING THE SOCIAL SECURITY NET IN SOUTH AFRICA: OPPORTUNITIES, CHALLENGES AND CONSTRAINTS
Kalie Pauw and Liberty Mncube∗
CASH TRANSFER RESEARCH PROGRAMME
This study was generously financed by the UNDP Regional Bureau for Africa. This study is part of a much larger research programme: “Growth, Inequality, Poverty and Cash Transfers: A comparative study of Poverty Impacts and Institutional Aspects in Selected Countries in Africa and Latin America”, supported by the Department for International Development of the UK Government (DFID), GTZ and UNDP.
ABSTRACT
For a large proportion of the South African population, social welfare grants are an important source of income. Since 2000, rapid increases in government expenditure on social security have further enhanced the contribution of welfare grants to the income of poor households and have thus been important in the fight against poverty. Given these apparent successes, many are calling for further expansions in social security provisioning, with the idea of developing conditional cash transfer schemes occasionally surfacing in policy circles. However, as we argue in this Country Study, there are various constraints to such expansions of the welfare net. Whereas in the past much of the increased expenditure on social security provisioning could be financed out of government revenue overruns, further increases are likely to be possible only through reallocation of government expenditures. There is already evidence of substitution taking place within the social budget since education and health expenditures have apparently declined in favour of increased welfare transfer expenditures. This trend, we argue, is untenable and may harm the already weak education and health services in South Africa. Conditional grants linked to school attendance and visits to health clinics would place further pressure on health and education services, as well as on the agencies responsible for disbursing and monitoring welfare payments in the country. We argue, therefore, that budgetary and service delivery constraints currently present a strong argument against expansion of the social welfare system in the immediate future.
∗ The authors are from the Development Policy Research Unit (DPRU) at the University of Cape Town. The comments by Haroon Bhorat (DPRU) and Jean Le Nay (UNDESA) are greatly appreciated.
2 Country Study nº 8
1 INTRODUCTION
After coming into power in 1994, the ANC government committed itself to specific goals in the area of social policy, which included eliminating poverty, achieving an acceptable distribution of income lowering unemployment levels and increasing social assistance programmes (Taylor, 2002). Government even went so far as to entrench the right to social assistance in the Constitution [s27(1)(c)] (see Haarmann, 2001), a bold move that has made it vulnerable to Constitutional Court challenges, as seen in the State versus Grootboom case in 2000 (Taylor, 2002). Social welfare transfers to households have stepped up significantly over the last decade, partly because social welfare was previously targeted mainly at White recipients. At the same time that the number of people eligible for grants has increased dramatically, there has been a clear policy decision to increase welfare spending, both in terms of the value of the grants paid and in terms of their scope or coverage.
In 2002 the Taylor Committee published a report on its investigations into the social security system in South Africa (Taylor, 2002).1 It noted that the current welfare system had been inherited from the previous era without any substantial changes having been made in terms of its design. The underlying assumption of the ‘old system’ was that the employed could support themselves and that unemployment was temporary (Taylor, 2002: 15). However, South Africa’s unemployment problem has since been recognised to be structural and the achievement of full employment to be an unlikely prospect. Furthermore, since a large proportion of the population lives outside the economic mainstream, the trickle-down effect of growth has been inadequate to address poverty. These unique circumstances, the Taylor Committee argued, required a fresh look at social protection systems and the task of better adapt ing systems to the needs of specific social environments.
In this Country Study, we first examine the use of cash transfers as a policy tool in developing countries, and particularly the design of such systems (section 2). In section 3, we analyse social security provisioning in South Africa in more detail, focusing on the history of social security provisioning, the types of grants currently in place, government welfare expenditures and expenditure increases over the last decade. Attention is also given to the current debate concerning the possibility of additional expansions of social security provisioning (specifically the basic income grant debate). Section 4 reviews the fiscal and service delivery constraints to further expansion of the social security system in South Africa, centreing on conditional grants attached to education and health services. Lastly, in section 5, we provide general conclusions, make policy recommendations and offer suggestions for further research.
2 CASH TRANSFERS IN DEVELOPING COUNTRIES
2.1 WHAT ARE SOCIAL SECURITY NETS AND CASH TRANSFERS?
The World Bank’s Social Protection sector defines social safety nets, also called social assistance or social welfare programmes, as “non-contributory transfer programmes [usually] targeted to the poor or those vulnerable to poverty and shocks”.2 Such programmes are distinguished from contributory transfer programmes, which are typically linked to employment. In South Africa these latter include private pension schemes, retirement plans and private unemployment benefits. The government also manages a non-contributory public unemployment insurance
International Poverty Centre 3
scheme. Social security as a non-contributory programme is meant to fill the void when households either fail, or are unable, to manage their own risk through private or public contributory schemes.
The poor often rely on informal safety nets. Such nets may include inter-household transfers, informal food provisioning arrangements for the needy and so on. However, the types of safety nets addressed in this study are formal government-funded programmes. These include programmes to provide the needy with cash transfers, in-kind transfers or vouchers (e.g., food coupons) for the purchase of specific items.
Cash transfers are often preferred to in-kind transfers, vouchers or even public works programmes. They are easier and cheaper to administer than schemes involving the transportation and storage of physical goods, as in the case of in-kind transfers, or schemes requiring supervision and equipment, such as public works programmes. Compared to systems based on direct spending or on the utilization of coupons or vouchers for monitoring purposes, cash transfers give the recipient households more freedom to decide how to spend the funds received, thus allowing beneficiaries to choose those bundles of goods that best satisfy their own preferences.
Safety nets have two primary functions: to reduce inequality through the redistribution of income and to mitigate short-term poverty. For these reasons, cash transfers are typically targeted either to the poor or to those who face the risk of falling into poverty in the absence of such transfers. A secondary objective of safety nets is to help households manage risk. Safety nets give people the opportunity to take business risks, potentially leading to higher returns, in the knowledge they can fall back on the social welfare net.
2.2 DESIGNING CASH TRANSFER SCHEMES
Countries have various types of welfare programmes, depending on socio-economic and political conditions, as well as on the preferences of society. However, any country faces constraints as to the size and number of programmes it can implement. These constraints typically exist due to limited financial capabilities or a lack of administrative abilities on the part of government or the agencies tasked with implementing the programmes. In addition, constraints related to service delivery, political scenarios and socio-economic conditions may also play a role.
With respect to the design of cash transfer programmes, various considerations must be taken into account by policymakers. One design issue concerns the coverage of grants, which can be either universal (all members of society are beneficiaries) or targeted at specific sub-groups of the population. Policymakers also have to decide whether to attach conditions to the grants. Conditional grants often require beneficiaries to attend schools or visit health clinics regularly. These issues will be considered in more detail below.
2.2.1 Universalism Versus Targeting
A number of factors come into play when choosing between narrow and broad targeting. These include ‘political economy’ decisions concerning the instruments to be used for redistributing resources, as well as the level of social expenditure that can be afforded given the budget constraints (Mkandawire, 2006:4).
4 Country Study nº 8
Since universal grants are not targeted, all members of society are eligible. The advantages of universal grants are that they stigmatise no one and lower administrative costs. However, they can be expensive given the sheer magnitude of such programmes. Even broadly targeted grants are often regarded as fiscally unsustainable, especially when a small proportion of society is required to finance grants for a large recipient proportion. In South Africa, for example, the proposed Basic Income Grant (BIG) was criticised as being too expensive to finance internally (as discussed in greater depth further on in this analysis). One option considered was to reduce the per capita value of the grant rather than change the coverage. However, this would have reduced the welfare effects, especially for the poorer segments of society who more heavily rely on such grants. Governments, including the South African administration, therefore tend to support targeted measures.
Targeting, however, involves various administrative complexities. The trade-offs arising from targeting are widely recognized, for the narrower (or more precisely defined) the target group, the more costly it becomes to administer the programme, especially when complicated means tests are involved. This raises the issue of the cost-effectiveness of limiting direct spending by introducing targeting.Often the administrative implications of programmes are overlooked in the policy design stages. As Mkandawire (2006:4) points out, “in practice targeting is faced with formidable administrative hurdles, especially in poor countries where the informal sector is a major source of livelihood and poor people’s ‘visibility’ to the state is low, and the overall capacity is weak”.
There are various targeting methods, the most preferable being means testing. In a means test, information is collected on household income. On the basis of these data, it is decided whether or not a person or household is eligible for social assistance. Means testing can be administratively complex, especially when stringent verification procedures are in place. Means testing is therefore advisable only where administrative capacity is high and the benefits are large enough to justify the administrative costs.
While various other methods exist for identifying the beneficiaries of targeted welfare programmes, many often result in targeting errors, such as under-coverage of the poor and leakages to the non-poor (Mkandawire, 2006:4). Thus, when policymakers attempt to implement targeting procedures that are administratively less burdensome, the targeting itself is often less effective than intended.
A list of these alternative targeting procedures follows. Although not detailed here, the limitations of each are fairly obvious.
• Proxy means testing: Rather than soliciting an applicant’s actual income level, data are gathered on his demographic characteristics. On the basis of previous statistical analyses, a ‘score’ or predicted income level is then calculated.
• Community-based targeting: Community members, or community leaders, are asked to identify beneficiaries for a transfer programme.
• Geographical targeting: Specific geographical regions are identified for targeting, with the regions being selected on the basis of a poverty map, for example. This method is only efficient where poverty is spatially concentrated.
• Demographic targeting: Targeting is based on specific demographic characteristics, , such as age, for child welfare grants and old age pensions.
International Poverty Centre 5
• Self-targeting: Technically the programme is open to all, but since the benefit is low, many choose not to partake. Public works programmes that pay low wages are an example of such programmes. Those who can command higher wages elsewhere will not participate. Likewise, if a day of queuing is required to collect payouts, many people will choose not to partake if the opportunity cost of queuing (i.e., the potential wage foregone) is higher than the benefit.
Targeting has a number of implications. Firstly, the design of a means-tested programme, and particularly the income cut-off level used to determine eligibility, may have important implications for the take-up rate and hence the total cost of a programme. If the income distribution function is particularly dense around the income cut-off, as is often the case in developing countries, a relatively small change in this cut-off value will significantly alter the number of households eligible for welfare transfers (Alderman, 1999).
Various other factors can also affect take-up rates. In South Africa, the transition towards a more inclusive social security system, coupled with increased awareness of the existence of social welfare programmes in previously excluded segments of the population, has led to a dramatic increase in the number of beneficiaries. Take-up rates can also be affected by misrepresentation by households of their income levels. Put simply, if a greater number claim to be poor than anticipated, the cost of a programme will exceed projections and budget allocations (Alderman, 1999).
Secondly, the procedures used to measure outcomes (in terms of poverty) may affect perceptions as to the effectiveness of welfare programmes. The idea behind targeting is that, since it allows more resources to be channelled to the poorest members of society, the welfare impact is generally greater for the most needy. However, different targeting mechanisms lead to different poverty outcomes. A cash transfer may apparently be successful in reducing the poverty rate if the recipients are close enough to the poverty line to be pushed over it on receiving the grant. However, targeting those further from the line may reduce the depth of poverty, but perhaps not the headcount at the given poverty line.
Finally, an unintended consequence of targeting is that it creates “perverse incentives for changes in people’s behaviour in attempts to become or remain beneficiaries of welfare policies” (Mkandawire, 2006:5). Specifically, such incentives could encourage the poor to reduce their supply of labour. In South Africa, most welfare transfers are means tested. For example, the value of pensions depends on the level of other income earned by the recipient or other household members. As Alderman (1999) points out, means tests can generate a disincentive to increasing the labour supply, especially if labour earnings reduce welfare transfer income.
2.2.2 Conditional Versus Unconditional Grants
Social welfare policies often have very broad objectives. In addition to alleviating poverty, they form part of broader agendas for economic development and social transformation (Mkandawire, 2006). One of the ‘greatest tragedies’ of poverty, to quote Gertler (2005), is its intergenerational transmission: children who grow up in poor households tend to remain poor. Due to malnutrition, combined with poor quality schooling or low educational levels, they lack the capabilities required to escape poverty. It is therefore crucial that social policies aimed at helping people escape chronic or long-term poverty provide stronger incentives to

6 Country Study nº 8
investment in human capital development, especially of the youth. This would allow the broader goals of economic development and economic transformation to be reached in the long run.
There are various ways to promote investment in human capital development. One option is to render social services, especially health and education, more affordable and accessible while improving their delivery. This objective can be achieved by adopting a supply-side approach and investing in social services. Alternatively, the demand for such services can be stimulated. This can be achieved through welfare transfers to poor households, the idea being that part of the additional income will be spent on human capital investment. However, there is evidence that poor households do not always spend their additional income in this way (Das et al., 2004). For this reason, conditional cash transfers (CCTs) have become popular in recent years.
CCTs are offered to targeted households on the condition that they invest in human capital, thus “combining short-term objectives of safety nets with long-term goals of breaking intergenerational poverty traps” (Britto, 2006:15). Most often the conditions attached to grants pertain to school attendance by children or regular visits to health clinics. They not only relax the income constraint of poor households, but also provide an incentive to use services linked to the programme (Gertler, 2005). Should the conditions succeed in increasing the demand for education and health services, the authorities must ensure, of course, that the service providers can cope with the higher demand. If not, the supply has to be increased and service delivery improved.
Targeted CCT programmes often have the added administrative task of monitoring recipients to ensure they comply with the conditions. Using the Progresa scheme in Mexico as a case study, Gertler (2005) has found, however, that the cost of monitoring is quite low, at about one per cent of the total cost of the programme. Of course, this percentage varies with the programme, depending on the size of the grants and the number of recipients. For example, Progresa happens to be a relatively large scheme in terms of grant values, thus making the relative cost of monitoring low. The types of conditions attached to a grant also determine how easily compliance can be monitored. For example, it is probably easier to monitor school attendance, where teachers know who should be in class each day, than to monitor visits to a health clinic. Finally, the extent of the administrative and monitoring costs also depends on the administrative capacity of the agency responsible for implementing, managing and monitoring the CCT programme.
It is difficult to determine whether conditional grants necessarily have more favourable outcomes than unconditional cash grants. As Britto (2006) notes, it cannot be assumed that the poor would not choose to invest in human capital under a normal cash transfer programme. A DfID report claims that in many cases individuals are well enough informed to prioritise spending on health and education even when it is not a condition (DfID, 2006). The spending propensities of households often depend on various factors. Firstly, the gender of the decision-maker or recipient of the grant often impacts on expenditure patterns. Evidence from a South African study on old-age pensions found positive impacts on the health of young children when the pension went to grandmothers, but no effects when the pension was paid to grandfathers (Duflo, 2003). Secondly, cultural factors may affect outcomes. For example, where societies discriminate against girls by not sending them to school, conditional grants
International Poverty Centre 7
can be effective (DFID, 2006). Likewise, such grants may be desirable in countries where child labour is employed because they raise the opportunity cost of sending a child to school.
However, before deciding whether or not to attach conditions to grants programmes, it is important to review each case individually. After all, limited use of education and health services can simply be due to prohibitive costs or insufficient income (assuming there is not a supply problem), in which case unconditional cash grants or subsidies/vouchers may be equally effective.
2.2.3 CCT Programmes in Developing Countries: Two Case Studies
a) Bolsa Escola and Bolsa Familia in Brazil
The Brazilian Bolsa Escola programme became a nationwide Federal programme in 2001. Then, in 2003, it was unified with a number of other Federal CCT programmes and renamed Bolsa Família. Bolsa Escola provided that cash transfers to mothers, provided their children continued to attend school. Targeting was implemented in two stages. In the first, the National government, using information on regional needs, determined how many stipends each municipality could award. In the second stage, the municipalities identified those most in need (Britto, 2006, De Janvry et al., 2005).
Bolsa Família brought together beneficiaries from Bolsa Escola and a range of other programmes, eventually expanding to over eight million beneficiary households by the end of 2005. Under this programme, two subsets of the population were identified for targeting, namely, the extreme poor (households with a monthly per capita income below R$50) and the moderately poor (per capita income between R$50 and R$100). Households initially received monthly payments of between R$15 and R$95, depending on their income and composition.3 The conditions attached to Bolsa Família include the following: (i) Children aged 6-15 years must enrol in school and attend at least 85 per cent of their classes. (ii) Children under seven years are required to visit clinics for growth monitoring and immunizations. (iii) Prenatal care for pregnant women is compulsory (De Janvry et al., 2005).
b) Progresa and Oportunidades in Mexico
Mexico’s Progresa, introduced in 1997, was the first nation-wide CCT programme in the world. It was expanded in 2002 and renamed Oportunidades. Britto (2006:15) describes Progresa as an ‘innovative and apolitical’ programme that provides cash and in-kind transfers linked to school attendance and regular health check-ups. The apolitical claims relate to the transfer and targeting mechanisms, which cut out intermediation through sub-national budgets, i.e., transfers paid directly from the programme administration to the beneficiaries.
The targeting is done in three stages. First, demographic data are used to identify the most needy communities. Next, household surveys are employed to identify households within each of these communities and, lastly, the households selected are reviewed in community meetings. The programme is innovative for a number of reasons, including that it represents an ‘integrated approach to poverty’ and contains a gender bias since transfers are directed to mothers and higher subsidies are paid for female school pupils (Britto, 2006:15).

8 Country Study nº 8
c) Outcomes
Since Progresa has been in place for a few years longer than Bolsa Escola and Bolsa Família, more information is available on its outcomes. In general, however, Britto (2006) claims that initial evaluations of the Brazilian and Mexican CCT programmes have shown positive effects on both schooling and nutrition. Some specific outcomes of these two programmes are briefly mentioned below.
With respect to child health, evaluations of changes in anaemia and height reveal that Progresa has had a ‘big effect’ (Gertler, 2005:2). Growth monitoring visits have increased by 30 to 60 per cent, while beneficiaries aged 0-5 years register a 12 per cent lower incidence of illness than non-Progresa children (Rawlings, 2004). Higher food consumption levels have also been observed in Mexico. Gertler (2005) further states that one of the hopes of Progresa was that improved nutrition among young children would also contribute to their cognitive abilities and hence have a positive impact on school readiness. Since this was not found to be the case, however, other types of intervention may have to be considered to improve such abilities.
The educational effects of Progresa have also been positive. Although primary school enrolment rates were already quite high prior to the intervention (between 90 and 94 per cent), the programme has succeeded in further increasing enrolment. The rate has increased between 0.74 and 1.07 percentage points for boys and between 0.96 and 1.45 percentage points for girls. At the secondary level, the impact of Progresa has been more significant, partly due to the lower enrolment rates prior to the implementation of the programme. The initial enrolment rates of 67 per cent for girls and 73 per cent for boys have risen between 7.2 and 9.3 percentage points for girls, and between 3.5 and 5.8 percentage points for boys (Rawlings, 2004). With regard to child labour, Britto (2006:16) contends that the impact of CCT programmes is inconclusive “since school attendance can be … combined with work”. However, Rawlings (2004) suggests that Progresa has decreased the probability of 8 to 17-year-olds working by between 10 and 14 per cent compared to the probabilities prior to the intervention.
In terms of poverty, Britto (2006) argues that the impact of CCT programmes is not yet clear. However, in an in-depth analysis of the effects of Bolsa Família on poverty and inequality, Veras et al. (2006) find that 80 per cent of the grant has been targeted to families below the poverty line. During the period 1995-2004, old age pensions, disability grants and Bolsa Família grants jointly accounted for 21 per cent of the decrease in inequality.
3 SOCIAL SECURITY PROVISIONING IN SOUTH AFRICA
3.1 HISTORY OF SOCIAL ASSISTANCE
During apartheid a welfare state was erected for Whites to protect them against various contingencies by means of social insurance (see Van der Berg, 2002). Although social security provisioning was eventually extended to other groups, it remained unequal along racial lines well into the 1980s. The Taylor Report (2002) called for a comprehensive social assistance scheme in order to meet the medium- to long-term goals of social and economic transformation in South Africa. This, the report argued, would indicate a commitment to addressing the socio-economic backlog of apartheid.
South Africa’s first social assistance programme was initiated with the enactment of the Children’s Protection Act of 1913, which provided maintenance grants for children. However, since maintenance grants were largely restricted to non-Africans, very few of these grants
International Poverty Centre 9
reached African parents and none were given to rural Africans (Bhorat, 1995). In 1990, 54 per cent of all maintenance and foster care grants went to Coloureds. In 1993, of the children covered, 13 per cent were Coloured, eight per cent Asian, two per cent White and 0.5 per cent were Africans, despite the latter constituting well over three-quarters of the population at the time. African applicants were restricted by a lower income cut-off for the means test and by a lack of outreach and advocacy to educate them concerning their rights (Alderman, 1999).
The Old Age Pensions Act of 1928 provided grants in the form of social (non-contributory) pensions for Coloureds and Whites. Africans and Indians were initially excluded. It was argued that Africans could rely on their rural kinship ties to provide security in their old age. The blind and old age pension scheme was only extended to Africans and Indians in 1944. However, the value of the grants received differed across racial groups. For example, Bhorat (1995) notes that in 1947 the maximum pension for Whites was five times higher than that for Africans, while Coloured and Indian pensioners received half as much as Whites. Coloureds and Whites also benefited from the disability grant introduced in 1937. Disability grants were extended to Africans and Indians in 1947.
State old age pensions for Whites saw a constant increase over the years, while those for Africans were reduced. The gap between the two widened until 1971. Then, in the early 1970s, the South African economy began to stagnate. Van der Berg (2002) describes the period extending from 1972 to 1990 as “a trend towards re-incorporation and reduced inequality”. According to Bhorat (1995), during this period the National Party came to the realisation that the economy could no longer rely solely on a small pool of White workers to sustain economic progress. This led to an increase in the demand for Black workers. Job reservation laws were abandoned and trade unions for non-White workers were legalised for the first time. These changes also resulted in a move towards greater inclusivity in the social security system. For example, African old age pensions as a percentage of White pensions rose from 16 per cent in 1972 to 85 per cent in 1993 (Bhorat, 1995). Van der Berg (2002) argues that although African pension values were on the rise, fiscal constraints were still a reality. These constraints were overcome by substantially lowering White benefit levels, especially the levels of old age pensions. At the time, relatively poor elderly Whites were a small and politically marginal group whose benefits could be reduced with little fear of a political backlash.
In 1994, the new ANC government faced the challenge of transforming the existing fragmented social security system into one based on comprehensive coverage for the population as a whole. The Lund Committee on Child and Family Support convened in February 1996 after concerns were raised about the financial viability of extending state maintenance grants to Africans at the level then enjoyed by non-Africans. The Committee stressed that some kind of benefit had to be continued, especially given the importance of the early, vulnerable years in a child’s life. It pointed to the possibility of even greater costs in the absence of a benefit.4 The Committee then recommended that the grant be given to the primary caregiver. Given the financial constraints, the Committee recommended that each qualifying child be granted a much smaller amount than was previously the case, and that the benefit be restricted to children under seven years of age so it could reach a larger number of those most in need.5 The Committee’s recommendations were largely accepted by Cabinet. Hence, the child support grant introduced in 1998 replaced the state maintenance grant. The introduction of the child support grant marked a major policy shift in government as it signalled the government’s intention to support children in poverty and poor households, particularly in rural areas, that had been excluded from social assistance programmes in the past.6
10 Country Study nº 8
The approach that the new government chose was based on the concept of developmental social welfare. It emphasised that social development cannot occur without economic development and that economic development is meaningless unless accompanied by improvements in social welfare (Midgley, 1996). The White Paper on Social Welfare, published by the Department of Welfare in 1997, contained the policy framework for restructuring social welfare in South Africa.
The White Paper based its policy framework on the interrelations between social and economic development. It pointed out that “social welfare policies will be developed which will be targeted at poverty prevention, alleviation and reduction and the development of people’s capacity to take charge of their own circumstances in a meaningful way” (Department of Welfare, 1997). The ultimate aim of the White Paper was to “facilitate the provision of appropriate developmental social welfare services to all South Africans, especially those living in poverty, those who are vulnerable and those who have special needs” (Department of Welfare, 1997). The ANC government sought not only to restructure the existing welfare system in an equitable and non-racial manner, but also to radically redefine the role and responsibilities of welfare. Thus, post-apartheid South Africa committed itself to proactively devise and use welfare as a poverty alleviation programme, thereby linking social and economic development strategies and assigning an interventionist role to the State to bring about a change in well-being in society as a whole (Haarmann, 2001).
The Social Assistance Act of 2004 makes the national government responsible for social security grants. The national Department of Social Development (formerly the Department of Welfare) performs a regulatory role by setting policies as to who qualifies for social assistance grants and monitoring the newly formed South African Social Security Agency’s (SASSA) operations. SASSA is responsible for administering social assistance by implementing policies, programmes and procedures for an effective and efficient system of social assistance grants. Thus, since the establishment of this agency in 2005, all grants are administered at the national level, whereas this function was previously carried out at the provincial level under the Social Assistance Act of 1992.
3.2 CURRENT SOCIAL ASSISTANCE PROGRAMMES: DESIGN AND IMPLEMENTATION
South Africa has developed an extensive social security system. The types of grants provided by the State include old age pensions, disability grants, foster care grants and child support grants. Social assistance transfers are aimed at providing income support to the eligible poor and vulnerable individuals, mostly the elderly, the disabled and children under 14 years of age. This subsection briefly describes the existing social assistance programmes, taking into account, inter alia, targeting, grant values and changes over time.
3.2.1 Social Old Age Pensions
The old age grant, or social old age pension, is a means tested benefit and is payable to people of retirement age or older. Retirement age is defined as 65 years or older for males and 60 years or older for females. The applicant must not be maintained or cared for in a State Institution or be in receipt of another social grant. The maximum monthly value is currently R820. According to Woolard (2003), the size of the grant is calculated using the formula
1.15 0.5D A B= − for an unmarried person and 1.075 0.5D A B= − for a married person. A stands for the maximum grant payable per annum as approved, B is the annual income of
International Poverty Centre 11
the applicant in the case of an unmarried person, or half the applicant’s and his or her spouse’s combined annual income in the case of a married person and D is the annual grant amount payable.
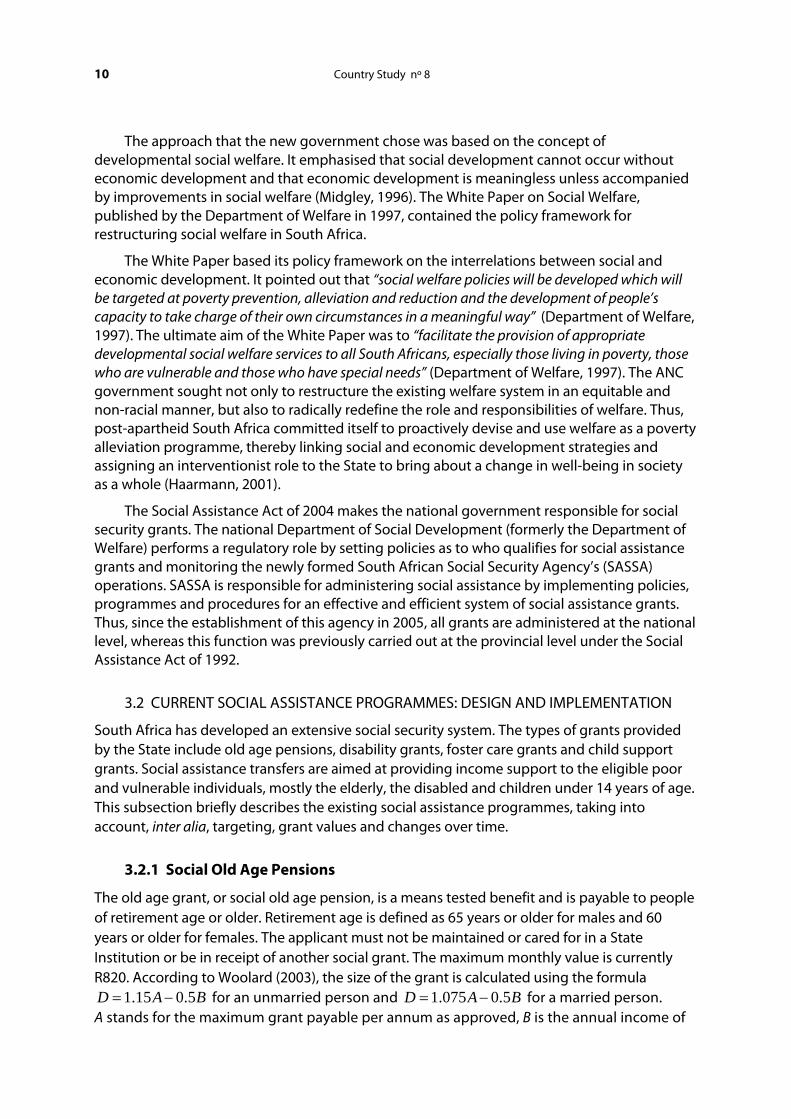
Figure 1 shows that the level of the old age grant increased, in real terms, from about R540 to R613 between 2000 and 2006. This is equivalent to an average annual real growth rate of about 2.1 per cent since 2000. The number of pensioners benefiting from the grant increased from about 1.7 million in 1997 at an average annual growth rate of 2.7 per cent, to about 2.1 million by the beginning of 2006. This currently amounts to about five per cent of the total population and about 70 per cent of all the people eligible for old age grant. The rise in the number of old age grant beneficiaries indicates that there are fewer people with private pensions and that awareness of the existence of the grant has increased.
FIGURE 1
Level of the Old Age Grant
0100200300400500600700800900
1997
/98
2000
/01
2001
/02
2002
/03
2003
/04
2004
/05
2005
/06
2006
/07
NominalReal, 2000 prices
Source: Department of Social Development.
The impact of the old age pension in mitigating poverty at the household level has been well documented. Ardington and Lund (1995), as cited in Case and Deaton (1998), found that pensions are a significant and reliable source of income leading to household security and contributing towards food security. Because of their wide reach – not only are there many beneficiaries, but also the pensioner households are typically larger in size than other households – old age pensions have been found to have a noteworthy effect on reducing poverty. Woolard (2003) analyses the poverty impact of various types of welfare grants, based on a ranking of individuals by their pre-transfer per capita income. Starting from the assumption that the poorest 40 per cent of the population are defined as poor, and the poorest 20 per cent are ultra-poor, she finds that in the absence of any social assistance grants, 55.9 per cent of the elderly would be in poverty and 38.2 per cent would be in ultra-poverty. Assuming that all those eligible for the old age pension registered for the grant, overall poverty would be reduced from 40 per cent (the base-poverty rate by definition) to 33.1 per cent. In addition, poverty amongst the elderly would fall to 22.9 per cent and amongst the ultra-poor, the percentage would fall to a remarkable 2.5 per cent.
Of course the uptake of welfare grants is not perfect due to, among other things, self-selection and information asymmetries. Given under-reporting of income in household surveys, it is also difficult to estimate exactly how many people are eligible. Van der
12 Country Study nº 8
Westhuizen and Van Zyl (2002), for example, quote figures from another study that found, at the time, that the uptake of old age pensions was about 85 per cent. Furthermore, Woolard’s (2003) calculations do not appear to take into account the fact that household members often cluster around pensioners, thus increasing the household size of pensioner households. This reduces the poverty impact since the pension is shared among many people.
The other grant available for persons aged 60 years or older is the war veterans grant. Applicants for this grant must have fought in the Second World War (1939 to 1945) or the Korean War (1950 to 1953). The maximum monthly value of this grant is currently R820. It is means tested and applicants must be either aged 60 years or older or disabled. To receive this grant, the applicant must not be maintained or cared for in a State institution. Furthermore, applicants must not be in receipt of another social grant. The war veterans grant is likely to be phased out over time as the number of beneficiaries is declining rapidly due to natural attrition.
3.2.2 Disability Grants
The State also provides disability grants. The disability grant is means tested and subject to medical eligibility criteria. Applicants for this grant must be between 18 years of age and retirement age and must not be maintained or cared for in a State institution or be in receipt of another social grant. A medical doctor has to examine a claimant and declare a person disabled for the grant to be approved.7 The maximum monthly value of the grant is currently R838.
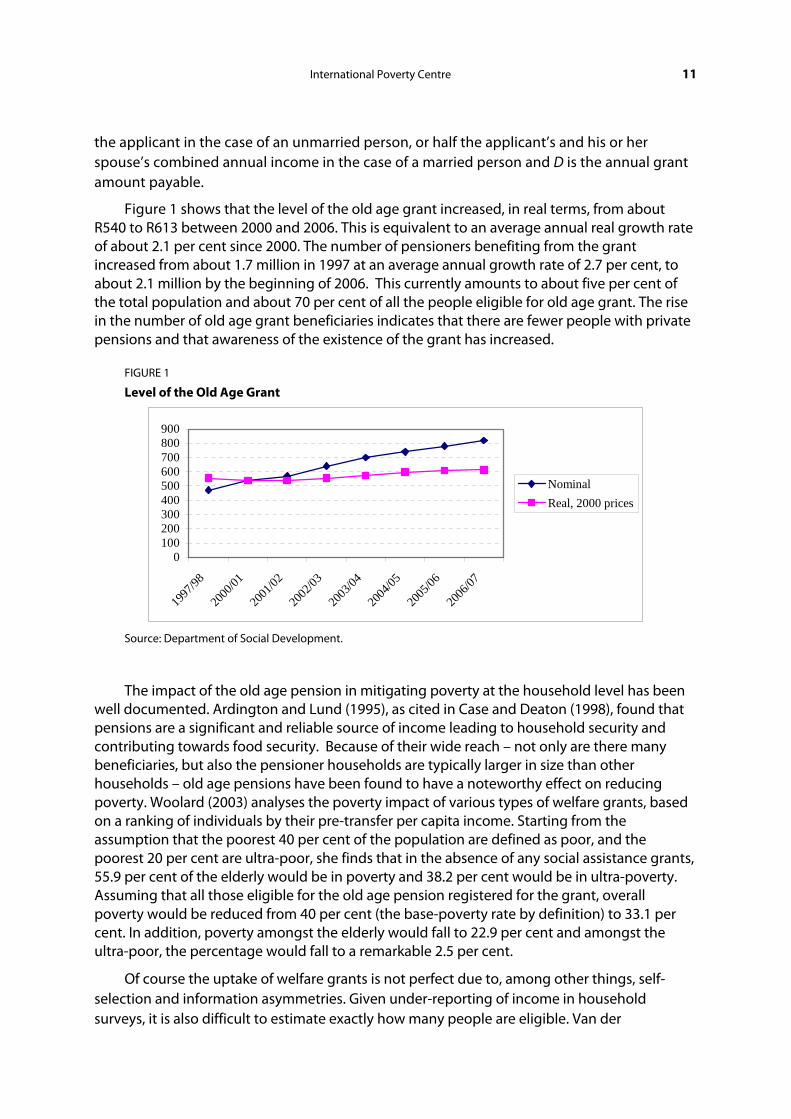
Figure 2 shows that the level of the grant increased from R540 to R626 in real terms between 2000 and 2006, which is equivalent to an average annual real growth rate of about 2.5 per cent. The number of disability grant beneficiaries rose from about 750,000 in 1997 to approximately 1.3 million in 2006, for an average annual growth rate of 7.1 per cent. This number currently amounts to about three per cent of the total population.
FIGURE 2
Level of the Disability Grant
100200300400500600700800900
1997
/98
2000
/01
2001
/02
2002
/03
2003
/04
2004
/05
2005
/06
2006
/07
NominalReal, 2000 prices
Source: Department of Social Development.
International Poverty Centre 13
3.2.3 Child Grants
Over the last five years, government has widened the safety net for children through care dependency, child support and foster care grants. The child support grant was introduced in 1998 with the intention of providing social assistance to children in need. Initially the programme covered only children under seven years of age but was extended to children under 14 years of age in 2005. The child support grant is paid through the primary care caregivers of children who qualify. It is a means tested grant. The means test measures the caregiver’s financial ability to provide the necessary support to children.
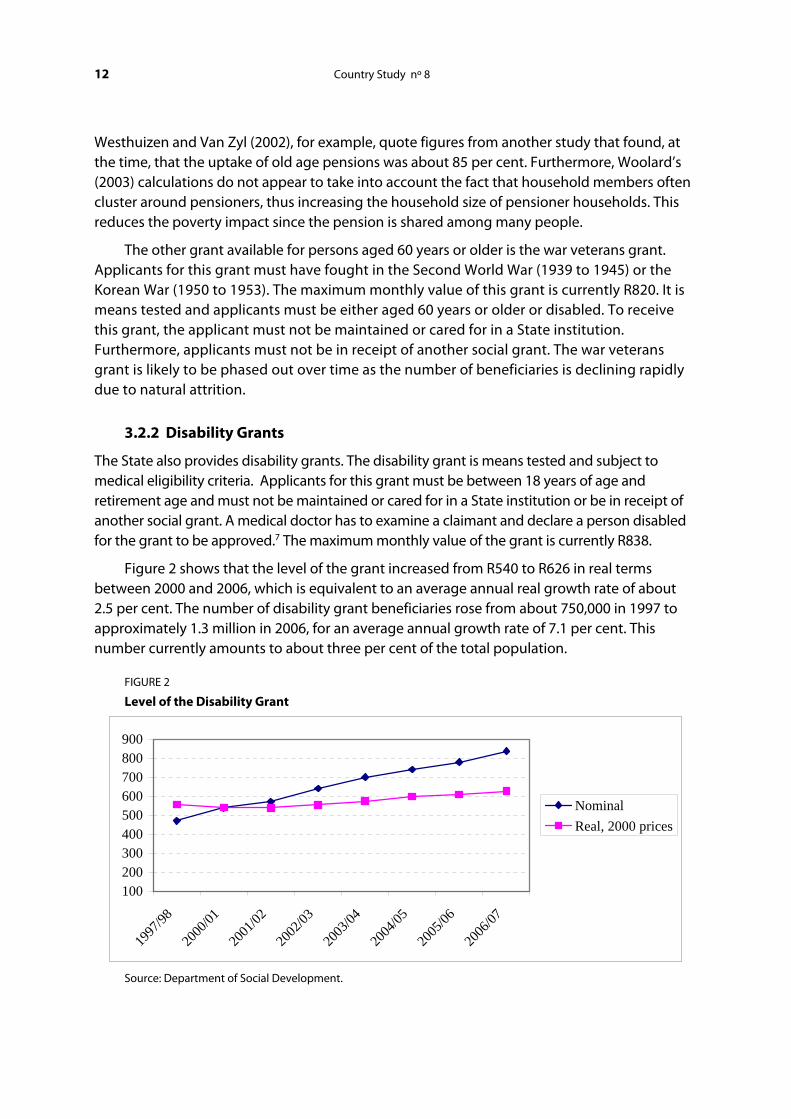
The number of children receiving the grant has increased by about 5.9 million, from just fewer than one million in 2001 to about 6.8 million in 2006. This increase was due to an increasing take-up rate and the extension of the grant to children up to the age of 14 years. The maximum monthly value is currently R190 per child. Figure 3 shows that the level of the child support initially declined from R160 in 1997 to about R100 in 2000, mainly due to the Lund Committee recommendations. However, since then there has been a steady rise in the value of the grant. In real terms, the grant increased from R100 in 2000 to R142 in 2006, which is equivalent to an average annual growth of six per cent. This growth is much higher than that of most of the other grants.
FIGURE 3
Level of the Child Support Grant
020406080
100120140160180200
1997
/98
2000
/01
2001
/02
2002
/03
2003
/04
2004
/05
2005
/06
2006
/07
NominalReal, 2000 prices
Source: Department of Social Development.
Woolard (2003) also estimates the impact of the child support grant. Assuming that all the children eligible for the grant access it and that this money is pooled with all other financial resources (including full uptake of the old age pension), she estimates poverty to be reduced from 33.1 per cent to 28.9 per cent. The impact on child poverty is much larger, with the percentage of children in poverty falling from 42.7 per cent to 34.3 per cent and those children in ultra-poverty from 13.1 per cent to 4.2 per cent.
The care dependency grant is payable to children under 18 years of age, in permanent home care and suffering from severe mental or physical disability. The applicant, spouse and child must meet the requirements of a means test. The care-dependent child must not be
14 Country Study nº 8
permanently cared for in a State institution. The value of the grant is currently R820 per month, while the number of care dependency grant beneficiaries increased by about 84,000 between August 1997 and January 2006.
The foster care grant is provided when a court with relevant jurisdiction is satisfied that a child needs foster care. The child is placed in the custody of a suitable foster parent under the supervision of a social worker. Unlike the other grants, this grant is not means tested because fostering is not considered a poverty issue. The value of the foster care grant is currently R590 per month. The number of grants paid per month rose from about 43,000 in 1997 to almost 300,000 in 2006.
3.3 GOVERNMENT SPENDING ON SOCIAL ASSISTANCE.
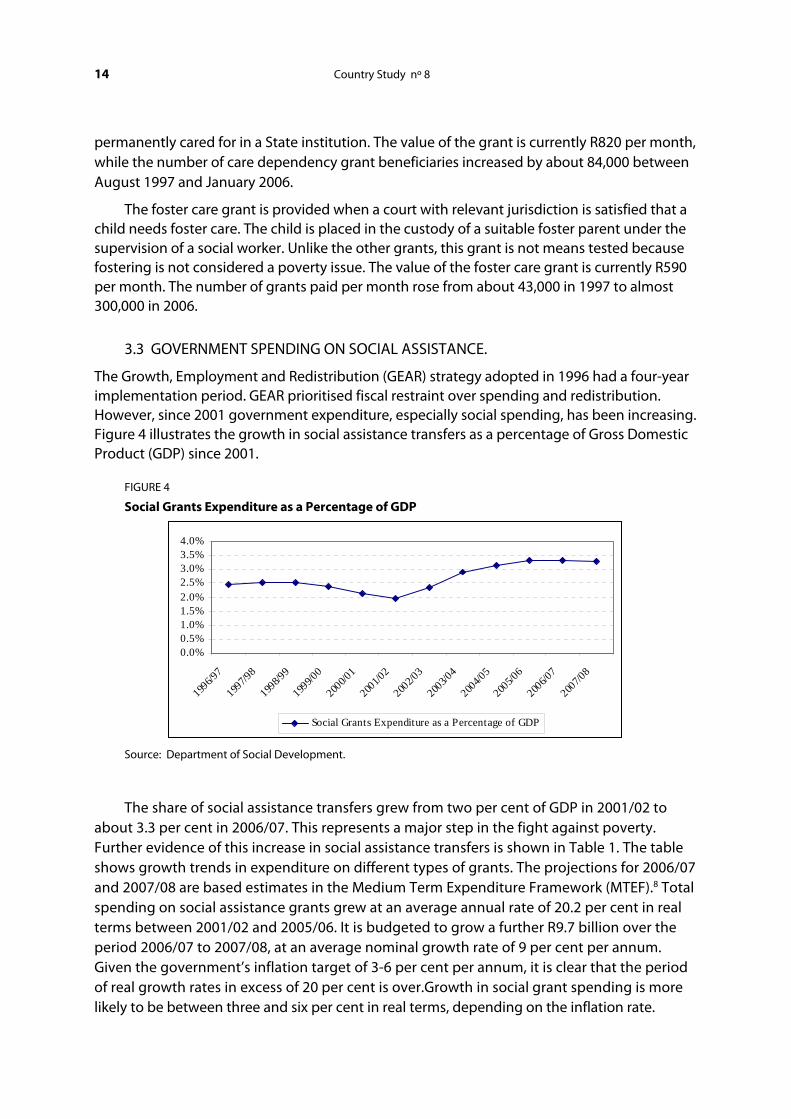
The Growth, Employment and Redistribution (GEAR) strategy adopted in 1996 had a four-year implementation period. GEAR prioritised fiscal restraint over spending and redistribution. However, since 2001 government expenditure, especially social spending, has been increasing. Figure 4 illustrates the growth in social assistance transfers as a percentage of Gross Domestic Product (GDP) since 2001.
FIGURE 4
Social Grants Expenditure as a Percentage of GDP
0.0%0.5%1.0%1.5%2.0%2.5%3.0%3.5%4.0%
1996/9
7
1997/9
8
1998/9
9
1999/0
0
2000/0
1
2001/0
2
2002/0
3
2003/0
4
2004/0
5
2005/0
6
2006/0
7
2007/0
8
Social Grants Expenditure as a Percentage of GDP
Source: Department of Social Development.
The share of social assistance transfers grew from two per cent of GDP in 2001/02 to about 3.3 per cent in 2006/07. This represents a major step in the fight against poverty. Further evidence of this increase in social assistance transfers is shown in Table 1. The table shows growth trends in expenditure on different types of grants. The projections for 2006/07 and 2007/08 are based estimates in the Medium Term Expenditure Framework (MTEF).8 Total spending on social assistance grants grew at an average annual rate of 20.2 per cent in real terms between 2001/02 and 2005/06. It is budgeted to grow a further R9.7 billion over the period 2006/07 to 2007/08, at an average nominal growth rate of 9 per cent per annum. Given the government’s inflation target of 3-6 per cent per annum, it is clear that the period of real growth rates in excess of 20 per cent is over.Growth in social grant spending is more likely to be between three and six per cent in real terms, depending on the inflation rate.

International Poverty Centre 15
TABLE 1
Social Grants Expenditure by Type of Grant, 2001/02 to 2007/08 R million 2001/02 2002/03 2003/04 2004/05 2005/06 2006/07 2007/08
Old age 12954 15285 17146 18504 19996 21443 23105 War veterans 23 27 34 36 29 25 22 Disability 4585 7201 10329 12570 14438 15510 16932 Grant in aid 1 1 2 20 Foster Care 364 787 1142 1563 2044 2340 2712 Care dependency 226 309 639 760 938 1040 1147 Child support 2400 4558 7690 11431 14483 16575 17805
Total 20553 28168 36982 44885 51927 56969 61724
Source: National Treasury (2005).
Over time the share of spending on the child support grant has increased relative to that on other grants (see Figure 5). From Table 1 we can calculate the growth rates of specific types of grants. Whereas total expenditure on pensions increased by about 6.3 per cent in real terms between 2001/02 and 2005/06, spending on foster care, care dependency and child support grants grew by 46.7, 36.1 and 49.4 per cent, respectively. This large high is attributed both to the relatively large increase in the value of the grants, as well as the high growth in the number of recipients. From the MTEF forecasts, it appears that the current composition of welfare spending will remain fairly stable over the next few years, provided that no new programmes or changes in the eligibility criteria of the current programmes are introduced.
FIGURE 5
Composition of Social Spending, 2001/02 to 2007/08
0%
10%
20%
30%
40%
50%
60%
70%
80%
90%
100%
2001
/02
2002
/03
2003
/04
2004
/05
2005
/06
2006
/07
2007
/08
Child supportCare dependencyFoster CareDisability & grant in aidOld age & war veterans
Source: National Treasury (2005).
16 Country Study nº 8
In 1995/96, expenditure on the child grants (child maintenance, foster care and care dependency) accounted for about 12 per cent of the total social grant expenditure (see Alderman, 1999). By 2006/07 this figure had risen to about 35 per cent of the total, while expenditure on pensions, which had accounted for over 63 per cent of the expenditures on social transfers in 1995/96, had fallen to about 37 per cent in 2006/07. This clearly reveals that child grants are becoming the key to the country’s social assistance programmes.
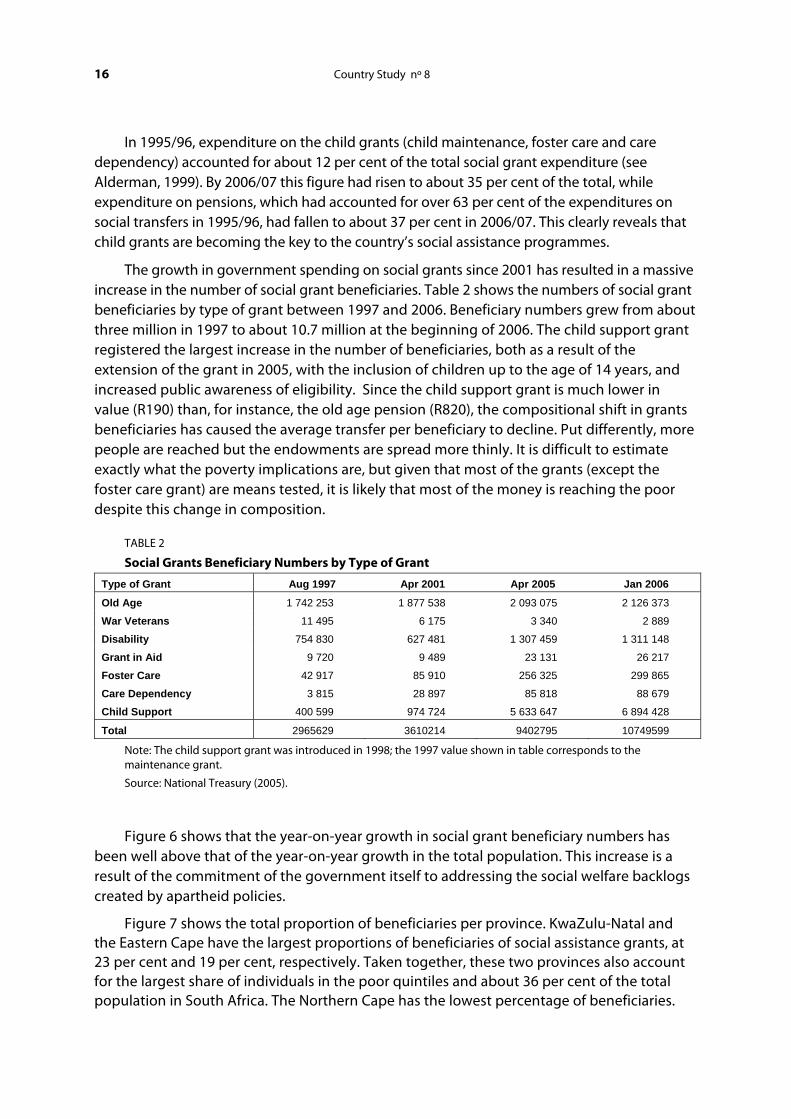
The growth in government spending on social grants since 2001 has resulted in a massive increase in the number of social grant beneficiaries. Table 2 shows the numbers of social grant beneficiaries by type of grant between 1997 and 2006. Beneficiary numbers grew from about three million in 1997 to about 10.7 million at the beginning of 2006. The child support grant registered the largest increase in the number of beneficiaries, both as a result of the extension of the grant in 2005, with the inclusion of children up to the age of 14 years, and increased public awareness of eligibility. Since the child support grant is much lower in value (R190) than, for instance, the old age pension (R820), the compositional shift in grants beneficiaries has caused the average transfer per beneficiary to decline. Put differently, more people are reached but the endowments are spread more thinly. It is difficult to estimate exactly what the poverty implications are, but given that most of the grants (except the foster care grant) are means tested, it is likely that most of the money is reaching the poor despite this change in composition.
TABLE 2
Social Grants Beneficiary Numbers by Type of Grant
Type of Grant Aug 1997 Apr 2001 Apr 2005 Jan 2006
Old Age 1 742 253 1 877 538 2 093 075 2 126 373
War Veterans 11 495 6 175 3 340 2 889
Disability 754 830 627 481 1 307 459 1 311 148
Grant in Aid 9 720 9 489 23 131 26 217
Foster Care 42 917 85 910 256 325 299 865
Care Dependency 3 815 28 897 85 818 88 679
Child Support 400 599 974 724 5 633 647 6 894 428
Total 2965629 3610214 9402795 10749599
Note: The child support grant was introduced in 1998; the 1997 value shown in table corresponds to the maintenance grant.
Source: National Treasury (2005).
Figure 6 shows that the year-on-year growth in social grant beneficiary numbers has been well above that of the year-on-year growth in the total population. This increase is a result of the commitment of the government itself to addressing the social welfare backlogs created by apartheid policies.
Figure 7 shows the total proportion of beneficiaries per province. KwaZulu-Natal and the Eastern Cape have the largest proportions of beneficiaries of social assistance grants, at 23 per cent and 19 per cent, respectively. Taken together, these two provinces also account for the largest share of individuals in the poor quintiles and about 36 per cent of the total population in South Africa. The Northern Cape has the lowest percentage of beneficiaries.

International Poverty Centre 17
This is not surprising because only about two per cent of the total population resides in the Northern Cape.
FIGURE 6
Social Grant Beneficiary Growth and Population Growth, 2001 to 2005
0%5%
10%15%20%25%30%35%40%
2001 2002 2003 2004 2005
Population growth Social grants beneficiary growth
Source: Stats SA mid-year population estimates and Censuses (1996 and 2001) and National Treasury (2005).
FIGURE 7
Total Number of Beneficiaries per Province, Jan 2006
KwaZulu-Natal23%
Mpumalanga9%
North West7%
Northern Cape3%
Gauteng12%
Free State6%
Limpopo14%
Eastern Cape19%
Western Cape7%
Source: Department of Social Development.
3.4 THE BASIC INCOME GRANT DEBATE
Section 4.1 reviews some of the constraints to extending the social welfare system in South Africa. The Basic Income Grant (BIG) debate is an interesting precursor to the discussions in section 4.1 since it highlights many of the concerns that were raised before 2000, when BIG gained widespread support as a welfare policy tool to fight poverty.
South African welfare transfers have always been targeted through means testing. However, in terms of design, welfare transfer coverage excludes poor people of working age who are not disabled or do not have children in their care. Although the State’s Unemployment Insurance Fund (UIF) should theoretically cover all the unemployed poor, in
18 Country Study nº 8
practice it reaches only a small proportion of the unemployed because many of them have never worked and have therefore never been formally registered with the UIF. The Taylor Report (2002) lists a variety of other ‘deficiencies’ in social security provisioning in South Africa (see further discussions in the appendix). These include findings, at the time of the report, that 75 per cent of poor children under the age of seven years were not receiving the child support grant, while the chronically ill often failed to meet the strict medical-based criteria to qualify for the disability grant. The system further excluded non-citizens despite the Constitutional provision that everyone should be entitled to social security.
In addition to these deficiencies in the social security system, poverty remains widespread, with about half the population living below the minimum accepted standard of living.9 A BIG, it is argued, would not only widen the current social welfare provisioning of the State, but would also target the unemployed, thus ensuring that no individual fall through gaps in the system. Since a BIG is not means tested, it would not create disincentives to work. Moreover, it would create additional administrative economies of scale.
Given these apparent advantages of a BIG, the idea quickly gained widespread support. The Congress of South African Trade Unions (COSATU) placed it on the agenda at the Presidential Jobs Summit in 1998. In 2001, a civil society campaign was launched in support of the introduction of a BIG. Likewise, the Taylor Report (2002) gave its support to a BIG, proposing that the grant value be set at R100 per person per month. However, it recommended against immediate implementation, instead favouring a phased implementation.
Although the Taylor Report presented a clear case for a BIG as part of a comprehensive social protection framework, it also questioned the fiscal feasibility of this type of grant. Bhorat (2001) presents evidence suggesting that the cost of the scheme in 1999 would have amounted to 39 per cent of government’s total expenditures and more than double the Department of Social Development’s budget. He further suggests that financing the scheme through the VAT system would mean increasing the VAT rate from 14 to 32 per cent. For the same year, taking the deficit-financing route would cause the budget deficit to balloon from two per cent to approximately nine per cent of GDP.
Thurlow (2002) also expresses doubts concerning the feasibility of a BIG. On the basis of a number of simulations, he concludes that the cost of such a scheme could debilitate the economy, whether financed by raising income and/or sales taxes or by reducing other government expenditures. Thurlow also questions the merits of a universal grant in comparison to a targeted grant and calls for further research. McDonald and Punt (2003) focus more on the issue of targeting in their investigation of the impact of a BIG in the Western Cape province. Their results indicate, ceteris paribus, that when funded exogenously, a BIG can substantially reduce poverty and inequality. However, when funded from tax revenues, the degrees of poverty alleviation tend to be much lower, thus supporting the notion of introducing a targeted grant rather than a universal one. In this regard, McDonald and Punt argue that an ‘enhanced but targeted income grant’ has the potential to achieve a higher degree of poverty alleviation than a universal BIG (2003: 1).
In July 2002, the government spokesman reported that the Cabinet, which had just discussed the Taylor Report, was moving towards an approach somewhat different from that underlying the report: that only the sick and disabled should receive ‘hand-outs’, while able-
International Poverty Centre 19
bodied adults should “enjoy the opportunity, the dignity and the rewards of work” (Matisonn and Seekings, 2001). The strongest opposition to the BIG has come from the National Treasury, which argues that it is unaffordable. Early in 2004 the National Treasury announced that the government’s approach would be to “extend social security and income support through targeted measures” rather than through a universal BIG, an approach regarded by the National Treasury as the “more balanced strategy for social progress and sustainable development” (Manuel, 2004). However, while targeting welfare transfer payments reduces the cost of the transfers, it also leads to high administrative costs and potential administrative complexities. Because South Africa has weak administrative capacity, targeting errors often occur, including the exclusion of individuals who are eligible and the inclusion of beneficiaries who are not.
4 CONSTRAINTS TO EXPANDING THE COVERAGE AND SCOPE OF THE WELFARE GRANT SYSTEM
4.1 FISCAL CONSTRAINTS
Like any other country, South Africa faces budget constraints to expanding fiscal spending. As priorities change, there is sometimes a need to increase spending in certain areas. However, this often comes at the expense of other government functions. South Africa’s budgeting system is based on a rolling budget system adopted in 1998 called the MTEF. It allows the government to plan its spending over a three-year horizon in line with its medium-term policy priorities, taking into account the government’s views on expected economic growth, inflation rate targets and revenue collection. Welfare forms one of the sub-functions of the social services function of government.
Figure 8 shows the welfare budgets from 1995 to 2005 in real terms.10 The dramatic shift observable between the MTEF for 2000 and the subsequent MTEFs is evidence of government’s move away from its initial stance of conservatively increasing social welfare spending in line with inflation.
The GEAR policy strategy followed between 1996 and 2000 aimed to reduce the fiscal deficit, a conservative stance reflected in its spending. Between 1995 and 2000 the welfare budget remained fairly stable in real terms at around R20,000 million. Based on the MTEF projections for 2000, welfare spending was expected to remain stable at this level. However, in the subsequent year there was a significant upward adjustment of the welfare budget to around R30,000 million in real prices. From then on, each revised MTEF made further upward adjustments.
Figure 8 (page 20) clearly shows that welfare was the great beneficiary of very efficient tax collection by SARS. According to the National Treasury, the government could now afford to “embrace a more confident and expansionary vision” (Manuel, 2001). Early evidence (see, for example, Van der Berg et al., 2005 and discussions in section 3.2.3 of this study) indicates that the massive rise in spending on welfare transfers has had a strong impact on poverty. However, with tax overruns of the magnitude seen during the 1990s and early 2000s unlikely to be repeated, since the tax base cannot be extended much further, government certainly cannot rely on such windfalls.

20 Country Study nº 8
FIGURE 8
Welfare Budgets, 1995 – 2005 (2000 prices)
-
10,000
20,000
30,000
40,000
50,000
60,000
70,000
1995/9
6
1996/9
7
1997/9
8
1998/9
9
1999/0
0
2000/0
1
2001/0
2
2002/0
3
2003/0
4
2004/0
5
2005/0
6
2006/0
7
2007/0
8
Fiscal Year
Budg
et (2
000
pric
es)
Budget 1995/96-1997/98
MTEF 1998
MTEF 1999
MTEF 2000
MTEF 2001
MTEF 2002
MTEF 2003
MTEF 2004
MTEF 2005
Source: Based on Budget Reviews published between 1999 and 2005 (National Treasury).
Figure 9, which depicts the expenditure values for the different categories of social services as percentages of the total social services budget from 1995/96 to 2007/08, shows that the increase in welfare spending has inevitably resulted in reductions in the share of spending allocated to education and health. Thus, tax overruns were clearly not the only source of funding for the increased expenditure on social service delivery.
FIGURE 9
Expenditure by Budget Item, as Percentage of Total Social Services Budget
0%10%20%30%40%50%60%70%80%90%
100%
1995
/96
1996
/97
1997
/98
1998
/99
1999
/00
2000
/01
2001
/02
2002
/03
2003
/04
2004
/05
2005
/06
2006
/07
2007
/08
Housing & other
Health
Education
Welfare
Source: Based on Budget Reviews published between 1999 and 2005 (National Treasury).
International Poverty Centre 21
The question now is whether we can afford to continue expanding welfare spending at the rates observed between 2000 and 2006, or whether we will have to return to the more conservative approach followed between 1995 and 2000. The affordability issue is important for the future path of the social security system. The National Treasury noted earlier in 2006 that the “poor could not be taken care of on the basis of tax overruns” since this would be unsustainable (Daniels, 2006). This statement seems to suggest that a more conservative approach is inevitable.
The current government strategy for economic development is called the Accelerated and Shared Growth Initiative of South Africa (ASGISA). Spending on infrastructure development is an integral part of ASGISA, and already plans to improve the transport and electricity provisioning networks have been tabled. This probably has important implications for welfare spending. The central message from government is that more sustainable investment-type spending will be a priority in the future. Consequently, the ‘structural breaks’ in the MTEF welfare budgeting seen between 2001 and 2006 are not likely to be repeated, since government is likely to operate closer to its three-year plans. As shown previously (see Table 1 – page 15) and related discussions), spending on social assistance grants grew at an average annual rate of about 20 per cent in real terms between 2001 and 2006. However, according to the MTEF projections, the average real growth in social grant spending is likely to be between three and six per cent, depending on the inflation rate during this period. The realities of fiscal constraints and budgetary reprioritisation have become evident.
4.2 SERVICE DELIVERY AND CONDITIONAL CASH TRANSFERS
Any expansion of social security provisioning will have implications for service delivery. In South Africa, the Department of Social Development is responsible for administering and disbursing welfare grants via its subsidiary, the South African Social Security Agency (SASSA). If the current welfare grants system is changed or adapted in any of a variety of possible ways, this Department will have to play a central role. Options for expansion include extending current grants to a greater number of beneficiaries by relaxing the eligibility criteria or by introducing additional programmes, such as conditional cash transfers for poor households that are not currently covered by social security grants. Either of these options would imply more applications to be processed and, in the case of conditional grants, the implementation of monitoring and evaluation processes to ensure that beneficiaries comply with the conditions attached to grants.
Conditional grants attached to school attendance and visits to health clinics aim to stimulate the demand for these services. Thus, education and health service provision, the responsibility of the Departments of Education and Health, respectively, would also become directly involved in the social security system. In this section, we therefore briefly consider the current service delivery records of the Departments of Social Development, Education and Health and consider whether these departments would be able to cope with the additional pressure brought on by possible extensions of social security provisioning.
4.2.1 Social Development
In 2001, government entered a period of dramatically stepping up spending on social security. Van der Westhuizen and Van Zyl (2002) report on the findings of a survey on social security

22 Country Study nº 8
capability in South Africa conducted to determine whether government was up to the task of expanding social security at the rate planned. At the time, it was suggested that “the capacity to deliver [was] a greater obstacle to the rollout of grants than the lack of funds” (Van der Westhuizen and Van Zyl, 2002:3). At that stage, the disbursement of grants was administered through the provincial departments, with the national Department of Social Development performing an overall coordination, planning and control function. The survey was conducted among relevant national and provincial departments.
Of the 14 respondents, only three suggested that budgetary constraints played a role, with most stressing non-budget constraints as the more critical obstacle to service delivery. The lack of staff and staff training, the fact that clients (or grant beneficiaries) were widespread, often living in isolated rural areas, and the fact that claimants were not always in possession of proper identification documents were cited as the chief obstacles. The disability grant posed the most problems, given the medical assessment required for payment of the grant. Another problem underlined was a lack of coordination and cooperation with the Department of Health (Van der Westhuizen and Van Zyl, 2002).
On reviewing the last few years, and especially the rapid rise in spending on social welfare transfers, the large increase in the number of beneficiaries and the successful introduction of the child maintenance grant, the Department of Social Development appears to have done a good job. However, there are “some anecdotes that fraud exists at various levels in the [social security] system” (Alderman, 1999). Numerous newspaper articles have lamented the irregularities in the disbursement of social welfare payments, either due to misrepresentation by claimants (e.g., claiming grants on behalf of non-existent or deceased individuals, faking identity documents and lying about income) or to illicit behaviour on the part of government employees.
It now seems that evidence of fraud and corruption in the system is more than anecdotal. The Special Investigations Unit (SIU) and the Department of Social Development recently embarked on a major investigation into fraud and irregularities in the welfare system. According to a media statement by the Department of Social Development (2006), the enormous increase in the number of beneficiaries, especially under the child maintenance grant, as well as readier access to disability grants, has produced more irregularities and incidents of fraud. The losses are ‘conservatively’ estimated at R1.5 billion per annum, or approximately 2.6 per cent of the departmental budget for grants, which is on the order of R56 billion (see Table 1 – page 15) .
Although the Department of Social Development should be commended for the rapid increase in take-up of grants over the past few years, the problems in the system are a concern. In the past, many of these were related to the decentralisation of grants administration, with certain provinces being unable to cope due to their lack of administrative capacity. As a result, the Department of Social Development decided to centralise grants administration with the formation of SASSA in 2004. However, since SASSA only became operational in 2006, the success of this move is as yet unknown. Also, while the SIU investigations are heartening, it is likely to take some time to cleanse the system of corruption and fraud. Thus, given the recent changes in administrative procedures, it may be advisable to consolidate the existing processes before expanding the coverage of existing grants or introducing new types of grants.
International Poverty Centre 23
4.2.2 Education
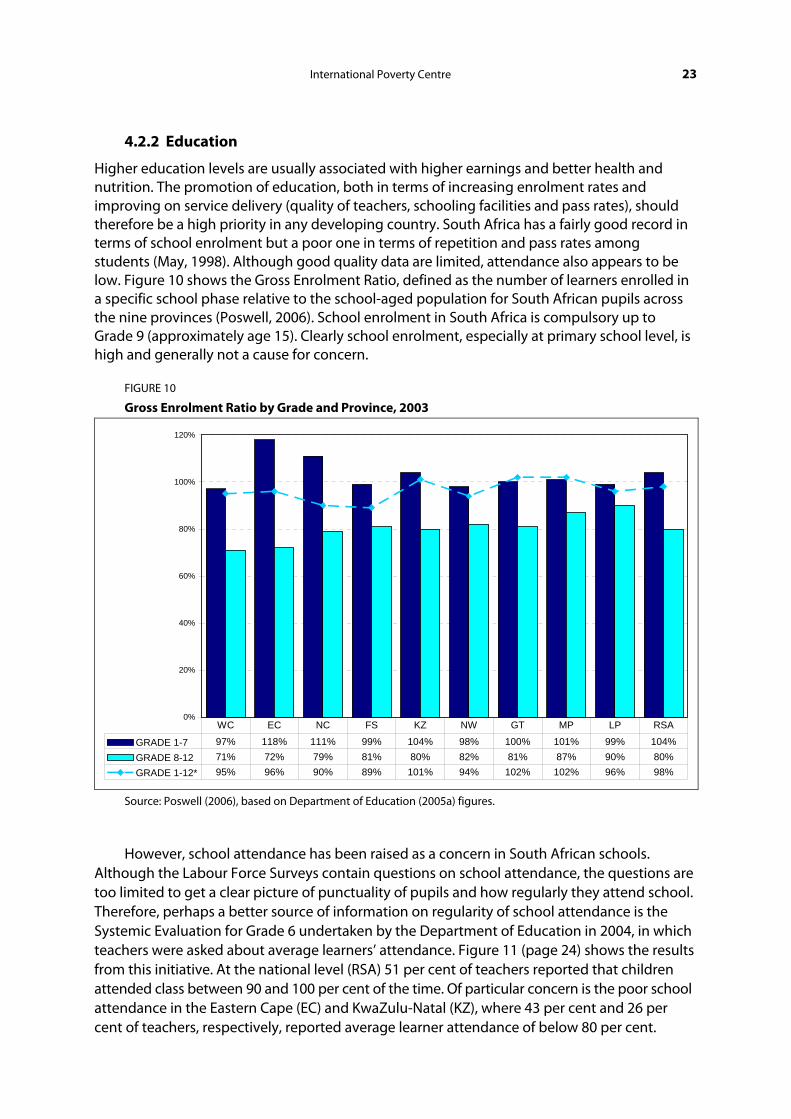
Higher education levels are usually associated with higher earnings and better health and nutrition. The promotion of education, both in terms of increasing enrolment rates and improving on service delivery (quality of teachers, schooling facilities and pass rates), should therefore be a high priority in any developing country. South Africa has a fairly good record in terms of school enrolment but a poor one in terms of repetition and pass rates among students (May, 1998). Although good quality data are limited, attendance also appears to be low. Figure 10 shows the Gross Enrolment Ratio, defined as the number of learners enrolled in a specific school phase relative to the school-aged population for South African pupils across the nine provinces (Poswell, 2006). School enrolment in South Africa is compulsory up to Grade 9 (approximately age 15). Clearly school enrolment, especially at primary school level, is high and generally not a cause for concern.
FIGURE 10
Gross Enrolment Ratio by Grade and Province, 2003
0%
20%
40%
60%
80%
100%
120%
GRADE 1-7 97% 118% 111% 99% 104% 98% 100% 101% 99% 104%GRADE 8-12 71% 72% 79% 81% 80% 82% 81% 87% 90% 80%GRADE 1-12* 95% 96% 90% 89% 101% 94% 102% 102% 96% 98%
WC EC NC FS KZ NW GT MP LP RSA
Source: Poswell (2006), based on Department of Education (2005a) figures.
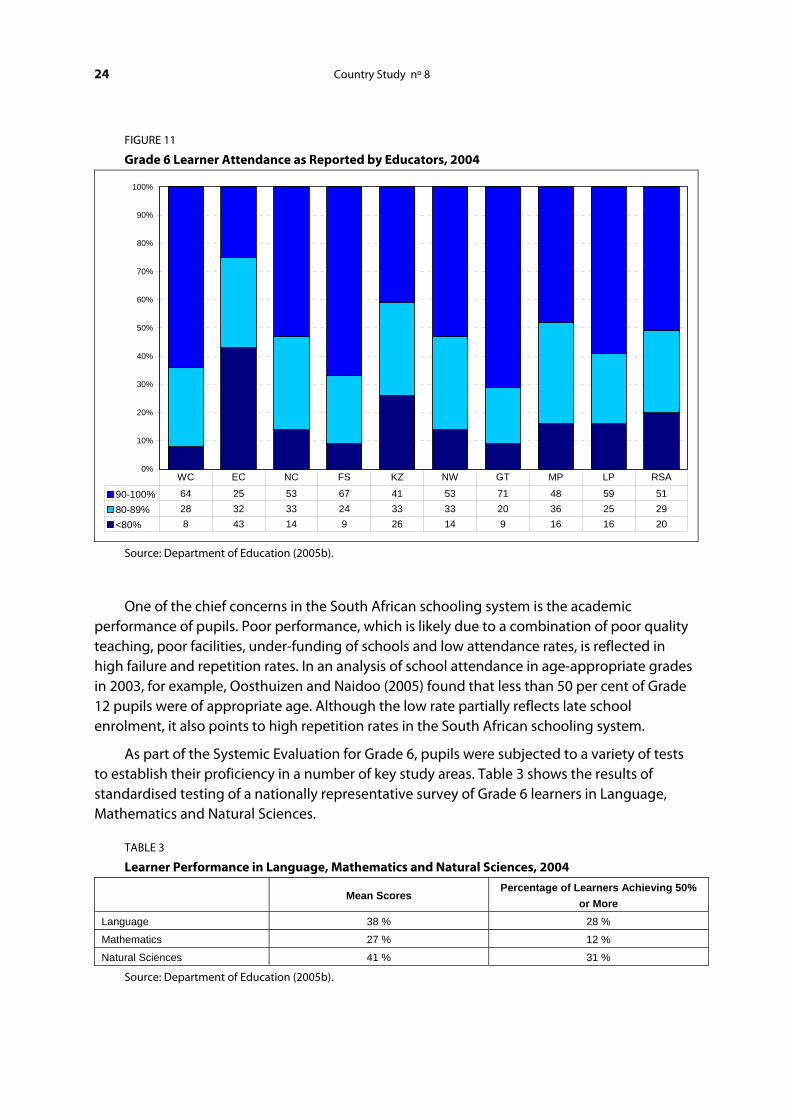
However, school attendance has been raised as a concern in South African schools. Although the Labour Force Surveys contain questions on school attendance, the questions are too limited to get a clear picture of punctuality of pupils and how regularly they attend school. Therefore, perhaps a better source of information on regularity of school attendance is the Systemic Evaluation for Grade 6 undertaken by the Department of Education in 2004, in which teachers were asked about average learners’ attendance. Figure 11 (page 24) shows the results from this initiative. At the national level (RSA) 51 per cent of teachers reported that children attended class between 90 and 100 per cent of the time. Of particular concern is the poor school attendance in the Eastern Cape (EC) and KwaZulu-Natal (KZ), where 43 per cent and 26 per cent of teachers, respectively, reported average learner attendance of below 80 per cent.
24 Country Study nº 8
FIGURE 11
Grade 6 Learner Attendance as Reported by Educators, 2004
0%
10%
20%
30%
40%
50%
60%
70%
80%
90%
100%
90-100% 64 25 53 67 41 53 71 48 59 5180-89% 28 32 33 24 33 33 20 36 25 29<80% 8 43 14 9 26 14 9 16 16 20
WC EC NC FS KZ NW GT MP LP RSA
Source: Department of Education (2005b).
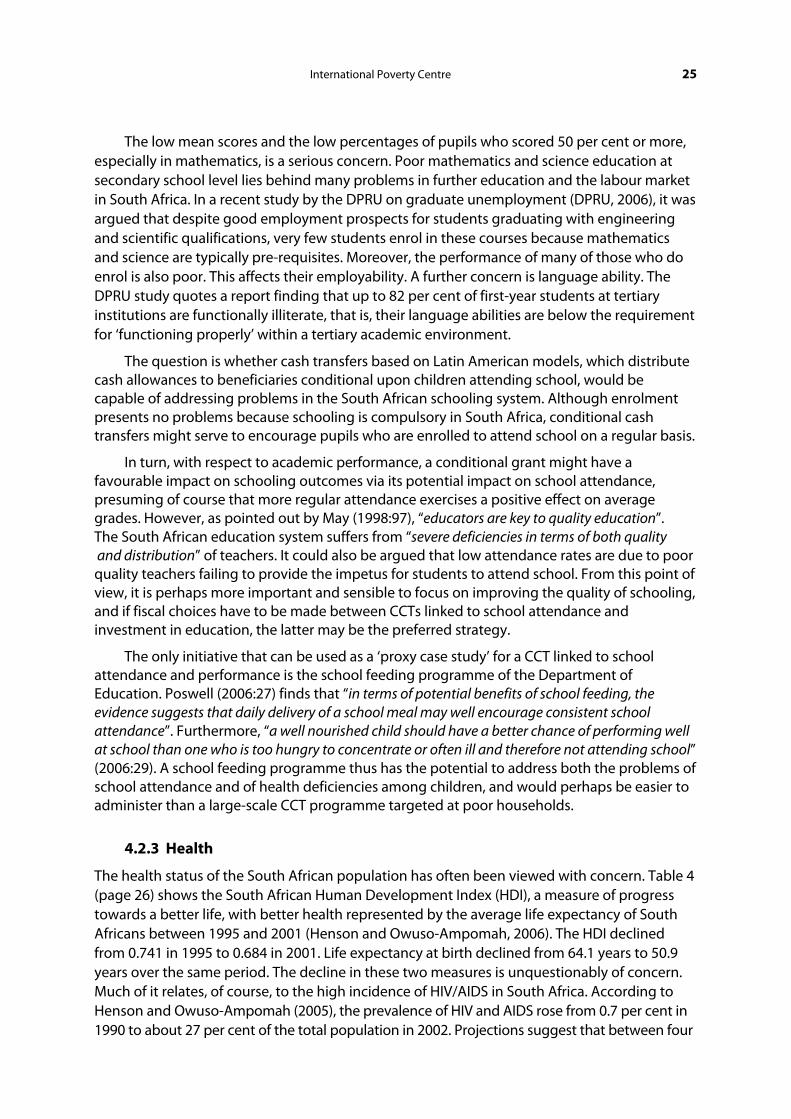
One of the chief concerns in the South African schooling system is the academic performance of pupils. Poor performance, which is likely due to a combination of poor quality teaching, poor facilities, under-funding of schools and low attendance rates, is reflected in high failure and repetition rates. In an analysis of school attendance in age-appropriate grades in 2003, for example, Oosthuizen and Naidoo (2005) found that less than 50 per cent of Grade 12 pupils were of appropriate age. Although the low rate partially reflects late school enrolment, it also points to high repetition rates in the South African schooling system.
As part of the Systemic Evaluation for Grade 6, pupils were subjected to a variety of tests to establish their proficiency in a number of key study areas. Table 3 shows the results of standardised testing of a nationally representative survey of Grade 6 learners in Language, Mathematics and Natural Sciences.
TABLE 3
Learner Performance in Language, Mathematics and Natural Sciences, 2004
Mean Scores Percentage of Learners Achieving 50%
or More Language 38 % 28 %
Mathematics 27 % 12 %
Natural Sciences 41 % 31 %
Source: Department of Education (2005b).
International Poverty Centre 25
The low mean scores and the low percentages of pupils who scored 50 per cent or more, especially in mathematics, is a serious concern. Poor mathematics and science education at secondary school level lies behind many problems in further education and the labour market in South Africa. In a recent study by the DPRU on graduate unemployment (DPRU, 2006), it was argued that despite good employment prospects for students graduating with engineering and scientific qualifications, very few students enrol in these courses because mathematics and science are typically pre-requisites. Moreover, the performance of many of those who do enrol is also poor. This affects their employability. A further concern is language ability. The DPRU study quotes a report finding that up to 82 per cent of first-year students at tertiary institutions are functionally illiterate, that is, their language abilities are below the requirement for ‘functioning properly’ within a tertiary academic environment.
The question is whether cash transfers based on Latin American models, which distribute cash allowances to beneficiaries conditional upon children attending school, would be capable of addressing problems in the South African schooling system. Although enrolment presents no problems because schooling is compulsory in South Africa, conditional cash transfers might serve to encourage pupils who are enrolled to attend school on a regular basis.
In turn, with respect to academic performance, a conditional grant might have a favourable impact on schooling outcomes via its potential impact on school attendance, presuming of course that more regular attendance exercises a positive effect on average grades. However, as pointed out by May (1998:97), “educators are key to quality education”. The South African education system suffers from “severe deficiencies in terms of both quality and distribution” of teachers. It could also be argued that low attendance rates are due to poor quality teachers failing to provide the impetus for students to attend school. From this point of view, it is perhaps more important and sensible to focus on improving the quality of schooling, and if fiscal choices have to be made between CCTs linked to school attendance and investment in education, the latter may be the preferred strategy.
The only initiative that can be used as a ‘proxy case study’ for a CCT linked to school attendance and performance is the school feeding programme of the Department of Education. Poswell (2006:27) finds that “in terms of potential benefits of school feeding, the evidence suggests that daily delivery of a school meal may well encourage consistent school attendance”. Furthermore, “a well nourished child should have a better chance of performing well at school than one who is too hungry to concentrate or often ill and therefore not attending school” (2006:29). A school feeding programme thus has the potential to address both the problems of school attendance and of health deficiencies among children, and would perhaps be easier to administer than a large-scale CCT programme targeted at poor households.
4.2.3 Health
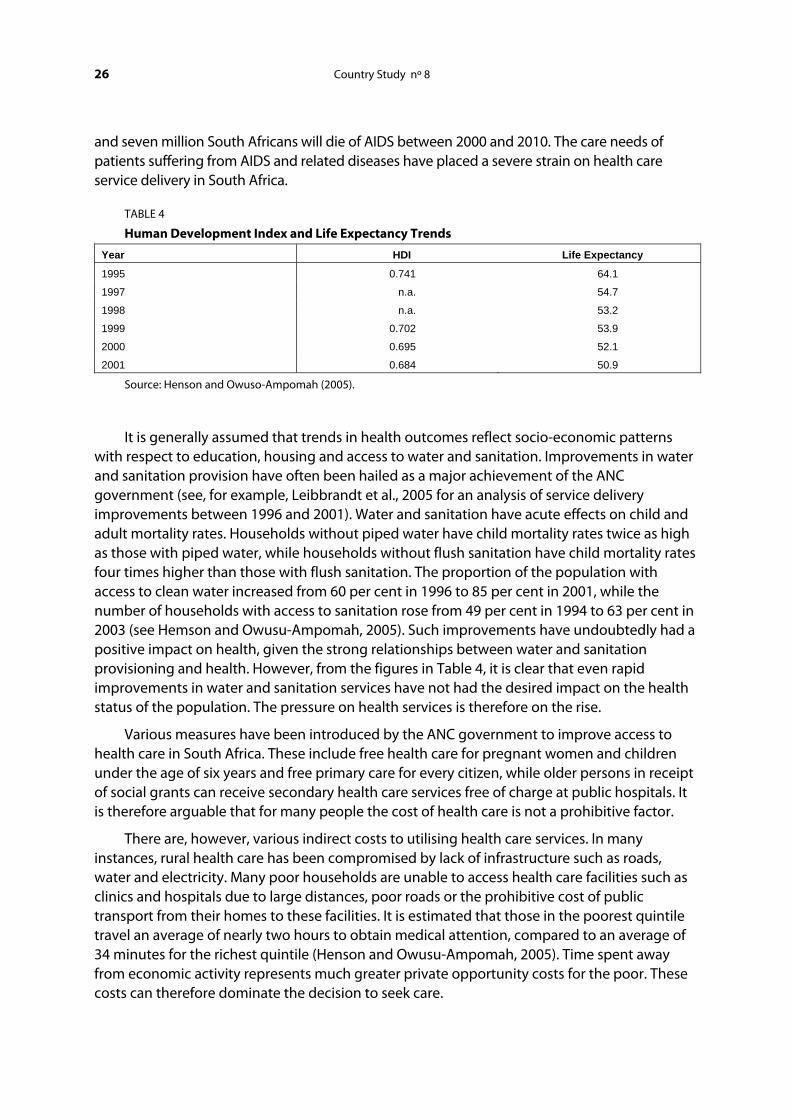
The health status of the South African population has often been viewed with concern. Table 4 (page 26) shows the South African Human Development Index (HDI), a measure of progress towards a better life, with better health represented by the average life expectancy of South Africans between 1995 and 2001 (Henson and Owuso-Ampomah, 2006). The HDI declined from 0.741 in 1995 to 0.684 in 2001. Life expectancy at birth declined from 64.1 years to 50.9 years over the same period. The decline in these two measures is unquestionably of concern. Much of it relates, of course, to the high incidence of HIV/AIDS in South Africa. According to Henson and Owuso-Ampomah (2005), the prevalence of HIV and AIDS rose from 0.7 per cent in 1990 to about 27 per cent of the total population in 2002. Projections suggest that between four
26 Country Study nº 8
and seven million South Africans will die of AIDS between 2000 and 2010. The care needs of patients suffering from AIDS and related diseases have placed a severe strain on health care service delivery in South Africa.
TABLE 4
Human Development Index and Life Expectancy Trends
Year HDI Life Expectancy
1995 0.741 64.1
1997 n.a. 54.7
1998 n.a. 53.2
1999 0.702 53.9
2000 0.695 52.1
2001 0.684 50.9
Source: Henson and Owuso-Ampomah (2005).
It is generally assumed that trends in health outcomes reflect socio-economic patterns with respect to education, housing and access to water and sanitation. Improvements in water and sanitation provision have often been hailed as a major achievement of the ANC government (see, for example, Leibbrandt et al., 2005 for an analysis of service delivery improvements between 1996 and 2001). Water and sanitation have acute effects on child and adult mortality rates. Households without piped water have child mortality rates twice as high as those with piped water, while households without flush sanitation have child mortality rates four times higher than those with flush sanitation. The proportion of the population with access to clean water increased from 60 per cent in 1996 to 85 per cent in 2001, while the number of households with access to sanitation rose from 49 per cent in 1994 to 63 per cent in 2003 (see Hemson and Owusu-Ampomah, 2005). Such improvements have undoubtedly had a positive impact on health, given the strong relationships between water and sanitation provisioning and health. However, from the figures in Table 4, it is clear that even rapid improvements in water and sanitation services have not had the desired impact on the health status of the population. The pressure on health services is therefore on the rise.
Various measures have been introduced by the ANC government to improve access to health care in South Africa. These include free health care for pregnant women and children under the age of six years and free primary care for every citizen, while older persons in receipt of social grants can receive secondary health care services free of charge at public hospitals. It is therefore arguable that for many people the cost of health care is not a prohibitive factor.
There are, however, various indirect costs to utilising health care services. In many instances, rural health care has been compromised by lack of infrastructure such as roads, water and electricity. Many poor households are unable to access health care facilities such as clinics and hospitals due to large distances, poor roads or the prohibitive cost of public transport from their homes to these facilities. It is estimated that those in the poorest quintile travel an average of nearly two hours to obtain medical attention, compared to an average of 34 minutes for the richest quintile (Henson and Owusu-Ampomah, 2005). Time spent away from economic activity represents much greater private opportunity costs for the poor. These costs can therefore dominate the decision to seek care.
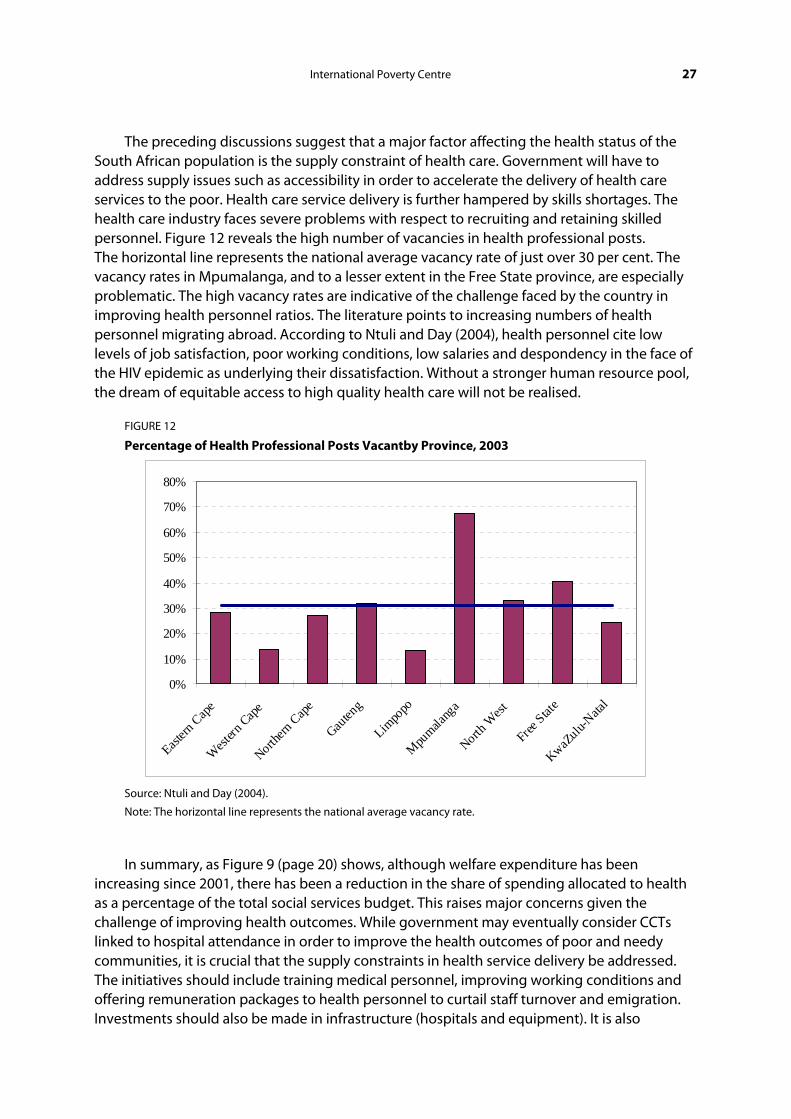
International Poverty Centre 27
The preceding discussions suggest that a major factor affecting the health status of the South African population is the supply constraint of health care. Government will have to address supply issues such as accessibility in order to accelerate the delivery of health care services to the poor. Health care service delivery is further hampered by skills shortages. The health care industry faces severe problems with respect to recruiting and retaining skilled personnel. Figure 12 reveals the high number of vacancies in health professional posts. The horizontal line represents the national average vacancy rate of just over 30 per cent. The vacancy rates in Mpumalanga, and to a lesser extent in the Free State province, are especially problematic. The high vacancy rates are indicative of the challenge faced by the country in improving health personnel ratios. The literature points to increasing numbers of health personnel migrating abroad. According to Ntuli and Day (2004), health personnel cite low levels of job satisfaction, poor working conditions, low salaries and despondency in the face of the HIV epidemic as underlying their dissatisfaction. Without a stronger human resource pool, the dream of equitable access to high quality health care will not be realised.
FIGURE 12
Percentage of Health Professional Posts Vacantby Province, 2003
0%
10%
20%
30%
40%
50%
60%
70%
80%
Eastern
Cape
Western
Cape
Northern
Cape
Gauten
g
Limpo
po
Mpumala
nga
North W
est
Free Stat
e
KwaZulu-
Natal
Source: Ntuli and Day (2004).
Note: The horizontal line represents the national average vacancy rate.
In summary, as Figure 9 (page 20) shows, although welfare expenditure has been increasing since 2001, there has been a reduction in the share of spending allocated to health as a percentage of the total social services budget. This raises major concerns given the challenge of improving health outcomes. While government may eventually consider CCTs linked to hospital attendance in order to improve the health outcomes of poor and needy communities, it is crucial that the supply constraints in health service delivery be addressed. The initiatives should include training medical personnel, improving working conditions and offering remuneration packages to health personnel to curtail staff turnover and emigration. Investments should also be made in infrastructure (hospitals and equipment). It is also
28 Country Study nº 8
important that accessibility to health clinics be facilitated through improved or more affordable transport to clinics, especially in rural areas. Until these supply constraints are addressed, it would be unwise to stimulate the demand for health care further.11
5 CONCLUDING REMARKS
Social security provisioning is important in the fight against chronic poverty in South Africa. A large proportion of the population falls outside the economic mainstream, and given their limited employment probabilities, they are often unlikely to gain from economic growth and new employment opportunities. For this portion of society, welfare grants are an important source of income. The rapid expansion of the social security net between 2000 and 2006 undoubtedly had a strong impact on poverty in South Africa, and though the precise poverty implications are still difficult to determine, the fact that most of the social welfare programmes are means tested suggests that the beneficiaries are largely poor households. Today a sizable share of the population relies on welfare transfers as their primary or secondary source of income.
However, the poverty rate still remains high and many feel that social security provisioning should be expanded further. There are those, however, who question the sustainability of further expanding social security provisioning. Any situation in which a small portion of the population is asked to finance welfare payments for a relatively large portion of the population can be untenable. On surveying the welfare budget trends for the next few years – as forecasted by the MTEF and indicated in recent statements by the National Treasury as to where welfare spending is likely to go – it seems unlikely that the increases in welfare transfers observed between 2001 and 2006 will be repeated. Likewise, the recent launching of ASGISA may confirm a change in the policy stance of the government, which plans to significantly step up infrastructure expenditure since this is regarded as a more sustainable approach to achieving long-term growth and meeting social goals such as job creation and poverty reduction.
Given the success of CCT programmes in other developing countries, especially in Latin America, some are calling for such programmes to be implemented in South Africa. However, at this stage very little research has been done in this area. For a start, it is not clear whether it is necessary to attach conditions to grants that act as incentives for recipients to invest in human capital development. Since very little is known about the spending propensities of the poor, more research is needed on the subject.
For a CCT programme to be implemented successfully in South Africa, the Departments of Social Development, Education and Health would not only have to improve their service delivery records, but also to cooperate very closely. In this Country Study, service delivery issues relating to these three departments have been briefly reviewed and, on the basis of the analysis, certain recommendations have been made with regard to CCT programmes:
• With respect to social service delivery in the Department of Social Development, it is argued that what is most important at this stage is to consolidate the current systems and procedures. Investigations into irregularities should be completed before additional programmes are considered. By the Department’s own admission, any previously existing irregularities were compounded by the rapid expansion of social security provisioning. Hence, further expansions might place
International Poverty Centre 29
too much strain on an already precarious system. The newly instituted SASSA should be given a few years to get the fundamentals in place, establish credibility and improve its service delivery before introducing new programmes, including CCT programmes.
• With regard to education services, it is contended that CCT programmes are unlikely to have a major impact. School enrolment in South Africa is already high because schooling is compulsory up to approximately 15 years of age. Moreover, the incidence of child labour and discrimination against girls (in terms of attending school) is low in South Africa, whereas CCT programmes are often useful where such undesirable labour practices are common. Since the quality of schooling is a concern, it would perhaps be preferable to invest in school infrastructure and the training of more and better teachers rather than promoting higher enrolment or better school attendance. It is crucial to address low functional literacy rates, poor numeracy skills and the low employment prospects of school leavers in South Africa as the chief focus of educational efforts.
• Finally, regarding health services, it is argued in this Country Study that delivery is the concern, and not necessarily the lack of demand for these services. Although CCT may address the affordability of utilising health services – especially indirect costs such as transport costs to and from clinics and the opportunity cost of not working. This study maintains that the health care system in South Africa is not prepared to accommodate additional demand for its services. Training medical personnel, improving working conditions and investing in infrastructure (hospitals and equipment) should be the chief priorities. It is also essential that accessibility to health clinics be enhanced through improved or more affordable transport to clinics, especially in rural areas.
30 Country Study nº 8
APPENDIX
THE TAYLOR REPORT
OVERVIEW
The Taylor inquiry into a comprehensive system of social security for South Africa published its final document in 2002. The inquiry was preceded by the Poverty and Inequality Report (PIR) (May, 1998), which concluded that extreme poverty is likely to act as a deterrent to growth in South Africa. Conversely, the notion that higher growth leads to less poverty and inequality via the ‘trickle-down effect’ of growth has been questioned in recent years. The Taylor Report therefore departs from the premises that “economic development and social protection are mutually reinforcing – essentially they are elements of the same paradigm” (United Nations Commission for Social Development, as cited in Taylor, 2002:44). This implies that there is a cost to not acting or to not addressing social needs in South Africa. In the long run, intervention conducted sooner rather than later may be more prudent both economically and fiscally, despite any fiscal impacts in the short run. As argued in the Report, “the negative social externalities generated by a lack of state action [causes] the society … or the affected communities [to] bear the cost” (Taylor, 2002:44-45). Thisis certainly an undesirable outcome from the political and social points of view.12
The social goals of any government should be to reduce poverty and attain socially acceptable levels of inequality. Government should also provide for people in old age, offer health care to those who cannot afford it and look after the unemployed. However, the Taylor Report finds there are many gaps in the current system. The country’s social safety net was inherited from the apartheid labour and welfare policies, which were racially biased and rested on the assumption that unemployment was a short-term cyclical phenomenon. It was also assumed that the employed could support themselves through work. These views have proven to be false since unemployment has worsened over the last decade due to structural labour market problems, while the existence of many ‘working poor’ suggests that being employed does not necessarily imply escaping poverty (Taylor, 2002:15).
The Social Assistance Act makes provision for various types of ‘non-contributory social assistance’ packages (see Taylor, 2002:30-31). These include (1) assistance to the aged (women over the age of 60 years and men over the age of 65), (2) assistance to medically-diagnosed disabled persons, (3) assistance to foster care families, (4) a care dependency grant and (5) a child support grant. Despite this seemingly comprehensive coverage, the following remain without benefits under the current system:
• Children: 75 per cent of the poor under seven years of age fail to receive the child support grant and those over seven receive no support. Likewise, children without primary caregivers and those belonging to child-headed households receive no grants.
• Disabled: The chronically ill often fail to meet the strict medically based criteria required to qualify for the disabled grant.
• Unemployed: The Unemployment Insurance Fund (UIF) covers only five per cent of the unemployed.

International Poverty Centre 31
• Poverty: Approximately 60 per cent of the poor receive no income support.
• Non-citizens: The current system excludes non-citizens despite the Constitutional provision that ‘everyone’ should be entitled to social security.
Contribution-funded social insurance covers a relatively small number of persons in South Africa. Since the schemes are normally attached to formal employment, an increasing number are largely excluded. Also, the better paid typically secure the larger share of the benefits. Another problem with contribution-funded schemes is that, since public benefits are fairly limited, many of the costs are passed onto employers, thus increasing the non-wage cost of employment. This leads to more indirect employment, such as the hiring of contract or temporary workers and casualisation.13 Thus, in addition to providing security for the poor and the unemployed, a comprehensive social security program has to attend to the needs of two sets of the employed, namely, workers who are employed informally and the poor who are employed in the formal sector of the economy but excluded from the rewards attached to this sector (Taylor, 2002:35).
32 Country Study nº 8
REFERENCES
Alderman, H. (1999). "Safety Nets and Income Transfers in South Africa." South Africa: Poverty and Inequality, Informal Discussion Paper Series 19335. World Bank. February 1999.
Ardington, E. and Lund, F. (1995). "Pensions and Development: Social Security as Complemenatary to Programmes of Reconstruction and Development." Development Southern Africa, 12(4).
Bhorat, H. (1995). "The South African Social Safety Net: Past, Present and Future," Development Southern Africa, Vol. 12.
Bhorat, H. (2001). "A Universal Income Grant Scheme for South Africa: An Empirical Assessment." In A Basic Income Grant for South Africa, edited by Standing, G. and Samson, M. University of Cape Town Press.
Britto, T. (2006). "Conditional Cash Transfers in Latin America." Poverty in Focus. International Poverty Centre, United Nations Development Programme. June 2006.
Case, A. and Deaton, A. (1998). "Large Cash Transfers to the Elderly in South Africa." Economic Journal, 108(450): 1330-1361.
Chandra, V., Moorty, L., Rajaratnam, B. and Schaefer, K. (2001). "Constraints to Growth and Employment in South Africa. Report No. 1: Statistics from the Large Manufacturing Firm Survey." Informal Discussion Papers on Aspects of the Economy of South Africa, No. 14.
Daniels, L. (2006). "Social Grant System Can't Be Sustained." The Mercury. 21 August 2006.
Das, J., Do, Q. and Özler, B. (2004). "Conditional Cash Transfers and the Equity-Efficiency Debate." World Bank. 19 April 2004.
De Janvry, A., Finan, F., Sadoulet, E., Nelson, D., Lindert, K., De la Briére, B. and Lanjouw, P. (2005). "Brazil's Bolsa Escola Program: The Role of Local Governance in Decentralized Implementation." Social Protection Discussion Paper, No. 0542. World Bank. December 2005.
Department of Education (2005a). "Education Statistics in South Africa at a Glance in 2005." Department of Education, Pretoria. December 2005. Available online at http://www.education.gov.za/.
Department of Education (2005b). "Grade 6 Systemic Evaluation: National." Commissioned by the Department of Education. December 2005. Available online at www.education.gov.za.
Department of Social Development (2006). "Significant Progress Made in Social Grants Anti-fraud Campaign." Media Statement. 20 July 2006.
Department of Welfare (1997). White Paper for Social Welfare: Principles, Guidelines, Recommendations, Proposed Policies and Programmes for Developmental Social Welfare in South Africa. Pretoria: Government Printers.
DFID (2006). "Using Social Transfers to Improve Human Development." Social Protection Briefing Note Series, No. 3. Department for International Development. February 2006.
DPRU (2006). "Graduate Unemployment in Post-Apartheid South Africa: Nature and Possible Policy Responses." Research Report Compiled for Business Leadership South Africa. Development Policy Research Unit, University of Cape Town. March 2006.

International Poverty Centre 33
Duflo, E. (2003). "Grandmothers and Granddaughters: Old age Pensions and Intrahousehold Allocation in South Africa." The World Bank Economic Review, 17(1): 1-25.
Gertler, P. (2005). "The Impact of Conditional Cash Transfers on Human Development Outcomes: A review of Evidence from PROGRESA in Mexico and Some Implications for Policy Debates in South and Southern Africa." Paper presented at the South African Regional Poverty Network Meeting, Pretoria, 27 January 2005.
Haarmann, C. (2001). "Poverty and Current Social Assistance Programmes in South Africa." Published online by the University of Cape Town.
Hemson, D. and Owusu-Ampomah, K. (2005). "A Better Life for All? Service Delivery and Poverty Alleviation." In State of the Nation: South Africa 2004-2005, edited by Daniel, J., Southall, R. and Lutchman, J. Cape Town: Human Sciences Research Council Press.
Leibbrandt, M., Poswell, L., Naidoo, P., Welch, M. and Woolard, I. (2005). "Measuring Recent Changes in South Africa Inequality and Poverty Using 1996 and 2001 Census Data." Centre for Social Science Research Working Paper No. 84, Cape Town. August 2005.
Manuel, T. (2001). Budget Speech, National Treasury. 21 February 2001.
Manuel, T. (2004). Budget Speech, National Treasury. 18 March 2004.
Matisonn, H. and Seekings, J. (2001). "The Politics of a Basic Income Grant in South Africa, 1996-2002." In A Basic Income Grant for South Africa, edited by Standing, G. and Samson, M. University of Cape Town Press.
May, J. (1998). "Poverty and Inequality in South Africa." Report prepared for the Office of the Executive Deputy President and the Inter-Ministerial Committee for Poverty and Inequality.
McDonald, S. and Punt, C. (2003). "The Impact of the Proposed Basic Income Grant on the Western Cape." Paper presented at the 6th Annual Conference on Global Economic Analysis, Scheveningen, The Hague, The Netherlands, 12-14 June 2003.
Midgley, J. (1996). "Challenges Facing Social Security." In Challenges to Social Security: An International Exploration, edited by Midgley, J. and Martin, T. London: Auborn House.
Mkandawire, T. (2006). "Targeting and Universalism in Poverty Reduction," Poverty In Focus. International Poverty Centre, United Nations Development Programme. June 2006.
National Treasury (2005). "Provincial Budgets and Expenditure Review: 2001/02-2007/08." Available online at www.treasury.gov.za.
Nattrass, N. (2000). "The Debate about Unemployment in the 1990s." Studies in Economics and Econometrics, 24(3): 73-90.
Ntuli, A. and Day, C. (2004). "Ten Years On - Have We Got What We Ordered?" In South African Health Review 2003/2004, edited by Ijumba, P., Day, C. and Ntuli, A. Durban: Health Systems Trust.
Oosthuizen, M. and Naidoo, P. (2005). "Change in Education: Evidence from National Household Surveys." Commissioned by The Education Foundation Trust, Development Policy Research Unit, University of Cape Town. February 2005.
34 Country Study nº 8
Poswell, L. (2006). "Report on the National School Feeding Scheme: Evaluation Methodologies." Unpublished Research Report. Development Policy Research Unit and South African Labour and Development Research Unit, University of Cape Town. 5 May 2006.
Rawlings, L. (2004). "A New Approach to Social Assistance: Latin America's Experience with Conditional Cash Transfer Programs." Social Protection Discussion Paper Series, No. 0416. Human Development Network, The World Bank. August 2004.
Taylor, V. (2002). "Transforming the Present - Protecting the Future." Report of the Committee of Inquiry into a Comprehensive System of Social Security for South Africa.
Thurlow, J. (2002). "Can South Africa Afford to Become Africa's First Welfare State?" Trade and Macroeconomics Division Discussion Paper, No. 101. International Food Policy Research Institute (IFPRI).
Van der Berg, S. (2002). "Issues In South African Social Security." Stellenbosch Economic Working Papers. University of Stellenbosch.
Van der Berg, S., Burger, R., Burger, R., Louw, M. and Yu, D. (2005). "Trends in Poverty and Inequality since the Political Transition." Paper presented at the TIPS/DPRU Forum 2005. Glenburn Lodge, Gauteng, 30 November-1 December 2005.
Van der Westhuizen, C. and Van Zyl, A. (2002). "Obstacles to the Delivery of Social Security Grants." Budget Brief, No. 110. IDASA Budget Information Service, October 2002.
Veras, F., Soares, S., Madeiros, S. and Osório, R. (2006). "Cash Transfer Programmes in Brazil: Impacts on Inequality and Poverty." International Poverty Centre Working Paper, No. 21. United Nations Development Programme. June 2006.
Woolard, I. (2003). "Impact of Government Programmes Using Administrative Data Sets: Social Assistance Grants." Project 6.2 of the Ten Year Review Research Programme. June 2003. Available online at www.sarpn.org.za.
.
.
NOTES
1. An overview of the Taylor Report is presented in the appendix.
2. Published on the Social Protection Sector’s website, which can be accessed at www.worldbank.org/sp.
3. At the time of writing, one Brazilian Real (R$) was equivalent to R3.66 (South African Rand) and $0.46 (US Dollar) (http://www.x-rates.com).
4. Families might be forced to abandon or hand over children into the care of others (requiring a more expensive foster care grant) or into the care of the State.
5. The grant was extended to children under 14 years of age in 2005.
6. For a discussion on the Lund Committee and its recommendations, see May, 1998.
7. According to Taylor (2002), the strict medical-based criteria to qualify for the disabled grant often fail to be met by the chronically ill, thus causing many of the disabled poor to be excluded from receiving the grant.
8. These are three-year rolling budgets used by all government departments in South Africa.
9. Estimates of the poverty headcount ratio in South Africa vary, depending on the data and the poverty line used. However, most researchers agree that a plausible poverty line (in 2000 prices) lies somewhere between R3 000 and R4 000 per capita per annum, which translates to a poverty headcount rate of roughly 50 per cent.
10. Nominal budgets from various Budget Reviews were adjusted for inflation using the CPI.
11. The increase in social transfers has to a large extent been financed by a substitution between social budgets (education and health) and transfer budgets. This means that the supply of education and health will be affected by this substitution. Further research is needed to identify any signs of deterioration in the quality and quantity of the education and health supplies as a result of this substitution.
12. Interestingly, Thurlow (2002) asks whether South Africa can afford to become a welfare state. In the light of the Taylor Report, one can almost ask, “Can we afford not to become a welfare state?” In his paper, Thurlow admittedly questions the fiscal feasibility of a comprehensive non-targeted Basic Income Grant. The question therefore concerns the appropriate design of a welfare system given the short-term budgetary constraints.
13. Nattrass (2000) argues that the regulation of the labour market since 1994 has impacted on employment levels by increasing the non-wage cost of employing labour. In a recent survey of 325 large South African manufacturing firms, managers indicated that, in response to new labour market legislation (Labour Relations Act (1996), the Basic Conditions of Employment Act (1997), the Employment Equity Act (1998) and the Skills Development Levy (1998)), they were hiring fewer workers, substituting capital for labour when expanding, hiring more temporary workers as opposed to permanent workers and relying on sub-contracting (Chandra et al., 2001).

International Poverty CentreSBS – Ed. BNDES,10o andar70076 900 Brasilia DFBrazil
povertycentre@undp-povertycentre.orgwww.undp-povertycentre.orgTelephone +55 61 2105 5000Fax +55 61 2105 5001