p45 lrc circuit - yonsei universityphylab.yonsei.ac.kr/exp_ref/pasco/p45_lrcc.pdf · experiment...
TRANSCRIPT
PASCO scientific Vol. 2 Physics Lab Manual: P45 - 1Science Workshop LRC Circuit
dg ©1996, PASCO scientific P45 - 1
Experiment P45: LRC Circuit(Power Amplifier, Voltage Sensor)
Concept Time SW Interface Macintosh® file Windows® filecircuits 30 m 700 P45 LRC Circuit P45_LRCC.SWS
EQUIPMENT NEEDED FROM AC/DC ELECTRONICS LAB*• Science Workshop Interface • capacitor, 100 microfarad (100 µF)• Power Amplifier • inductor coil and iron core• Voltage Sensor • resistor, 10 ohm (10 Ω)• graph paper (optional) • wire lead, 5 inch• (2) Patch Cords• LCR Meter (optional)
(*The AC/DC Electronics Laboratory is PASCO EM-8656.)
PURPOSE
The purpose of this laboratory activity is to study resonance in an inductor-resistor-capacitorcircuit (LRC circuit) by examining the current through the circuit as a function of the frequencyof the applied voltage.
THEORY
The amplitude of the AC current (Io) in a series LRC circuit is dependent on the amplitude of theapplied voltage (Vo) and the impedance (Z).
Io = Vo
Z
Since the impedance depends on frequency, the current varies with frequency:
Z = XL − XC( )2 + R2
where XL = inductive reactance = ωL, XC = capacitive reactance = 1
ωC, R = resistance, and ω =
angular frequency = 2πν (ν = linear frequency). The current will be maximum when the circuit isdriven at its resonant frequency:
ω res = 1LC
One can show that, at resonance, XL = XC and thus the impedance (Z) is equal to R. Atresonance, the impedance is the lowest value possible and the current will be the largest valuepossible.
P45 - 2: Physics Lab Manual Vol. 2 PASCO scientificLRC Circuit Science Workshop
P45 - 2 ©1996, PASCO scientific dg
PROCEDURE
In this activity the Power Amplifier produces an alternating current through the LRC circuit. Theamplitude of the current depends on the impedance in the circuit, which varies with frequency.The Signal Generator controls the frequency. If the current is a maximum at the resonantfrequency and is less than maximum for greater or lesser frequencies, the current should peak atthe resonant frequency. The current can be determined from the ratio of the resistor voltage to theresistance. The Voltage Sensor measures the voltage drop (potential difference) across theresistor in the circuit.
You will use the Signal Generator to change the frequency of the applied voltage. You willinvestigate the phase relationship between the applied voltage and the resistor voltage as youvary the frequency. You will also determine the amplitude of the current through the resistor andthen plot current vs. frequency. The Science Workshop program collects and displays both theapplied voltage and the resistor voltage.
You will compare the theoretical resonant frequency to your measured resonant frequency.
PART IA: Computer Setup
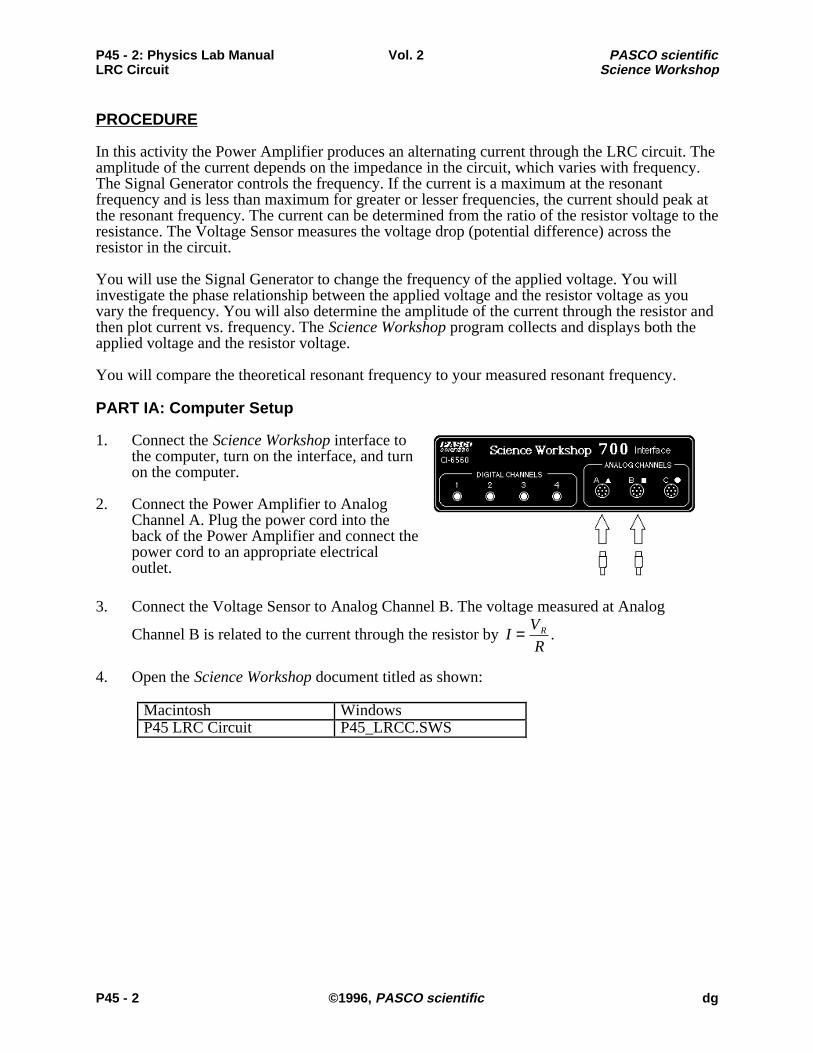
1. Connect the Science Workshop interface tothe computer, turn on the interface, and turnon the computer.
2. Connect the Power Amplifier to AnalogChannel A. Plug the power cord into theback of the Power Amplifier and connect thepower cord to an appropriate electricaloutlet.
3. Connect the Voltage Sensor to Analog Channel B. The voltage measured at Analog
Channel B is related to the current through the resistor by I = VR
R.
4. Open the Science Workshop document titled as shown:
Macintosh WindowsP45 LRC Circuit P45_LRCC.SWS
PASCO scientific Vol. 2 Physics Lab Manual: P45 - 3Science Workshop LRC Circuit
dg ©1996, PASCO scientific P45 - 3
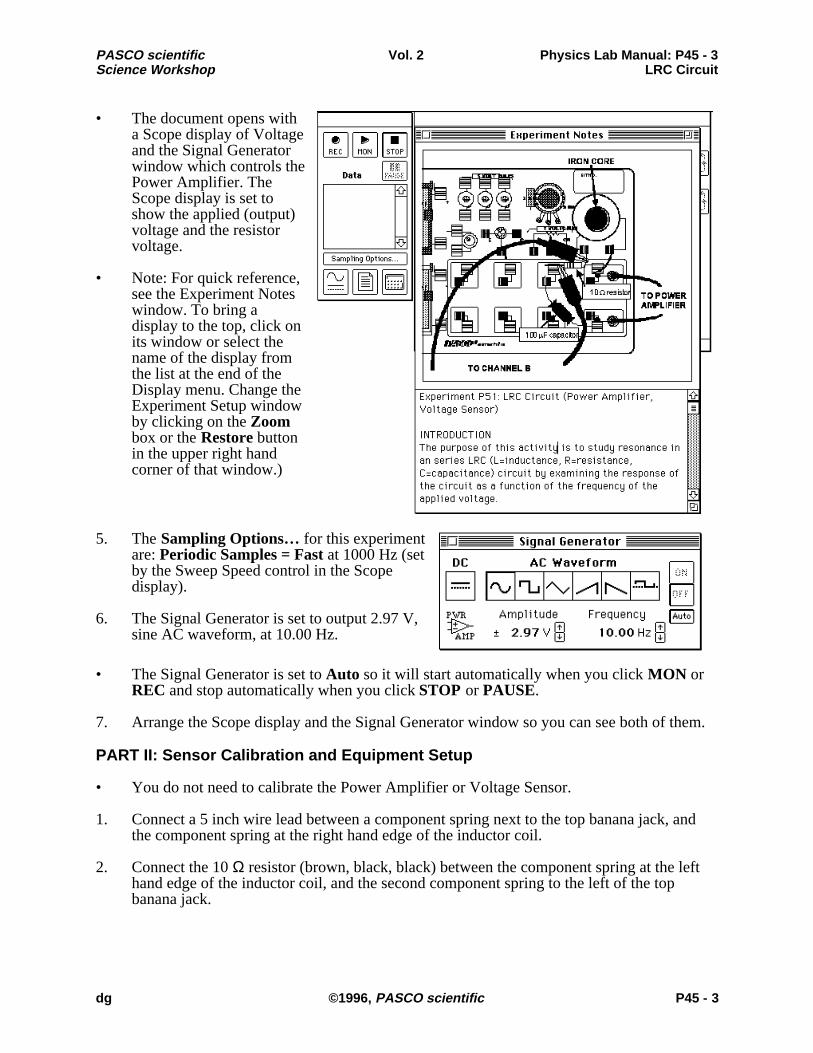
• The document opens witha Scope display of Voltageand the Signal Generatorwindow which controls thePower Amplifier. TheScope display is set toshow the applied (output)voltage and the resistorvoltage.
• Note: For quick reference,see the Experiment Noteswindow. To bring adisplay to the top, click onits window or select thename of the display fromthe list at the end of theDisplay menu. Change theExperiment Setup windowby clicking on the Zoombox or the Restore buttonin the upper right handcorner of that window.)
5. The Sampling Options… for this experimentare: Periodic Samples = Fast at 1000 Hz (setby the Sweep Speed control in the Scopedisplay).
6. The Signal Generator is set to output 2.97 V,sine AC waveform, at 10.00 Hz.
• The Signal Generator is set to Auto so it will start automatically when you click MON orREC and stop automatically when you click STOP or PAUSE.
7. Arrange the Scope display and the Signal Generator window so you can see both of them.
PART II: Sensor Calibration and Equipment Setup
• You do not need to calibrate the Power Amplifier or Voltage Sensor.
1. Connect a 5 inch wire lead between a component spring next to the top banana jack, andthe component spring at the right hand edge of the inductor coil.
2. Connect the 10 Ω resistor (brown, black, black) between the component spring at the lefthand edge of the inductor coil, and the second component spring to the left of the topbanana jack.
P45 - 4: Physics Lab Manual Vol. 2 PASCO scientificLRC Circuit Science Workshop
P45 - 4 ©1996, PASCO scientific dg
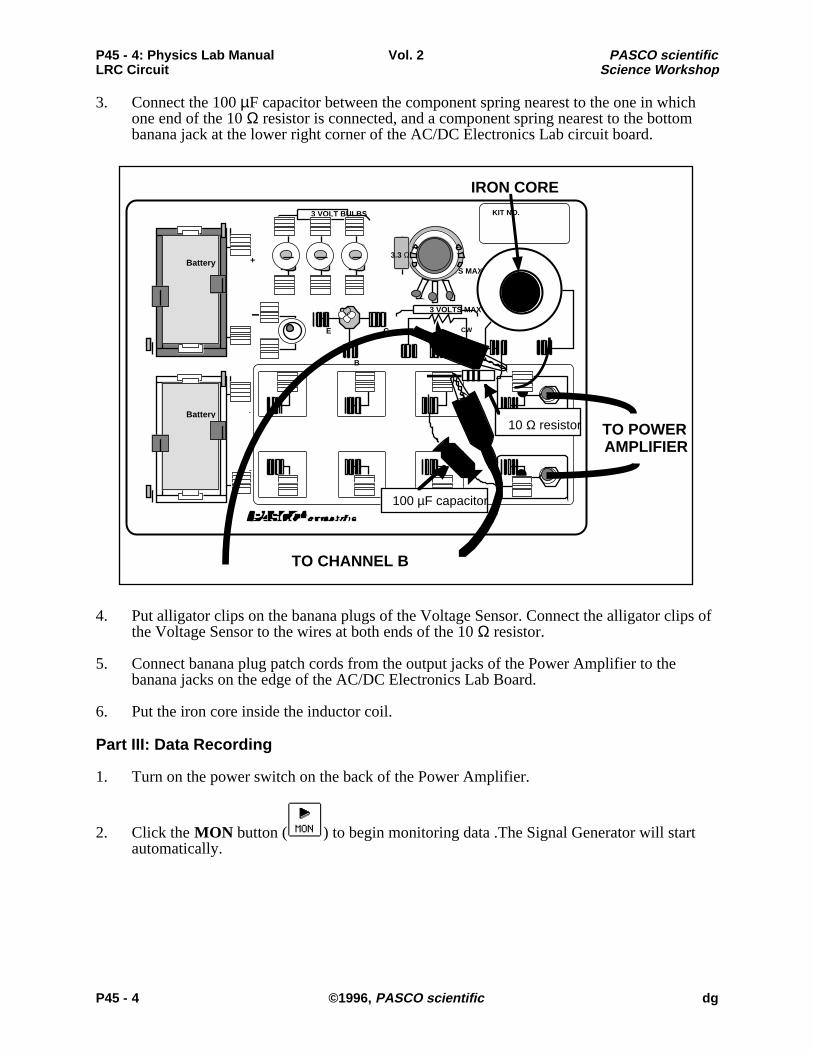
3. Connect the 100 µF capacitor between the component spring nearest to the one in whichone end of the 10 Ω resistor is connected, and a component spring nearest to the bottombanana jack at the lower right corner of the AC/DC Electronics Lab circuit board.
TO POWERAMPLIFIER
TO CHANNEL B
3 VOLTS MAX
CW
3 VOLT BULBS
A B C
KIT NO.
–
+
–
+
Battery
B
E
3 VOLTS MAX
C
Battery
3.3 Ω
100 µF capacitor
10 Ω resistor
IRON CORE
4. Put alligator clips on the banana plugs of the Voltage Sensor. Connect the alligator clips ofthe Voltage Sensor to the wires at both ends of the 10 Ω resistor.
5. Connect banana plug patch cords from the output jacks of the Power Amplifier to thebanana jacks on the edge of the AC/DC Electronics Lab Board.
6. Put the iron core inside the inductor coil.
Part III: Data Recording
1. Turn on the power switch on the back of the Power Amplifier.
2. Click the MON button ( ) to begin monitoring data .The Signal Generator will startautomatically.
PASCO scientific Vol. 2 Physics Lab Manual: P45 - 5Science Workshop LRC Circuit
dg ©1996, PASCO scientific P45 - 5
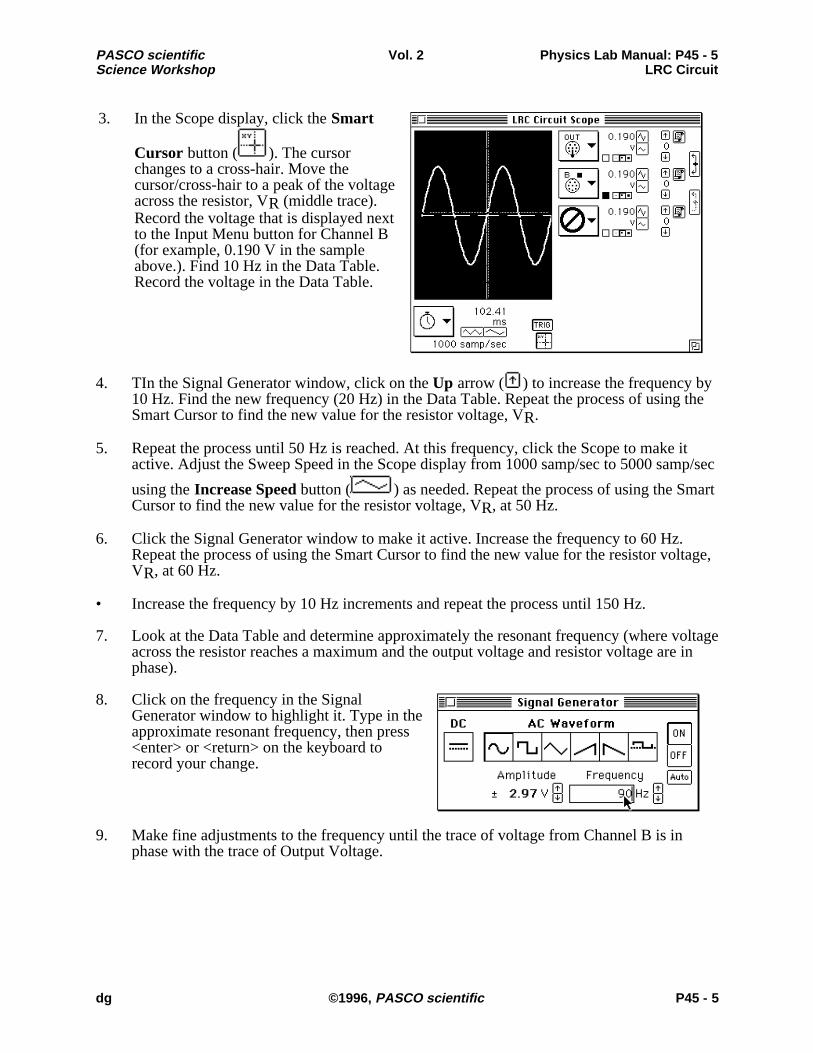
3. In the Scope display, click the Smart
Cursor button ( ). The cursorchanges to a cross-hair. Move thecursor/cross-hair to a peak of the voltageacross the resistor, VR (middle trace).Record the voltage that is displayed nextto the Input Menu button for Channel B(for example, 0.190 V in the sampleabove.). Find 10 Hz in the Data Table.Record the voltage in the Data Table.
4. TIn the Signal Generator window, click on the Up arrow ( ) to increase the frequency by10 Hz. Find the new frequency (20 Hz) in the Data Table. Repeat the process of using theSmart Cursor to find the new value for the resistor voltage, VR.
5. Repeat the process until 50 Hz is reached. At this frequency, click the Scope to make itactive. Adjust the Sweep Speed in the Scope display from 1000 samp/sec to 5000 samp/sec
using the Increase Speed button ( ) as needed. Repeat the process of using the SmartCursor to find the new value for the resistor voltage, VR, at 50 Hz.
6. Click the Signal Generator window to make it active. Increase the frequency to 60 Hz.Repeat the process of using the Smart Cursor to find the new value for the resistor voltage,VR, at 60 Hz.
• Increase the frequency by 10 Hz increments and repeat the process until 150 Hz.
7. Look at the Data Table and determine approximately the resonant frequency (where voltageacross the resistor reaches a maximum and the output voltage and resistor voltage are inphase).
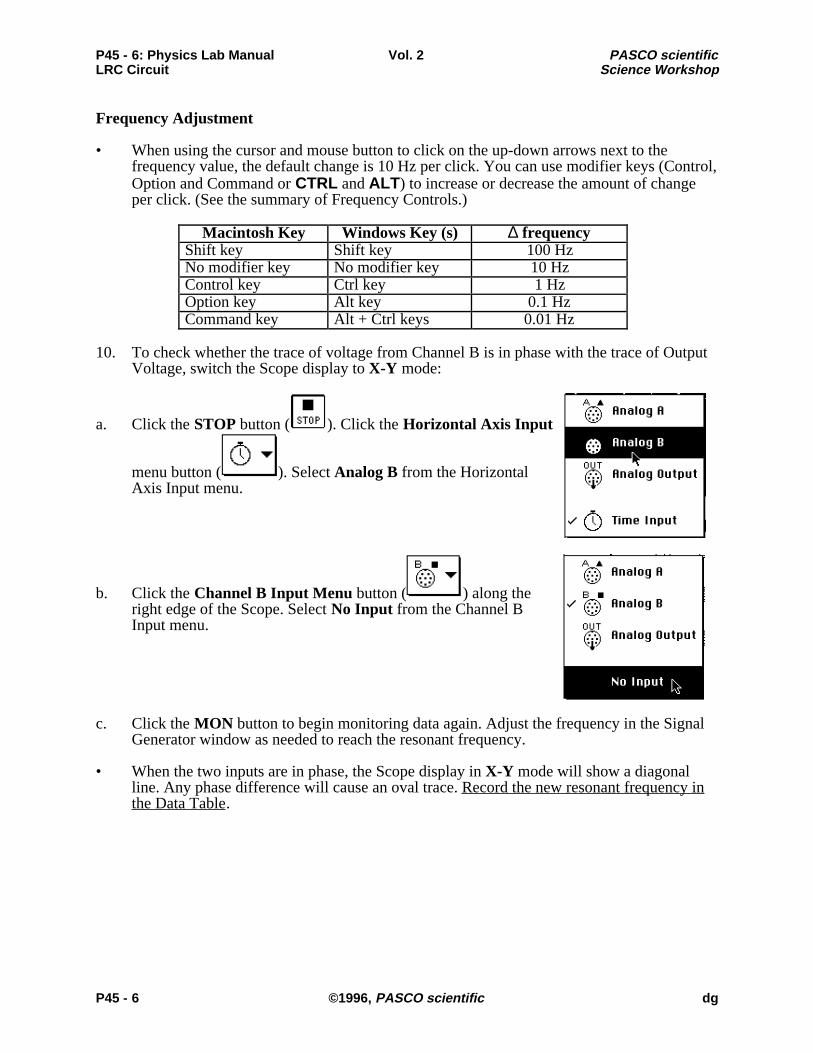
8. Click on the frequency in the SignalGenerator window to highlight it. Type in theapproximate resonant frequency, then press<enter> or <return> on the keyboard torecord your change.
9. Make fine adjustments to the frequency until the trace of voltage from Channel B is inphase with the trace of Output Voltage.
P45 - 6: Physics Lab Manual Vol. 2 PASCO scientificLRC Circuit Science Workshop
P45 - 6 ©1996, PASCO scientific dg
Frequency Adjustment
• When using the cursor and mouse button to click on the up-down arrows next to thefrequency value, the default change is 10 Hz per click. You can use modifier keys (Control,Option and Command or CTRL and ALT) to increase or decrease the amount of changeper click. (See the summary of Frequency Controls.)
Macintosh Key Windows Key (s) ∆ frequencyShift key Shift key 100 HzNo modifier key No modifier key 10 HzControl key Ctrl key 1 HzOption key Alt key 0.1 HzCommand key Alt + Ctrl keys 0.01 Hz
10. To check whether the trace of voltage from Channel B is in phase with the trace of OutputVoltage, switch the Scope display to X-Y mode:
a. Click the STOP button ( ). Click the Horizontal Axis Input
menu button ( ). Select Analog B from the HorizontalAxis Input menu.
b. Click the Channel B Input Menu button ( ) along theright edge of the Scope. Select No Input from the Channel BInput menu.
c. Click the MON button to begin monitoring data again. Adjust the frequency in the SignalGenerator window as needed to reach the resonant frequency.
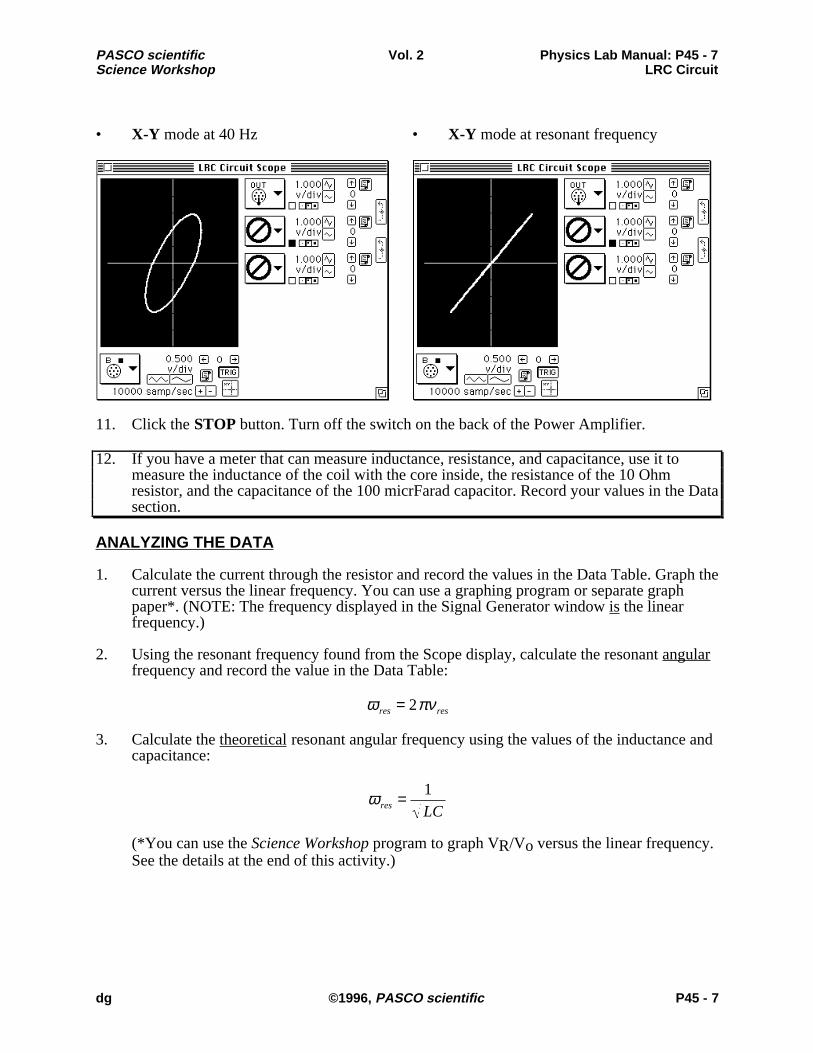
• When the two inputs are in phase, the Scope display in X-Y mode will show a diagonalline. Any phase difference will cause an oval trace. Record the new resonant frequency inthe Data Table.
PASCO scientific Vol. 2 Physics Lab Manual: P45 - 7Science Workshop LRC Circuit
dg ©1996, PASCO scientific P45 - 7
• X-Y mode at 40 Hz • X-Y mode at resonant frequency
11. Click the STOP button. Turn off the switch on the back of the Power Amplifier.
12. If you have a meter that can measure inductance, resistance, and capacitance, use it tomeasure the inductance of the coil with the core inside, the resistance of the 10 Ohmresistor, and the capacitance of the 100 micrFarad capacitor. Record your values in the Datasection.
ANALYZING THE DATA
1. Calculate the current through the resistor and record the values in the Data Table. Graph thecurrent versus the linear frequency. You can use a graphing program or separate graphpaper*. (NOTE: The frequency displayed in the Signal Generator window is the linearfrequency.)
2. Using the resonant frequency found from the Scope display, calculate the resonant angularfrequency and record the value in the Data Table:
ω res = 2πνres
3. Calculate the theoretical resonant angular frequency using the values of the inductance andcapacitance:
ω res = 1LC
(*You can use the Science Workshop program to graph VR/Vo versus the linear frequency.See the details at the end of this activity.)
P45 - 8: Physics Lab Manual Vol. 2 PASCO scientificLRC Circuit Science Workshop
P45 - 8 ©1996, PASCO scientific dg
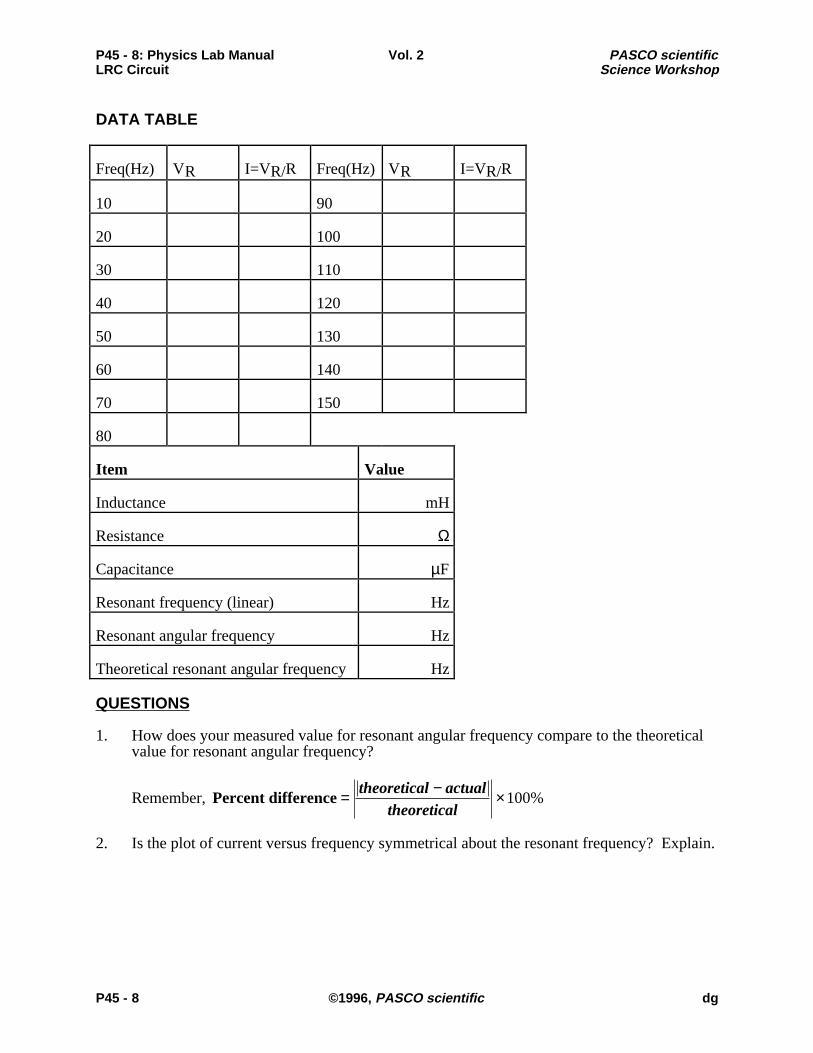
DATA TABLE
Freq(Hz) VR I=VR/R Freq(Hz) VR I=VR/R
10 90
20 100
30 110
40 120
50 130
60 140
70 150
80
Item Value
Inductance mH
Resistance Ω
Capacitance µF
Resonant frequency (linear) Hz
Resonant angular frequency Hz
Theoretical resonant angular frequency Hz
QUESTIONS
1. How does your measured value for resonant angular frequency compare to the theoreticalvalue for resonant angular frequency?
Remember, Percent difference = theoretical − actualtheoretical
×100%
2. Is the plot of current versus frequency symmetrical about the resonant frequency? Explain.
PASCO scientific Vol. 2 Physics Lab Manual: P45 - 9Science Workshop LRC Circuit
dg ©1996, PASCO scientific P45 - 9
3. At resonance, the reactances of the inductor and the capacitor cancel each other so that theimpedance (Z) is equal to just the resistance (R). Calculate the resistance of the circuit by
using the amplitude of the current at resonance in the equation R = V I (where V is the
amplitude of the applied voltage). Is this resistance equal to 10 ohms? Why not?
OPTIONAL
1. Use the Voltage Sensor in Analog Channel B to measure the peak voltage across each ofthe components of the circuit individually. The sum of these peak voltages do not equal theapplied peak voltage. Why not? Draw a phasor diagram to explain this.
2. Determine whether the resonant frequency depends on the resistance.
(To see if the resistance makes a difference, set the Scope to the resonant frequency andthen replace the 10 ohm resistor by a 100 ohm resistor. Does the resonant frequencyincrease, decrease, or stay the same?)
Graphing Current vs Linear Frequency using Science Workshop
You can type data into the Notes window and then display the data in a Graph window.
1. Clear the text and graphics (if any) from the Notes window.
2. Type data into the Notes window using the following procedure:
<independent variable value #1><TAB><dependent variable value #1><return>
<independent variable value #2><TAB><dependent variable value #2><return>, etc.
• In this case, the independent variable is frequency, and the dependent variable value is thecurrent.
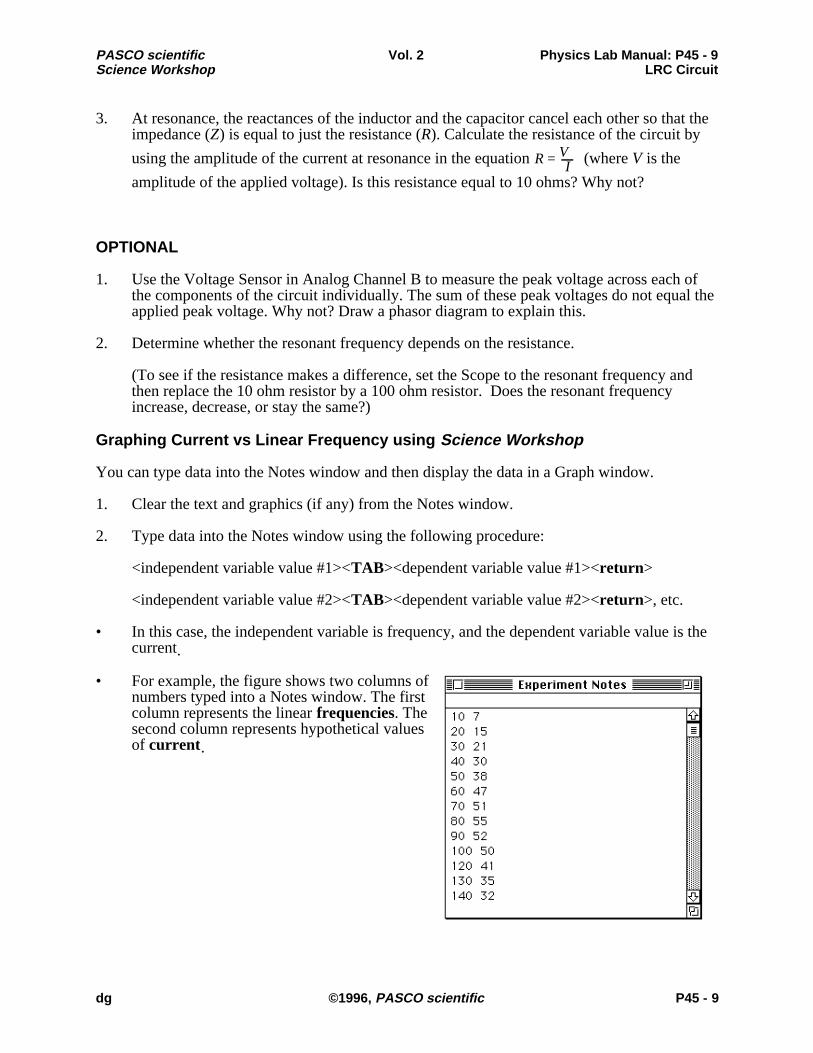
• For example, the figure shows two columns ofnumbers typed into a Notes window. The firstcolumn represents the linear frequencies. Thesecond column represents hypothetical valuesof current.
P45 - 10: Physics Lab Manual Vol. 2 PASCO scientificLRC Circuit Science Workshop
P45 - 10 ©1996, PASCO scientific dg
3. Use the cursor to select (highlight) the two columns of numbers, orclick the Edit menu and pick Select All.
4. Copy the selection (use Copy from the Edit menu).
5. Click the Display Menu. Select New Graph from the DisplayMenu.
6. Click the Plot Data Options button
( ) in the new graph display. ThePlot Data Options window willopen.
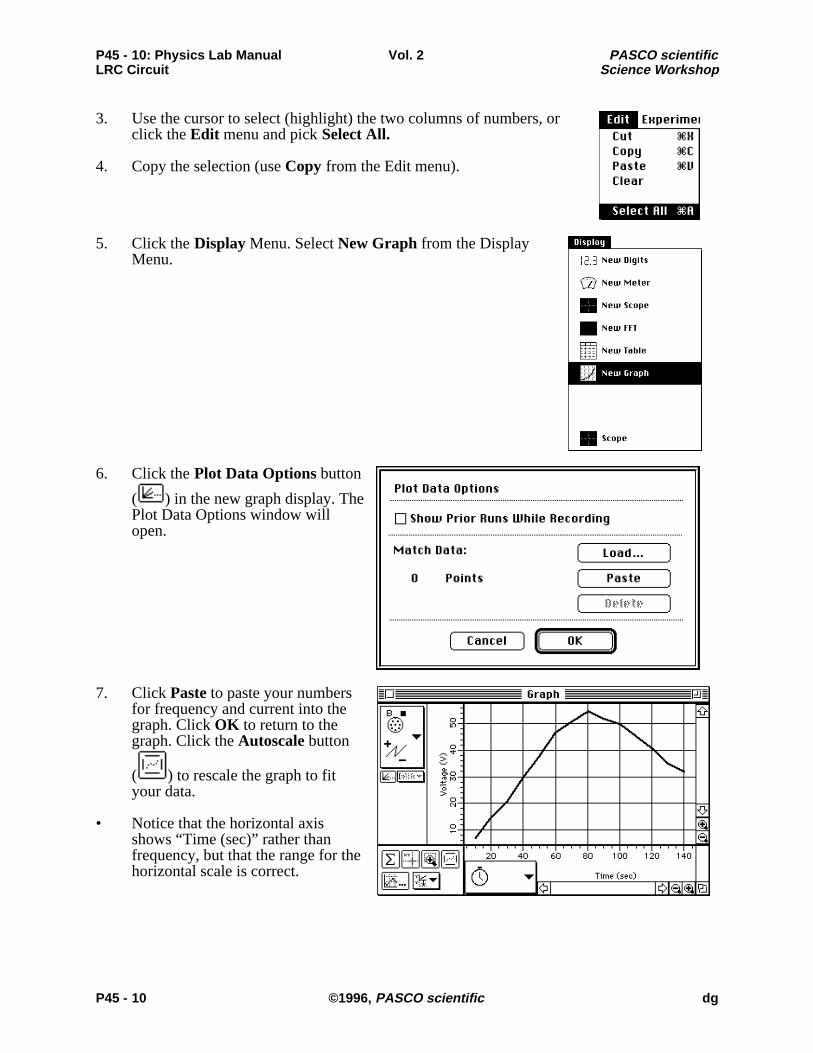
7. Click Paste to paste your numbersfor frequency and current into thegraph. Click OK to return to thegraph. Click the Autoscale button
( ) to rescale the graph to fityour data.
• Notice that the horizontal axisshows “Time (sec)” rather thanfrequency, but that the range for thehorizontal scale is correct.