pa dep 2-year study on radiation from oil & gas drilling
TRANSCRIPT
TECHNOLOGICALLY ENHANCED
NATURALLY OCCURRING
RADIOACTIVE MATERIALS (TENORM)
STUDY REPORT
Rev. 0
January 2015
Prepared for:
Pennsylvania Department of Environmental Protection
Rachel Carson State Office Building
400 Market Street
Harrisburg, PA 17101
Prepared by:
Perma-Fix Environmental Services, Inc.
325 Beaver Street, Suite 3
Beaver, PA 15009
PA DEP TENORM Study Report – Table of Contents Rev. 0
January 2015 iii
TABLE OF CONTENTS
LIST OF APPENDICES ................................................................................................................ vi
LIST OF FIGURES ...................................................................................................................... vii
LIST OF TABLES ....................................................................................................................... viii
ABBREVIATIONS, ACRONYMS, AND SYMBOLS ................................................................ xi
GLOSSARY ................................................................................................................................ xiv
0.0 SYNOPSIS ...................................................................................................................... .0-1
1.0 INTRODUCTION ........................................................................................................... 1-1
1.1 Purpose and Objectives of the Study ................................................................... 1-1
1.2 Background .......................................................................................................... 1-1
1.3 Pennsylvania Oil and Gas Operations (Conventional and Unconventional) ....... 1-3
1.4 Subject Media ...................................................................................................... 1-5
1.4.1 Media Sampled ........................................................................................ 1-5
1.5 Facility Selection ................................................................................................. 1-8
1.5.1 Well Site Selection ................................................................................... 1-8
1.5.2 Wastewater Treatment Plant Selection .................................................... 1-8
1.5.3 Landfill Facility Selection Criteria .......................................................... 1-8
1.5.4 Gas Distribution and End Use Operations Selection Criteria .................. 1-8
1.5.5 Road Sites Selection Criteria ................................................................... 1-9
1.5.6 Well Component Reconditioning Selection Criteria ............................... 1-9
1.5.7 Centralized Impoundments ...................................................................... 1-9
2.0 STUDY IMPLEMENTATION ....................................................................................... 2-1
2.1 Sampling and Survey Methods ............................................................................ 2-1
2.1.1 Field Surveys ........................................................................................... 2-1
2.1.2 Field Sampling Activities ........................................................................ 2-3
2.2 Laboratory Methods ............................................................................................. 2-5
2.2.1 Solid Matrix ............................................................................................. 2-5
2.2.2 Liquid Matrix ........................................................................................... 2-6
2.2.3 Gas Matrix ............................................................................................... 2-8
2.2.4 Filter Matrix – Smears ............................................................................. 2-8
2.3 Survey and Sample Analyses Data Management ................................................ 2-8
2.3.1 Limitations on Gamma Spectroscopy Results ......................................... 2-9
2.3.2 Radium-226 Quantification by Gamma Spectroscopy ............................ 2-9
2.3.3 Criteria for Comparison to Analytical Analyses Results ....................... 2-10
2.3.4 Normal Background Radioactivity Values ............................................ 2-10
2.3.5 Data Presentation ................................................................................... 2-10
3.0 WELL SITES ................................................................................................................... 3-1
3.1 Radiological Survey Results ................................................................................ 3-1
3.1.1 Removable Alpha/Beta Surface Radioactivity Measurement Results ..... 3-1
3.1.2 Total Alpha/Beta Surface Radioactivity Measurement Results............... 3-2
3.1.3 Gross Gamma Radiation Scan Results .................................................... 3-2
3.1.4 Gamma Radiation Exposure Rate Results ............................................... 3-2
PA DEP TENORM Study Report – Table of Contents Rev. 0
January 2015 iv
3.2 Solid Sample Results ........................................................................................... 3-3
3.2.1 Vertical Phase Drill Cuttings ................................................................... 3-3
3.2.2 Horizontal Phase Drill Cuttings ............................................................... 3-4
3.2.3 Drilling Mud ............................................................................................ 3-6
3.2.4 Hydraulic Fracturing Proppant Sand ....................................................... 3-6
3.2.5 Flowback Solids ....................................................................................... 3-7
3.3 Liquid Sample Results ......................................................................................... 3-7
3.3.1 Drilling Liquid (Mud) .............................................................................. 3-7
3.3.2 Hydraulic Fracturing Fluid ...................................................................... 3-7
3.3.3 Flowback Fluid ........................................................................................ 3-7
3.3.4 Produced Water ........................................................................................ 3-8
3.4 Radon Sample Results ......................................................................................... 3-8
3.4.1 Ambient Air Samples During Flowback.................................................. 3-8
3.4.2 Production Gas Radon ............................................................................. 3-8
3.5 Well Site Worker Exposure Assessment ............................................................. 3-8
3.5.1 External Gamma Exposure .................................................................... 3-10
3.5.2 Internal Alpha/Beta Exposure ................................................................ 3-10
3.5.3 Internal Radon Exposure........................................................................ 3-10
3.6 Well Site Data Assessments............................................................................... 3-10
3.6.1 Comparison of Different Geological Formations Based on X-Ray
Fluorescence Data .................................................................................. 3-10
3.6.2 Filtered Versus Unfiltered Sample Data Evaluation .............................. 3-11
3.6.3 Conventional Versus Unconventional Produced Water Data
Evaluation .............................................................................................. 3-11
3.7 Potential Off-site Environmental Impact ........................................................... 3-11
4.0 WASTEWATER TREATMENT PLANTS .................................................................... 4-1
4.1 Publicly Owned Treatment Works ....................................................................... 4-1
4.1.1 Radiological Survey Results .................................................................... 4-1
4.1.2 Solid Sample Results ............................................................................... 4-2
4.1.3 Liquid Sample Results ............................................................................. 4-3
4.1.4 Indoor Radon Sampling Results .............................................................. 4-3
4.1.5 POTW Data Comparisons........................................................................ 4-3
4.1.6 POTW Worker Exposure Assessment ..................................................... 4-4
4.1.7 POTW Radiological Environmental Impacts .......................................... 4-5
4.2 Centralized Wastewater Treatment Plants ........................................................... 4-5
4.2.1 Survey Results ......................................................................................... 4-5
4.2.2 Solid Sample Results ............................................................................... 4-6
4.2.3 Liquid Samples ........................................................................................ 4-7
4.2.4 Indoor Radon Sampling Results .............................................................. 4-7
4.2.5 Filtered Versus Unfiltered Sample Data Evaluation ................................ 4-8
4.2.6 CWT Exposure Assessment ..................................................................... 4-8
4.2.7 CWT Radiological Environmental Impacts ............................................. 4-9
4.3 Zero Liquid Discharge Plants .............................................................................. 4-9
4.3.1 Survey Results ......................................................................................... 4-9
4.3.2 Solid Sample Results ............................................................................. 4-10
4.3.3 Liquid Samples ...................................................................................... 4-10
4.3.4 Indoor Radon Sampling Results ............................................................ 4-11
PA DEP TENORM Study Report – Table of Contents Rev. 0
January 2015 v
4.3.5 Filtered Versus Unfiltered Sample Data Evaluation .............................. 4-11
4.3.6 ZLD Worker Exposure Assessment....................................................... 4-11
4.3.7 Alpha Spectroscopy Analysis of Filter Cake ......................................... 4-14
5.0 LANDFILLS .................................................................................................................... 5-1
5.1 Leachate ............................................................................................................... 5-1
5.2 Nine Selected Landfills ........................................................................................ 5-1
5.2.1 Influent and Effluent Leachate................................................................. 5-1
5.2.2 Leachate Filter Cake ................................................................................ 5-2
5.2.3 Effluent Discharge Sediment-Impacted Soil ........................................... 5-2
5.2.4 Ambient Air ............................................................................................. 5-2
5.2.5 Surveys ..................................................................................................... 5-2
5.3 Radon Ingrowth Within Filter Cake From WWTP to Landfills .......................... 5-3
5.4 Landfill Worker Exposure Assessment ............................................................... 5-5
5.4.1 Landfill External Radiation Exposure ..................................................... 5-5
6.0 GAS DISTRIBUTION AND END USE ......................................................................... 6-1
6.1 Natural Gas in Underground Storage ................................................................... 6-1
6.2 Natural Gas-Fired Power Plants........................................................................... 6-1
6.3 Compressor Stations ............................................................................................ 6-2
6.4 Natural Gas Processing Plant ............................................................................... 6-2
6.5 Potential Exposure from Gas Scale Inside Pipes and Equipment ........................ 6-3
6.6 Radon Dosimetry ................................................................................................. 6-4
7.0 OIL AND GAS BRINE-TREATED ROADS ................................................................. 7-1
7.1 Gamma Radioactivity Survey Results ................................................................. 7-1
7.1.1 Gross Gamma Radiation Scan Results .................................................... 7-1
7.1.2 Gamma Radiation Exposure Rate Results Summary ............................... 7-2
7.2 Soil Sample Results ............................................................................................. 7-2
7.2.1 Road Surface Soils Biased Sample Results ............................................. 7-2
7.2.2 Road Surface Soils – Reference Background Roads Soils ...................... 7-3
7.3 Public Exposure to Oil and Gas Brine-Treated Roads ......................................... 7-4
8.0 QUALITY ASSURANCE AND QUALITY CONTROL ............................................... 8-1
8.1 Data Quality Levels (DQLs) ................................................................................ 8-1
8.2 Quality Control Parameters.................................................................................. 8-1
8.3 Field Screening .................................................................................................... 8-1
8.4 Sample Identification ........................................................................................... 8-2
8.5 Sample Custody ................................................................................................... 8-2
8.6 Analytical Procedures .......................................................................................... 8-2
8.7 Instrument Calibrations ........................................................................................ 8-2
8.8 Data Evaluation and Validation ........................................................................... 8-2
8.8.1 Validation of Field Data........................................................................... 8-3
8.8.2 Validation of Laboratory Data ................................................................. 8-3
8.9 Data Reporting – Analytical Laboratory.............................................................. 8-3
8.9.1 DQL III Reporting ................................................................................... 8-4
PA DEP TENORM Study Report – Table of Contents Rev. 0
January 2015 vi
8.10 Quality Control Procedures.................................................................................. 8-4
8.10.1 Field QC Checks ...................................................................................... 8-4
8.10.2 Internal Laboratory QC Checks ............................................................... 8-5
8.11 Laboratory Performance Audits ........................................................................... 8-5
8.12 Laboratory System Audits ................................................................................... 8-6
8.13 Assessment Procedures for Data Acceptability ................................................... 8-6
8.13.1 Precision ................................................................................................... 8-6
8.13.2 Accuracy .................................................................................................. 8-6
8.13.3 Completeness ........................................................................................... 8-6
8.13.4 Quality Control Charts ............................................................................. 8-7
8.14 Preventative Maintenance .................................................................................... 8-7
8.14.1 Field Equipment ....................................................................................... 8-7
8.14.2 Laboratory Instruments ............................................................................ 8-7
8.15 QA Reports to Management ................................................................................ 8-8
8.16 Third-Party Quality Control ................................................................................. 8-8
9.0 OBSERVATIONS AND RECOMMENDATIONS ........................................................ 9-1
9.1 Observations ........................................................................................................ 9-1
9.1.1 Well Sites (Section 3.0) ........................................................................... 9-1
9.1.2 Wastewater Treatment Plants (Section 4.0) ............................................. 9-3
9.1.3 Landfills (Section 5.0) ............................................................................. 9-8
9.1.4 Gas Distribution and End Use (Section 6.0) ............................................ 9-9
9.1.5 Oil and Gas Brine-Treated Roads (Section 7.0) .................................... 9-11
9.2 Recommendations for Future Actions ............................................................... 9-12
9.2.1 Well Sites ............................................................................................... 9-12
9.2.2 Wastewater Treatment Plants ................................................................ 9-13
9.2.3 Landfills ................................................................................................. 9-13
9.2.4 Gas Distribution and End Use................................................................ 9-13
9.2.5 Oil and Gas Brine-Treated Roads .......................................................... 9-13
10.0 REFERENCES .............................................................................................................. 10-1
LIST OF APPENDICES
Appendix A: Additional Geological Information
Appendix B: Field Instrumentation QC Documentation
Appendix C: Gamma Spectroscopy Analytical Results
Appendix D: Total and Removable Alpha/Beta Surface Radioactivity Results
Appendix E: Gross Gamma Radiation Survey Figures
Appendix F: XRF Analytical Analyses Results
Appendix G: T-test Output Files
Appendix H: Radon Monitor/Sample Analytical Analyses Reports
Appendix I: Filtered Versus Unfiltered Liquid Sample Comparison
Appendix J: MicroShield® Output Files
Appendix K: Laboratory Data Reports
Appendix L: Peer Review Comment and Resolution Document

PA DEP TENORM Study Report – List of Figures Rev. 0
January 2015 vii
LIST OF FIGURES
1-1. Marcellus Shale Formation in Pennsylvania.................................................................... 1-2
1-2. Marcellus Shale Formation “Wet” and “Dry” Areas ....................................................... 1-2
1-3. Uranium-238 Decay Chain .............................................................................................. 1-4
1-4. Thorium-232 Decay Chain .............................................................................................. 1-4
1-5. Natural Gas Operations .................................................................................................... 1-7
3-1. Comparison of Ra-226 Gamma Spectroscopy Results to U-238 XRF Results in
Vertical Drill Cuttings...................................................................................................... 3-4
3-2. Comparison of Ra-228 Gamma Spectroscopy Results to Th-232 XRF Results in
Vertical Drill Cuttings...................................................................................................... 3-4
3-3. Comparison of Analytical Analyses Results for Horizontal and Vertical Drill Cutting
Samples ............................................................................................................................ 3-5
3-4. Comparison of Ra-226 Gamma Spectroscopy Results to U-238 XRF Results in
Horizontal Drill Cuttings ................................................................................................. 3-5
3-5. Comparison of Ra-228 Gamma Spectroscopy Results to Th-232 XRF Results in
Horizontal Drill Cuttings ................................................................................................. 3-6
3-6. Natural Gas Radon Sampling Location ........................................................................... 3-9
3-7. Conventional vs Unconventional Produced Water Radium Concentrations ................. 3-11
4-1. CWT Influent and Effluent Liquid Ra-226 Minimum, Maximum, and Average ............ 4-7
4-2. ZLD Influent and Effluent Liquid Ra-226 Minimum, Maximum, and Average ........... 4-11
4-3. MicroShield® External Exposure Scenarios Input/Output ............................................. 4-13
5-1. Ra-226 Progeny Ingrowth (Days Post Removal) versus Exposure Rate from
13.34 pCi/g Ra-226 .......................................................................................................... 5-4
5-2. Ra-226 Progeny Ingrowth versus Days (Days Post Removal) ........................................ 5-5
PA DEP TENORM Study Report – List of Tables Rev. 0
January 2015 viii
LIST OF TABLES
2-1. Theoretical Overestimation of Ra-226 Activity in Solid Samples with Natural
Uranium Analyzed by Gamma Spectroscopy ........................................................... 2-11
2-2. Criteria for Comparison ............................................................................................. 2-12
2-3. Natural Background Radioactivity Values for U.S. Soil ........................................... 2-14
3-1. Removable Alpha and Beta Surface Radioactivity Measurement Results
Summary ................................................................................................................... 3-13
3-2. Total Alpha and Beta Surface Radioactivity Measurement Results Summary ......... 3-16
3-3. Gross Gamma Scan Results Summary ...................................................................... 3-19
3-4. Results Summary of NaI Count Rate Data Converted to Exposure Rates ................ 3-20
3-5. Vertical Solids, Drill Cuttings – Gamma Spectroscopy Results ............................... 3-21
3-6. XRF Uranium and Thorium for Vertical Cuttings .................................................... 3-22
3-7. Horizontal Solids, Drill Cuttings – Uranium Series Gamma Spectroscopy
Results ....................................................................................................................... 3-24
3-8. XRF Uranium and Thorium for Horizontal Cuttings ................................................ 3-25
3-9. Drilling Solids, Mud – Gamma Spectroscopy Results .............................................. 3-26
3-10. Proppant Sand – Gamma Spectroscopy Results ........................................................ 3-26
3-11. Flowback Solids, Sand – Gamma Spectroscopy Results .......................................... 3-27
3-12. Drilling Fluids – Gamma Spectroscopy and Miscellaneous Results ........................ 3-27
3-13. Fracturing Fluids – Gamma Spectroscopy and Miscellaneous Results .................... 3-28
3-14. Flowback Fluids – Gamma Spectroscopy and Miscellaneous Results ..................... 3-28
3-15. Unfiltered Produced Waters – Gamma Spectroscopy and Miscellaneous Results ... 3-29
3-16. Filtered Produced Waters – Gamma Spectroscopy and Miscellaneous Results ....... 3-29
3-17. Ambient Radon at Well Sites During Flowback ....................................................... 3-30
3-18. Natural Gas Samples from Production Sites ............................................................. 3-31
3-19. Thorium and Uranium XRF Data for Drill Cuttings By Formation .......................... 3-32
4-1. POTW-I Removable Alpha and Beta Surface Radioactivity Measurement Results
Summary ................................................................................................................... 4-15
4-2. POTW-I Total Alpha and Beta Surface Radioactivity Measurement Results
Summary ................................................................................................................... 4-17
4-3. POTW-I Gross Gamma Radiation Scan Results Summary ...................................... 4-19
4-4. POTW-I Results Summary of NaI Count Rate Data Converted to Exposure
Rates .......................................................................................................................... 4-19
4-5. POTW-I Filter Cake Results Summary – Gamma Spectroscopy Results ................. 4-20
4-6. POTW-N Filter Cake Results Summary – Gamma Spectroscopy Results ............... 4-21
4-7. POTW-I Sediment Sample Results Summary – Gamma Spectroscopy Results ....... 4-21
4-8. POTW-I Filtered Effluent Results Summary – Gamma Spectroscopy and
Miscellaneous Results ............................................................................................... 4-22
4-9. POTW-I Unfiltered Effluent Results Summary – Gamma Spectroscopy and
Miscellaneous Results ............................................................................................... 4-23
4-10. POTW-N Filtered Effluent Results Summary – Gamma Spectroscopy and
Miscellaneous Results ............................................................................................... 4-24
4-11. POTW-N Unfiltered Effluent Results Summary – Gamma Spectroscopy and
Miscellaneous Results ............................................................................................... 4-24
4-12. POTW-I Filtered Influent Results Summary – Gamma Spectroscopy and
Miscellaneous Results ............................................................................................... 4-25
PA DEP TENORM Study Report – List of Tables Rev. 0
January 2015 ix
4-13. POTW-I Unfiltered Influent Results Summary – Gamma Spectroscopy and
Miscellaneous Results ............................................................................................... 4-26
4-14. POTW-N Filtered Influent Results Summary – Gamma Spectroscopy and
Miscellaneous Results ............................................................................................... 4-27
4-15. POTW-N Unfiltered Influent Results Summary – Gamma Spectroscopy and
Miscellaneous Results ............................................................................................... 4-27
4-16. POTW-I Ambient Radon ........................................................................................... 4-28
4-17. POTW-I vs POTW-N Average Concentrations Comparison for Filtered ................ 4-28
4-18. POTW-I vs POTW-N Average Concentrations Comparison for Unfiltered ............ 4-28
4-19. Average Radium, Gross Alpha, and Gross Beta Concentrations for Filtered
Influent and Effluent POTW Samples ....................................................................... 4-29
4-20. Average Radium, Gross Alpha, and Gross Beta Concentrations for Unfiltered
Influent and Effluent POTW Samples ....................................................................... 4-29
4-21. POTW-I Sediment and Effluent Results for Ra-226 and Ra-228 ............................. 4-30
4-22. POTW Sediment and Effluent Ratios for Ra-226/Ra-228 ........................................ 4-31
4-23. Summary of Removable Alpha and Beta Surface Contamination Results at CWT
Plants ......................................................................................................................... 4-32
4-24. Summary of Total Alpha and Beta Surface Contamination Results at CWT
Plants ......................................................................................................................... 4-34
4-25. Summary of NaI Count Rate Data at CWTs ............................................................. 4-36
4-26. Results Summary of NaI Count Rate Data Converted to Exposure Rates ................ 4-37
4-27. CWT Solids, Filter Cake – Gamma Spectroscopy Results ....................................... 4-38
4-28. CWT Solids, Sediment – Gamma Spectroscopy Results .......................................... 4-39
4-29. CWT Solids, Biased Soil – Gamma Spectroscopy Results ....................................... 4-39
4-30. CWT Filtered Effluent – Gamma Spectroscopy and Miscellaneous Results ............ 4-40
4-31. CWT Unfiltered Effluent – Gamma Spectroscopy and Miscellaneous Results ........ 4-41
4-32. CWT Filtered Influent – Gamma Spectroscopy and Miscellaneous Results ............ 4-42
4-33. CWT Unfiltered Influent – Gamma Spectroscopy and Miscellaneous Results ........ 4-43
4-34. CWT Radon Sample Results ..................................................................................... 4-44
4-35. Summary of Removable Alpha and Beta Surface Contamination Results at
ZLDs .......................................................................................................................... 4-45
4-36. Summary of Total Alpha and Beta Surface Contamination Results at ZLDs ........... 4-47
4-37. Summary of NaI Count Rate Data at ZLDs .............................................................. 4-49
4-38. Results Summary of NaI Count Rate Data Converted to Exposure Rates ................ 4-50
4-39. ZLD Solids, Filter Cake – Gamma Spectroscopy Results ........................................ 4-51
4-40. ZLD Solids, Biased Soil – Uranium Series Gamma Spectroscopy Results .............. 4-51
4-41. ZLD Filtered Effluent – Gamma Spectroscopy and Miscellaneous Results ............. 4-52
4-42. ZLD Unfiltered Effluent – Gamma Spectroscopy and Miscellaneous Results ......... 4-53
4-43. ZLD Filtered Influent – Gamma Spectroscopy and Miscellaneous Results ............. 4-54
4-44. ZLD Unfiltered Influent – Gamma Spectroscopy and Miscellaneous Results ......... 4-55
4-45. ZLD Radon in Ambient Air Results .......................................................................... 4-56
4-46. ZLD and CWT Filter Cake Sample Alpha Spectroscopy Results ............................. 4-56
5-1. Landfill Leachate – Gamma Spectroscopy and Miscellaneous Results ...................... 5-7
5-2. Selected Landfill Leachate – Gamma Spectroscopy and Miscellaneous Results ....... 5-8
5-3. Landfill Leachate Original and Aqueous Sample Analysis Results ............................ 5-9
5-4. Selected Landfill Effluent Leachate Gamma Spectroscopy and Miscellaneous
Results ....................................................................................................................... 5-10
PA DEP TENORM Study Report – List of Tables Rev. 0
January 2015 x
5-5. Selected Landfill Influent Leachate – Gamma Spectroscopy and Miscellaneous
Results ....................................................................................................................... 5-10
5-6. Selected Landfill Solids, Filter Cake Gamma Spectroscopy Results .................... 5-11
5-7. Selected Landfill Solids, Sediment Gamma Spectroscopy Results ....................... 5-11
5-8. Selected Landfill Radon Concentrations ................................................................... 5-12
5-9. Selected Landfill Removable Alpha and Beta Surface Radioactivity Results
Summary ................................................................................................................... 5-13
5-10. Selected Landfill Total Alpha and Beta Surface Radioactivity Results Summary ... 5-14
5-11. Selected Landfill Gross Gamma Radiation Scan Results Summary ......................... 5-15
5-12. Results Summary of NaI Count Rate Data Converted to Exposure Rates ................ 5-15
5-13. Gamma Spectroscopy Results (pCi/g) of Sealed Wastewater Treatment Sludge
Sample Over 24 Days ................................................................................................ 5-16
6-1. Natural Gas Underground Storage Radon Concentrations, Injection ......................... 6-6
6-2. Natural Gas Underground Storage Radon Concentrations, Withdrawal ..................... 6-6
6-3. Natural Gas-Fired Power Plant Samples Analyzed for Radon Content ...................... 6-6
6-4. Natural Gas-Fired Power Plants Ambient Fence Line Radon Monitors (PP 02) ........ 6-7
6-5. Compressor Station Radon Samples ........................................................................... 6-7
6-6. Compressor Station Ambient Fence Line Radon Monitors (CS 01) ........................... 6-7
6-7. Natural Gas Processing Plant Radon Samples ............................................................ 6-7
6-8. Compressor Station and Natural Gas Processing Plant Filter Case Removable
Radioactivity Results ................................................................................................... 6-8
6-9. Compressor and Natural Gas Processing Plant Filter Media, Gamma
Spectroscopy ............................................................................................................... 6-8
6-10. Natural Gas Processing Plant Filter Media, Gross Alpha/Gross Beta ........................ 6-8
6-11. Radon Dosimetry Values for a Typical Home ............................................................ 6-9
7-1. Gamma Scan Survey Summary ................................................................................... 7-5
7-2. Summary of NaI Gamma Count Rate Data Converted to Exposure Rate ................... 7-7
7-3. Road-Biased Soil – Uranium Series Gamma Spectroscopy Results ......................... 7-10
7-4. Road-Biased Soil – Thorium Series Gamma Spectroscopy Results ......................... 7-11
7-5. Road-Biased Soil – Actinium Series and Miscellaneous Gamma Spectroscopy
Results ....................................................................................................................... 7-12
7-6. Reference Background Road – Uranium Series Gamma Spectroscopy Results ....... 7-13
7-7. Reference Background Road – Thorium Series Gamma Spectroscopy Results ....... 7-14
7-8. Reference Background Road – Actinium Series and Miscellaneous Gamma
Spectroscopy Results ................................................................................................. 7-15
7-9. Dose Assessment Results for Oil and Gas Brine-Treated Roads .............................. 7-15
8-1. Summary of Analytical Procedures ........................................................................... 8-10
8-2. Bi-214 Split Solid Sample Comparison Results........................................................ 8-11
8-3. Pb-212 Split Solid Sample Comparison Results ....................................................... 8-12
8-4. Pb-214 Split Soil Sample Comparison Results ......................................................... 8-12
8-5. Ra-226 Split Soil Sample Comparison Results ......................................................... 8-13
8-6. Bi-214 Split Liquid Sample Comparison Results ..................................................... 8-13
8-7. Pb-214 Split Liquid Sample Comparison Results ..................................................... 8-14
8-8. Ra-226 Split Liquid Sample Comparison Results ..................................................... 8-14
8-9. Ra-228 Split Liquid Sample Comparison Results ..................................................... 8-15
PA DEP TENORM Study Report – Abbreviations, Acronyms, and Symbols Rev. 0
January 2015 xi
ABBREVIATIONS, ACRONYMS, AND SYMBOLS
Ac Actinium
ALARA As Low As Reasonably Achievable
Alpha
ANSI American National Standards Institute
API American Petroleum Institute
ATD Alpha Track Detector
Ba Barium
Bcf billion cubic feet
Beta
Bi Bismuth
BRP Bureau of Radiation Protection
CERCLA Comprehensive Environmental Response, Compensation, and Liability Act
CFR Code of Federal Regulations
CLP Contract Laboratory Program
cm centimeter
cpm counts per minute
CWT Centralized Wastewater Treatment
DAC Derived Air Concentration
DCNR Department of Conservation and Natural Resources
DEP Department of Environmental Protection
DEP Laboratory DEP Bureau of Laboratories
DER Duplicate Error Ratio
DOE U.S. Department of Energy
DOT U.S. Department of Transportation
dpm disintegrations per minute
DQL Data Quality Level
EIC Electret Ion Chamber
EPA U.S. Environmental Protection Agency
Fe Iron
FSP Field Sampling Plan
ft foot/feet
ft2 square foot
ft3 cubic foot
g gram
GIS Geographic Information System
GM Geiger-Muller
GIS Geographic Information Systems
GPS Global Positioning System
HASL Health and Safety Laboratory
HCl Hydrochloric Acid
HDPE High Density Polyethylene
HNO3 Nitric Acid
HPS Health Physics Society
hr hour
K Potassium
keV kilo-electron volt
PA DEP TENORM Study Report – Abbreviations, Acronyms, and Symbols Rev. 0
January 2015 xii
L liter
LLD Lower Level of Detection
µR/hr microroentgens per hour μrem/hr microroentgen equivalent man per hour mcf thousand cubic feet
MDC Minimum Detectable Concentration
mph miles per hour
mrem millirem
MS Matrix Spike
MSD Matrix Spike Duplicate
NaI Sodium Iodide
NELAP National Environmental Laboratory Accreditation Program
NIST National Institute of Standards and Technology
NJDEP New Jersey Department of Environmental Protection
NORM Naturally Occurring Radioactive Material
NPDES National Pollutant Discharge Elimination System
NRC U.S. Nuclear Regulatory Commission
O&G Oil and Gas
OSHA Occupational Safety and Health Administration
%R Percent Recovery
± plus or minus
Pa Protactinium
PA Pennsylvania
Pa. C.S. Consolidated Statutes
PASDA Pennsylvania Spatial Data Access
Pb Lead
pCi/g picocuries per gram
Perma-Fix Perma-Fix Environmental Services, Inc.
pH Potential Hydrogen
Po Polonium
POTW Publicly Owned Treatment Works
PPE Personal Protective Equipment
ppm parts per million
PSIA pounds per square inch absolute
QA Quality Assurance
QAM Quality Assurance Manual
QAPP Quality Assurance Project Plan
QC Quality Control
Ra Radium
RESRAD Residual Radiation
RG Regulatory Guide
Rn Radon
RPD Relative Percent Difference
SOP Standard Operating Procedure
Sv Sievert
TDS Total Dissolved Solids
TENORM Technologically Enhanced Naturally Occurring Radioactive Materials
Th Thorium
PA DEP TENORM Study Report – Abbreviations, Acronyms, and Symbols Rev. 0
January 2015 xiii
Tl Thallium
U Uranium
UNSCEAR United Nations Scientific Committee on the Effects of Atomic Radiation
U.S. United States
USACE U.S. Army Corps of Engineers
U.S.C. United States Code
USGS U.S. Geological Survey
WL Working Level
WWTP Wastewater Treatment Plant
XRF X-ray Fluorescence
yr year
ZLD Zero Liquid Discharge
PA DEP TENORM Study Report – Glossary Rev. 0
January 2015 xiv
GLOSSARY*
Alpha – A positively charged particle consisting of two protons and two neutrons, emitted in
radioactive decay or nuclear fission. They are generally produced in the process of alpha decay
but may also be produced in other ways. They are designated by the Greek letter α.
Basic Sediment – Oil and gas production storage impurities/sediment from produced oil at
storage tank battery.
Beta – High-energy, high-speed electrons or positrons emitted by certain types of radioactive
nuclei. The beta particles emitted are a form of ionizing radiation also known as beta rays. The
production of beta particles is termed beta decay. They are designated by the Greek letter β.
Brine – Water that is produced with oil and gas when a well is in production, typically water
containing more dissolved inorganic salt than seawater.
Condensate – A low density, high American Petroleum Institute (API) gravity, mixture of
hydrocarbons that is present in a gaseous state at formation temperatures and pressures but
condenses out of the raw gas to a liquid form at standard temperature of 60 degrees Fahrenheit
and pressure 14.7 pounds per square inch (PSIA).
Conventional Formation – A formation that is not an unconventional formation.
Conventional Well – A bore hole drilled or being drilled for the purpose of or to be used for
construction of a well regulated under 58 Pa. C. S. § § 3201—3274 (relating to development)
that is not an unconventional well, irrespective of technology or design. The term includes, but
is not limited to:
Wells drilled to produce oil.
Wells drilled to produce natural gas from formations other than shale formations.
Wells drilled to produce natural gas from shale formations located above the base of the Elk
Group or its stratigraphic equivalent.
Wells drilled to produce natural gas from shale formations located below the base of the Elk
Group where natural gas can be produced at economic flow rates or in economic volumes
without the use of vertical or nonvertical well bores stimulated by hydraulic fracture
treatments or multilateral well bores or other techniques to expose more of the formation to
the well bore.
Irrespective of formation, wells drilled for collateral purposes, such as monitoring, geologic
logging, secondary and tertiary recovery, or disposal injection.
Drill Cuttings – Rock cuttings and related mineral residues generated during the drilling of an
oil or gas well.
Drilling Fluid Waste – Oil and gas drilling mud and other drilling fluids (other than fracturing
fluid and spent lubricant).
Drilling Mud – A chemical, water-based, or oil-based mixture pumped into an oil well during
drilling in order to seal off porous rock layers, equalize the pressure, cool the bit, and flush out
PA DEP TENORM Study Report – Glossary Rev. 0
January 2015 xv
the cuttings. The mud is circulated down the drill pipe, out through the drill bit, across the rock
face being drilled, then back to the surface carrying debris from the bottom of the well.
Flowback – The return flow of water and formation fluids recovered from the well bore of an oil
or gas well following the release of pressures induced as part of the hydraulic fracture
stimulation of a target geologic formation until the well is placed into production.
Flowback Fluid – Flowback fluid is a water based solution that flows back to the surface during
and after the completion of hydraulic fracturing. It consists of the fluid used to fracture the target
formation. The fluid contains clays, chemical additives, dissolved metal ions, and total dissolved
solids (TDS).
Flowback Fracturing Sand – Oil and gas drilling flowback fracturing sand.
Fracturing Fluid Waste – Oil and gas fracturing/stimulation fluid waste and/or flowback.
Gamma – Electromagnetic radiation of an extremely high frequency and high energy. Gamma
rays are ionizing radiation, and are thus biologically hazardous. They are classically produced
by the decay of atomic nuclei as they transition from a high energy state to a lower state known
as gamma decay, but may also be produced by other processes. Natural sources of gamma rays
include gamma decay from naturally occurring radioisotopes, and secondary radiation from
atmospheric interactions with cosmic ray particles. They are designated by the Greek letter .
Gas – A fluid, combustible or noncombustible, which is produced in a natural state from the
earth and maintains a gaseous or rarified state at standard temperature of 60 degrees Fahrenheit
and pressure of 14.7 PSIA. This product type must be reported in Mcf (1,000 cubic feet) at a
standard temperature of 60 degrees Fahrenheit and pressure of 14.7 PSIA.
Horizontal Drill Cuttings – Drill cuttings from the horizontal portion of an oil or gas well.
Hydraulic Fracturing Fluid – Hydraulically pressurized liquid used to fracture rock in the
hydraulic fracturing process. Hydraulic fracturing fluids are used to initiate and/or expand
fractures, as well as to transport proppant into fractures. The U.S. O&G industry has used fluids
for fracturing geologic formations since the early 1940s.
Leachate – A solution resulting from water that has percolated through solid, e.g., waste in
landfill, and potentially leached out some of the soluble constituents.
Marinelli – A lightweight polypropylene sample container with snap-on lid used for gamma
spectroscopy analysis.
Natural Gas – A fossil fuel consisting of a mixture of hydrocarbon gases, primarily methane,
and possibly including ethane, propane, butane, pentane, carbon dioxide, oxygen, nitrogen, and
hydrogen sulfide and other gas species. The term includes natural gas from oil fields known as
associated gas or casing head gas, natural gas fields known as nonassociated gas, coal beds, shale
beds, and other formations. The term does not include coal bed methane.
PA DEP TENORM Study Report – Glossary Rev. 0
January 2015 xvi
NORM – Naturally occurring radioactive material. It is a nuclide that is radioactive in its
natural physical state, not man-made, but does not include source or special nuclear material.
Oil – Hydrocarbons in liquid form at formation temperatures and pressures that remain in liquid
form at standard temperature of 60 degrees Fahrenheit and pressure 14.7 PSIA.
Produced Water – Water that is produced with oil and gas when the well is in production.
Proppant Sand – Solid treated sand suspended in water or other fluid designed to keep an
induced hydraulic fracture open during or following a fracturing treatment.
Radiological Environmental Impact – Impact to the environment from the release and
subsequent spreading of radionuclides and from the direct emission of radiation from facilities.
Removable Contamination – The fraction of total surface alpha/beta radioactive contamination
easily removed by pressing a 47-mm diameter filter paper to the surface with moderate pressure,
i.e., smear sampling. Usually expressed in units of dpm/100 cm2 of surface area sampled.
Secular Equilibrium – A type of radioactive equilibrium in which the half-life of the precursor
(parent) radionuclide is so much longer than that of the product (progeny) radionuclide(s) that
the radioactivity of the progeny become equal to the parent over time equal to approximately
10 half-life’s of the progeny.
Servicing Fluid – Oil and gas production well maintenance and work-over fluids and/or
oil/water-based mud and foam.
Smear Sample – A sample of removable alpha and beta surface radioactivity collected by
pressing a 47-mm diameter filter paper to 100 cm2 of surface area sampled to obtain an assumed
fraction of removable material. The filter paper is counted for alpha and beta radioactivity
without any preparation.
Spent Lubricant – Oil and gas drilling and/or plug drilling lubricants that have exceeded their
useful life.
Student t-test – A test for determining whether or not an observed sample mean differs
significantly from a hypothetical normal population mean.
TENORM – Technologically enhanced naturally occurring radioactive materials. It is naturally
occurring radioactive material not specifically subject to regulation under the laws of the
Commonwealth of Pennsylvania or Atomic Energy Act of 1954 (42 U.S.C. §2011 et seq.), but
whose radionuclide concentrations or potential for human exposure have been increased above
levels encountered in the undisturbed natural environment by human activities.
Total Contamination – The surface alpha/beta radioactive contamination comprised of fixed
and removable components. Total contamination is measured by placing an appropriate
alpha/beta detector on the surface to be surveyed so that both the fixed and removable fractions
are counted together. Usually expressed in units of dpm/100 cm2 of surface area surveyed.
PA DEP TENORM Study Report – Glossary Rev. 0
January 2015 xvii
Unconventional Formation – A geological shale formation existing below the base of the Elk
Sandstone or its geologic equivalent stratigraphic interval where natural gas generally cannot be
produced at economic flow rates or in economic volumes except by vertical or horizontal well
bores stimulated by hydraulic fracture treatments or by using multilateral wellbores or other
techniques to expose more of the formation to the well bore.
Unconventional Well – A bore hole drilled or being drilled for the purpose of or to be used for
the production of natural gas from an unconventional formation.
Vertical Drill Cuttings – Drill cuttings from the vertical portion of an oil or gas well.
Well Site – The area occupied by the equipment or facilities necessary for or incidental to the
drilling, production, or plugging of a well.
*These definitions are for the purposes of this report only and are not necessarily regulatory definitions.
PA DEP TENORM Study Report – Synopsis Rev. 0
January 2015 0-1
0.0 SYNOPSIS
In 2013, the Pennsylvania Department of Environmental Protection (DEP) initiated a study to
collect data relating to technologically enhanced naturally occurring radioactive material
(TENORM) associated with oil and gas (O&G) operations in Pennsylvania. This study included
the assessment of potential worker and public radiation exposure, TENORM disposal, and other
possible environmental impacts. The study encompassed radiological surveys at well sites,
wastewater treatment plants, landfills, gas distribution and end use, and O&G brine-treated
roads. The media sampled included solids, liquids, natural gas, ambient air, and surface
radioactivity.
The observations and recommendations for future actions based on this peer-reviewed study are:
1. There is little potential for additional radon exposure to the public due to the use of natural
gas extracted from geologic formations located in Pennsylvania.
2. There is little or limited potential for radiation exposure to workers and the public from the
development, completion, production, transmission, processing, storage, and end use of
natural gas. There are, however, potential radiological environmental impacts from O&G
fluids if spilled. Radium should be added to the Pennsylvania spill protocol to ensure
cleanups are adequately characterized. There are also site-specific circumstances and
situations where the use of personal protective equipment by workers or other controls
should be evaluated.
3. There is little potential for radiation exposure to workers and the public at facilities that treat
O&G wastes. However, there are potential radiological environmental impacts that should
be studied at all facilities in Pennsylvania that treat O&G wastes to determine if any areas
require remediation. If elevated radiological impacts are found, the development of
radiological discharge limitations and spill policies should be considered.
4. There is little potential for radiation exposure to workers and the public from landfills
receiving waste from the O&G industry. However, filter cake from facilities treating O&G
wastes are a potential radiological environmental impact if spilled, and there is also a
potential long-term disposal issue. TENORM disposal protocols should be reviewed to
ensure the safety of long-term disposal of waste containing TENORM.
5. While limited potential was found for radiation exposure to recreationists using roads treated
with brine from conventional natural gas wells, further study of radiological environmental
impacts from the use of brine from the O&G industry for dust suppression and road
stabilization should be conducted.
PA DEP TENORM Study Report – Section 1.0 Rev. 0
January 2015 1-1
1.0 INTRODUCTION
1.1 Purpose and Objectives of the Study
During the expansion of the Marcellus Shale Gas industry the Pennsylvania Department of
Environmental Protection (DEP) staff observed a steady increase in the volume of waste
containing technologically enhanced naturally occurring radioactive material (TENORM),
generated by the oil and gas (O&G) industry, being disposed in Pennsylvania landfills.
TENORM is naturally occurring radioactive material whose radionuclide concentrations or
potential for human exposure have been increased above levels encountered in the undisturbed
natural environment by human activities.
In 2013, DEP initiated a study to collect information and data needed to effectively manage
TENORM from O&G operations for environmental and health protection. This study included
the assessment of potential worker and public radiation exposure, evaluation of potential impacts
from TENORM waste disposal, and the investigation of possible radiological environmental
effects. The survey and sample data will be used to address potential radiological concerns from
O&G operations, disposal of waste, and product use.
This study report includes recommendations for future actions to be taken to address issues of
concern identified by the study, including additional investigations and surveys.
1.2 Background
The Marcellus Shale formation underlies much of Pennsylvania, with the exception of
southeastern Pennsylvania. The organic-rich portion reaches its maximum thickness in the
northeastern part of the state. The northwestern borders of Franklin, Cumberland, Lebanon,
Berks, Lehigh, and Northampton counties provide the southeastern margin of the Marcellus
Shale formation. Between this border and the approximate corridor with US 220/I 99, the
Marcellus Shale formation crops out in the folded Ridge and Valley physiographic province
where it may be a concern for indoor Radon (Rn). The type of gas found in most areas of the
Marcellus Shale throughout Pennsylvania is geologically mature and consists of mostly methane
that requires little processing prior to use. This gas is commonly called “dry gas.” Marcellus
Shale gas found along the westernmost border of Pennsylvania is less geologically mature;
therefore, in addition to methane, the gas contains additional hydrocarbons such as ethane,
propane, and butane. This gas is commonly called “wet gas” and can be used to produce plastics
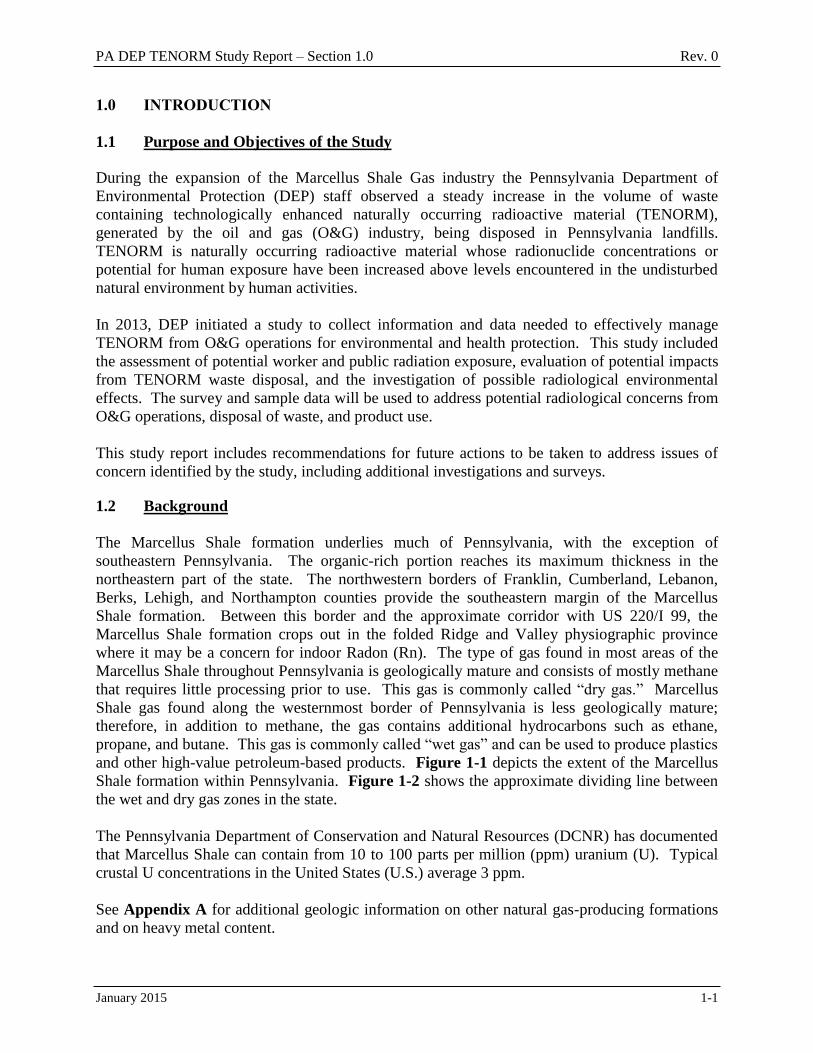
and other high-value petroleum-based products. Figure 1-1 depicts the extent of the Marcellus
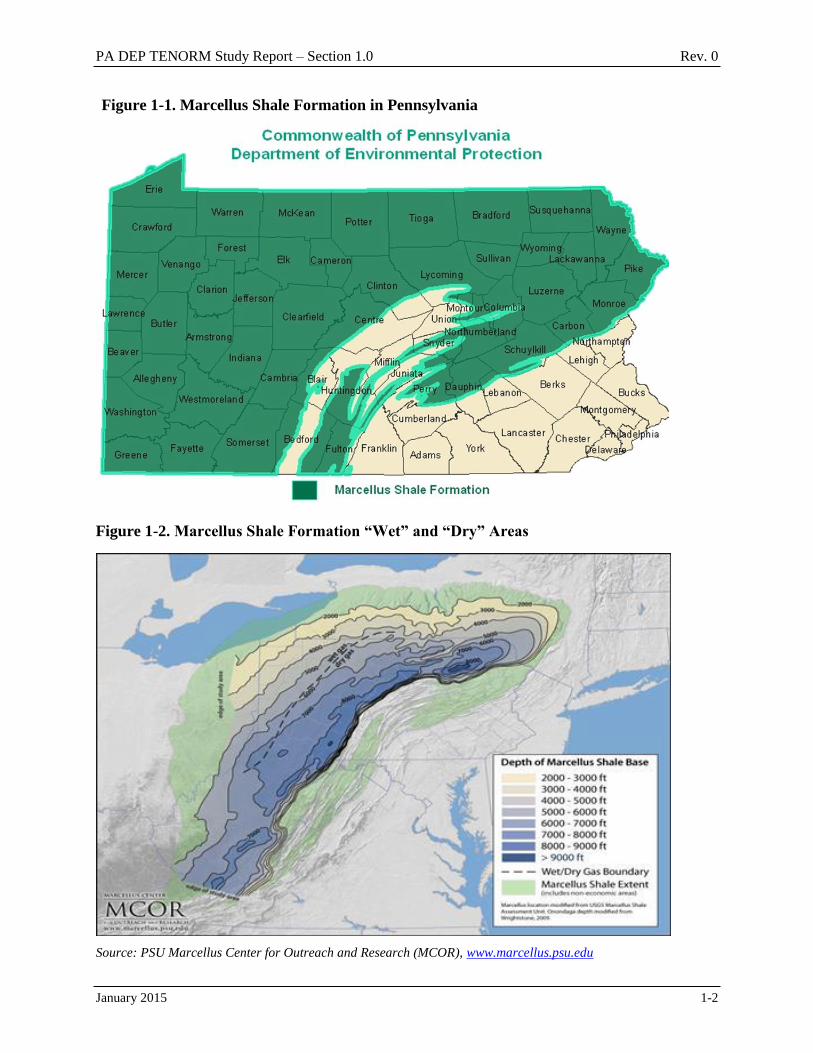
Shale formation within Pennsylvania. Figure 1-2 shows the approximate dividing line between
the wet and dry gas zones in the state.
The Pennsylvania Department of Conservation and Natural Resources (DCNR) has documented
that Marcellus Shale can contain from 10 to 100 parts per million (ppm) uranium (U). Typical
crustal U concentrations in the United States (U.S.) average 3 ppm.
See Appendix A for additional geologic information on other natural gas-producing formations
and on heavy metal content.
PA DEP TENORM Study Report – Section 1.0 Rev. 0
January 2015 1-2
Figure 1-1. Marcellus Shale Formation in Pennsylvania
Figure 1-2. Marcellus Shale Formation “Wet” and “Dry” Areas
Source: PSU Marcellus Center for Outreach and Research (MCOR), www.marcellus.psu.edu
PA DEP TENORM Study Report – Section 1.0 Rev. 0
January 2015 1-3
Marcellus Shale and other geologic formations rich in O&G resources may contain naturally
occurring radioactive material (NORM), specifically U, U-238 parent and thorium (Th), Th-232
parent, and their decay progeny, as well as Potassium-40 (K-40). These series occur naturally
and are the most prevalent of the three natural decay series, the third being the actinium (Ac),
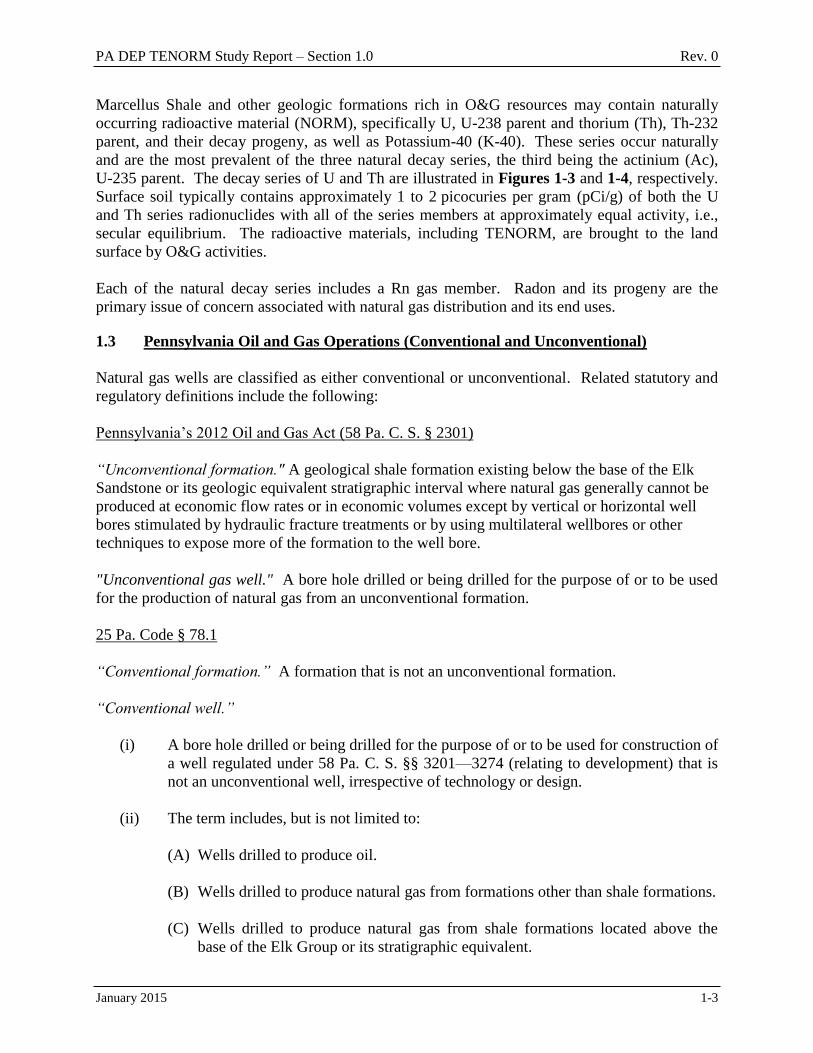
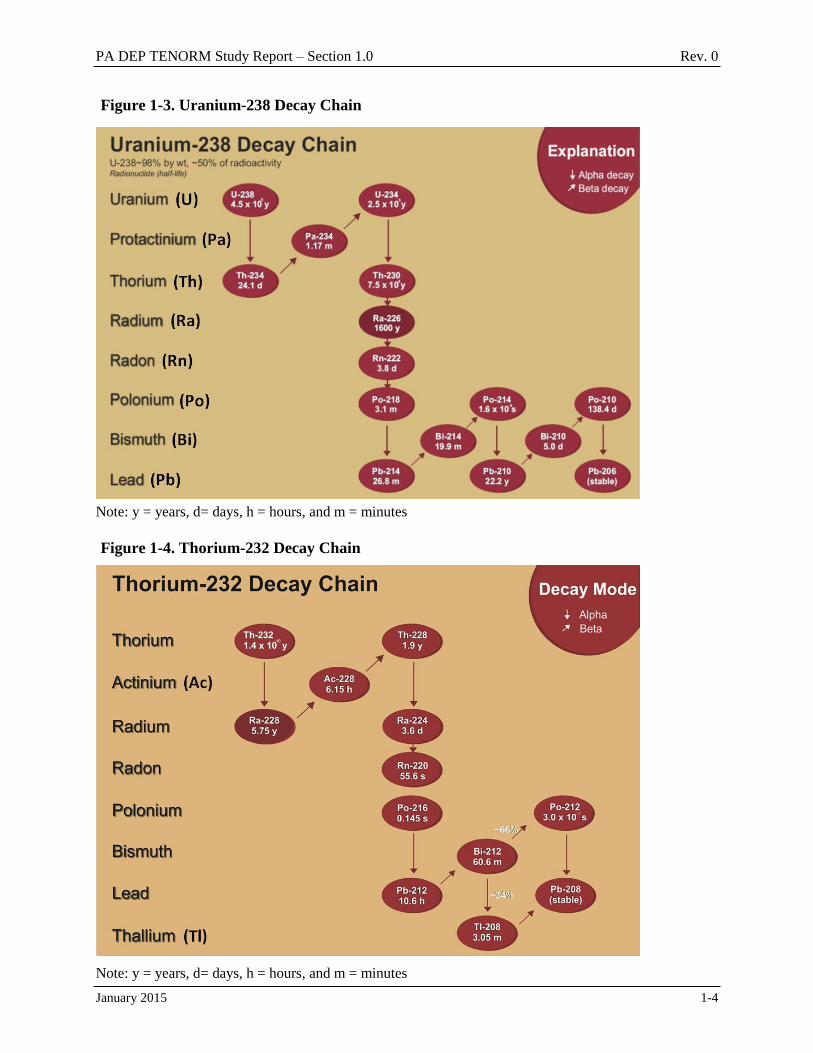
U-235 parent. The decay series of U and Th are illustrated in Figures 1-3 and 1-4, respectively.
Surface soil typically contains approximately 1 to 2 picocuries per gram (pCi/g) of both the U
and Th series radionuclides with all of the series members at approximately equal activity, i.e.,
secular equilibrium. The radioactive materials, including TENORM, are brought to the land
surface by O&G activities.
Each of the natural decay series includes a Rn gas member. Radon and its progeny are the
primary issue of concern associated with natural gas distribution and its end uses.
1.3 Pennsylvania Oil and Gas Operations (Conventional and Unconventional)
Natural gas wells are classified as either conventional or unconventional. Related statutory and
regulatory definitions include the following:
Pennsylvania’s 2012 Oil and Gas Act (58 Pa. C. S. § 2301)
“Unconventional formation." A geological shale formation existing below the base of the Elk
Sandstone or its geologic equivalent stratigraphic interval where natural gas generally cannot be
produced at economic flow rates or in economic volumes except by vertical or horizontal well
bores stimulated by hydraulic fracture treatments or by using multilateral wellbores or other
techniques to expose more of the formation to the well bore.
"Unconventional gas well." A bore hole drilled or being drilled for the purpose of or to be used
for the production of natural gas from an unconventional formation.
25 Pa. Code § 78.1
“Conventional formation.” A formation that is not an unconventional formation.
“Conventional well.”
(i) A bore hole drilled or being drilled for the purpose of or to be used for construction of
a well regulated under 58 Pa. C. S. §§ 3201—3274 (relating to development) that is
not an unconventional well, irrespective of technology or design.
(ii) The term includes, but is not limited to:
(A) Wells drilled to produce oil.
(B) Wells drilled to produce natural gas from formations other than shale formations.
(C) Wells drilled to produce natural gas from shale formations located above the
base of the Elk Group or its stratigraphic equivalent.
PA DEP TENORM Study Report – Section 1.0 Rev. 0
January 2015 1-4
Figure 1-3. Uranium-238 Decay Chain
Note: y = years, d= days, h = hours, and m = minutes
Figure 1-4. Thorium-232 Decay Chain
Note: y = years, d= days, h = hours, and m = minutes
PA DEP TENORM Study Report – Section 1.0 Rev. 0
January 2015 1-5
(D) Wells drilled to produce natural gas from shale formations located below the
base of the Elk Group where natural gas can be produced at economic flow rates
or in economic volumes without the use of vertical or nonvertical well bores
stimulated by hydraulic fracture treatments or multilateral well bores or other
techniques to expose more of the formation to the well bore.
(E) Irrespective of formation, wells drilled for collateral purposes, such as
monitoring, geologic logging, secondary and tertiary recovery, or disposal
injection.
1.4 Subject Media
The types of media evaluated as part of this study result from the product media that either
contain TENORM or may be impacted by TENORM due to O&G operations. The product
streams evaluated are natural gas and natural gas liquids, i.e., condensates. Other media
evaluated includes solid and liquid wastes, soils, ambient air, and gaseous emission products
associated with O&G operations.
1.4.1 Media Sampled
1.4.1.1 Solids
Natural gas exploration, extraction and production result in various types of solids that may
contain TENORM or may be impacted by TENORM. These materials include drill cuttings,
filter sock residuals, impoundment sludge, tank bottom sludge, pipe scale, wastewater treatment
plant (WWTP) sludge, and soils. Drill cuttings are wastes brought to the surface during the
drilling process. Filter sock residuals and WWTP sludge are generated during the processing of
wastewaters generated by O&G activities. Impoundment and tank bottom sludge accumulates as
a result of solid material settling out of well site wastewater.
Other solids potentially impacted by radioactive isotopes include soils at WWTP discharge
outfalls, soils in the proximity of dirt roads where brines from conventional O&G operations are
used for dust suppression, and pipe scale on natural gas transmission infrastructure.
1.4.1.2 Liquids
There are various types of liquids generated during the development and operating life of a gas
well including drilling muds, used hydraulic fracturing fluid, brine, and other wastewaters.
Liquid wastes are processed at WWTPs for reuse on well sites or to meet National Pollutant
Discharge Elimination System (NPDES) criteria prior to discharge to waters of the
Commonwealth.
The study classified WWTPs into three categories:
1) Publicly Owned Treatment Works (POTWs) are the most common type of WWTPs. These
facilities are designed to process sewage and wastewater from residences and businesses and
may take industrial wastewater under specific circumstances. After the wastewater is
PA DEP TENORM Study Report – Section 1.0 Rev. 0
January 2015 1-6
processed and meets specified chemical criteria, the processed water may be discharged to
streams under an NPDES permit.
2) Centralized Waste Treatment (CWT) facilities are designed to process commercial and
industrial liquid wastes prior to discharge to receiving streams under an NPDES permit.
Additionally, there are some industrial facilities that process wastewater prior to discharge to
POTWs for final processing and discharge (pre-treatment).
3) Zero Liquid Discharge (ZLD) facilities are the most modern and utilize distillation and
chemical technologies to remove solids from the wastewater. The processed wastewater is
returned for reuse at natural gas well sites for hydraulic fracturing of new wells. All
centralized ZLD facilities that recycle water to be used for hydraulic fracturing must be
permitted by DEP.
Landfill leachate is liquid waste generated by the movement of precipitation through the
disposed waste and by the compaction and decomposition of the waste itself. As liquid moves
through the waste, contaminants are leached from the disposed material. Landfills are designed
to ensure leachate does not enter the groundwater and is collected for treatment. Upon meeting
NPDES water quality standards, the treated leachate may be discharged to surface waters. Some
landfills operate onsite treatment systems while others are connected to local POTWs, which
treat landfill leachate prior to discharge. Because landfills accept natural gas industry wastes
such as drill cuttings and treatment sludge that may contain TENORM, there is a potential for
leachate from those facilities to also contain TENORM.
1.4.1.3 Natural Gas
Many facilities, structures, and systems are utilized during the exploration, extraction, and
production of natural gas before the product is distributed to the residential, industrial, and
commercial end users.
Natural gas samples were collected and evaluated for Rn at compressor stations, natural gas
processing plants, and underground storage facilities. Ambient air samples were also collected
and evaluated for Rn at well sites, WWTPs, gathering compressor stations, natural gas-fired
power plants, and landfills.
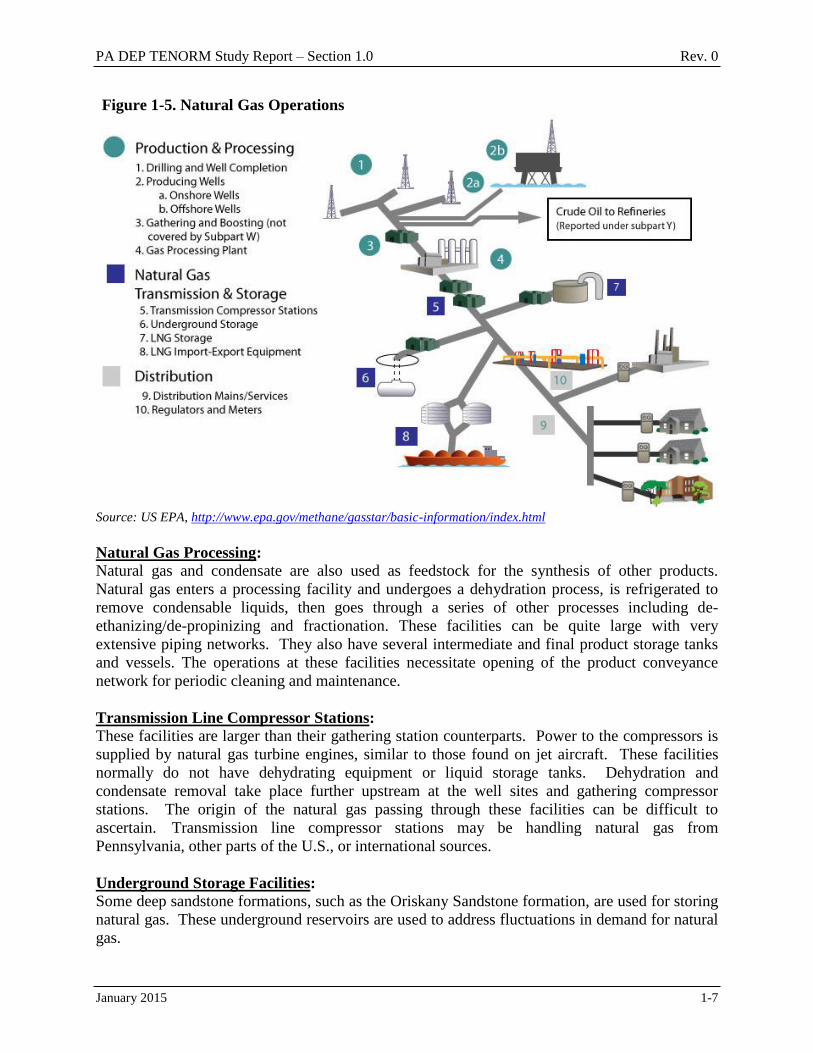
Natural gas passes through gathering lines, compressor stations, transmission lines, natural gas
processing plants, underground storage facilities, and a network of pipes and valves (see
Figure 1-5).
Gathering Compressor Stations:
Gathering compressor stations compress the natural gas from the well sites to transport the
product to the transmission line network. These facilities include large internal combustion
engines and may also include dewatering equipment such as glycol dehydrators and liquid
storage tanks. Geographically, they are typically located at a nexus of piping from well sites.
PA DEP TENORM Study Report – Section 1.0 Rev. 0
January 2015 1-7
Figure 1-5. Natural Gas Operations
Source: US EPA, http://www.epa.gov/methane/gasstar/basic-information/index.html
Natural Gas Processing:
Natural gas and condensate are also used as feedstock for the synthesis of other products.
Natural gas enters a processing facility and undergoes a dehydration process, is refrigerated to
remove condensable liquids, then goes through a series of other processes including de-
ethanizing/de-propinizing and fractionation. These facilities can be quite large with very
extensive piping networks. They also have several intermediate and final product storage tanks
and vessels. The operations at these facilities necessitate opening of the product conveyance
network for periodic cleaning and maintenance.
Transmission Line Compressor Stations:
These facilities are larger than their gathering station counterparts. Power to the compressors is
supplied by natural gas turbine engines, similar to those found on jet aircraft. These facilities
normally do not have dehydrating equipment or liquid storage tanks. Dehydration and
condensate removal take place further upstream at the well sites and gathering compressor
stations. The origin of the natural gas passing through these facilities can be difficult to
ascertain. Transmission line compressor stations may be handling natural gas from
Pennsylvania, other parts of the U.S., or international sources.
Underground Storage Facilities:
Some deep sandstone formations, such as the Oriskany Sandstone formation, are used for storing
natural gas. These underground reservoirs are used to address fluctuations in demand for natural
gas.
PA DEP TENORM Study Report – Section 1.0 Rev. 0
January 2015 1-8
End Users: The primary radionuclide of concern in natural gas is Rn-222. Radon is a noble gas and is not
destroyed by combustion, nor is it removed by an air emission source control device.
Consequently, Rn present in the fuel gas will remain after combustion. However, the process of
combustion dilutes the concentration of Rn in the exhaust gas stream by a ratio of 10:1 of
ambient air to natural gas when perfect combustion is achieved.
1.5 Facility Selection
Category-specific criteria were used to select specific facilities for inclusion in the study. The
criteria differed based on the type of facility. The following lists the various selections.
1.5.1 Well Site Selection
1) A Marcellus Shale formation well site from the dry gas areas predominantly in the northern
and central parts of the state.
2) A Marcellus Shale formation well site from the wet gas area found predominantly in the
southwestern part of the state.
3) A Utica formation well site and other non-Marcellus Shale formations, e.g., Geneseo, Burket,
and Rhinestreet that became available.
4) A conventional O&G well site.
1.5.2 Wastewater Treatment Plant Selection
1) The three types of WWTPs, including POTW facilities, CWT facilities, ZLD facilities.
2) WWTPs that accept wastewater from conventional and unconventional types of well sites.
3) WWTPs that accept waste material from unconventional well sites in the wet gas-producing
area rather than the dry gas-producing area.
4) WWTPs where elevated radioactivity readings have been measured from the intake
wastewater, produced sludge, effluent discharge, or discharge point stream/river sediments,
etc.
5) WWTPs that DEP regional offices have indicated are of particular interest.
1.5.3 Landfill Facility Selection Criteria
1) All Pennsylvania landfills.
2) Nine landfills that accepted the largest amount of TENORM-containing waste during the past
year.
3) Large-volume TENORM-containing waste disposal sites where onsite worker exposure
measurements could be obtained and representative samples of solids could be collected.
1.5.4 Gas Distribution and End Use Operations Selection Criteria
1) Facilities that compress, carry, and distribute natural gas from the wet gas-producing area of
the state.
2) Facilities that compress, carry, and distribute natural gas from the dry gas-producing area of
the state.
PA DEP TENORM Study Report – Section 1.0 Rev. 0
January 2015 1-9
3) Facilities that distribute or process natural gas produced in Pennsylvania rather than those
that distribute or process natural gas from out of state.
4) Major natural gas users, e.g., electrical generator, processing, and storage facilities.
1.5.5 Road Sites Selection Criteria
1) Multiple locations in the southwestern, northwestern, and north-central regions of the state.
2) Roads where liquids from wells in the wet and dry gas-producing areas were applied for dust
suppression and road stabilization.
3) Roads where liquids from wells in the wet and dry gas-producing areas were not applied for
dust suppression and road stabilization.
1.5.6 Well Component Reconditioning Selection Criteria
Well casing/pipe reconditioning or de-scaling facilities in the state.
1.5.7 Centralized Impoundments
1) A facility in the wet gas-producing area.
2) A facility in the dry gas-producing area.
PA DEP TENORM Study Report – Section 2.0 Rev. 0
January 2015 2-1
2.0 STUDY IMPLEMENTATION
2.1 Sampling and Survey Methods
The primary data for this study were gathered using radiological screening surveys and through
the sampling and analysis of solid and liquid wastes, soils, ambient air, and gaseous emission
products associated with O&G operations.
2.1.1 Field Surveys
2.1.1.1 Scope
Radiological surveys were performed to identify the possible presence and abundance of NORM
and TENORM in locations that include the following:
Well Sites (Section 3.0)
Offices and living quarters
Storage and maintenance areas
Drill rigs and associated equipment
Temporary wastewater storage tanks
Wastewater impoundments
Production equipment
Drill cutting pits (closed)
Wastewater Treatment Plants (Section 4.0)
Wastewater off-load areas
Influent wastewater storage areas (untreated)
Effluent wastewater storage areas (treated)
Processing tanks and equipment
Offices, break rooms, laboratories
Discharge points where applicable
Landfills (nine study landfills – details provided in Section 5.0)
Offices and other occupied spaces
Storage and maintenance areas
Natural gas processing facilities
Leachate processing facilities
Earthmoving equipment
Gas Distribution and End Use (Section 6.0)
Compressor stations
Natural gas-fired power plants
Natural gas processing facilities
Oil and Gas Brine-Treated Roads (Section 7.0)
2.1.1.2 Instrumentation and Documentation
Radiological instrumentation used for field surveys included portable scalers/ratemeters with
various scintillators for detection of alpha (, beta ( and/or gamma radiation; portable gamma
PA DEP TENORM Study Report – Section 2.0 Rev. 0
January 2015 2-2
dose rate meters; portable gamma exposure rate meters; general purpose Geiger-Muller (GM)
detectors; and field counters for low-level and radiation detection.
All instruments used were calibrated and their operation verified prior to use on each day they
were used. The instruments were maintained and operated in accordance with Perma-Fix
Environmental Services, Inc. (Perma-Fix) operating procedures by qualified health physics
technicians. Records of calibration, daily quality control (QC) checks for the days used, survey
results, logbooks, and various other records generated during field screening survey activities are
included in Appendix B.
2.1.1.3 Activities
General descriptions of the various field surveys performed as part of this study are provided
below.
2.1.1.3.1 Radiological Surveys of Facilities and Reference Background Areas
Gamma radiation exposure rates and gross gamma radioactivity surveys were performed at each
facility included in the study. The gamma radiation exposure rates were measured using a
Bicron Micro-Rem Meter recorded in micro-Roentgen equivalent man per hour (μrem/hr) or a
Ludlum Model 19 Micro-R Meter recorded in units of micro-Roentgen per hour (μR/hr). The
gross gamma radioactivity surveys were recorded in counts per minute (cpm) using a Ludlum
Model 44-10 Sodium Iodide (NaI) detector. To properly evaluate survey data, surveys were also
performed in areas outside the influence of the facility to establish natural background.
2.1.1.3.2 Radiological Surveys of Liquid Samples and Tanks
Liquid samples were collected at each of the three types of WWTPs and included influent,
effluent, and in-stream discharge points where POTWs, and in limited cases CWTs, are
permitted to discharge directly to a receiving stream.
During liquid sampling, gamma radiation exposure surveys were performed. In addition, gamma
radiation exposure rates were performed on contact with tanks when possible. Otherwise,
measurements were collected in the general proximity of the point of sample collection or tank.
To properly evaluate survey data, surveys were also performed in areas outside the influence of
the facility to establish natural background.
2.1.1.3.3 Radiological Surveys of Equipment and Structures
Equipment such as drill rigs, well development equipment, etc., was subject to field screening
surveys including:
Gamma radiation exposure rate surveys using a Bicron MicroRem Meter or Ludlum Model
19.
Gross gamma radioactivity surveys using a Ludlum Model 44-10 NaI detector.
Total and surface radioactivity using a direct frisk Ludlum Model 43-89 detector and/or a
Ludlum Model 44-93 and cpm results converted to units of disintegrations per minute per
100 square centimeters (dpm/100 cm2) of surface area surveyed.
PA DEP TENORM Study Report – Section 2.0 Rev. 0
January 2015 2-3
Removable and surface radioactivity by sample collection with smears. Smears were
counted on a Ludlum 2929 with a Model 43-10-1 portable scaler/ratemeter and detector.
Count results were converted to units of dpm/100 cm2 of surface area smeared.
To properly evaluate survey data, surveys were also performed in areas outside the influence of
the facility to establish natural background.
2.1.1.3.4 Radiological Surveys of Samples
All samples collected were surveyed prior to transportation to the laboratory. The surveys were
performed on contact with the sample container and included:
Gamma radiation exposure rate surveys using a Bicron MicroRem Meter or Ludlum Model
19.
Gross gamma radioactivity surveys using a Ludlum Model 44-10 NaI detector.
Total and surface radioactivity using a direct frisk Ludlum Model 43-89 detector or a
Ludlum Model 44-93 detector.
Removable and surface radioactivity by sample collection with smears. Smears were
counted on a Ludlum 2929 with a Model 43-10-1 portable scaler/ratemeter and detector.
To properly evaluate survey data, surveys were also performed in areas outside the influence of
the facility to determine natural background.
2.1.2 Field Sampling Activities
2.1.2.1 Scope
DEP sampled solids, liquids, and gas during the study to understand the movement and potential
exposure pathways of TENORM from O&G operations. The sampling and analysis of
environmental media provides data that are informative in determining radionuclides of concern
as well as their potential mobility. The media sampled during this study included:
Solid samples:
− Drill cuttings
− Wastewater treatment sludge/filter cake
− Wastewater treatment discharge sediment
− Soil samples
− Filter sock residuals
Liquid samples:
− Flowback and produced water
− Accumulated liquids from production equipment
− Wastewater treatment influent and effluent
− Landfill leachate influent and effluent
Gas samples:
− Natural gas (for Rn-222 concentration)
− Ambient air (for Rn-222 concentration)
Removable / radioactivity surface samples:
− Removable radioactivity by smear sampling
PA DEP TENORM Study Report – Section 2.0 Rev. 0
January 2015 2-4
− Removable radioactivity by smear sampling
Collected samples, with the exception of smear samples, were transported to the DEP Bureau of
Laboratories (DEP Laboratory) under chain-of-custody control. Five percent of samples were
split by Perma-Fix and forwarded by the DEP Laboratory to the independent QC laboratory
(GEL Laboratory of Charleston, SC) for filtration, as needed, and analyses. Smear samples were
transported to the Perma-Fix laboratory, and 10 percent of the smear samples were forwarded to
the DEP Laboratory for duplicate analysis.
2.1.2.2 Solid Sample Methods
Solid samples were collected using clean sampling equipment. Samples were collected using
stainless steel trowels and bowls, then promptly transferred into laboratory-approved containers
and immediately labeled to maintain identification.
2.1.2.3 Liquid Sample Methods
When sampling tanks through a valve, samples were collected directly into the clean sample
container. Otherwise, representative tank samples were collected using a clean high-density
polyethylene (HDPE) dipper. The sampled liquids were transferred to clean, laboratory-
approved containers. Two consecutive 4-liter (L) samples were obtained at each sample
location.
When the samples were received at the DEP Laboratory, they were preserved. Sample
preservation is the measure or measures taken to prevent reduction or loss of target analytes.
Analyte loss can occur between sample collection and laboratory analysis because of physical,
chemical, and biological processes that result in chemical precipitation, adsorption, oxidation,
reduction, ion exchange, degassing, or degradation. Preservation stabilizes analyte
concentrations for a limited period of time. The first sample was analyzed after preservation
without filtration. The second sample was preserved and subsequently filtered in the laboratory
using a 0.45-micron mixed cellulose ester filter. The filtered sample was placed into a clean
container. The filtrates were maintained for analysis.
2.1.2.4 Gas Sample Methods
Radon concentration in ambient air was measured by various technologies. The technology used
was dependent on several factors, including the location, the collection period/detector
deployment period, and atmospheric conditions such as relative humidity. Sampling
technologies used for this study included:
Electret ion chambers (EICs)
Alpha track detectors (ATDs)
Natural gas grab samples were also collected to measure Rn concentrations. Natural gas was
collected directly into scintillation cells, referred to as Lucas cells. Two Lucas cells were
connected in sequence, which provided a duplicate sample at each sample location. An in-line
Millipore® Type HA, 0.45-micron glass fiber filter was used prior to natural gas entering the first
cell. This filter prevents sample contamination by Rn particulate progeny.
PA DEP TENORM Study Report – Section 2.0 Rev. 0
January 2015 2-5
The natural gas was flowed through the cells for 10 minutes. This provided for purging of the
gas lines and the scintillation cells, resulting in the collection of new discrete samples for
analysis.
2.1.2.5 Removable Alpha/Beta Surface Radioactivity Smear Sample Method
Smear samples of removable and surface radioactivity were collected by pressing a
47-millimeter diameter filter paper to the sampling surface and smearing with moderate pressure
approximately 100 cm2 of surface area.
2.2 Laboratory Methods
2.2.1 Solid Matrix
The following sample types were classified as solid matrices: surface soil impacted by
sediments, filter cakes, soils, sludge, drill cuttings, drilling muds, proppant sand, and filter socks,
including the materials inside the socks. Upon arrival at the DEP Laboratory, the samples were
scanned for radiological activity using a GM pancake probe. The samples were logged with the
appropriate standard analysis code that designated the requested radiological analyses.
2.2.1.1 Gamma Spectroscopy
The samples were dried in a Presier Scientific Model 91-2290-83 100°C oven, ground to a fine
powder (~80 mesh), weighed into a new 0.5-L Marinelli, sealed with general purpose
polyethylene tape, and analyzed by high purity germanium gamma spectroscopy. The following
radionuclides were identified or inferred using gamma spectroscopy:
Ra-226 Direct Energy Line 186 keV
Ra-228 Inferred Energy Line 911 keV (Ac-228)
U-235 Direct Energy Line 143 keV
Ac-228 Direct Energy Line 911 keV
Th-232 Inferred Energy Line 911 keV (Ac-228)
U-238 Inferred Energy Line 63.3 keV (Th-234)
Pb-212 Direct Energy Line 238 keV
Pb-214 Direct Energy Line 351 keV
Bi-212 Direct Energy Line 727 keV
Bi-214 Direct Energy Line 609 keV
K-40 Direct Energy Line 1,460 keV
The sample was counted again using gamma spectroscopy after a minimum of 21 days from the
first analysis date. The same radionuclides were identified or inferred. Prior to the start of
analysis, a daily background and instrument QC check was completed, reviewed, and validated.
The gamma spectroscopy reference method is U.S. Department of Energy (DOE) 4.5.2.3.
2.2.1.2 X-ray Fluorescence
After gamma spectroscopy analyses were complete, the dried solid samples were analyzed for
various elements using X-ray fluorescence (XRF). The samples were weighed into XRF sample
PA DEP TENORM Study Report – Section 2.0 Rev. 0
January 2015 2-6
cups, covered with a Prolene® film, and analyzed using an X-ray spectrometer. Forty-eight
elements were analyzed using XRF. The XRF analyses were conducted using a DEP
Laboratory-developed method. Standard QC calibration verification instrument checks were
performed using National Institute of Standards and Technology (NIST) primary traceable
standards.
2.2.1.3 Alpha Spectroscopy
One percent of solid samples analyzed by gamma spectroscopy were selected and analyzed using
alpha spectroscopy for U-238, U-235, U-234, Th-232, Th-230, and Th-228. Prior to analysis, the
samples were digested using Health and Environmental Chemistry: Analytical Techniques, Data
Management, and Quality Assurance ER200 and ER230 sample preparation methods. A
10-gram (g) aliquot of the original solid sample matrix was digested and diluted to a final
volume of 4 L, resulting in a concentration of 2.5 g/L. The isotopes and iron (Fe) carrier added
were precipitated from the liquid as hydroxides, re-solubilized in hydrochloric acid (HCl), and
then passed over a column of anion exchange resin, which removed the Fe and other interfering
isotopes. Each isotopic fraction was concentrated, converted to the nitrate salt, and applied to a
second anion exchange column. After washing the resin, the isotope was eluted,
electrodeposited, and analyzed for isotopic U and Th. Instrument background, secondary, and
pulser counts were obtained at the beginning and end of every sample batch. The alpha
spectroscopy reference method is Standard Methods 7500-U C.
2.2.2 Liquid Matrix
The following sample types received at the DEP Laboratory were classified as liquid matrices:
WWTP influent and effluent liquids
Landfill leachates
Well site liquids/fluids including:
Hydraulic fracturing fluid
Flowback fluid
Produced water
Based on solid content, a portion of the drilling mud samples were analyzed as liquids. Upon
arrival at the DEP Laboratory, the samples were scanned for radiological activity using a GM
pancake probe. The samples were preserved with nitric acid (HNO3) to a potential hydrogen
(pH) less than 2 and logged with the appropriate standard analysis code that designates the
requested radiological analyses. After being acidified, samples were maintained a minimum of
16 hours prior to analysis. Samples were vacuum filtered using a 0.45-micron mixed cellulose
ester filter. The filtrate was collected and transferred into a clean gallon cubitainer. The filtered
solids were analyzed for gamma-emitting radionuclides using gamma spectroscopy (see solid
matrix). The liquid samples were counted for gross -, gross -, and gamma-emitting
radionuclides.
PA DEP TENORM Study Report – Section 2.0 Rev. 0
January 2015 2-7
2.2.2.1 Gamma Spectroscopy
The liquid samples were measured to 3 L, placed into a clean 4-L Marinelli, sealed with general
purpose polyethylene tape, and analyzed. The following radionuclides were identified or
inferred using gamma spectroscopy:
Ra-226 Direct Energy Line 186 keV
Ra-228 Inferred Energy Line 911 keV (Ac-228)
U-235 Direct Energy Line 143 keV
Ac-228 Direct Energy Line 911 keV
Th-232 Inferred Energy Line 911 keV (Ac-228)
U-238 Inferred Energy Line 63.3 keV (Th-234)
Pb-212 Direct Energy Line 238 keV
Pb-214 Direct Energy Line 351 keV
Bi-212 Direct Energy Line 727 keV
Bi-214 Direct Energy Line 609 keV
K-40 Direct Energy Line 1,460 keV
The samples were counted again using gamma spectroscopy after a minimum of 21 days from
the date of their first analysis. The same radionuclides were identified or inferred each day
analyses were performed. Prior to the start of analysis, a background and standard QC
calibration verification check was completed, reviewed, and validated.
2.2.2.2 Gross Alpha Gross Beta Analyses
An aliquot of sample was evaporated to less than 5 milliliters. The evaporated volume was
transferred to a 2-inch diameter planchet using 10 percent HNO3 and dried. The dried sample
was placed in a desiccator for 72 hours. The samples were flamed to convert the hydroscopic
salts to oxides. The samples were counted for gross - and gross -emitting radionuclides using
a gas proportional counter. Standard QC calibration verification and daily background checks
were completed, reviewed, and validated at the beginning and end of analysis. The gross and
gross reference method is EPA 900.0.
2.2.2.3 X-Ray Fluorescence
The liquid samples were analyzed for various metals using XRF. The samples were weighed
into XRF sample cups, covered with a Prolene® film, and analyzed using an X-ray spectrometer.
Forty-eight elements were identified using XRF. The XRF analyses were conducted using a
DEP Laboratory-developed method. Standard QC calibration verification instrument checks
were performed using NIST primary traceable standards.
2.2.2.4 Inorganic Analyses
During the third round of sampling, additional analyses including basic inorganic analyses were
included as part of the study. The samples were received by the DEP Laboratory and logged
with the appropriate standard analysis code that designated the requested inorganic analyses.
The analyses included hardness (SM2340 B), pH (SM4500H-B), specific conductance at 25.0°C
PA DEP TENORM Study Report – Section 2.0 Rev. 0
January 2015 2-8
(SM2510B), total chloride (SM4500-CL E), total sulfate (EPA 375.2), total dissolved solids at
180°C (USGS I-1750), and total suspended solids (USGS I-3765).
2.2.3 Gas Matrix
Natural gas samples were collected at various locations using scintillation cells with
photomultiplier tubes and analyzed for Rn concentration. The scintillation cells were counted in
one of two counters: the Pylon AB-5 Portable Radiation Monitor or the Ludlum Model 2200
Scaler-Ratemeter. The counter used was dependent upon the type of scintillation cell used to
collect the sample. All samples were allowed to equilibrate for a minimum of four hours before
being counted. In all cases, the first count was not used in the calculations to allow for “dark
adaptation” of the instruments. The next three counts were each individually calculated and the
average and standard deviation calculated. The average result, plus or minus (±) two standard
deviations, and the minimum detectable activity are reported in the data tables.
Natural gas is composed mostly of methane, which is lighter and less dense than air. Alpha
counting efficiency is directly proportional to the density of the gas counted. Because the
scintillation cells were calibrated using a known concentration of Rn in ambient air, density
correction was applied to all Rn in natural gas results. A correction factor (Jenkins et al., 2014)
was used for this effect to prevent biasing the results. The final calculated Rn concentrations
were divided by 1.054. This reduced all results by five percent to correct for the bias.
2.2.4 Filter Matrix – Smears
All smear samples were collected by Perma-Fix technicians and transported to the Perma-Fix
Laboratory for analysis. All smear samples were counted for gross and gross radioactivity.
Ten percent of those smear samples were then forwarded to the DEP Laboratory for duplicate
analysis as a QC measure.
Upon arrival at the Perma-Fix laboratory, the samples were logged. The smear samples were
placed on a 2-inch diameter planchet and analyzed for gross and gross particles using a
Ludlum Model 2929 Meter equipped with a Ludlum Model 43-10-1 Smear Counter (zinc-sulfide
scintillation detector). A standard QC background and calibration verification count was
performed each day the smear counter was used.
Upon receipt at the DEP Laboratory, the samples were logged. The smear samples were placed
on a 2-inch diameter planchet and analyzed for gross and gross particles using a gas
proportional counter. Prior to the start of analysis, an instrument source check and background
check were completed, reviewed, and validated. The gross and gross filter analyses were
conducted using the DEP Laboratory-developed method. A standard QC calibration verification
instrument check was performed with NIST traceable sources.
2.3 Survey and Sample Analyses Data Management
All of the solid and liquid samples were analyzed by the DEP Laboratory using gamma
spectroscopy. The result, the standard two-sigma error (95 percent confidence level) and the
minimum detectable concentration (MDC) were reviewed for each of the following
radionuclides as reported:
PA DEP TENORM Study Report – Section 2.0 Rev. 0
January 2015 2-9
Natural Uranium Decay Series Results (U-238, Ra-226, Pb-214, and Bi-214)
Natural Thorium Decay Series Results (Th-232, Ra-228, Ac-228, Pb-212, and Bi-212)
Natural Actinium Decay Series Results (U-235)
Miscellaneous (K-40)
2.3.1 Limitations on Gamma Spectroscopy Results
The following limitations on gamma spectroscopy of radioactive samples were considered when
reviewing the analytical results for solid and liquid samples:
Gamma spectroscopy cannot directly measure radium (Ra)-228. Rather, Ra-228 is inferred
from a short-lived progeny of Ra-228, Ac-228, which is readily detected by gamma
spectroscopy when the radionuclides are in secular equilibrium. Due to the relative half-lives
of Ra-228 (5.8 years) and Ac-228 (6.1 hours) after 24 hours, this is always the case for the
samples collected as part of the study.
Gamma spectroscopy cannot directly measure Th-232. Consequently, Th-232 is inferred
from the short-lived progeny of Th-232, Ra-228, when the radionuclides are in secular
equilibrium. Due to the difference in solubility between Th and Ra, this is not the case in
liquid samples or in solid samples of wastewater residue, sludge and filter cake. Only the
soluble Ra and progeny of Ra are present in those samples. Consequently, knowledge of the
status of the secular equilibrium of the Th decay series within the sample matrix is necessary
to properly evaluate gamma spectroscopy results.
Uranium-238 can be detected by gamma spectroscopy, but the gamma emission used is of
low energy and low yield, resulting in a high MDC and high standard error compared to the
other radionuclides in the environment. Consequently, the U-238 result is not used as
positive identification of U-238 without knowledge of the status of U series secular
equilibrium and the identification of additional, more statistically robust U progeny.
Uranium is insoluble in water while Ra is water soluble. Therefore, wastewater, produced
and flowback fluids, and wastewater treatment solids (sludge and filter cake) contain Ra and
its progeny but do not include U.
Only the radionuclides present in a given sample are reported in the following sections. The
average, median, standard deviation, and minimum and maximum values are also provided at the
bottom of each table for each set of results. Please note:
When the reported result is less than the MDC, a value equal to ½ the MDC is used in the
derivation of average, median, standard deviation, and minimum and maximum values.
When “<” precedes the reported result, the value is the MDC.
Appendix C contains the gamma spectroscopy analytical analysis results for each radionuclide
identified along with their associated standard two-sigma counting error (error) and the MDC for
the analyses.
2.3.2 Radium-226 Quantification by Gamma Spectroscopy
Radium-226 may be measured directly by detection of its 186.2 kilo-electron volt (keV) energy
line, 3.28 percent yield. For liquid samples and sludge/filter cake samples that do not contain U,
PA DEP TENORM Study Report – Section 2.0 Rev. 0
January 2015 2-10
this yields an accurate Ra-226 result. However, in soil and drill cutting samples, the presence of
U-235 causes interference with direct Ra-226 detection because one of its gamma lines is of
similar energy, 185.7 keV at 54 percent yield. In solid samples where natural U including U-238
and Ra-226 are at equal activity and U-235 is at 1/22 the activity of U-238, the theoretical
overestimation of Ra-226 was quantified assuming the gamma peaks for Ra-226 and U-235
completely overlap. The theoretical overestimation of Ra-226 is presented in Table 2-1.
The short-lived equilibrium progeny of Ra, Pb-214 and Bi-214, may be used to infer Ra-226
concentrations in soil or drill cuttings when U-235 is present in the sample. The parent of these
progeny, Rn-222, is a gas and has a half-life of 3.8 days. When the soil or drill cuttings sample
is collected, some of the Rn gas escapes the solid matrix. Therefore, samples are sealed to allow
the Rn gas to develop for three weeks of progeny ingrowth to reestablish equilibrium after the
sample has been sealed.
2.3.3 Criteria for Comparison to Analytical Analyses Results
Table 2-2 presents criteria against which the analytical results and assessments of this study
were evaluated.
2.3.4 Normal Background Radioactivity Values
Table 2-3 presents average, minimum, and maximum background radioactivity values for soil in
the U.S. used as a reference point when reviewing analytical results of solid samples.
2.3.5 Data Presentation
A large volume of survey and sample analytical analyses data were generated. The next five
sections present the survey and sampling data for Well Sites, WWTPs, Landfills, Gas
Distribution and End Use, and Brine-Treated Roads.
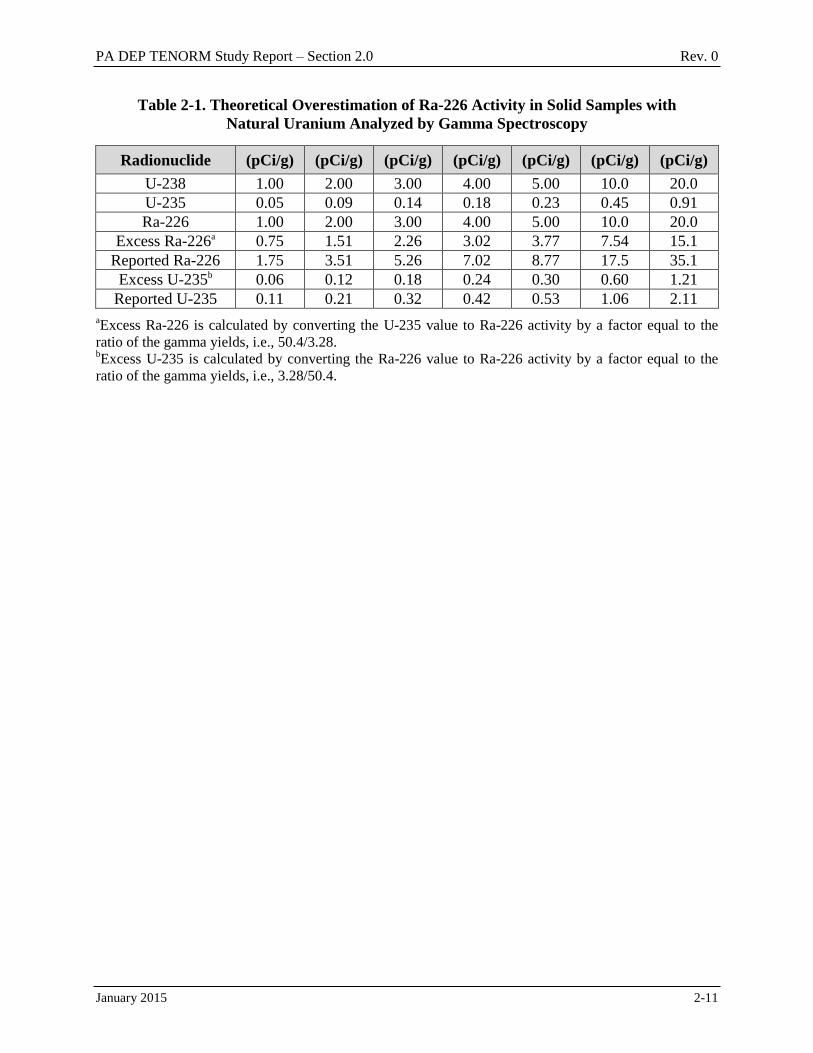
PA DEP TENORM Study Report – Section 2.0 Rev. 0
January 2015 2-11
Table 2-1. Theoretical Overestimation of Ra-226 Activity in Solid Samples with
Natural Uranium Analyzed by Gamma Spectroscopy
Radionuclide (pCi/g) (pCi/g) (pCi/g) (pCi/g) (pCi/g) (pCi/g) (pCi/g)
U-238 1.00 2.00 3.00 4.00 5.00 10.0 20.0
U-235 0.05 0.09 0.14 0.18 0.23 0.45 0.91
Ra-226 1.00 2.00 3.00 4.00 5.00 10.0 20.0
Excess Ra-226a 0.75 1.51 2.26 3.02 3.77 7.54 15.1
Reported Ra-226 1.75 3.51 5.26 7.02 8.77 17.5 35.1
Excess U-235b 0.06 0.12 0.18 0.24 0.30 0.60 1.21
Reported U-235 0.11 0.21 0.32 0.42 0.53 1.06 2.11
aExcess Ra-226 is calculated by converting the U-235 value to Ra-226 activity by a factor equal to the
ratio of the gamma yields, i.e., 50.4/3.28. bExcess U-235 is calculated by converting the Ra-226 value to Ra-226 activity by a factor equal to the
ratio of the gamma yields, i.e., 3.28/50.4.
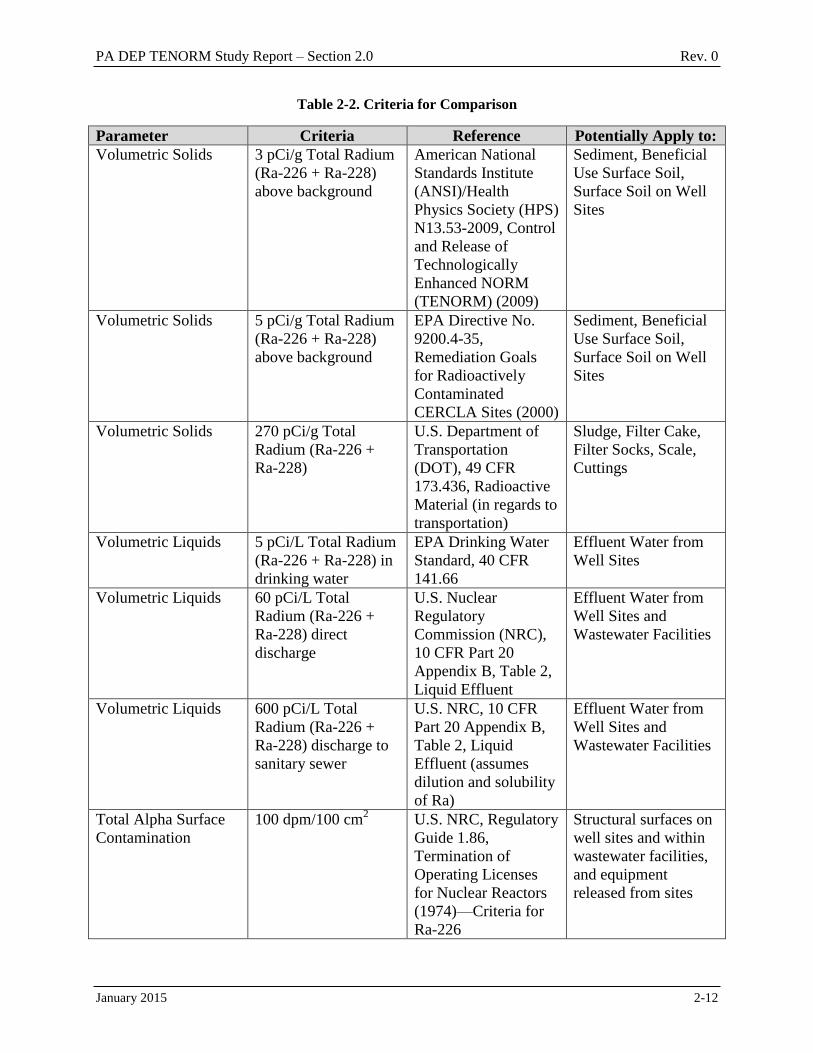
PA DEP TENORM Study Report – Section 2.0 Rev. 0
January 2015 2-12
Table 2-2. Criteria for Comparison
Parameter Criteria Reference Potentially Apply to:
Volumetric Solids 3 pCi/g Total Radium
(Ra-226 + Ra-228)
above background
American National
Standards Institute
(ANSI)/Health
Physics Society (HPS)
N13.53-2009, Control
and Release of
Technologically
Enhanced NORM
(TENORM) (2009)
Sediment, Beneficial
Use Surface Soil,
Surface Soil on Well
Sites
Volumetric Solids 5 pCi/g Total Radium
(Ra-226 + Ra-228)
above background
EPA Directive No.
9200.4-35,
Remediation Goals
for Radioactively
Contaminated
CERCLA Sites (2000)
Sediment, Beneficial
Use Surface Soil,
Surface Soil on Well
Sites
Volumetric Solids 270 pCi/g Total
Radium (Ra-226 +
Ra-228)
U.S. Department of
Transportation
(DOT), 49 CFR
173.436, Radioactive
Material (in regards to
transportation)
Sludge, Filter Cake,
Filter Socks, Scale,
Cuttings
Volumetric Liquids 5 pCi/L Total Radium
(Ra-226 + Ra-228) in
drinking water
EPA Drinking Water
Standard, 40 CFR
141.66
Effluent Water from
Well Sites
Volumetric Liquids 60 pCi/L Total
Radium (Ra-226 +
Ra-228) direct
discharge
U.S. Nuclear
Regulatory
Commission (NRC),
10 CFR Part 20
Appendix B, Table 2,
Liquid Effluent
Effluent Water from
Well Sites and
Wastewater Facilities
Volumetric Liquids 600 pCi/L Total
Radium (Ra-226 +
Ra-228) discharge to
sanitary sewer
U.S. NRC, 10 CFR
Part 20 Appendix B,
Table 2, Liquid
Effluent (assumes
dilution and solubility
of Ra)
Effluent Water from
Well Sites and
Wastewater Facilities
Total Alpha Surface
Contamination
100 dpm/100 cm2 U.S. NRC, Regulatory
Guide 1.86,
Termination of
Operating Licenses
for Nuclear Reactors
(1974)—Criteria for
Ra-226
Structural surfaces on
well sites and within
wastewater facilities,
and equipment
released from sites

PA DEP TENORM Study Report – Section 2.0 Rev. 0
January 2015 2-13
Table 2-2. Criteria for Comparison
Parameter Criteria Reference Potentially Apply to:
Total Beta Surface
Contamination
1,000 dpm/100 cm2 U.S. NRC, Regulatory
Guide 1.86,
Termination of
Operating Licenses
for Nuclear Reactors
(1974)—Criteria for
natural Th including
Ra-228
Structural surfaces on
well sites and within
wastewater facilities,
and equipment
released from sites
Removable Alpha
Surface
Contamination
20 dpm/100 cm2 (of
surface area smear
sampled)
U.S. NRC, Regulatory
Guide 1.86,
Termination of
Operating Licenses
for Nuclear Reactors
(1974)—Criteria for
Ra-226
Structural surfaces on
well sites and within
wastewater facilities,
and equipment
released from sites
Removable Beta
Surface
Contamination
200 dpm/100 cm2 (of
surface area smear
sampled)
U.S. NRC, Regulatory
Guide 1.86,
Termination of
Operating Licenses
for Nuclear Reactors
(1974)—Criteria for
natural Th including
Ra-228
Structural surfaces on
well sites and within
wastewater facilities,
and equipment
released from sites
Volumetric Gas 4 pCi/L EPA, 402/K-12/002,
A Citizen’s Guide to
Radon (2012)
Buildings, General
Public
Volumetric Gas 30 pCi/L Derived Air
Concentration (DAC)
U.S. NRC, 10 CFR
Part 20 Appendix B,
Table 1, Col 3
Occupational
Exposure
Volumetric Gas 100 pCi/L Occupational Safety and
Health Administration
(OSHA) 29 CFR
1910.1096
General Public
Workforce
Annual Exposure 25 mrem/year plus as
low as reasonably
achievable (ALARA)
U.S. NRC, 10 CFR
20.1402-20.1403,
Radiological Criteria
for Unrestricted Use
General Public
Annual Exposure 100 mrem/year U.S. NRC, 10 CFR
20.1301, Radiation
Dose Limits for
Members of the
Public
General Public
Workers not trained
as Radiation Workers,
i.e., well site and
water facilities
workers
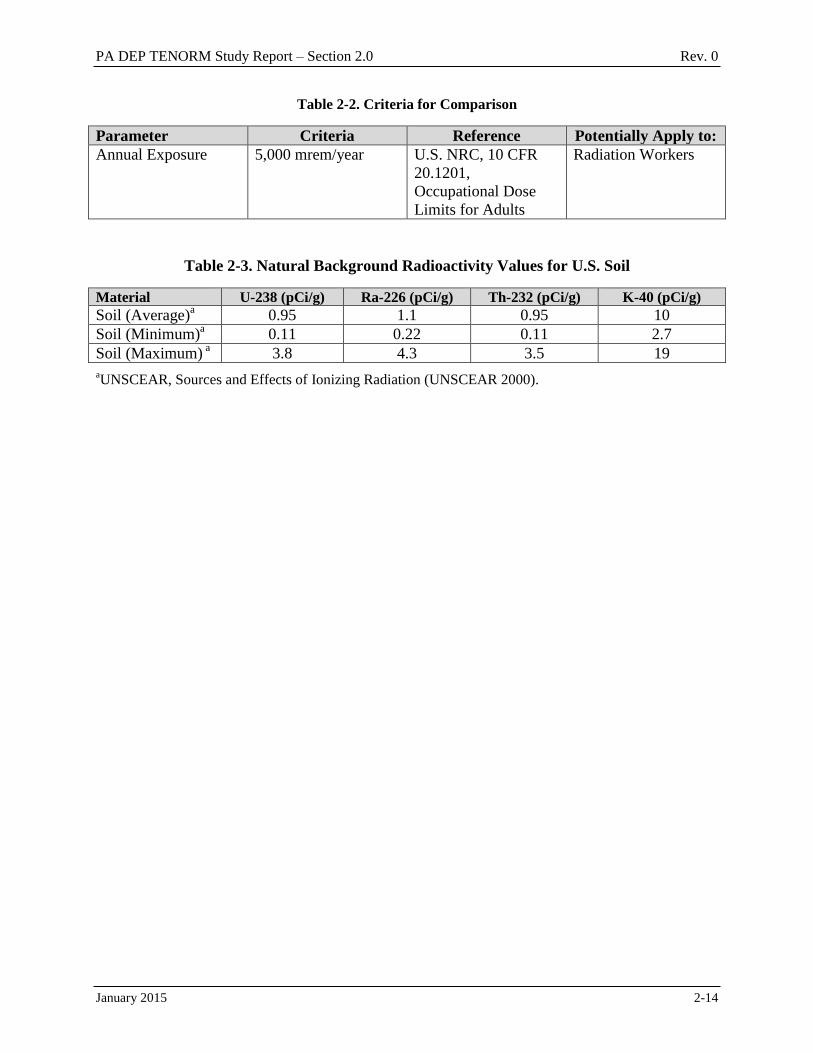
PA DEP TENORM Study Report – Section 2.0 Rev. 0
January 2015 2-14
Table 2-2. Criteria for Comparison
Parameter Criteria Reference Potentially Apply to:
Annual Exposure 5,000 mrem/year U.S. NRC, 10 CFR
20.1201,
Occupational Dose
Limits for Adults
Radiation Workers
Table 2-3. Natural Background Radioactivity Values for U.S. Soil
Material U-238 (pCi/g) Ra-226 (pCi/g) Th-232 (pCi/g) K-40 (pCi/g)
Soil (Average)a 0.95 1.1 0.95 10
Soil (Minimum)a 0.11 0.22 0.11 2.7
Soil (Maximum) a 3.8 4.3 3.5 19
aUNSCEAR, Sources and Effects of Ionizing Radiation (UNSCEAR 2000).

PA DEP TENORM Study Report – Section 3.0 Rev. 0
January 2015 3-1
3.0 WELL SITES
Thirty-eight well sites, including four conventional wells and 34 unconventional wells, were
sampled from June 2013 through July 2014. Data from five phases of well development and
completion were collected: vertical drilling, horizontal drilling, hydraulic fracturing, flowback,
and production. A listing of the well types, formations, phases, and geographic regions is
provided below.
4 Conventional Wells
Formations
1 in the Lower Devonian/Oriskany
3 in the Upper Devonian
Phase
Production Phase
34 Unconventional Wells
Formations
29 in the Lower Devonian/Marcellus
2 in the Lower Devonian/Marcellus Sandstone
1 in the Upper Devonian/Burket
2 in the Middle Ordovician/Utica
Phases
10 sampled during the vertical drilling phase
10 sampled during the horizontal drilling phase
10 sampled during the hydraulic fracturing phase
9 sampled during the flowback phase
19 sampled during the production phase
9 sampled for fluids and Rn
10 sampled for just Rn
Regions
1 in the Northeast Region
17 in the North-central Region
4 in the Northwest Region
16 in the Southwest Region
3.1 Radiological Survey Results
Radiological surveys were conducted at each well site resulting in four data sets:
Removable / surface radioactivity measurements recorded in units of dpm/100 cm2
Total /surface radioactivity measurements recorded in units of dpm/100 cm2
Gross Gamma Radiation Scan measurements recorded in units of cpm
Gamma Radiation Exposure Rate measurements recorded in units of µR/hr
3.1.1 Removable Alpha/Beta Surface Radioactivity Measurement Results
Measurements of removable /surface radioactivity were performed to assess potential internal
radiation worker exposure through ingestion and/or inhalation. The results were evaluated using
PA DEP TENORM Study Report – Section 3.0 Rev. 0
January 2015 3-2
the NRC Regulatory Guide 1.86 (RG 1.86) guidelines. RG 1.86 Table 1 requires that and
levels be evaluated separately. The primary emitter of concern is Ra-226 with a removable
criterion of 20 dpm /100 cm2. The primary emitter of concern is Ra-228 of the natural Th
decay series with a removable criterion of 200 dpm /100 cm2. The average removable and
levels at each well site were below the RG 1.86 criteria. The maximum removable and
levels were 15 dpm/100 cm2 and 76 dpm/100 cm
2, also below the RG 1.86 criteria. The
summary results of removable / radioactivity for each of the well sites surveyed are presented
in Table 3-1. Individual smear sample removable / results are presented in Appendix D.
3.1.2 Total Alpha/BetaSurface Radioactivity Measurement Results
Measurements of total /surface radioactivity were performed to assess potential worker
internal radiation exposure through ingestion and/or inhalation. The results were evaluated using
the RG 1.86 Table 1 guidelines. RG 1.86 requires that and activity be evaluated separately.
The primary emitter of concern is Ra-226 with a total criterion of 100 dpm /100 cm2. The
primary emitter of concern is Ra-228 of the natural Th decay series with a total criterion of
1,000 dpm /100 cm2. The maximum average total andlevels measured at any single well
site were 93.0 dpm/100 cm2 and 1,630 dpm/100 cm
2. The maximum total andlevels
measured were 754 dpm/100 cm2 and 2,503 dpm/100 cm
2. The summary results of total and
surface radioactivity for each of the well sites surveyed are presented in Table 3-2. Individual
total /measurement results are presented in Appendix D.
3.1.3 Gross Gamma Radiation Scan Results
Gross gamma radiation scans recorded in cpm were performed on well sites to identify areas of
radioactivity above local background levels. Summary results for each of the well sites surveyed
and each phase surveyed are presented in Table 3-3. The highest average gross gamma radiation
count rate was 14,519 cpm (approximately 18 µR/h), and the maximum gamma radiation scan
result measured was 30,823 cpm (approximately 39 µR/h). A graphic display of the gamma
radiation scan results (figures) at each facility was prepared using geographic information system
(GIS) software. Figures are presented in Appendix E.
3.1.4 Gamma Radiation Exposure Rate Results
Gross gamma radiation scan results in units of cpm presented in Table 3-3 were converted to
R/hr using the 800 cpm per R/hr conversion factor appropriate for Ra-226 gamma energy as
detected with 2-inch by 2-inch NaI detectors, rounded to one significant figure (Table 6.4, NaI
Scintillation Detector Scan MDCs for Common Radiological Contaminants, NUREG-1507,
Minimum Detectable Concentrations With Typical Radiation Survey Instruments for Various
Contaminants and Field Conditions, USNRC June 1998). The exposure rate results for each well
site are presented in Table 3-4. The highest average exposure rate measured at any single site
was 18.1 R/hr, and the maximum gamma exposure rate measured was 38.5 R/hr.
PA DEP TENORM Study Report – Section 3.0 Rev. 0
January 2015 3-3
3.2 Solid Sample Results
3.2.1 Vertical Phase Drill Cuttings
Vertical cuttings were sampled at 11 unconventional well sites and analyzed using gamma
spectroscopy to identify gamma-emitting members of the natural U, Th, and Ac decay series.
The gamma spectroscopy results are presented in Table 3-5. XRF analysis was also performed
on the vertical drill cuttings to identify non-gamma-emitting isotopes of U-238 and Th-232.
XRF ppm concentration data for Th was converted to pCi/g of Th-232 using the specific activity
of 0.110 pCi/g Th-232 per ppm of Th. XRF ppm concentration data for U was converted to
pCi/g of U-238 using the specific activity of 0.334 pCi/g U-238 per ppm of U. Both the ppm and
the pCi/g results for 10 well sites are presented in Table 3-6. All of the XRF analytical results
are presented in Appendix F.
There were two methods for managing drill cuttings at the well sites. The first method, called a
“half round,” accumulates cuttings in a large mixing container where the materials were
stabilized prior to shipment to the landfill. This method does not provide an opportunity to
collect samples at discrete depths; consequently, a composited sample was collected during
vertical drilling. This method was used at nine of the 10 well sites.
The second method loads the cuttings into roll-off containers from the shaker tables. This
method enables sampling of cuttings from discrete depths. Each container was labeled with the
start and end depth of the collected material. The formations sampled are presented in Table 3-6
for these vertical drill cuttings. This method was used at one well site.
The U series activities are variable because the vertical cuttings represent different geologic
formations lying above the target natural gas-containing shale. These vertical drill cuttings are
mostly siltstones and sandstones. Potassium-40 (K-40) concentrations provide an indication of
the type of formation. Shale has higher levels of K-40 than sandstone. Shale is typically in the
range of 25-30 pCi/g of K-40 while sandstone typically contains approximately 5 pCi/g of K-40.
The U-238 measured using XRF and the Ra-226 measured using gamma spectroscopy were
compared to confirm secular equilibrium of the U decay series within drill cuttings. Figure 3-1
provides a graphic representation of this comparison and shows agreement between the two U
series radionuclides, indicating secular equilibrium. Although the gamma spectroscopy results
for Ra-226 are consistently higher than the XRF results for U-238, both values trend together,
i.e., increase and decrease together. The high bias of the Ra-226 gamma spectroscopy results is
due in part from the U-235 interference when identifying Ra-226 using gamma spectroscopy of
the 186 keV gamma line. (Refer to Section 2.3.2 for a complete discussion of Ra-226 detection
using gamma spectroscopy.) U-235, which is also present in drill cuttings, also emits gamma at
186 keV, causing a consistent positive bias of Ra-226 results.
Th-232 and Ra-228 do not emit gamma rays identifiable by gamma spectroscopy; consequently,
the levels were inferred from the Ac-228 gamma rays. The Th-232 series radionuclide activity
levels all typify natural background for soil (reference Table 2-3).
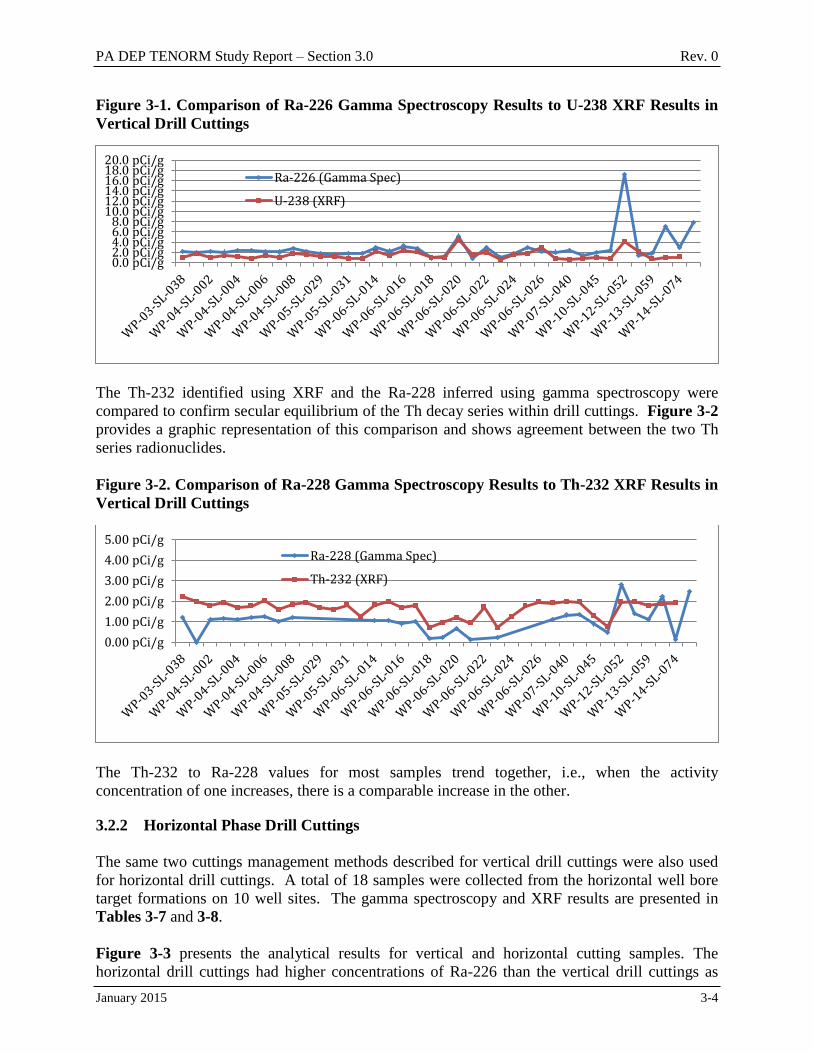
PA DEP TENORM Study Report – Section 3.0 Rev. 0
January 2015 3-4
Figure 3-1. Comparison of Ra-226 Gamma Spectroscopy Results to U-238 XRF Results in
Vertical Drill Cuttings
The Th-232 identified using XRF and the Ra-228 inferred using gamma spectroscopy were
compared to confirm secular equilibrium of the Th decay series within drill cuttings. Figure 3-2
provides a graphic representation of this comparison and shows agreement between the two Th
series radionuclides.
Figure 3-2. Comparison of Ra-228 Gamma Spectroscopy Results to Th-232 XRF Results in
Vertical Drill Cuttings
The Th-232 to Ra-228 values for most samples trend together, i.e., when the activity
concentration of one increases, there is a comparable increase in the other.
3.2.2 Horizontal Phase Drill Cuttings
The same two cuttings management methods described for vertical drill cuttings were also used
for horizontal drill cuttings. A total of 18 samples were collected from the horizontal well bore
target formations on 10 well sites. The gamma spectroscopy and XRF results are presented in
Tables 3-7 and 3-8.
Figure 3-3 presents the analytical results for vertical and horizontal cutting samples. The
horizontal drill cuttings had higher concentrations of Ra-226 than the vertical drill cuttings as
0.0 pCi/g2.0 pCi/g4.0 pCi/g6.0 pCi/g8.0 pCi/g
10.0 pCi/g12.0 pCi/g14.0 pCi/g16.0 pCi/g18.0 pCi/g20.0 pCi/g
Ra-226 (Gamma Spec)
U-238 (XRF)
0.00 pCi/g
1.00 pCi/g
2.00 pCi/g
3.00 pCi/g
4.00 pCi/g
5.00 pCi/gRa-228 (Gamma Spec)
Th-232 (XRF)
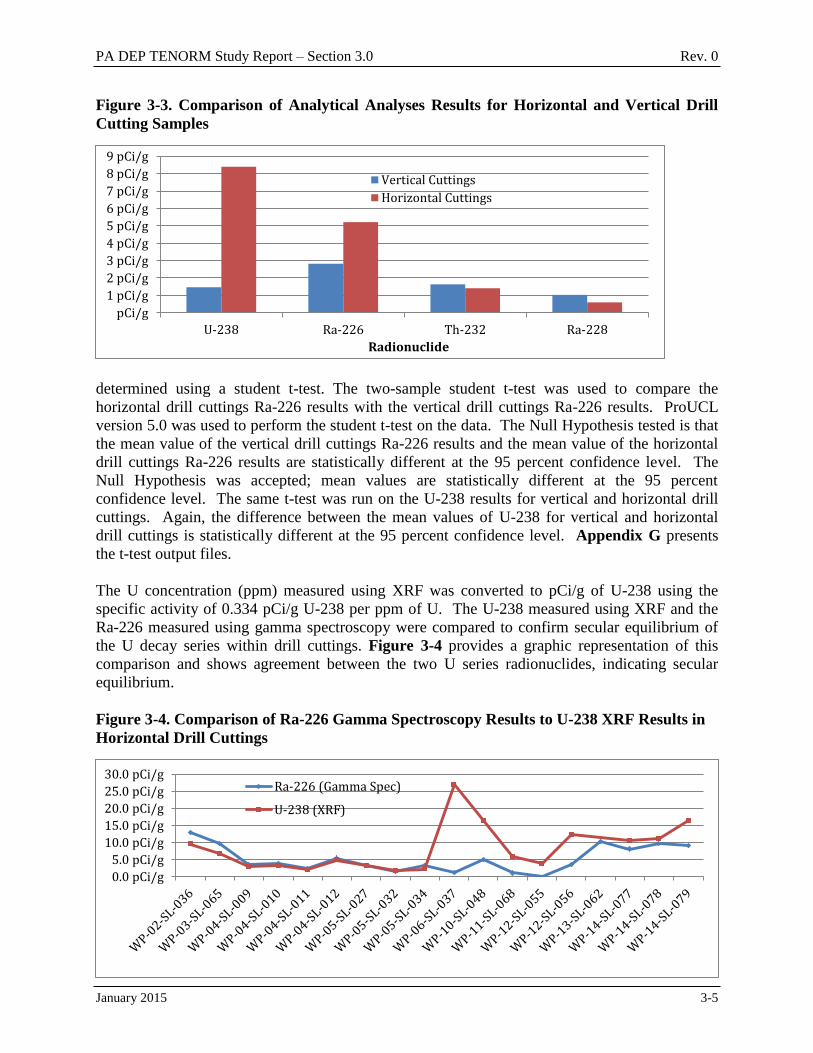
PA DEP TENORM Study Report – Section 3.0 Rev. 0
January 2015 3-5
Figure 3-3. Comparison of Analytical Analyses Results for Horizontal and Vertical Drill
Cutting Samples
determined using a student t-test. The two-sample student t-test was used to compare the
horizontal drill cuttings Ra-226 results with the vertical drill cuttings Ra-226 results. ProUCL
version 5.0 was used to perform the student t-test on the data. The Null Hypothesis tested is that
the mean value of the vertical drill cuttings Ra-226 results and the mean value of the horizontal
drill cuttings Ra-226 results are statistically different at the 95 percent confidence level. The
Null Hypothesis was accepted; mean values are statistically different at the 95 percent
confidence level. The same t-test was run on the U-238 results for vertical and horizontal drill
cuttings. Again, the difference between the mean values of U-238 for vertical and horizontal
drill cuttings is statistically different at the 95 percent confidence level. Appendix G presents
the t-test output files.
The U concentration (ppm) measured using XRF was converted to pCi/g of U-238 using the
specific activity of 0.334 pCi/g U-238 per ppm of U. The U-238 measured using XRF and the
Ra-226 measured using gamma spectroscopy were compared to confirm secular equilibrium of
the U decay series within drill cuttings. Figure 3-4 provides a graphic representation of this
comparison and shows agreement between the two U series radionuclides, indicating secular
equilibrium.
Figure 3-4. Comparison of Ra-226 Gamma Spectroscopy Results to U-238 XRF Results in
Horizontal Drill Cuttings
pCi/g
1 pCi/g
2 pCi/g
3 pCi/g
4 pCi/g
5 pCi/g
6 pCi/g
7 pCi/g
8 pCi/g
9 pCi/g
U-238 Ra-226 Th-232 Ra-228
Radionuclide
Vertical Cuttings
Horizontal Cuttings
0.0 pCi/g
5.0 pCi/g
10.0 pCi/g
15.0 pCi/g
20.0 pCi/g
25.0 pCi/g
30.0 pCi/gRa-226 (Gamma Spec)
U-238 (XRF)
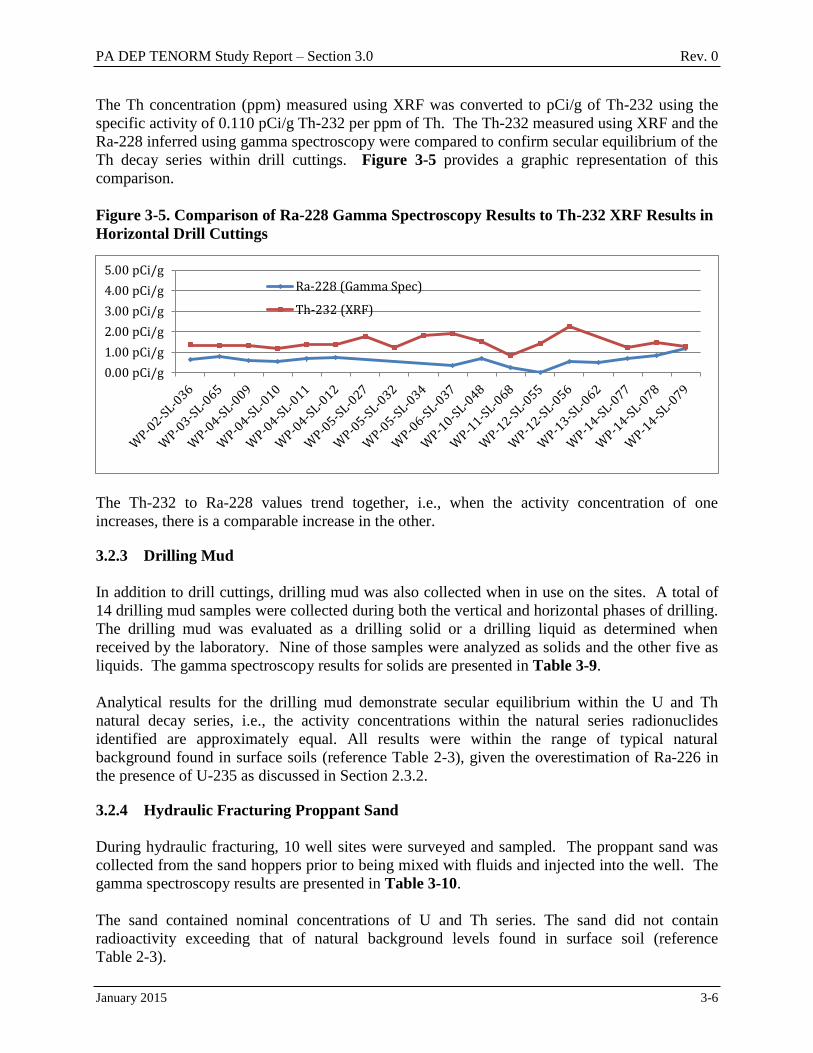
PA DEP TENORM Study Report – Section 3.0 Rev. 0
January 2015 3-6
The Th concentration (ppm) measured using XRF was converted to pCi/g of Th-232 using the
specific activity of 0.110 pCi/g Th-232 per ppm of Th. The Th-232 measured using XRF and the
Ra-228 inferred using gamma spectroscopy were compared to confirm secular equilibrium of the
Th decay series within drill cuttings. Figure 3-5 provides a graphic representation of this
comparison.
Figure 3-5. Comparison of Ra-228 Gamma Spectroscopy Results to Th-232 XRF Results in
Horizontal Drill Cuttings
The Th-232 to Ra-228 values trend together, i.e., when the activity concentration of one
increases, there is a comparable increase in the other.
3.2.3 Drilling Mud
In addition to drill cuttings, drilling mud was also collected when in use on the sites. A total of
14 drilling mud samples were collected during both the vertical and horizontal phases of drilling.
The drilling mud was evaluated as a drilling solid or a drilling liquid as determined when
received by the laboratory. Nine of those samples were analyzed as solids and the other five as
liquids. The gamma spectroscopy results for solids are presented in Table 3-9.
Analytical results for the drilling mud demonstrate secular equilibrium within the U and Th
natural decay series, i.e., the activity concentrations within the natural series radionuclides
identified are approximately equal. All results were within the range of typical natural
background found in surface soils (reference Table 2-3), given the overestimation of Ra-226 in
the presence of U-235 as discussed in Section 2.3.2.
3.2.4 Hydraulic Fracturing Proppant Sand
During hydraulic fracturing, 10 well sites were surveyed and sampled. The proppant sand was
collected from the sand hoppers prior to being mixed with fluids and injected into the well. The
gamma spectroscopy results are presented in Table 3-10.
The sand contained nominal concentrations of U and Th series. The sand did not contain
radioactivity exceeding that of natural background levels found in surface soil (reference
Table 2-3).
0.00 pCi/g
1.00 pCi/g
2.00 pCi/g
3.00 pCi/g
4.00 pCi/g
5.00 pCi/gRa-228 (Gamma Spec)
Th-232 (XRF)
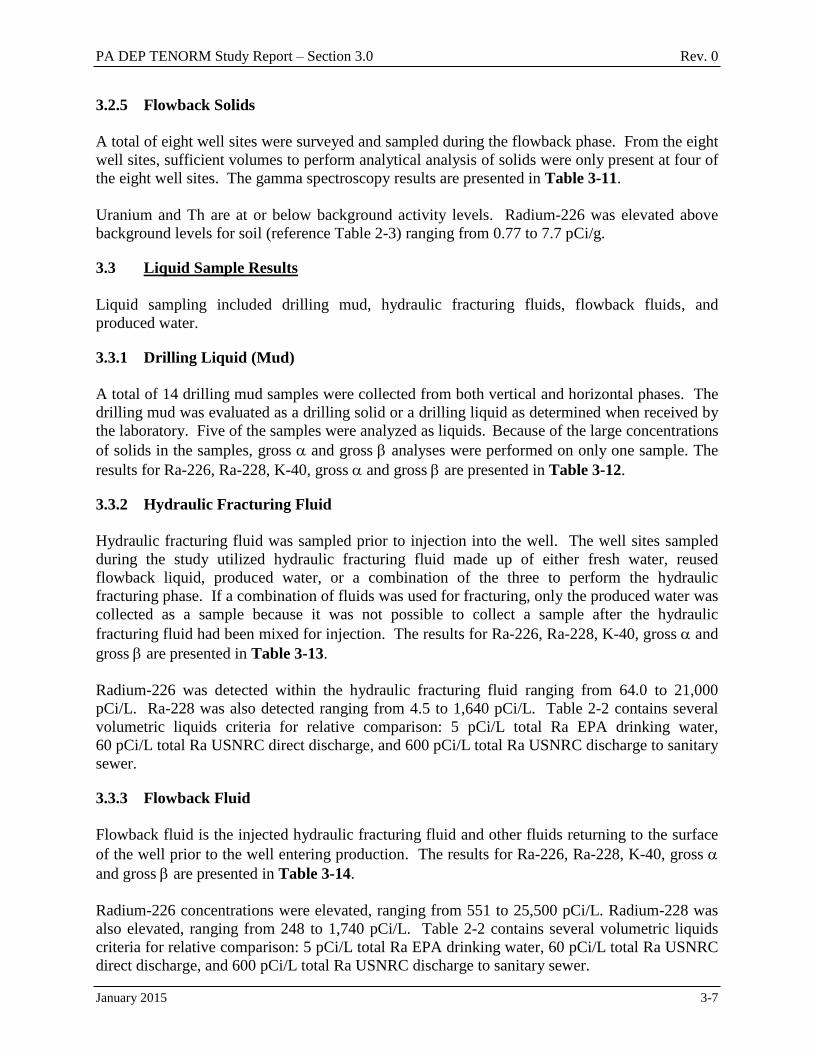
PA DEP TENORM Study Report – Section 3.0 Rev. 0
January 2015 3-7
3.2.5 Flowback Solids
A total of eight well sites were surveyed and sampled during the flowback phase. From the eight
well sites, sufficient volumes to perform analytical analysis of solids were only present at four of
the eight well sites. The gamma spectroscopy results are presented in Table 3-11.
Uranium and Th are at or below background activity levels. Radium-226 was elevated above
background levels for soil (reference Table 2-3) ranging from 0.77 to 7.7 pCi/g.
3.3 Liquid Sample Results
Liquid sampling included drilling mud, hydraulic fracturing fluids, flowback fluids, and
produced water.
3.3.1 Drilling Liquid (Mud)
A total of 14 drilling mud samples were collected from both vertical and horizontal phases. The
drilling mud was evaluated as a drilling solid or a drilling liquid as determined when received by
the laboratory. Five of the samples were analyzed as liquids. Because of the large concentrations
of solids in the samples, gross and gross analyses were performed on only one sample. The
results for Ra-226, Ra-228, K-40, gross and gross are presented in Table 3-12.
3.3.2 Hydraulic Fracturing Fluid
Hydraulic fracturing fluid was sampled prior to injection into the well. The well sites sampled
during the study utilized hydraulic fracturing fluid made up of either fresh water, reused
flowback liquid, produced water, or a combination of the three to perform the hydraulic
fracturing phase. If a combination of fluids was used for fracturing, only the produced water was
collected as a sample because it was not possible to collect a sample after the hydraulic
fracturing fluid had been mixed for injection. The results for Ra-226, Ra-228, K-40, gross and
gross are presented in Table 3-13.
Radium-226 was detected within the hydraulic fracturing fluid ranging from 64.0 to 21,000
pCi/L. Ra-228 was also detected ranging from 4.5 to 1,640 pCi/L. Table 2-2 contains several
volumetric liquids criteria for relative comparison: 5 pCi/L total Ra EPA drinking water,
60 pCi/L total Ra USNRC direct discharge, and 600 pCi/L total Ra USNRC discharge to sanitary
sewer.
3.3.3 Flowback Fluid
Flowback fluid is the injected hydraulic fracturing fluid and other fluids returning to the surface
of the well prior to the well entering production. The results for Ra-226, Ra-228, K-40, gross
and gross are presented in Table 3-14.
Radium-226 concentrations were elevated, ranging from 551 to 25,500 pCi/L. Radium-228 was
also elevated, ranging from 248 to 1,740 pCi/L. Table 2-2 contains several volumetric liquids
criteria for relative comparison: 5 pCi/L total Ra EPA drinking water, 60 pCi/L total Ra USNRC
direct discharge, and 600 pCi/L total Ra USNRC discharge to sanitary sewer.
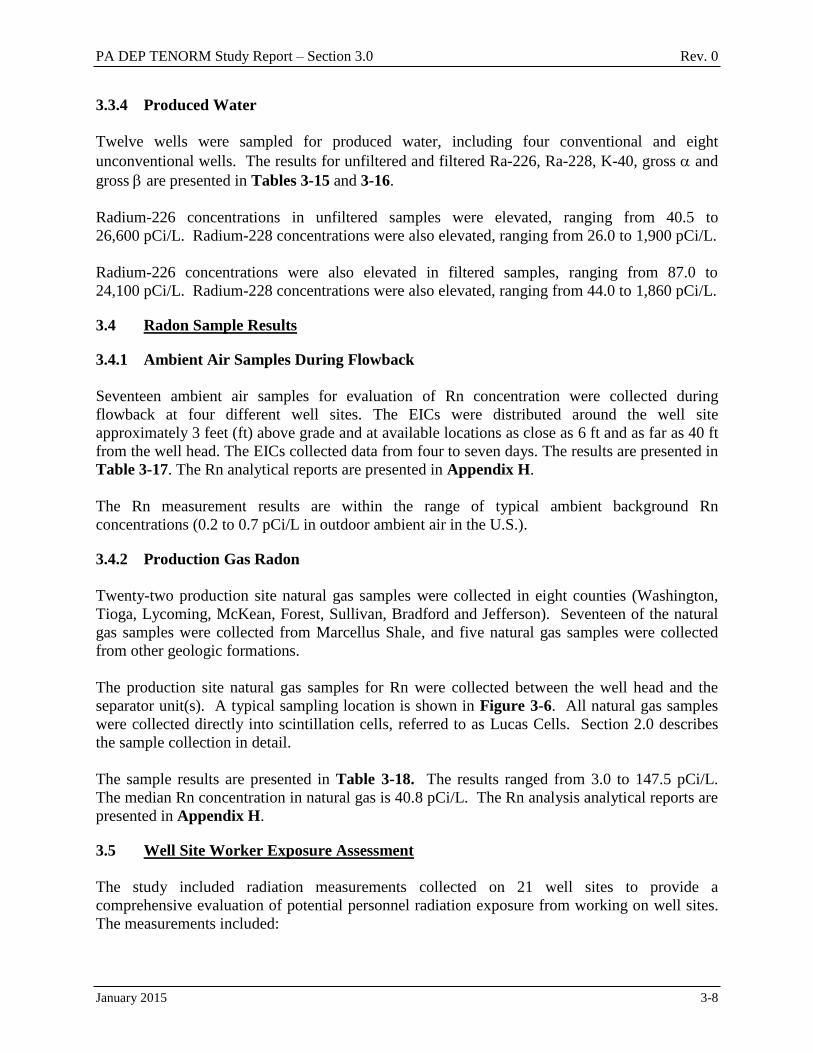
PA DEP TENORM Study Report – Section 3.0 Rev. 0
January 2015 3-8
3.3.4 Produced Water
Twelve wells were sampled for produced water, including four conventional and eight
unconventional wells. The results for unfiltered and filtered Ra-226, Ra-228, K-40, gross and
gross are presented in Tables 3-15 and 3-16.
Radium-226 concentrations in unfiltered samples were elevated, ranging from 40.5 to
26,600 pCi/L. Radium-228 concentrations were also elevated, ranging from 26.0 to 1,900 pCi/L.
Radium-226 concentrations were also elevated in filtered samples, ranging from 87.0 to
24,100 pCi/L. Radium-228 concentrations were also elevated, ranging from 44.0 to 1,860 pCi/L.
3.4 Radon Sample Results
3.4.1 Ambient Air Samples During Flowback
Seventeen ambient air samples for evaluation of Rn concentration were collected during
flowback at four different well sites. The EICs were distributed around the well site
approximately 3 feet (ft) above grade and at available locations as close as 6 ft and as far as 40 ft
from the well head. The EICs collected data from four to seven days. The results are presented in
Table 3-17. The Rn analytical reports are presented in Appendix H.
The Rn measurement results are within the range of typical ambient background Rn
concentrations (0.2 to 0.7 pCi/L in outdoor ambient air in the U.S.).
3.4.2 Production Gas Radon
Twenty-two production site natural gas samples were collected in eight counties (Washington,
Tioga, Lycoming, McKean, Forest, Sullivan, Bradford and Jefferson). Seventeen of the natural
gas samples were collected from Marcellus Shale, and five natural gas samples were collected
from other geologic formations.
The production site natural gas samples for Rn were collected between the well head and the
separator unit(s). A typical sampling location is shown in Figure 3-6. All natural gas samples
were collected directly into scintillation cells, referred to as Lucas Cells. Section 2.0 describes
the sample collection in detail.
The sample results are presented in Table 3-18. The results ranged from 3.0 to 147.5 pCi/L.
The median Rn concentration in natural gas is 40.8 pCi/L. The Rn analysis analytical reports are
presented in Appendix H.
3.5 Well Site Worker Exposure Assessment
The study included radiation measurements collected on 21 well sites to provide a
comprehensive evaluation of potential personnel radiation exposure from working on well sites.
The measurements included:
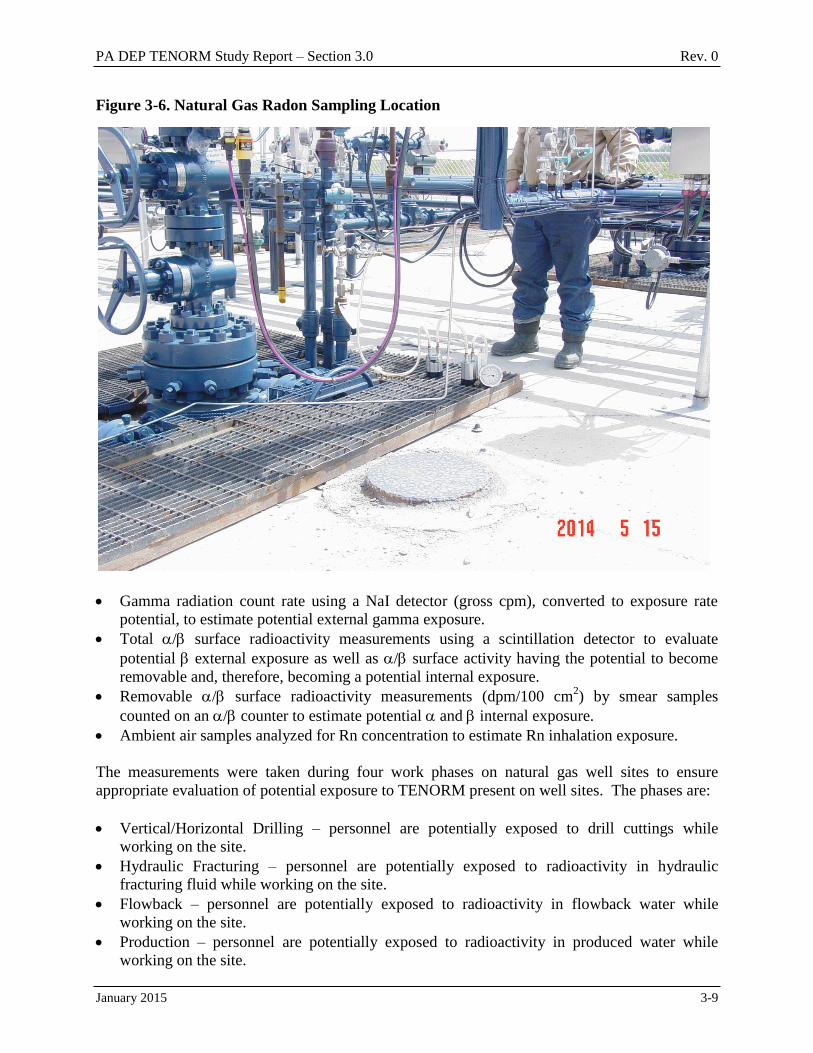
PA DEP TENORM Study Report – Section 3.0 Rev. 0
January 2015 3-9
Figure 3-6. Natural Gas Radon Sampling Location
Gamma radiation count rate using a NaI detector (gross cpm), converted to exposure rate
potential, to estimate potential external gamma exposure.
Total / surface radioactivity measurements using a scintillation detector to evaluate
potential external exposure as well as / surface activity having the potential to become
removable and, therefore, becoming a potential internal exposure.
Removable / surface radioactivity measurements (dpm/100 cm2) by smear samples
counted on an / counter to estimate potential and internal exposure.
Ambient air samples analyzed for Rn concentration to estimate Rn inhalation exposure.
The measurements were taken during four work phases on natural gas well sites to ensure
appropriate evaluation of potential exposure to TENORM present on well sites. The phases are:
Vertical/Horizontal Drilling – personnel are potentially exposed to drill cuttings while
working on the site.
Hydraulic Fracturing – personnel are potentially exposed to radioactivity in hydraulic
fracturing fluid while working on the site.
Flowback – personnel are potentially exposed to radioactivity in flowback water while
working on the site.
Production – personnel are potentially exposed to radioactivity in produced water while
working on the site.
PA DEP TENORM Study Report – Section 3.0 Rev. 0
January 2015 3-10
3.5.1 External Gamma Exposure
Gross gamma scan results in units of cpm presented in Table 3-3 were converted to R/hr using
the 800 cpm per R/hr conversion factor appropriate for Ra-226 gamma energy as detected with
2-inch by 2-inch NaI detectors [Table 6.3, NaI Scintillation Detector Count Rate Versus
Exposure Rate (cpm/R/hr), NUREG-1507, Minimum Detectable Concentrations With Typical
Radiation Survey Instruments for Various Contaminants and Field Conditions, USNRC June
1998]. The local background gamma exposure rate across all well sites surveyed was measured
at 5 µR/hr. The exposure rate results are presented in Table 3-4.
The lowest exposure rates measured and the maximum exposure time were during drilling. The
highest exposure rates measured were in the proximity of holding tanks for produced water. The
gamma dose rates during drilling ranged from background (measured at 5 µR/hr) to a maximum
of 38.5 µR/hr, and the highest average exposure rate at any of the well sites was 18.1 µR/hr.
Assuming the time period of exposure is a full occupational year of 2,000 hours, the average well
site external gamma exposure was estimated as follows:
Maximum Average Well Site External Gamma Exposure Estimate
(18.1 – 5) µR/hr x 2000 hr/yr x (1 mrem/1,000 µR gamma) = 26 mrem/yr
The result is less than the 100 mrem/yr dose equivalent limit for a member of the public. Actual
exposure is dependent upon the actual exposure rates and occupancy time for individual workers.
3.5.2 Internal Alpha/Beta Exposure
Results for / surface radioactivity measurements are provided in Sections 3.1.1 and 3.1.2. Ten
of the 491 measurements and 69 of the 491 measurements of total surface radioactivity
exceeded the RG 1.86 criteria. Only one of 493 removable surface activity measurements and
one of 493 surface radioactivity measurements exceeded RG 1.86 criteria, indicating the total
/ surface radioactivity measured is fixed to the surface and not readily available for inhalation
or ingestion.
3.5.3 Internal Radon Exposure
The Rn in ambient air measurement results during flowback are within the range of typical
ambient background Rn concentrations (0.2 to 0.7 pCi/L in outdoor ambient air in the U.S.).
3.6 Well Site Data Assessments
3.6.1 Comparison of Different Geological Formations Based on X-Ray Fluorescence Data
Eighteen drill cutting samples were collected and analyzed for Th and U using XRF. The
samples were collected from the Lower Devonian/Marcellus, Upper Devonian/Burket, and the
Middle Ordovician/Utica geologic formations. The data for the three geologic formations,
including the average, median, standard deviation, and ratios of Th to U are presented in
Table 3-19.
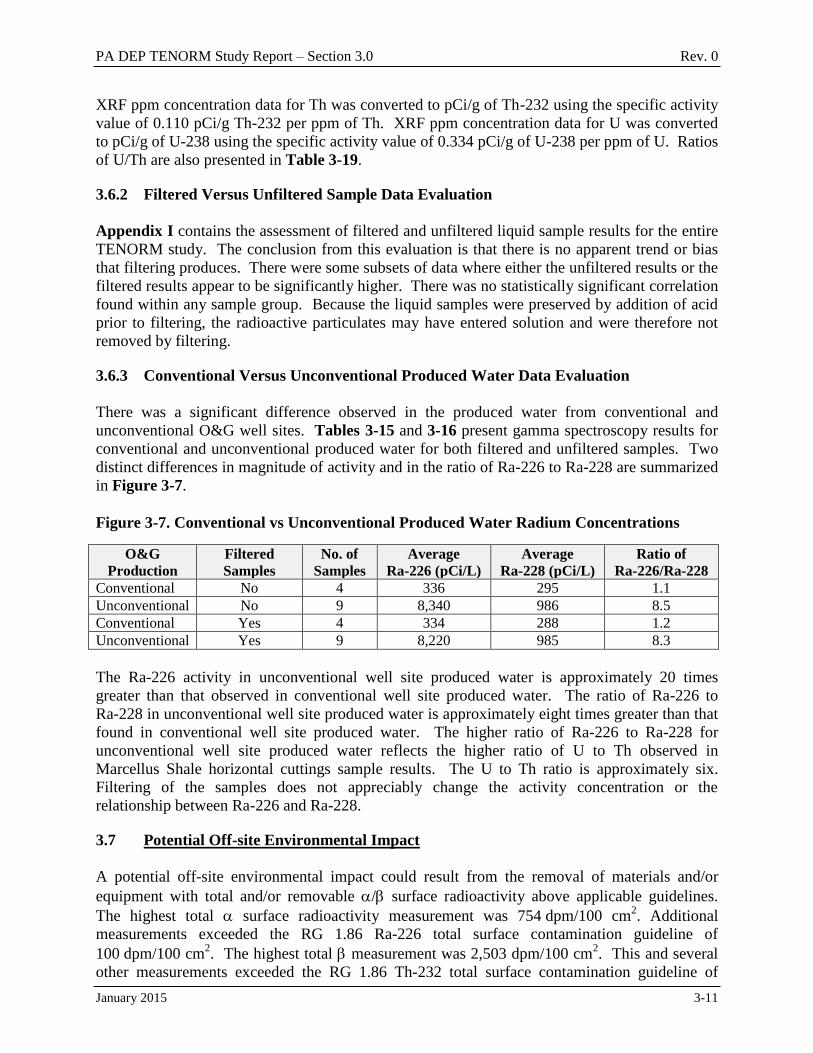
PA DEP TENORM Study Report – Section 3.0 Rev. 0
January 2015 3-11
XRF ppm concentration data for Th was converted to pCi/g of Th-232 using the specific activity
value of 0.110 pCi/g Th-232 per ppm of Th. XRF ppm concentration data for U was converted
to pCi/g of U-238 using the specific activity value of 0.334 pCi/g of U-238 per ppm of U. Ratios
of U/Th are also presented in Table 3-19.
3.6.2 Filtered Versus Unfiltered Sample Data Evaluation
Appendix I contains the assessment of filtered and unfiltered liquid sample results for the entire
TENORM study. The conclusion from this evaluation is that there is no apparent trend or bias
that filtering produces. There were some subsets of data where either the unfiltered results or the
filtered results appear to be significantly higher. There was no statistically significant correlation
found within any sample group. Because the liquid samples were preserved by addition of acid
prior to filtering, the radioactive particulates may have entered solution and were therefore not
removed by filtering.
3.6.3 Conventional Versus Unconventional Produced Water Data Evaluation
There was a significant difference observed in the produced water from conventional and
unconventional O&G well sites. Tables 3-15 and 3-16 present gamma spectroscopy results for
conventional and unconventional produced water for both filtered and unfiltered samples. Two
distinct differences in magnitude of activity and in the ratio of Ra-226 to Ra-228 are summarized
in Figure 3-7.
Figure 3-7. Conventional vs Unconventional Produced Water Radium Concentrations
O&G
Production Filtered
Samples No. of
Samples Average
Ra-226 (pCi/L) Average
Ra-228 (pCi/L) Ratio of
Ra-226/Ra-228 Conventional No 4 336 295 1.1 Unconventional No 9 8,340 986 8.5 Conventional Yes 4 334 288 1.2 Unconventional Yes 9 8,220 985 8.3
The Ra-226 activity in unconventional well site produced water is approximately 20 times
greater than that observed in conventional well site produced water. The ratio of Ra-226 to
Ra-228 in unconventional well site produced water is approximately eight times greater than that
found in conventional well site produced water. The higher ratio of Ra-226 to Ra-228 for
unconventional well site produced water reflects the higher ratio of U to Th observed in
Marcellus Shale horizontal cuttings sample results. The U to Th ratio is approximately six.
Filtering of the samples does not appreciably change the activity concentration or the
relationship between Ra-226 and Ra-228.
3.7 Potential Off-site Environmental Impact
A potential off-site environmental impact could result from the removal of materials and/or
equipment with total and/or removable / surface radioactivity above applicable guidelines.
The highest total surface radioactivity measurement was 754 dpm/100 cm2. Additional
measurements exceeded the RG 1.86 Ra-226 total surface contamination guideline of
100 dpm/100 cm2. The highest total measurement was 2,503 dpm/100 cm
2. This and several
other measurements exceeded the RG 1.86 Th-232 total surface contamination guideline of
PA DEP TENORM Study Report – Section 3.0 Rev. 0
January 2015 3-12
1,000 dpm/100 cm2. These readings were on equipment associated with wastewater
handling/storage, and this equipment is likely to be reused.
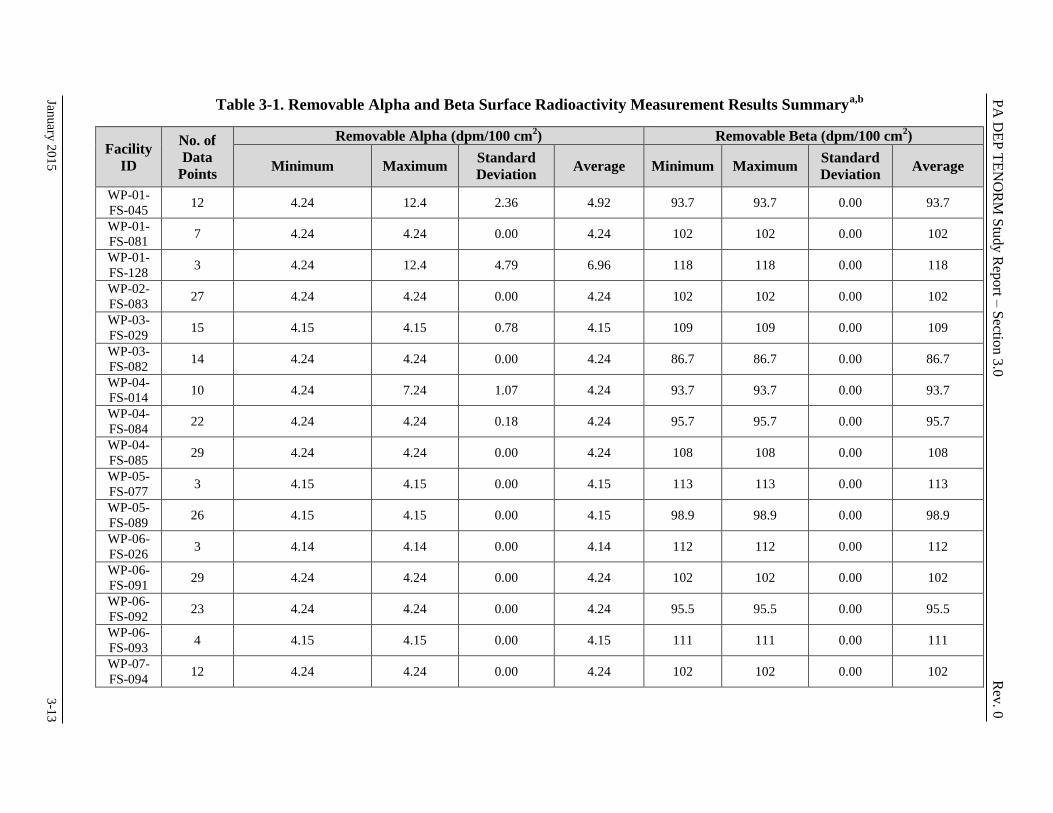
PA
DE
P T
EN
OR
M S
tudy R
eport –
Sectio
n 3
.0 R
ev. 0
January
20
15
3
-13
Table 3-1. Removable Alpha and Beta Surface Radioactivity Measurement Results Summarya,b
Facility
ID
No. of
Data
Points
Removable Alpha (dpm/100 cm2) Removable Beta (dpm/100 cm
2)
Minimum Maximum Standard
Deviation Average Minimum Maximum
Standard
Deviation Average
WP-01-
FS-045 12 4.24 12.4 2.36 4.92 93.7 93.7 0.00 93.7
WP-01-
FS-081 7 4.24 4.24 0.00 4.24 102 102 0.00 102
WP-01-
FS-128 3 4.24 12.4 4.79 6.96 118 118 0.00 118
WP-02-
FS-083 27 4.24 4.24 0.00 4.24 102 102 0.00 102
WP-03-
FS-029 15 4.15 4.15 0.78 4.15 109 109 0.00 109
WP-03-
FS-082 14 4.24 4.24 0.00 4.24 86.7 86.7 0.00 86.7
WP-04-
FS-014 10 4.24 7.24 1.07 4.24 93.7 93.7 0.00 93.7
WP-04-
FS-084 22 4.24 4.24 0.18 4.24 95.7 95.7 0.00 95.7
WP-04-
FS-085 29 4.24 4.24 0.00 4.24 108 108 0.00 108
WP-05-
FS-077 3 4.15 4.15 0.00 4.15 113 113 0.00 113
WP-05-
FS-089 26 4.15 4.15 0.00 4.15 98.9 98.9 0.00 98.9
WP-06-
FS-026 3 4.14 4.14 0.00 4.14 112 112 0.00 112
WP-06-
FS-091 29 4.24 4.24 0.00 4.24 102 102 0.00 102
WP-06-
FS-092 23 4.24 4.24 0.00 4.24 95.5 95.5 0.00 95.5
WP-06-
FS-093 4 4.15 4.15 0.00 4.15 111 111 0.00 111
WP-07-
FS-094 12 4.24 4.24 0.00 4.24 102 102 0.00 102
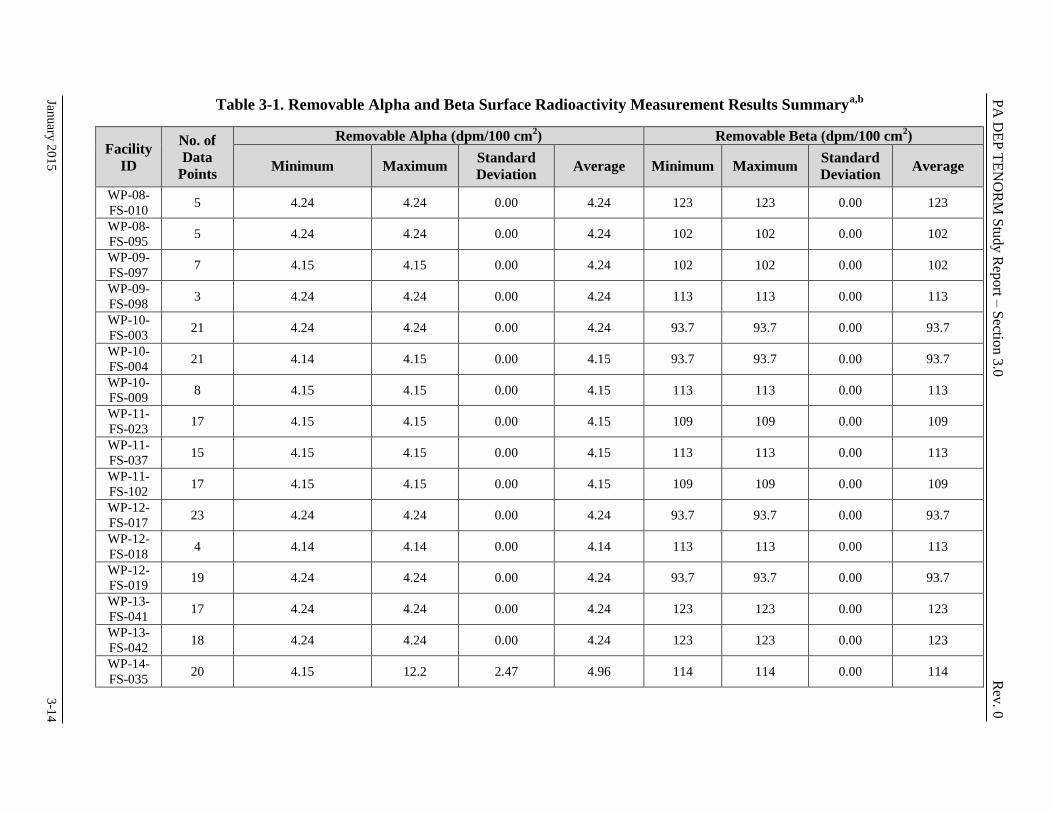
PA
DE
P T
EN
OR
M S
tudy R
eport –
Sectio
n 3
.0 R
ev. 0
January
20
15
3
-14
Table 3-1. Removable Alpha and Beta Surface Radioactivity Measurement Results Summarya,b
Facility
ID
No. of
Data
Points
Removable Alpha (dpm/100 cm2) Removable Beta (dpm/100 cm
2)
Minimum Maximum Standard
Deviation Average Minimum Maximum
Standard
Deviation Average
WP-08-
FS-010 5 4.24 4.24 0.00 4.24 123 123 0.00 123
WP-08-
FS-095 5 4.24 4.24 0.00 4.24 102 102 0.00 102
WP-09-
FS-097 7 4.15 4.15 0.00 4.24 102 102 0.00 102
WP-09-
FS-098 3 4.24 4.24 0.00 4.24 113 113 0.00 113
WP-10-
FS-003 21 4.24 4.24 0.00 4.24 93.7 93.7 0.00 93.7
WP-10-
FS-004 21 4.14 4.15 0.00 4.15 93.7 93.7 0.00 93.7
WP-10-
FS-009 8 4.15 4.15 0.00 4.15 113 113 0.00 113
WP-11-
FS-023 17 4.15 4.15 0.00 4.15 109 109 0.00 109
WP-11-
FS-037 15 4.15 4.15 0.00 4.15 113 113 0.00 113
WP-11-
FS-102 17 4.15 4.15 0.00 4.15 109 109 0.00 109
WP-12-
FS-017 23 4.24 4.24 0.00 4.24 93.7 93.7 0.00 93.7
WP-12-
FS-018 4 4.14 4.14 0.00 4.14 113 113 0.00 113
WP-12-
FS-019 19 4.24 4.24 0.00 4.24 93.7 93.7 0.00 93.7
WP-13-
FS-041 17 4.24 4.24 0.00 4.24 123 123 0.00 123
WP-13-
FS-042 18 4.24 4.24 0.00 4.24 123 123 0.00 123
WP-14-
FS-035 20 4.15 12.2 2.47 4.96 114 114 0.00 114
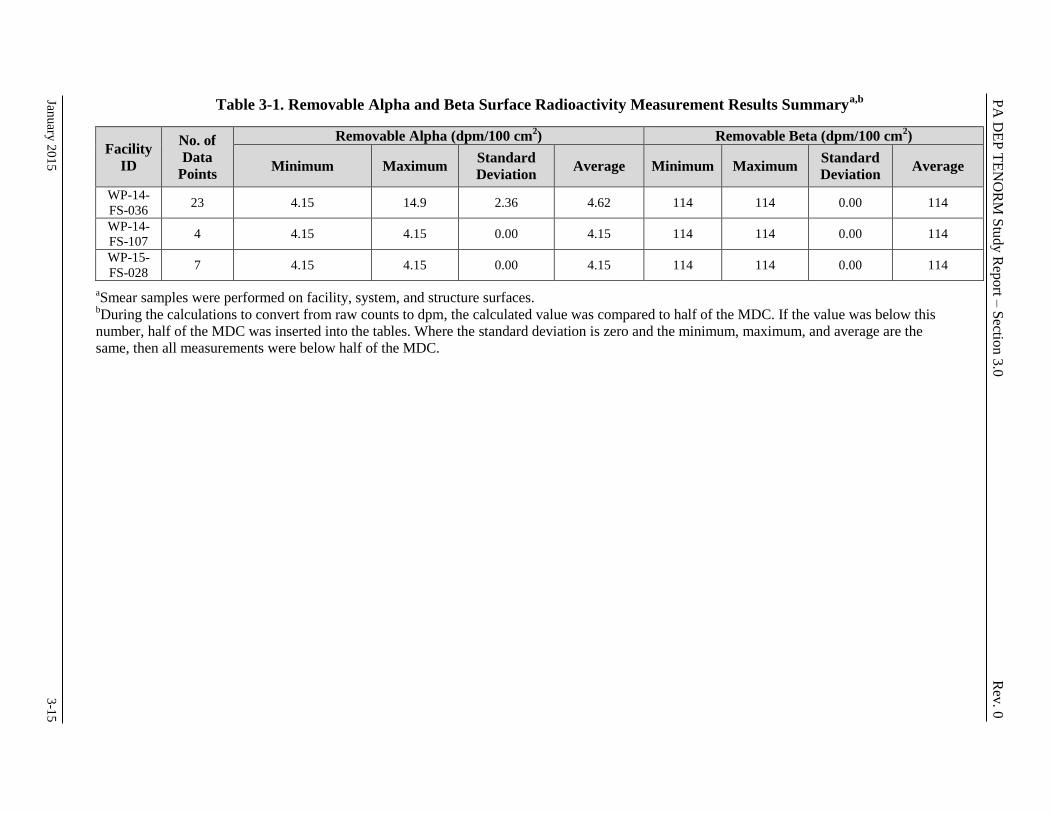
PA
DE
P T
EN
OR
M S
tudy R
eport –
Sectio
n 3
.0 R
ev. 0
January
20
15
3
-15
Table 3-1. Removable Alpha and Beta Surface Radioactivity Measurement Results Summarya,b
Facility
ID
No. of
Data
Points
Removable Alpha (dpm/100 cm2) Removable Beta (dpm/100 cm
2)
Minimum Maximum Standard
Deviation Average Minimum Maximum
Standard
Deviation Average
WP-14-
FS-036 23 4.15 14.9 2.36 4.62 114 114 0.00 114
WP-14-
FS-107 4 4.15 4.15 0.00 4.15 114 114 0.00 114
WP-15-
FS-028 7 4.15 4.15 0.00 4.15 114 114 0.00 114
aSmear samples were performed on facility, system, and structure surfaces.
bDuring the calculations to convert from raw counts to dpm, the calculated value was compared to half of the MDC. If the value was below this
number, half of the MDC was inserted into the tables. Where the standard deviation is zero and the minimum, maximum, and average are the
same, then all measurements were below half of the MDC.
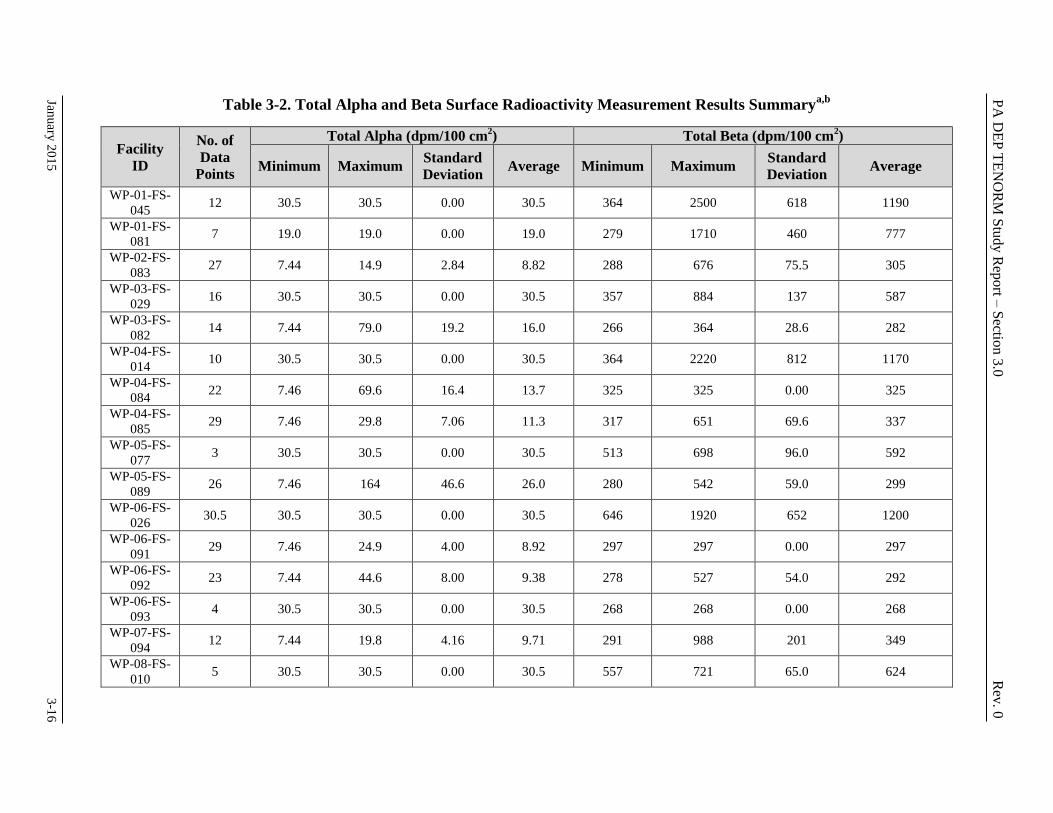
PA
DE
P T
EN
OR
M S
tudy R
eport –
Sectio
n 3
.0 R
ev. 0
January
20
15
3
-16
Table 3-2. Total Alpha and Beta Surface Radioactivity Measurement Results Summarya,b
Facility
ID
No. of
Data
Points
Total Alpha (dpm/100 cm2) Total Beta (dpm/100 cm
2)
Minimum Maximum Standard
Deviation Average Minimum Maximum
Standard
Deviation Average
WP-01-FS-
045 12 30.5 30.5 0.00 30.5 364 2500 618 1190
WP-01-FS-
081 7 19.0 19.0 0.00 19.0 279 1710 460 777
WP-02-FS-
083 27 7.44 14.9 2.84 8.82 288 676 75.5 305
WP-03-FS-
029 16 30.5 30.5 0.00 30.5 357 884 137 587
WP-03-FS-
082 14 7.44 79.0 19.2 16.0 266 364 28.6 282
WP-04-FS-
014 10 30.5 30.5 0.00 30.5 364 2220 812 1170
WP-04-FS-
084 22 7.46 69.6 16.4 13.7 325 325 0.00 325
WP-04-FS-
085 29 7.46 29.8 7.06 11.3 317 651 69.6 337
WP-05-FS-
077 3 30.5 30.5 0.00 30.5 513 698 96.0 592
WP-05-FS-
089 26 7.46 164 46.6 26.0 280 542 59.0 299
WP-06-FS-
026 30.5 30.5 30.5 0.00 30.5 646 1920 652 1200
WP-06-FS-
091 29 7.46 24.9 4.00 8.92 297 297 0.00 297
WP-06-FS-
092 23 7.44 44.6 8.00 9.38 278 527 54.0 292
WP-06-FS-
093 4 30.5 30.5 0.00 30.5 268 268 0.00 268
WP-07-FS-
094 12 7.44 19.8 4.16 9.71 291 988 201 349
WP-08-FS-
010 5 30.5 30.5 0.00 30.5 557 721 65.0 624
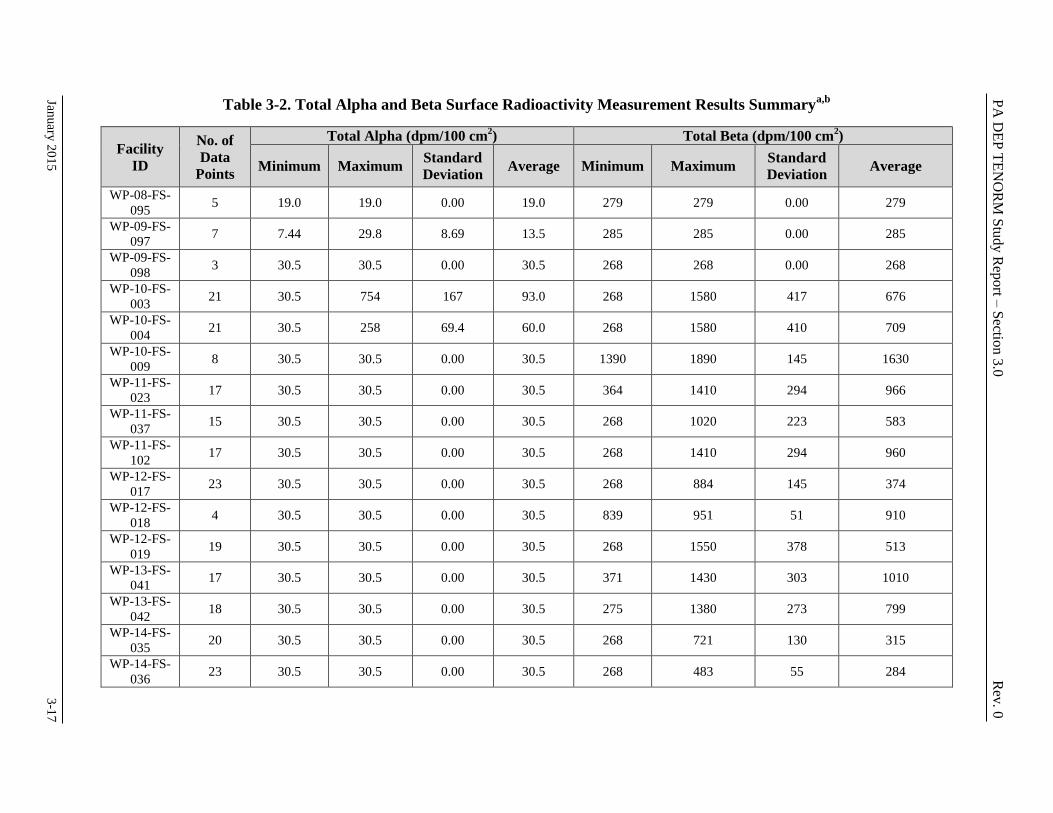
PA
DE
P T
EN
OR
M S
tudy R
eport –
Sectio
n 3
.0 R
ev. 0
January
20
15
3
-17
Table 3-2. Total Alpha and Beta Surface Radioactivity Measurement Results Summarya,b
Facility
ID
No. of
Data
Points
Total Alpha (dpm/100 cm2) Total Beta (dpm/100 cm
2)
Minimum Maximum Standard
Deviation Average Minimum Maximum
Standard
Deviation Average
WP-08-FS-
095 5 19.0 19.0 0.00 19.0 279 279 0.00 279
WP-09-FS-
097 7 7.44 29.8 8.69 13.5 285 285 0.00 285
WP-09-FS-
098 3 30.5 30.5 0.00 30.5 268 268 0.00 268
WP-10-FS-
003 21 30.5 754 167 93.0 268 1580 417 676
WP-10-FS-
004 21 30.5 258 69.4 60.0 268 1580 410 709
WP-10-FS-
009 8 30.5 30.5 0.00 30.5 1390 1890 145 1630
WP-11-FS-
023 17 30.5 30.5 0.00 30.5 364 1410 294 966
WP-11-FS-
037 15 30.5 30.5 0.00 30.5 268 1020 223 583
WP-11-FS-
102 17 30.5 30.5 0.00 30.5 268 1410 294 960
WP-12-FS-
017 23 30.5 30.5 0.00 30.5 268 884 145 374
WP-12-FS-
018 4 30.5 30.5 0.00 30.5 839 951 51 910
WP-12-FS-
019 19 30.5 30.5 0.00 30.5 268 1550 378 513
WP-13-FS-
041 17 30.5 30.5 0.00 30.5 371 1430 303 1010
WP-13-FS-
042 18 30.5 30.5 0.00 30.5 275 1380 273 799
WP-14-FS-
035 20 30.5 30.5 0.00 30.5 268 721 130 315
WP-14-FS-
036 23 30.5 30.5 0.00 30.5 268 483 55 284
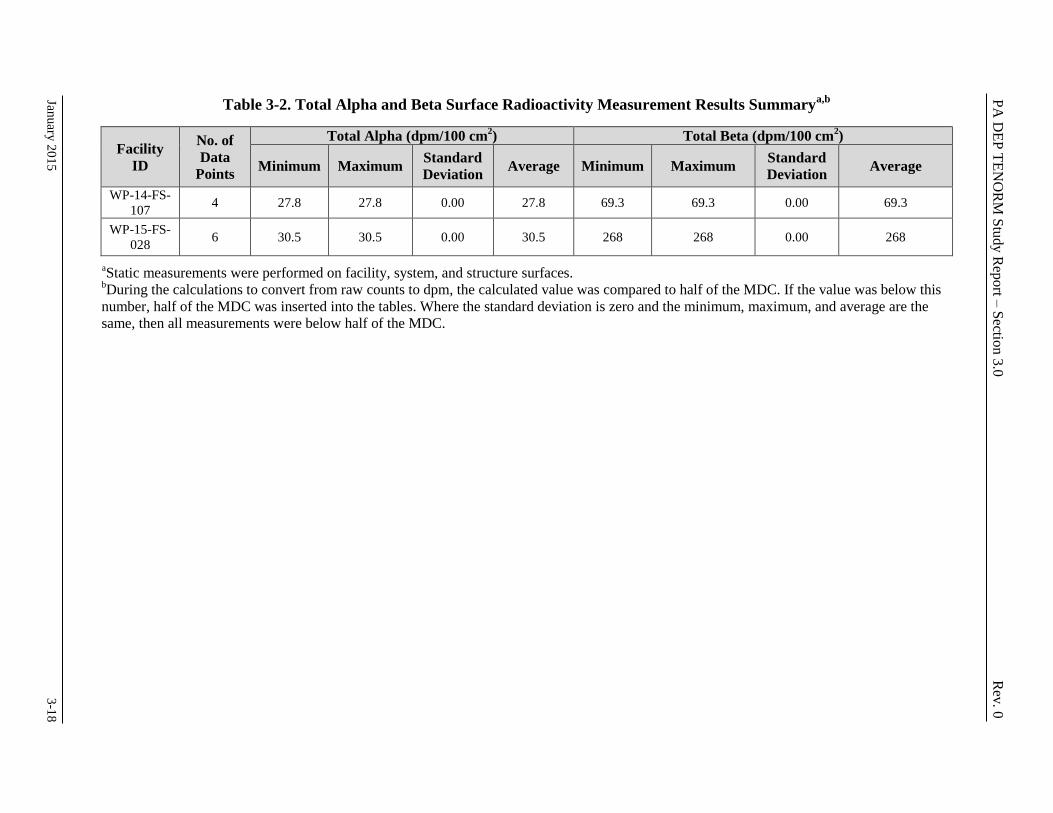
PA
DE
P T
EN
OR
M S
tudy R
eport –
Sectio
n 3
.0 R
ev. 0
January
20
15
3
-18
Table 3-2. Total Alpha and Beta Surface Radioactivity Measurement Results Summarya,b
Facility
ID
No. of
Data
Points
Total Alpha (dpm/100 cm2) Total Beta (dpm/100 cm
2)
Minimum Maximum Standard
Deviation Average Minimum Maximum
Standard
Deviation Average
WP-14-FS-
107 4 27.8 27.8 0.00 27.8 69.3 69.3 0.00 69.3
WP-15-FS-
028 6 30.5 30.5 0.00 30.5 268 268 0.00 268
aStatic measurements were performed on facility, system, and structure surfaces.
bDuring the calculations to convert from raw counts to dpm, the calculated value was compared to half of the MDC. If the value was below this
number, half of the MDC was inserted into the tables. Where the standard deviation is zero and the minimum, maximum, and average are the
same, then all measurements were below half of the MDC.
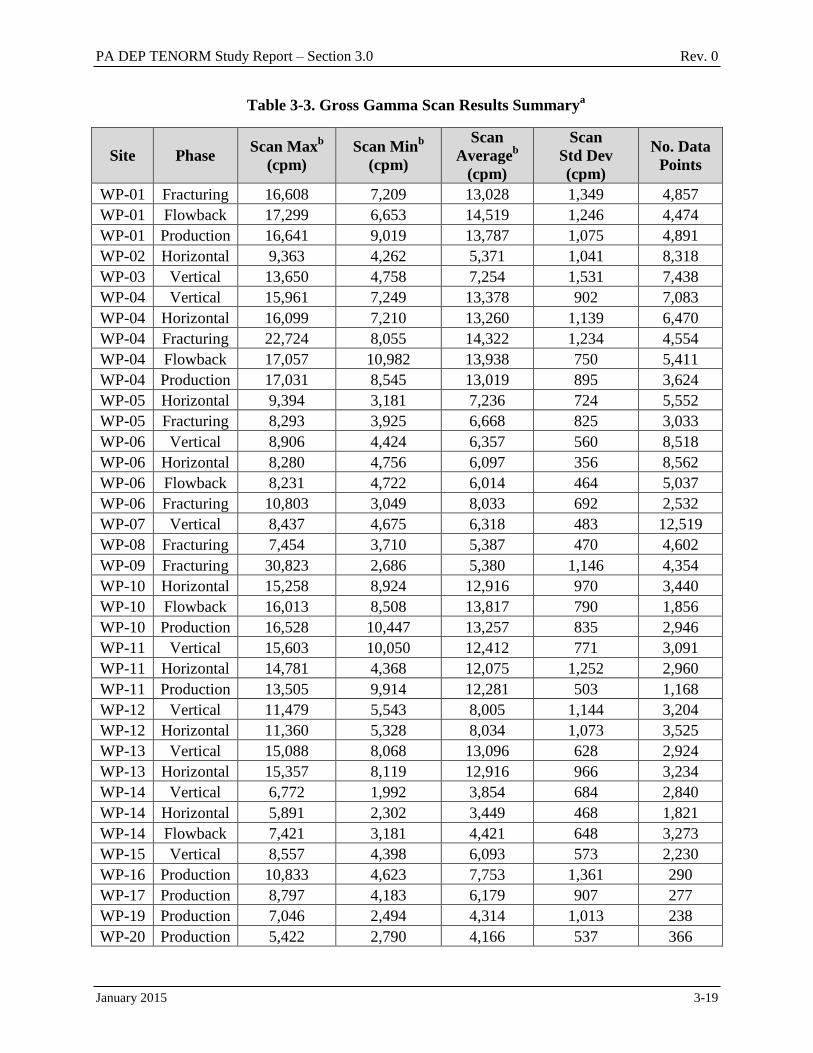
PA DEP TENORM Study Report – Section 3.0 Rev. 0
January 2015 3-19
Table 3-3. Gross Gamma Scan Results Summarya
Site Phase Scan Max
b
(cpm)
Scan Minb
(cpm)
Scan
Averageb
(cpm)
Scan
Std Dev
(cpm)
No. Data
Points
WP-01 Fracturing 16,608 7,209 13,028 1,349 4,857
WP-01 Flowback 17,299 6,653 14,519 1,246 4,474
WP-01 Production 16,641 9,019 13,787 1,075 4,891
WP-02 Horizontal 9,363 4,262 5,371 1,041 8,318
WP-03 Vertical 13,650 4,758 7,254 1,531 7,438
WP-04 Vertical 15,961 7,249 13,378 902 7,083
WP-04 Horizontal 16,099 7,210 13,260 1,139 6,470
WP-04 Fracturing 22,724 8,055 14,322 1,234 4,554
WP-04 Flowback 17,057 10,982 13,938 750 5,411
WP-04 Production 17,031 8,545 13,019 895 3,624
WP-05 Horizontal 9,394 3,181 7,236 724 5,552
WP-05 Fracturing 8,293 3,925 6,668 825 3,033
WP-06 Vertical 8,906 4,424 6,357 560 8,518
WP-06 Horizontal 8,280 4,756 6,097 356 8,562
WP-06 Flowback 8,231 4,722 6,014 464 5,037
WP-06 Fracturing 10,803 3,049 8,033 692 2,532
WP-07 Vertical 8,437 4,675 6,318 483 12,519
WP-08 Fracturing 7,454 3,710 5,387 470 4,602
WP-09 Fracturing 30,823 2,686 5,380 1,146 4,354
WP-10 Horizontal 15,258 8,924 12,916 970 3,440
WP-10 Flowback 16,013 8,508 13,817 790 1,856
WP-10 Production 16,528 10,447 13,257 835 2,946
WP-11 Vertical 15,603 10,050 12,412 771 3,091
WP-11 Horizontal 14,781 4,368 12,075 1,252 2,960
WP-11 Production 13,505 9,914 12,281 503 1,168
WP-12 Vertical 11,479 5,543 8,005 1,144 3,204
WP-12 Horizontal 11,360 5,328 8,034 1,073 3,525
WP-13 Vertical 15,088 8,068 13,096 628 2,924
WP-13 Horizontal 15,357 8,119 12,916 966 3,234
WP-14 Vertical 6,772 1,992 3,854 684 2,840
WP-14 Horizontal 5,891 2,302 3,449 468 1,821
WP-14 Flowback 7,421 3,181 4,421 648 3,273
WP-15 Vertical 8,557 4,398 6,093 573 2,230
WP-16 Production 10,833 4,623 7,753 1,361 290
WP-17 Production 8,797 4,183 6,179 907 277
WP-19 Production 7,046 2,494 4,314 1,013 238
WP-20 Production 5,422 2,790 4,166 537 366
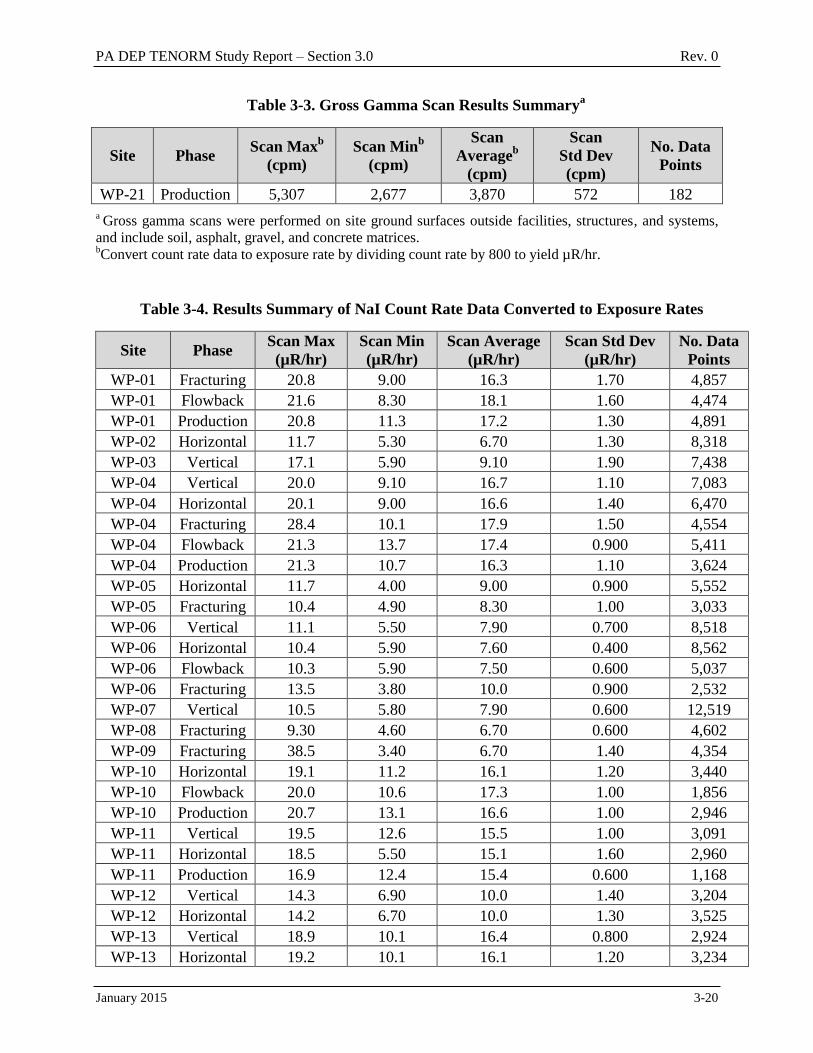
PA DEP TENORM Study Report – Section 3.0 Rev. 0
January 2015 3-20
Table 3-3. Gross Gamma Scan Results Summarya
Site Phase Scan Max
b
(cpm)
Scan Minb
(cpm)
Scan
Averageb
(cpm)
Scan
Std Dev
(cpm)
No. Data
Points
WP-21 Production 5,307 2,677 3,870 572 182
a Gross gamma scans were performed on site ground surfaces outside facilities, structures, and systems,
and include soil, asphalt, gravel, and concrete matrices. bConvert count rate data to exposure rate by dividing count rate by 800 to yield µR/hr.
Table 3-4. Results Summary of NaI Count Rate Data Converted to Exposure Rates
Site Phase Scan Max
(µR/hr)
Scan Min
(µR/hr)
Scan Average
(µR/hr)
Scan Std Dev
(µR/hr)
No. Data
Points
WP-01 Fracturing 20.8 9.00 16.3 1.70 4,857
WP-01 Flowback 21.6 8.30 18.1 1.60 4,474
WP-01 Production 20.8 11.3 17.2 1.30 4,891
WP-02 Horizontal 11.7 5.30 6.70 1.30 8,318
WP-03 Vertical 17.1 5.90 9.10 1.90 7,438
WP-04 Vertical 20.0 9.10 16.7 1.10 7,083
WP-04 Horizontal 20.1 9.00 16.6 1.40 6,470
WP-04 Fracturing 28.4 10.1 17.9 1.50 4,554
WP-04 Flowback 21.3 13.7 17.4 0.900 5,411
WP-04 Production 21.3 10.7 16.3 1.10 3,624
WP-05 Horizontal 11.7 4.00 9.00 0.900 5,552
WP-05 Fracturing 10.4 4.90 8.30 1.00 3,033
WP-06 Vertical 11.1 5.50 7.90 0.700 8,518
WP-06 Horizontal 10.4 5.90 7.60 0.400 8,562
WP-06 Flowback 10.3 5.90 7.50 0.600 5,037
WP-06 Fracturing 13.5 3.80 10.0 0.900 2,532
WP-07 Vertical 10.5 5.80 7.90 0.600 12,519
WP-08 Fracturing 9.30 4.60 6.70 0.600 4,602
WP-09 Fracturing 38.5 3.40 6.70 1.40 4,354
WP-10 Horizontal 19.1 11.2 16.1 1.20 3,440
WP-10 Flowback 20.0 10.6 17.3 1.00 1,856
WP-10 Production 20.7 13.1 16.6 1.00 2,946
WP-11 Vertical 19.5 12.6 15.5 1.00 3,091
WP-11 Horizontal 18.5 5.50 15.1 1.60 2,960
WP-11 Production 16.9 12.4 15.4 0.600 1,168
WP-12 Vertical 14.3 6.90 10.0 1.40 3,204
WP-12 Horizontal 14.2 6.70 10.0 1.30 3,525
WP-13 Vertical 18.9 10.1 16.4 0.800 2,924
WP-13 Horizontal 19.2 10.1 16.1 1.20 3,234
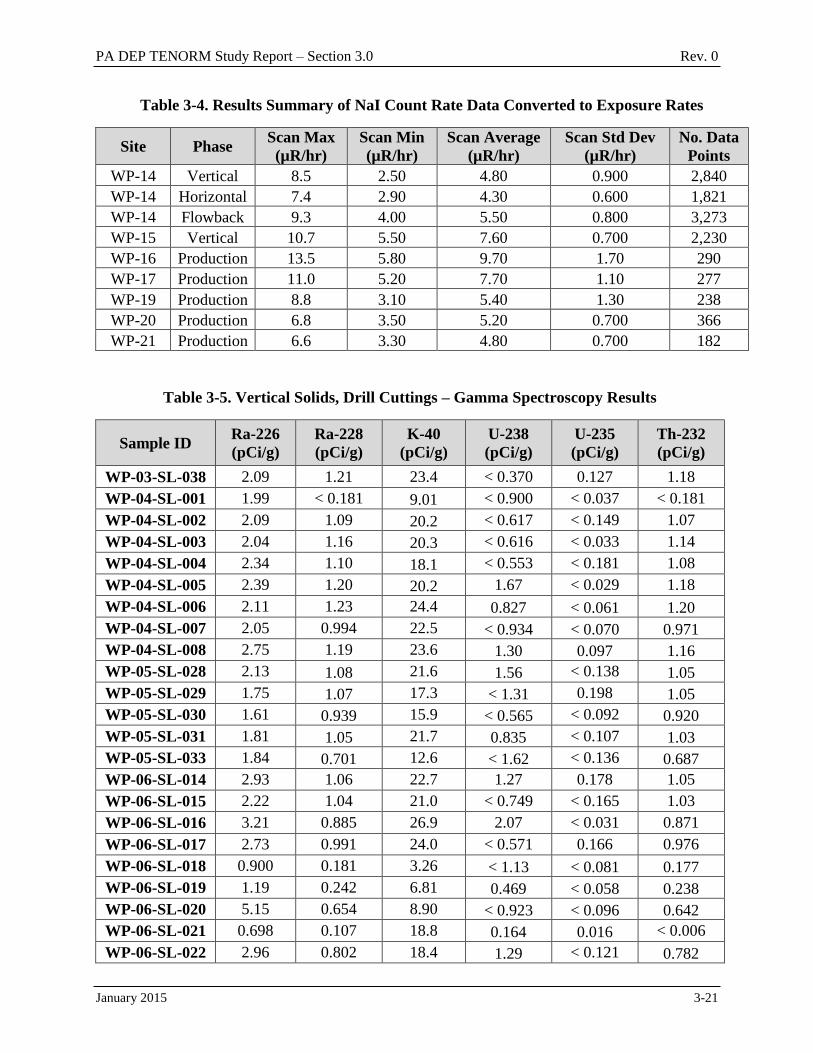
PA DEP TENORM Study Report – Section 3.0 Rev. 0
January 2015 3-21
Table 3-4. Results Summary of NaI Count Rate Data Converted to Exposure Rates
Site Phase Scan Max
(µR/hr)
Scan Min
(µR/hr)
Scan Average
(µR/hr)
Scan Std Dev
(µR/hr)
No. Data
Points
WP-14 Vertical 8.5 2.50 4.80 0.900 2,840
WP-14 Horizontal 7.4 2.90 4.30 0.600 1,821
WP-14 Flowback 9.3 4.00 5.50 0.800 3,273
WP-15 Vertical 10.7 5.50 7.60 0.700 2,230
WP-16 Production 13.5 5.80 9.70 1.70 290
WP-17 Production 11.0 5.20 7.70 1.10 277
WP-19 Production 8.8 3.10 5.40 1.30 238
WP-20 Production 6.8 3.50 5.20 0.700 366
WP-21 Production 6.6 3.30 4.80 0.700 182
Table 3-5. Vertical Solids, Drill Cuttings – Gamma Spectroscopy Results
Sample ID Ra-226
(pCi/g)
Ra-228
(pCi/g)
K-40
(pCi/g)
U-238
(pCi/g)
U-235
(pCi/g)
Th-232
(pCi/g)
WP-03-SL-038 2.09 1.21 23.4 < 0.370 0.127 1.18
WP-04-SL-001 1.99 < 0.181 9.01 < 0.900 < 0.037 < 0.181
WP-04-SL-002 2.09 1.09 20.2 < 0.617 < 0.149 1.07
WP-04-SL-003 2.04 1.16 20.3 < 0.616 < 0.033 1.14
WP-04-SL-004 2.34 1.10 18.1 < 0.553 < 0.181 1.08
WP-04-SL-005 2.39 1.20 20.2 1.67 < 0.029 1.18
WP-04-SL-006 2.11 1.23 24.4 0.827 < 0.061 1.20
WP-04-SL-007 2.05 0.994 22.5 < 0.934 < 0.070 0.971
WP-04-SL-008 2.75 1.19 23.6 1.30 0.097 1.16
WP-05-SL-028 2.13 1.08 21.6 1.56 < 0.138 1.05
WP-05-SL-029 1.75 1.07 17.3 < 1.31 0.198 1.05
WP-05-SL-030 1.61 0.939 15.9 < 0.565 < 0.092 0.920
WP-05-SL-031 1.81 1.05 21.7 0.835 < 0.107 1.03
WP-05-SL-033 1.84 0.701 12.6 < 1.62 < 0.136 0.687
WP-06-SL-014 2.93 1.06 22.7 1.27 0.178 1.05
WP-06-SL-015 2.22 1.04 21.0 < 0.749 < 0.165 1.03
WP-06-SL-016 3.21 0.885 26.9 2.07 < 0.031 0.871
WP-06-SL-017 2.73 0.991 24.0 < 0.571 0.166 0.976
WP-06-SL-018 0.900 0.181 3.26 < 1.13 < 0.081 0.177
WP-06-SL-019 1.19 0.242 6.81 0.469 < 0.058 0.238
WP-06-SL-020 5.15 0.654 8.90 < 0.923 < 0.096 0.642
WP-06-SL-021 0.698 0.107 18.8 0.164 0.016 < 0.006
WP-06-SL-022 2.96 0.802 18.4 1.29 < 0.121 0.782
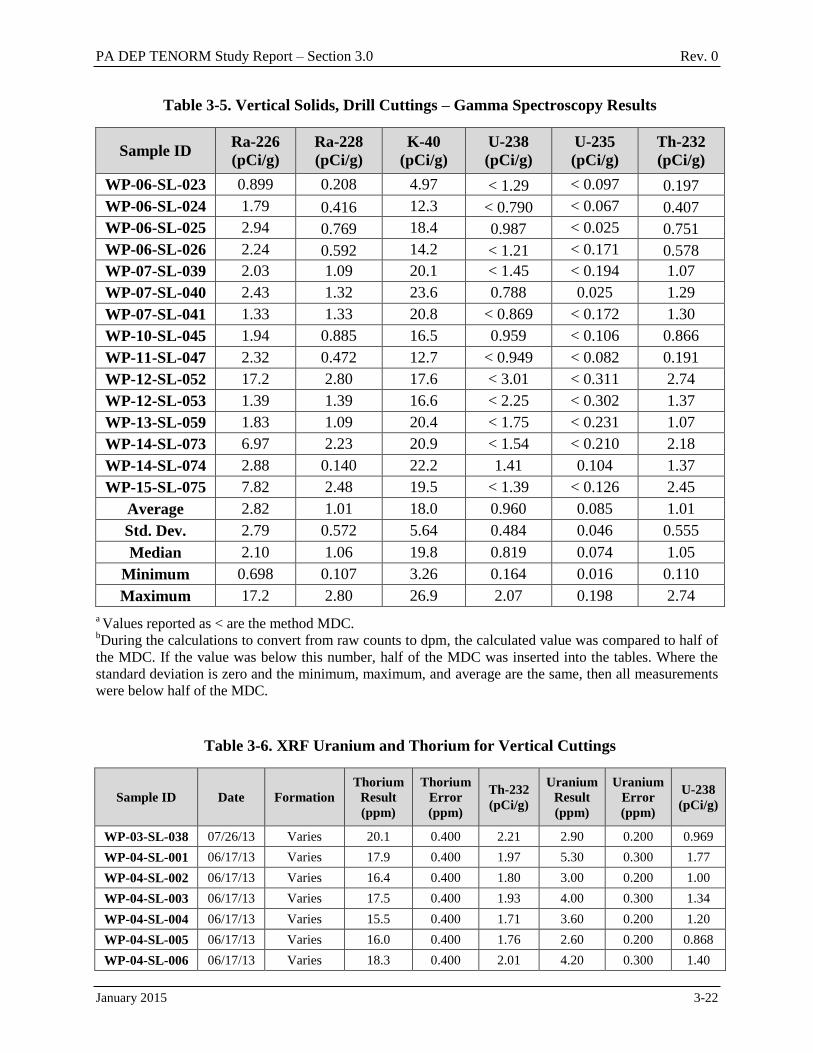
PA DEP TENORM Study Report – Section 3.0 Rev. 0
January 2015 3-22
Table 3-5. Vertical Solids, Drill Cuttings – Gamma Spectroscopy Results
Sample ID Ra-226
(pCi/g)
Ra-228
(pCi/g)
K-40
(pCi/g)
U-238
(pCi/g)
U-235
(pCi/g)
Th-232
(pCi/g)
WP-06-SL-023 0.899 0.208 4.97 < 1.29 < 0.097 0.197
WP-06-SL-024 1.79 0.416 12.3 < 0.790 < 0.067 0.407
WP-06-SL-025 2.94 0.769 18.4 0.987 < 0.025 0.751
WP-06-SL-026 2.24 0.592 14.2 < 1.21 < 0.171 0.578
WP-07-SL-039 2.03 1.09 20.1 < 1.45 < 0.194 1.07
WP-07-SL-040 2.43 1.32 23.6 0.788 0.025 1.29
WP-07-SL-041 1.33 1.33 20.8 < 0.869 < 0.172 1.30
WP-10-SL-045 1.94 0.885 16.5 0.959 < 0.106 0.866
WP-11-SL-047 2.32 0.472 12.7 < 0.949 < 0.082 0.191
WP-12-SL-052 17.2 2.80 17.6 < 3.01 < 0.311 2.74
WP-12-SL-053 1.39 1.39 16.6 < 2.25 < 0.302 1.37
WP-13-SL-059 1.83 1.09 20.4 < 1.75 < 0.231 1.07
WP-14-SL-073 6.97 2.23 20.9 < 1.54 < 0.210 2.18
WP-14-SL-074 2.88 0.140 22.2 1.41 0.104 1.37
WP-15-SL-075 7.82 2.48 19.5 < 1.39 < 0.126 2.45
Average 2.82 1.01 18.0 0.960 0.085 1.01
Std. Dev. 2.79 0.572 5.64 0.484 0.046 0.555
Median 2.10 1.06 19.8 0.819 0.074 1.05
Minimum 0.698 0.107 3.26 0.164 0.016 0.110
Maximum 17.2 2.80 26.9 2.07 0.198 2.74
a Values reported as < are the method MDC.
bDuring the calculations to convert from raw counts to dpm, the calculated value was compared to half of
the MDC. If the value was below this number, half of the MDC was inserted into the tables. Where the
standard deviation is zero and the minimum, maximum, and average are the same, then all measurements
were below half of the MDC.
Table 3-6. XRF Uranium and Thorium for Vertical Cuttings
Sample ID Date Formation
Thorium
Result
(ppm)
Thorium
Error
(ppm)
Th-232
(pCi/g)
Uranium
Result
(ppm)
Uranium
Error
(ppm)
U-238
(pCi/g)
WP-03-SL-038 07/26/13 Varies 20.1 0.400 2.21 2.90 0.200 0.969
WP-04-SL-001 06/17/13 Varies 17.9 0.400 1.97 5.30 0.300 1.77
WP-04-SL-002 06/17/13 Varies 16.4 0.400 1.80 3.00 0.200 1.00
WP-04-SL-003 06/17/13 Varies 17.5 0.400 1.93 4.00 0.300 1.34
WP-04-SL-004 06/17/13 Varies 15.5 0.400 1.71 3.60 0.200 1.20
WP-04-SL-005 06/17/13 Varies 16.0 0.400 1.76 2.60 0.200 0.868
WP-04-SL-006 06/17/13 Varies 18.3 0.400 2.01 4.20 0.300 1.40

PA DEP TENORM Study Report – Section 3.0 Rev. 0
January 2015 3-23
Table 3-6. XRF Uranium and Thorium for Vertical Cuttings
Sample ID Date Formation
Thorium
Result
(ppm)
Thorium
Error
(ppm)
Th-232
(pCi/g)
Uranium
Result
(ppm)
Uranium
Error
(ppm)
U-238
(pCi/g)
WP-04-SL-007 06/17/13 Varies 14.5 0.400 1.60 3.00 0.200 1.00
WP-04-SL-008 06/17/13 Varies 16.8 0.400 1.85 5.30 0.300 1.77
WP-05-SL-028 07/08/13 Varies 17.4 0.400 1.91 4.50 0.300 1.50
WP-05-SL-029 07/08/13 Varies 15.5 0.400 1.71 3.70 0.200 1.24
WP-05-SL-030 07/08/13 Varies 14.5 0.400 1.60 3.50 0.200 1.17
WP-05-SL-031 07/08/13 Varies 16.5 0.400 1.82 2.60 0.200 0.868
WP-05-SL-033 07/08/13 Varies 11.2 0.400 1.23 2.30 0.200 0.768
WP-06-SL-014 07/01/13 Varies 16.5 0.400 1.82 6.40 0.300 2.14
WP-06-SL-015 07/01/13 Varies 17.8 0.400 1.96 3.80 0.300 1.27
WP-06-SL-016 07/01/13 Varies 15.2 0.400 1.67 7.10 0.300 2.37
WP-06-SL-017 07/01/13 Varies 16.3 0.400 1.79 6.10 0.300 2.04
WP-06-SL-018 07/01/13 Varies 6.50 0.400 0.715 3.00 0.200 1.00
WP-06-SL-019 07/01/13 Varies 8.60 0.400 0.946 2.80 0.200 0.935
WP-06-SL-020 07/01/13 Varies 10.9 0.400 1.20 13.4 0.500 4.48
WP-06-SL-021 07/01/13 Varies 8.50 0.400 0.935 4.40 0.200 1.47
WP-06-SL-022 07/01/13 Varies 15.6 0.400 1.72 5.80 0.300 1.94
WP-06-SL-023 07/01/13 Oriskany 6.30 0.300 0.693 1.50 0.100 0.501
WP-06-SL-024 07/08/13 Varies 11.5 0.400 1.27 4.80 0.300 1.60
WP-06-SL-025 07/08/13 Varies 16.0 0.400 1.76 5.40 0.300 1.80
WP-06-SL-026 07/08/13 Varies 17.7 0.500 1.95 8.80 0.500 2.94
WP-07-SL-039 08/05/13 Varies 17.3 0.400 1.90 2.50 0.200 0.835
WP-07-SL-040 08/05/13 Varies 17.8 0.400 1.96 1.50 0.100 0.501
WP-07-SL-041 08/05/13 Varies 17.7 0.400 1.95 2.30 0.200 0.768
WP-10-SL-045 08/26/13 Varies 11.8 0.400 1.30 3.00 0.200 1.00
WP-11-SL-047 08/27/13 Varies 7.00 0.400 0.770 2.40 0.100 0.802
WP-12-SL-052 09/05/13 Varies 17.7 0.500 1.95 12.4 0.500 4.14
WP-12-SL-053 09/05/13 Varies 17.9 0.400 1.97 6.30 0.300 2.10
WP-13-SL-059 10/15/13 Varies 16.2 0.400 1.78 2.00 0.200 0.668
WP-14-SL-073 01/31/14 Varies 17.1 0.400 1.88 3.10 0.200 1.04
WP-14-SL-074 01/31/14 Varies 17.3 0.400 1.90 3.20 0.200 1.07
Average 15.0
1.64 4.39
1.47
Std. Dev. 3.66 0.403 2.64 0.881
Median 16.3 1.79 3.60 1.20
Minimum 6.30 0.693 1.50 0.501
Maximum 20.1 2.21 13.4 4.48
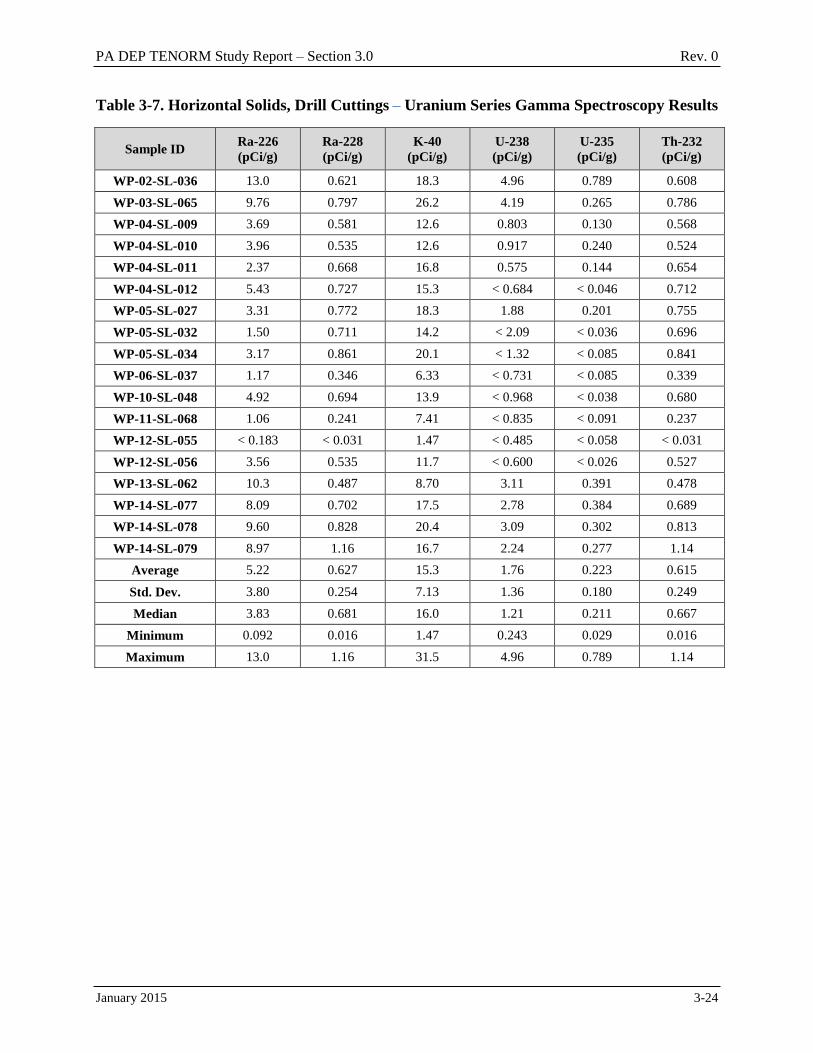
PA DEP TENORM Study Report – Section 3.0 Rev. 0
January 2015 3-24
Table 3-7. Horizontal Solids, Drill Cuttings – Uranium Series Gamma Spectroscopy Results
Sample ID Ra-226
(pCi/g)
Ra-228
(pCi/g)
K-40
(pCi/g)
U-238
(pCi/g)
U-235
(pCi/g)
Th-232
(pCi/g)
WP-02-SL-036 13.0 0.621 18.3 4.96 0.789 0.608
WP-03-SL-065 9.76 0.797 26.2 4.19 0.265 0.786
WP-04-SL-009 3.69 0.581 12.6 0.803 0.130 0.568
WP-04-SL-010 3.96 0.535 12.6 0.917 0.240 0.524
WP-04-SL-011 2.37 0.668 16.8 0.575 0.144 0.654
WP-04-SL-012 5.43 0.727 15.3 < 0.684 < 0.046 0.712
WP-05-SL-027 3.31 0.772 18.3 1.88 0.201 0.755
WP-05-SL-032 1.50 0.711 14.2 < 2.09 < 0.036 0.696
WP-05-SL-034 3.17 0.861 20.1 < 1.32 < 0.085 0.841
WP-06-SL-037 1.17 0.346 6.33 < 0.731 < 0.085 0.339
WP-10-SL-048 4.92 0.694 13.9 < 0.968 < 0.038 0.680
WP-11-SL-068 1.06 0.241 7.41 < 0.835 < 0.091 0.237
WP-12-SL-055 < 0.183 < 0.031 1.47 < 0.485 < 0.058 < 0.031
WP-12-SL-056 3.56 0.535 11.7 < 0.600 < 0.026 0.527
WP-13-SL-062 10.3 0.487 8.70 3.11 0.391 0.478
WP-14-SL-077 8.09 0.702 17.5 2.78 0.384 0.689
WP-14-SL-078 9.60 0.828 20.4 3.09 0.302 0.813
WP-14-SL-079 8.97 1.16 16.7 2.24 0.277 1.14
Average 5.22 0.627 15.3 1.76 0.223 0.615
Std. Dev. 3.80 0.254 7.13 1.36 0.180 0.249
Median 3.83 0.681 16.0 1.21 0.211 0.667
Minimum 0.092 0.016 1.47 0.243 0.029 0.016
Maximum 13.0 1.16 31.5 4.96 0.789 1.14

PA DEP TENORM Study Report – Section 3.0 Rev. 0
January 2015 3-25
Table 3-8. XRF Uranium and Thorium for Horizontal Cuttings
Sample ID Date
Target
Formation /
Gas Type
Thorium
Result
(ppm)
Thorium
Error
(ppm)
Th-232
(pCi/g)
Uranium
Result
(ppm)
Uranium
Error
(ppm)
U-238
(pCi/g)
WP-02-SL-
036 07/24/13
Marcellus /
Wet 12.2 0.400 1.34 28.6 0.500 9.55
WP-03-SL-
065 11/08/13
Marcellus /
Wet 11.8 0.400 1.30 20.1 0.600 6.71
WP-04-SL-
009 06/20/13
Marcellus /
Dry 12.0 0.500 1.32 8.70 0.400 2.91
WP-04-SL-
010 06/20/13
Marcellus /
Dry 10.8 0.500 1.19 9.90 0.400 3.31
WP-04-SL-
011 06/20/13
Marcellus /
Dry 12.5 0.400 1.38 5.90 0.300 1.97
WP-04-SL-
012 06/20/13
Marcellus /
Dry 12.4 0.400 1.36 14.6 0.500 4.88
WP-05-SL-
027 07/08/13 Burkett / Wet 16.2 0.400 1.78 9.70 0.400 3.24
WP-05-SL-
032 07/08/13 Burkett / Wet 11.1 0.400 1.22 5.20 0.300 1.74
WP-05-SL-
034 07/08/13 Burkett / Wet 16.4 0.500 1.80 6.60 0.400 2.20
WP-06-SL-
037 07/25/13 Utica / Wet 17.4 1.30 1.91 80.8 1.30 27.0
WP-10-SL-
048 08/30/13
Marcellus /
Dry 13.8 0.800 1.52 49.4 1.00 16.5
WP-11-SL-
068 11/14/13 Utica / Dry 7.70 0.500 0.847 17.6 0.500 5.88
WP-12-SL-
055 09/11/13
Marcellus /
Dry 13.0 0.800 1.43 11.3 0.500 3.77
WP-12-SL-
056 09/11/13
Marcellus /
Dry 20.3 1.20 2.23 36.6 1.20 12.2
WP-13-SL-
062 10/21/13
Marcellus /
Dry 9.40 0.500 1.03 33.1 0.6 11.1
WP-14-SL-
077 02/07/14
Marcellus /
Dry 11.0 0.500 1.21 31.4 0.700 10.5
WP-14-SL-
078 02/07/14
Marcellus /
Dry 13.3 0.500 1.46 33.8 0.700 11.3
WP-14-SL-
079 02/07/14
Marcellus /
Dry 11.7 0.700 1.29 49.4 0.900 16.5
Average 12.9
1.42 25.2
8.40
Std. Dev. 3.01 0.331 20.0 6.70
Median 12.3 1.35 18.9 6.30
Minimum 7.70 0.847 5.20 1.74
Maximum 20.3 2.23 80.8 27.0

PA DEP TENORM Study Report – Section 3.0 Rev. 0
January 2015 3-26
Table 3-9. Drilling Solids, Mud – Gamma Spectroscopy Results
Sample ID Ra-226
(pCi/g)
Ra-228
(pCi/g)
K-40
(pCi/g)
U-238
(pCi/g)
U-235
(pCi/g)
Th-232
(pCi/g)
WP-03-SL-066 1.51 0.178 4.93 < 0.436 < 0.085 0.176
WP-04-SL-013 1.58 0.221 4.31 < 0.866 < 0.073 0.216
WP-05-SL-035 0.675 0.182 3.54 < 0.375 < 0.054 0.179
WP-10-SL-046 3.66 0.266 6.91 < 0.640 < 0.034 0.261
WP-10-SL-049 3.35 0.335 7.32 < 0.732 < 0.035 < 0.870
WP-11-SL-069 1.04 0.195 3.84 < 0.673 < 0.058 0.191
WP-12-SL-054 1.28 0.122 1.47 1.10 < 0.081 0.120
WP-13-SL-060 2.78 0.296 5.96 < 0.692 0.086 0.290
WP-13-SL-063 3.72 0.328 6.53 0.700 0.143 0.322
Average 2.18 0.236 4.98 0.651 0.063 0.243
Std. Dev. 1.20 0.074 1.89 0.504 0.038 0.095
Median 1.58 0.221 4.93 0.433 0.043 0.216
Minimum 0.675 0.122 1.47 0.188 0.027 0.120
Maximum 3.72 0.335 7.32 1.73 0.143 0.435
Table 3-10. Proppant Sand – Gamma Spectroscopy Results
Sample ID Ra-226
(pCi/g)
Ra-228
(pCi/g)
K-40
(pCi/g)
U-238
(pCi/g)
U-235
(pCi/g)
Th-232
(pCi/g)
WP-04-SL-050 0.180 0.053 0.733 0.139 < 0.025 0.047
WP-05-SL-058 0.225 0.135 7.25 < 0.200 < 0.037 0.115
WP-06-SL-070 0.170 0.026 0.069 0.323 < 0.018 0.025
WP-08-SL-044 0.246 0.065 0.162 < 0.020 < 0.004 0.045
WP-09-SL-043 0.301 0.045 0.199 < 0.426 < 0.050 0.044
WP-10-SL-067 0.218 0.018 0.136 < 0.369 < 0.036 0.018
WP-11-SL-072 0.275 0.025 0.070 < 0.203 < 0.033 0.025
WP-12-SL-064 0.358 0.038 0.386 < 0.426 < 0.042 0.037
WP-14-SL-081 0.266 < 0.026 4.99 < 0.442 < 0.035 0.102
WP-25-SL-042 0.188 0.018 < 0.061 < 0.267 < 0.029 < 0.013
Average 0.243 0.044 1.40 0.157 0.015 0.046
Std. Dev. 0.059 0.036 2.55 0.091 0.006 0.035
Median 0.236 0.032 0.181 0.159 0.017 0.041
Minimum 0.170 0.013 0.031 0.010 0.002 0.007
Maximum 0.358 0.135 7.25 0.323 0.025 0.115
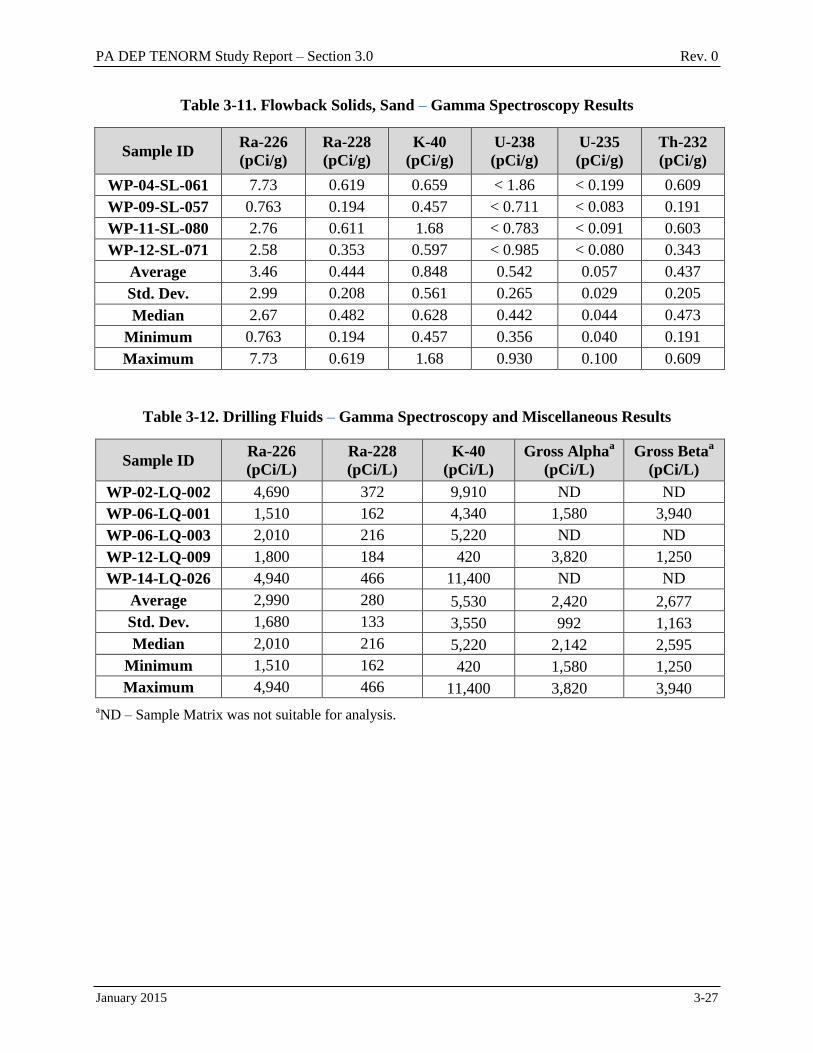
PA DEP TENORM Study Report – Section 3.0 Rev. 0
January 2015 3-27
Table 3-11. Flowback Solids, Sand – Gamma Spectroscopy Results
Sample ID Ra-226
(pCi/g)
Ra-228
(pCi/g)
K-40
(pCi/g)
U-238
(pCi/g)
U-235
(pCi/g)
Th-232
(pCi/g)
WP-04-SL-061 7.73 0.619 0.659 < 1.86 < 0.199 0.609
WP-09-SL-057 0.763 0.194 0.457 < 0.711 < 0.083 0.191
WP-11-SL-080 2.76 0.611 1.68 < 0.783 < 0.091 0.603
WP-12-SL-071 2.58 0.353 0.597 < 0.985 < 0.080 0.343
Average 3.46 0.444 0.848 0.542 0.057 0.437
Std. Dev. 2.99 0.208 0.561 0.265 0.029 0.205
Median 2.67 0.482 0.628 0.442 0.044 0.473
Minimum 0.763 0.194 0.457 0.356 0.040 0.191
Maximum 7.73 0.619 1.68 0.930 0.100 0.609
Table 3-12. Drilling Fluids – Gamma Spectroscopy and Miscellaneous Results
Sample ID Ra-226
(pCi/L)
Ra-228
(pCi/L)
K-40
(pCi/L)
Gross Alphaa
(pCi/L)
Gross Betaa
(pCi/L)
WP-02-LQ-002 4,690 372 9,910 ND ND
WP-06-LQ-001 1,510 162 4,340 1,580 3,940
WP-06-LQ-003 2,010 216 5,220 ND ND
WP-12-LQ-009 1,800 184 420 3,820 1,250
WP-14-LQ-026 4,940 466 11,400 ND ND
Average 2,990 280 5,530 2,420 2,677
Std. Dev. 1,680 133 3,550 992 1,163
Median 2,010 216 5,220 2,142 2,595
Minimum 1,510 162 420 1,580 1,250
Maximum 4,940 466 11,400 3,820 3,940
aND – Sample Matrix was not suitable for analysis.
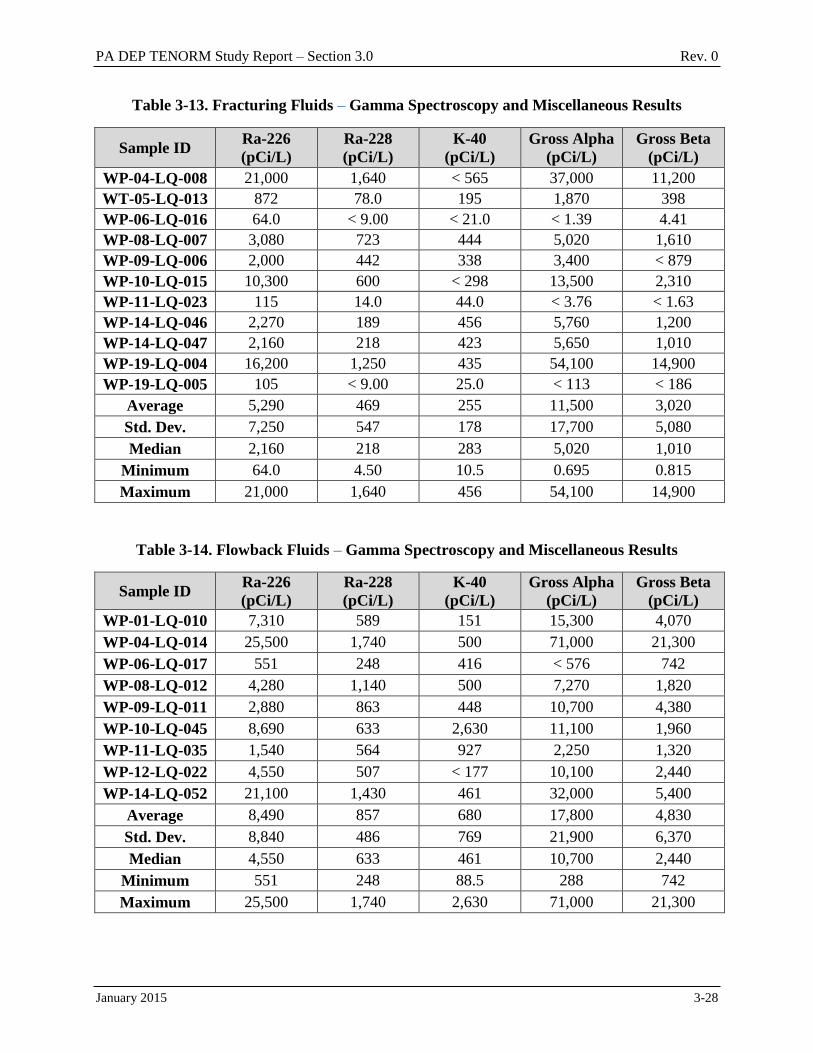
PA DEP TENORM Study Report – Section 3.0 Rev. 0
January 2015 3-28
Table 3-13. Fracturing Fluids – Gamma Spectroscopy and Miscellaneous Results
Sample ID Ra-226
(pCi/L)
Ra-228
(pCi/L)
K-40
(pCi/L)
Gross Alpha
(pCi/L)
Gross Beta
(pCi/L)
WP-04-LQ-008 21,000 1,640 < 565 37,000 11,200
WT-05-LQ-013 872 78.0 195 1,870 398
WP-06-LQ-016 64.0 < 9.00 < 21.0 < 1.39 4.41
WP-08-LQ-007 3,080 723 444 5,020 1,610
WP-09-LQ-006 2,000 442 338 3,400 < 879
WP-10-LQ-015 10,300 600 < 298 13,500 2,310
WP-11-LQ-023 115 14.0 44.0 < 3.76 < 1.63
WP-14-LQ-046 2,270 189 456 5,760 1,200
WP-14-LQ-047 2,160 218 423 5,650 1,010
WP-19-LQ-004 16,200 1,250 435 54,100 14,900
WP-19-LQ-005 105 < 9.00 25.0 < 113 < 186
Average 5,290 469 255 11,500 3,020
Std. Dev. 7,250 547 178 17,700 5,080
Median 2,160 218 283 5,020 1,010
Minimum 64.0 4.50 10.5 0.695 0.815
Maximum 21,000 1,640 456 54,100 14,900
Table 3-14. Flowback Fluids – Gamma Spectroscopy and Miscellaneous Results
Sample ID Ra-226
(pCi/L)
Ra-228
(pCi/L)
K-40
(pCi/L)
Gross Alpha
(pCi/L)
Gross Beta
(pCi/L)
WP-01-LQ-010 7,310 589 151 15,300 4,070
WP-04-LQ-014 25,500 1,740 500 71,000 21,300
WP-06-LQ-017 551 248 416 < 576 742
WP-08-LQ-012 4,280 1,140 500 7,270 1,820
WP-09-LQ-011 2,880 863 448 10,700 4,380
WP-10-LQ-045 8,690 633 2,630 11,100 1,960
WP-11-LQ-035 1,540 564 927 2,250 1,320
WP-12-LQ-022 4,550 507 < 177 10,100 2,440
WP-14-LQ-052 21,100 1,430 461 32,000 5,400
Average 8,490 857 680 17,800 4,830
Std. Dev. 8,840 486 769 21,900 6,370
Median 4,550 633 461 10,700 2,440
Minimum 551 248 88.5 288 742
Maximum 25,500 1,740 2,630 71,000 21,300
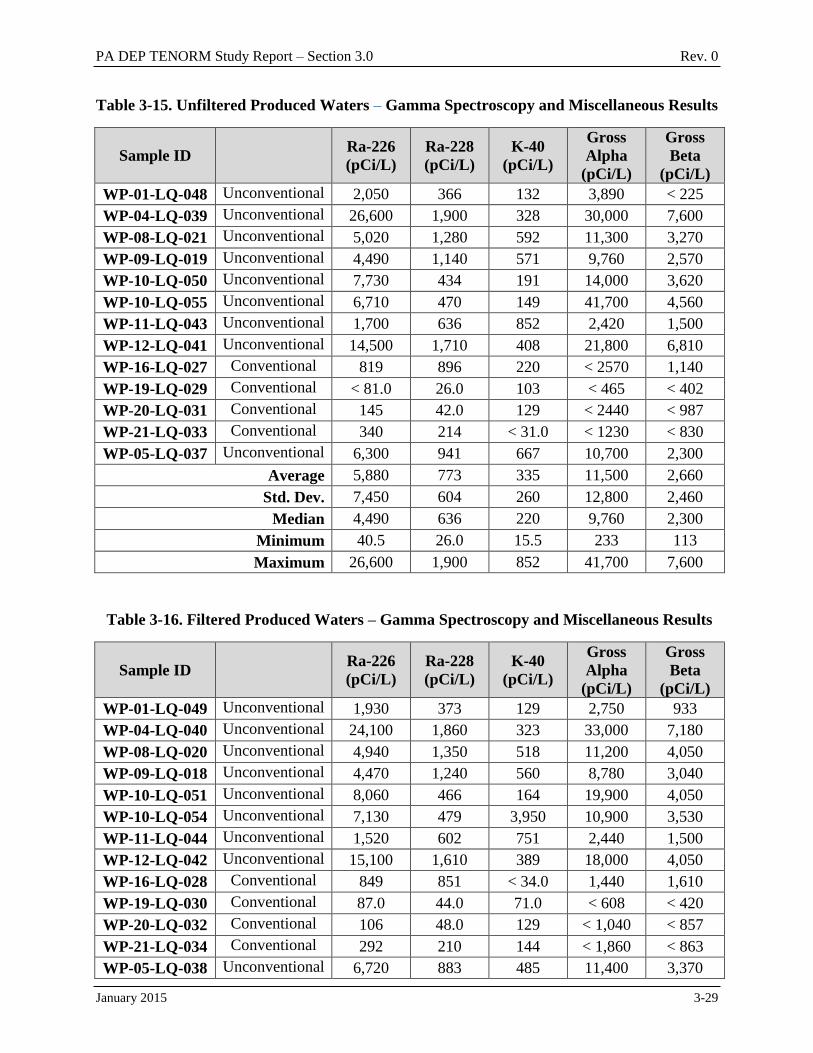
PA DEP TENORM Study Report – Section 3.0 Rev. 0
January 2015 3-29
Table 3-15. Unfiltered Produced Waters – Gamma Spectroscopy and Miscellaneous Results
Sample ID Ra-226
(pCi/L)
Ra-228
(pCi/L)
K-40
(pCi/L)
Gross
Alpha
(pCi/L)
Gross
Beta
(pCi/L)
WP-01-LQ-048 Unconventional 2,050 366 132 3,890 < 225
WP-04-LQ-039 Unconventional 26,600 1,900 328 30,000 7,600
WP-08-LQ-021 Unconventional 5,020 1,280 592 11,300 3,270
WP-09-LQ-019 Unconventional 4,490 1,140 571 9,760 2,570
WP-10-LQ-050 Unconventional 7,730 434 191 14,000 3,620
WP-10-LQ-055 Unconventional 6,710 470 149 41,700 4,560
WP-11-LQ-043 Unconventional 1,700 636 852 2,420 1,500
WP-12-LQ-041 Unconventional 14,500 1,710 408 21,800 6,810
WP-16-LQ-027 Conventional 819 896 220 < 2570 1,140
WP-19-LQ-029 Conventional < 81.0 26.0 103 < 465 < 402
WP-20-LQ-031 Conventional 145 42.0 129 < 2440 < 987
WP-21-LQ-033 Conventional 340 214 < 31.0 < 1230 < 830
WP-05-LQ-037 Unconventional 6,300 941 667 10,700 2,300
Average 5,880 773 335 11,500 2,660
Std. Dev. 7,450 604 260 12,800 2,460
Median 4,490 636 220 9,760 2,300
Minimum 40.5 26.0 15.5 233 113
Maximum 26,600 1,900 852 41,700 7,600
Table 3-16. Filtered Produced Waters – Gamma Spectroscopy and Miscellaneous Results
Sample ID Ra-226
(pCi/L)
Ra-228
(pCi/L)
K-40
(pCi/L)
Gross
Alpha
(pCi/L)
Gross
Beta
(pCi/L)
WP-01-LQ-049 Unconventional 1,930 373 129 2,750 933
WP-04-LQ-040 Unconventional 24,100 1,860 323 33,000 7,180
WP-08-LQ-020 Unconventional 4,940 1,350 518 11,200 4,050
WP-09-LQ-018 Unconventional 4,470 1,240 560 8,780 3,040
WP-10-LQ-051 Unconventional 8,060 466 164 19,900 4,050
WP-10-LQ-054 Unconventional 7,130 479 3,950 10,900 3,530
WP-11-LQ-044 Unconventional 1,520 602 751 2,440 1,500
WP-12-LQ-042 Unconventional 15,100 1,610 389 18,000 4,050
WP-16-LQ-028 Conventional 849 851 < 34.0 1,440 1,610
WP-19-LQ-030 Conventional 87.0 44.0 71.0 < 608 < 420
WP-20-LQ-032 Conventional 106 48.0 129 < 1,040 < 857
WP-21-LQ-034 Conventional 292 210 144 < 1,860 < 863
WP-05-LQ-038 Unconventional 6,720 883 485 11,400 3,370

PA DEP TENORM Study Report – Section 3.0 Rev. 0
January 2015 3-30
Table 3-16. Filtered Produced Waters – Gamma Spectroscopy and Miscellaneous Results
Sample ID Ra-226
(pCi/L)
Ra-228
(pCi/L)
K-40
(pCi/L)
Gross
Alpha
(pCi/L)
Gross
Beta
(pCi/L)
Average 5,970 770 587 9,900 2,790
Std. Dev. 6,980 591 1,030 9,970 2,040
Median 4,470 602 323 9,840 3,210
Minimum 87.0 44.0 17.0 304 210
Maximum 24,100 1,860 3,950 33,000 7,180
Table 3-17. Ambient Radon at Well Sites During Flowback
Sample ID County Date Radon Conc. +/- 2 S.D.
(pCi/L) MDC (pCi/L)
WP-01-RA Sullivan 9/2013
<0.300 +/- 0.000 0.300
0.800 +/- 0.000 0.300
0.500 +/- 0.400 0.300
<0.300 +/- 0.000 0.300
<0.300 +/- 0.000 0.300
WP-09-RA Washington 9/2013
0.700 +/- 0.600 0.300
0.600 +/- 0.200 0.300
0.600 +/- 0.200 0.300
1.70 +/- 1.60 0.300
WP-08-RA Washington 9/2013
0.500 +/- 0.800 0.300
0.200 +/- 0.200 0.300
0.600 +/- 0.600 0.300
0.700 +/- 0.400 0.300
WP-04-RA Tioga 10/2013
0.500 +/- 0.200 0.300
0.200 +/- 0.200 0.300
0.500 +/- 0.600 0.300
0.700 +/- 0.200 0.300
E-PERM samples with short-term electrets were deployed. MDC for a four-day exposure at 50 percent
error is 0.300 pCi/L.
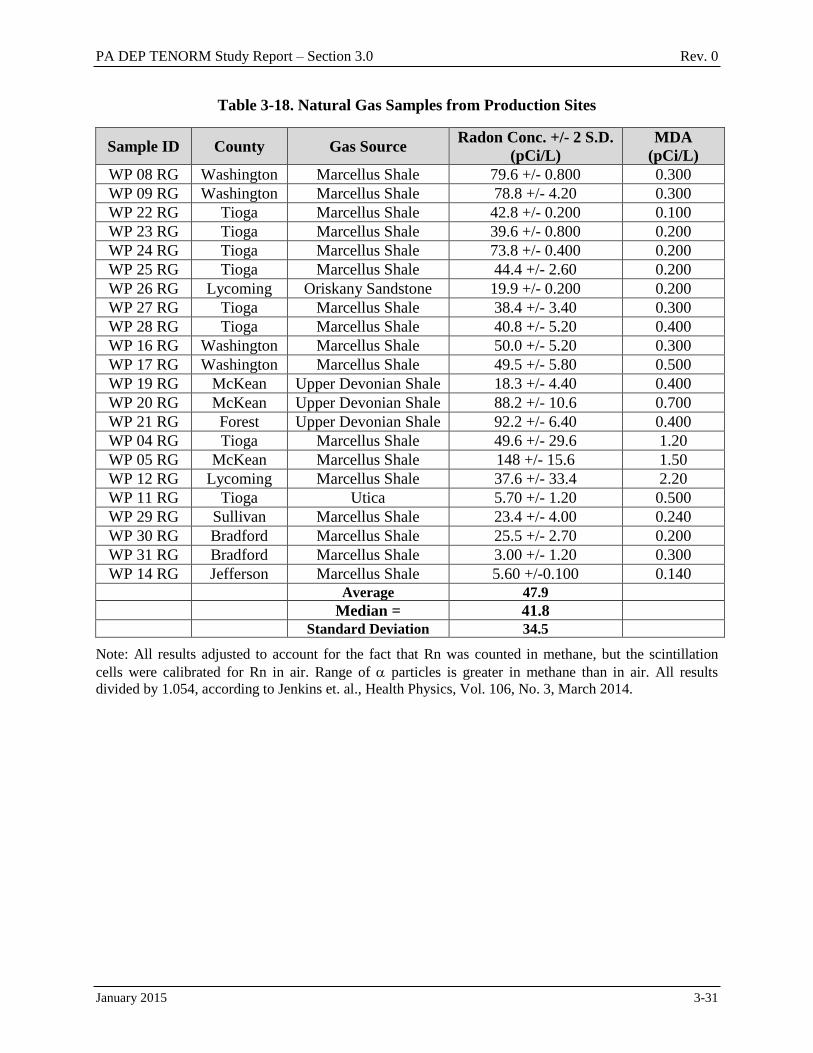
PA DEP TENORM Study Report – Section 3.0 Rev. 0
January 2015 3-31
Table 3-18. Natural Gas Samples from Production Sites
Sample ID County Gas Source Radon Conc. +/- 2 S.D.
(pCi/L)
MDA
(pCi/L)
WP 08 RG Washington Marcellus Shale 79.6 +/- 0.800 0.300
WP 09 RG Washington Marcellus Shale 78.8 +/- 4.20 0.300
WP 22 RG Tioga Marcellus Shale 42.8 +/- 0.200 0.100
WP 23 RG Tioga Marcellus Shale 39.6 +/- 0.800 0.200
WP 24 RG Tioga Marcellus Shale 73.8 +/- 0.400 0.200
WP 25 RG Tioga Marcellus Shale 44.4 +/- 2.60 0.200
WP 26 RG Lycoming Oriskany Sandstone 19.9 +/- 0.200 0.200
WP 27 RG Tioga Marcellus Shale 38.4 +/- 3.40 0.300
WP 28 RG Tioga Marcellus Shale 40.8 +/- 5.20 0.400
WP 16 RG Washington Marcellus Shale 50.0 +/- 5.20 0.300
WP 17 RG Washington Marcellus Shale 49.5 +/- 5.80 0.500
WP 19 RG McKean Upper Devonian Shale 18.3 +/- 4.40 0.400
WP 20 RG McKean Upper Devonian Shale 88.2 +/- 10.6 0.700
WP 21 RG Forest Upper Devonian Shale 92.2 +/- 6.40 0.400
WP 04 RG Tioga Marcellus Shale 49.6 +/- 29.6 1.20
WP 05 RG McKean Marcellus Shale 148 +/- 15.6 1.50
WP 12 RG Lycoming Marcellus Shale 37.6 +/- 33.4 2.20
WP 11 RG Tioga Utica 5.70 +/- 1.20 0.500
WP 29 RG Sullivan Marcellus Shale 23.4 +/- 4.00 0.240
WP 30 RG Bradford Marcellus Shale 25.5 +/- 2.70 0.200
WP 31 RG Bradford Marcellus Shale 3.00 +/- 1.20 0.300
WP 14 RG Jefferson Marcellus Shale 5.60 +/-0.100 0.140 Average 47.9
Median = 41.8 Standard Deviation 34.5
Note: All results adjusted to account for the fact that Rn was counted in methane, but the scintillation
cells were calibrated for Rn in air. Range of particles is greater in methane than in air. All results
divided by 1.054, according to Jenkins et. al., Health Physics, Vol. 106, No. 3, March 2014.
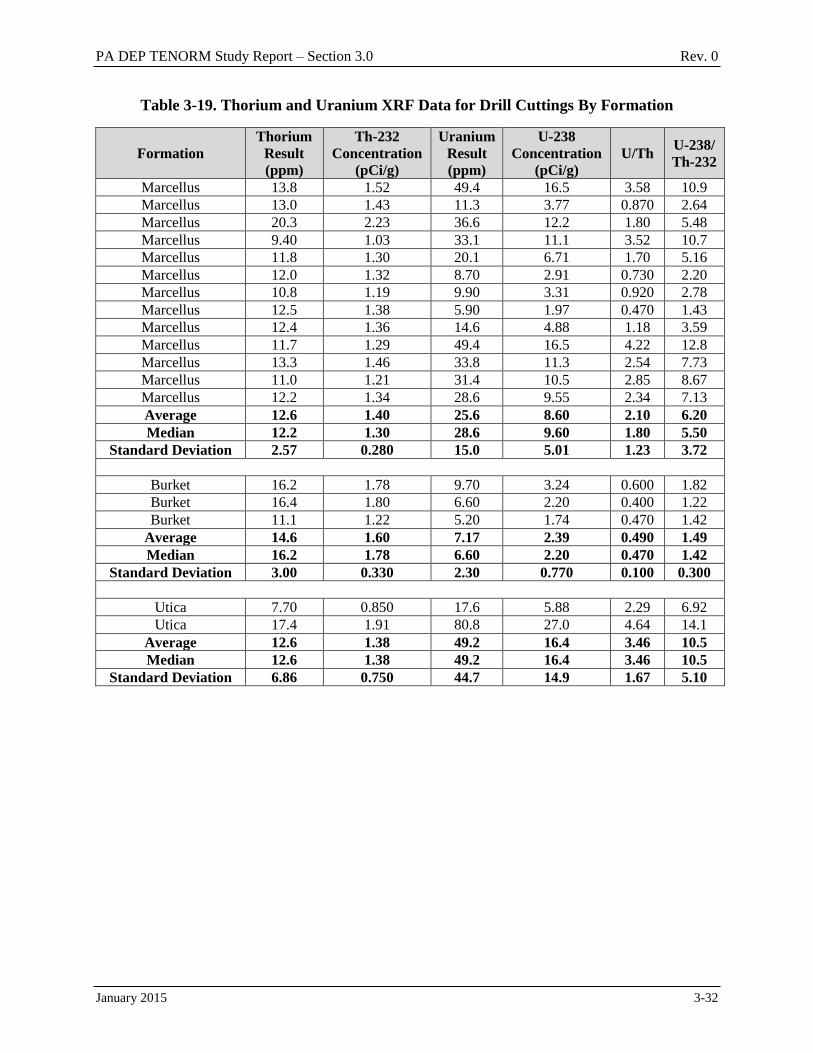
PA DEP TENORM Study Report – Section 3.0 Rev. 0
January 2015 3-32
Table 3-19. Thorium and Uranium XRF Data for Drill Cuttings By Formation
Formation
Thorium
Result
(ppm)
Th-232
Concentration
(pCi/g)
Uranium
Result
(ppm)
U-238
Concentration
(pCi/g)
U/Th U-238/
Th-232
Marcellus 13.8 1.52 49.4 16.5 3.58 10.9
Marcellus 13.0 1.43 11.3 3.77 0.870 2.64
Marcellus 20.3 2.23 36.6 12.2 1.80 5.48
Marcellus 9.40 1.03 33.1 11.1 3.52 10.7
Marcellus 11.8 1.30 20.1 6.71 1.70 5.16
Marcellus 12.0 1.32 8.70 2.91 0.730 2.20
Marcellus 10.8 1.19 9.90 3.31 0.920 2.78
Marcellus 12.5 1.38 5.90 1.97 0.470 1.43
Marcellus 12.4 1.36 14.6 4.88 1.18 3.59
Marcellus 11.7 1.29 49.4 16.5 4.22 12.8
Marcellus 13.3 1.46 33.8 11.3 2.54 7.73
Marcellus 11.0 1.21 31.4 10.5 2.85 8.67
Marcellus 12.2 1.34 28.6 9.55 2.34 7.13
Average 12.6 1.40 25.6 8.60 2.10 6.20
Median 12.2 1.30 28.6 9.60 1.80 5.50
Standard Deviation 2.57 0.280 15.0 5.01 1.23 3.72
Burket 16.2 1.78 9.70 3.24 0.600 1.82
Burket 16.4 1.80 6.60 2.20 0.400 1.22
Burket 11.1 1.22 5.20 1.74 0.470 1.42
Average 14.6 1.60 7.17 2.39 0.490 1.49
Median 16.2 1.78 6.60 2.20 0.470 1.42
Standard Deviation 3.00 0.330 2.30 0.770 0.100 0.300
Utica 7.70 0.850 17.6 5.88 2.29 6.92
Utica 17.4 1.91 80.8 27.0 4.64 14.1
Average 12.6 1.38 49.2 16.4 3.46 10.5
Median 12.6 1.38 49.2 16.4 3.46 10.5
Standard Deviation 6.86 0.750 44.7 14.9 1.67 5.10
PA DEP TENORM Study Report – Section 4.0 Rev. 0
January 2015 4-1
4.0 WASTEWATER TREATMENT PLANTS
A total of 29 WWTPs were surveyed and/or sampled. This included 10 POTWs, 10 CWTs and
nine ZLDs. The results, by wastewater facility, are presented in this section.
4.1 Publicly Owned Treatment Works
A total of 10 POTWs were surveyed and/or sampled. There were three rounds of surveys
conducted over a seven-month period (April 2013 through October 2013); however, not all
POTWs were sampled in all three rounds. Six of the 10 POTWs are considered influenced
(POTW-I) by having received wastewater from the O&G industry, mainly the effluent of
CWTs. Four POTWs are considered non-influenced (POTW-N) by having never received
wastewater from the O&G industry. As such, surveying was conducted for the 10 POTWs as
follows:
5 POTW-I’s were surveyed in all three rounds,
1 POTW-I was surveyed in two rounds, and
4 POTW-N’s were surveyed one time.
4.1.1 Radiological Survey Results
Radiological surveys were conducted at each POTW-I, resulting in four data sets:
Removable / surface radioactivity measurements recorded in units of dpm/100 cm2
Total / surface radioactivity measurements recorded in units of dpm/100 cm2
Gross Gamma Radiation Scan measurements recorded in units of cpm
Gamma Radiation Exposure Rate measurements recorded in units of µR/hr
4.1.1.1 Removable Alpha/Beta Surface Radioactivity Measurement Results
Measurements of removable radioactivity were performed to assess potential internal radiation
exposures of workers through ingestion and/or inhalation. The results were evaluated using the
RG 1.86 guidelines, Table 1. RG 1.86 requires that and surface radioactivity levels be
evaluated separately. The primary emitter of concern is Ra-226, with a removable criterion of
20 dpm /100 cm2. The primary emitter of concern is Ra-228 of the natural Th decay series
with a removable criterion of 200 dpm /100 cm2. The average removable and surface
radioactivity levels at each WWTP were below the RG 1.86 criteria. The maximum removable
and surface radioactivity levels were 22 dpm/100 cm2 and 161 dpm/100 cm
2. The results of
removable and surface radioactivity for the POTW-I plants are presented in Table 4-1.
Individual removable and surface radioactivity measurement results are presented in
Appendix D.
4.1.1.2 Total Alpha/Beta Surface Radioactivity Measurement Results
Measurements of total radioactivity were performed to assess potential internal radiation
exposures of workers through ingestion and/or inhalation. The results were evaluated using the
RG 1.86 guidelines, Table 1. RG 1.86 requires that and surface radioactivity levels be
PA DEP TENORM Study Report – Section 4.0 Rev. 0
January 2015 4-2
evaluated separately. The primary emitter of concern is Ra-226, with a total surface
radioactivity criterion of 100 dpm /100 cm2. The primary emitter of concern is Ra-228 of the
natural Th decay series with a total surface radioactivity criterion of 1,000 dpm /100 cm2. The
maximum average total and surface radioactivity measured at any single facility were
313 dpm/100 cm2 and 10,000 dpm/100 cm
2, respectively. The maximum total and
concentrations measured at any single facility were 1,190 dpm/100 cm2 and 38,000 dpm/
100 cm2. The summary results of total and surface radioactivity for the POTW-I plants
surveyed are presented in Table 4-2. Individual total and surface radioactivity measurement
results are presented in Appendix D.
4.1.1.3 Gross Gamma Radiation Scan Results
Gross gamma radiation scans recorded in cpm were performed on open land areas and accessible
areas of the WWTPs to identify areas with elevated gross gamma radiation levels. Summary
results for the POTW-I are presented in Table 4-3. The highest average count rate for the plants
was 29,034 cpm, and the maximum count rate recorded was 205,446 cpm. A graphic display of
the gamma radiation scan results (figures) at each facility was prepared using geographic
information system (GIS) software. Figures are presented in Appendix E.
4.1.1.4 Gamma Radiation Exposure Rate Results Summary
Gross gamma radiation scan results in units of cpm presented in Table 4-3 were converted to
R/hr using 800 cpm per R/hr, a conversion factor appropriate for Ra-226 gamma energy as
detected with 2-inch by 2-inch NaI detectors, rounded to one significant figure (Table 6.4, NaI
Scintillation Detector Scan MDCs for Common Radiological Contaminants, NUREG-1507,
Minimum Detectable Concentrations With Typical Radiation Survey Instruments for Various
Contaminants and Field Conditions, USNRC June 1998). Table 4-4 presents statistical results
for each POTW-I. The highest average gamma radiation exposure rate was 36.3 R/hr, and the
maximum gamma radiation exposure rate measured was 257 R/hr.
4.1.2 Solid Sample Results
4.1.2.1 Filter Cake Samples
Filter cakes were sampled at POTW-I and POTW-N plants and analyzed using gamma
spectroscopy for U, Th, and Ac series decay chains. The gamma spectroscopy results are
presented in Tables 4-5 and 4-6.
The analytical results for POTW-I plants presented in Table 4-5 show Ra-226 and Ra-228 are
present above typical background concentrations in soil. The average Ra-226 result was
20.1 pCi/g with a large variance in the distribution, and the maximum result was 55.6 pCi/g. The
average Ra-228 result was 8.32 pCi/g, and the maximum result was 32.0 pCi/g Ra-228.
The radioactivity levels at POTW-N plants presented in Table 4-6 were also above typical
background concentrations in soil with Ra-226 average and maximum results of 8.89 pCi/g and
35.4 pCi/g. The average and maximum Ra-228 results were 2.13 pCi/g and 7.26 pCi/g.
PA DEP TENORM Study Report – Section 4.0 Rev. 0
January 2015 4-3
4.1.2.2 Sediment-Impacted Soil Samples
Sampling was performed at only three of the POTW-I plants due to limited accessibility at the
other plants. A total of seven samples were collected at the effluent discharge points and
analyzed for U, Th, and Ac series decay chains by gamma spectroscopy. The gamma
spectroscopy results are presented in Table 4-7.
The analytical results for POTW-I sediment-impacted soil samples indicate Ra-226 and Ra-228
are present at concentrations above typical background in soil. The average Ra-226 result was
9.00 pCi/g, and the maximum result was 18.2 pCi/g. The average Ra-228 result was 3.52 pCi/g,
and the maximum result was 6.25 pCi/g.
4.1.3 Liquid Sample Results
Influent and effluent liquid sampling was performed at six POTW-I plants and four POTW-N
plants. Filtered and unfiltered samples were analyzed for U, Th, and Ac decay series, and for
gross / radioactivity levels. The filtered and unfiltered analyses are presented separately in
Tables 4-8 through 4-15 for both influenced and non-influenced POTWs. A comparison of the
influenced and non-influenced POTW results and the filtered and unfiltered sample results is
presented in Section 4.1.5.1.
4.1.4 Indoor Radon Sampling Results
ATDs were deployed in the POTW-I plants at various indoor locations such as break rooms,
labs, offices, etc., to measure Rn concentrations. The results were evaluated using the EPA
Action Level of 4.0 pCi/L. The ATDs were deployed in late July or early August 2013 and were
all recovered from the field in February 2014. The results ranged from 0.2 to 8.7 pCi/L. One
result exceeded the action level. The results are presented in Table 4-16. The Rn analytical
reports are presented in Appendix H.
4.1.5 POTW Data Comparisons
4.1.5.1 POTW-I / POTW-N Comparison
Thirty-two influent and effluent sample radionuclide and gross / concentration results from
POTW-I’s and POTW-N’s were compared to determine if there was a difference in the
radionuclide activity content. Tables 4-17 through 4-20 present and compare the average Ra
concentration results and gross / concentration results from all influent and effluent filtered
and unfiltered samples for all POTW-I and POTW-N plants. Twenty-nine of the 32 average
concentration results for both filtered and unfiltered influent and effluent samples were higher
for POTW-I plants than the POTW-N plants.
4.1.5.2 Radium-226/Radium-228 Sediment-Impacted Soil and Effluent Results Comparison
The sediment-impacted soil radioactivity levels were compared to filtered and unfiltered effluent
results for Ra-226 and Ra-228 and are presented in Table 4-21. In cases where no results were
reported for a member of the data pair (sediment-effluent pair), or when a result was reported as
less than MDC, the data pair comparison was not evaluated.

PA DEP TENORM Study Report – Section 4.0 Rev. 0
January 2015 4-4
The sediment-impacted soil sample results are above typical background for soil. However,
there is no readily apparent relationship between the sediment-impacted soil sample and effluent
sample results. The effluent wastewater discharged over time may contribute to the activity in
the sediment-impacted soil, but a correlation between the sediment-impacted soil activity and the
effluent samples could not be made from the study as performed.
The ratio of Ra-226 to Ra-228 was also calculated for a variety of sample types including
sediments, filtered effluents, and unfiltered effluents from POTWs and CWTs. The results are
presented in Table 4-22. The average ratio ranged from 2.4 to 11.4.
4.1.6 POTW Worker Exposure Assessment
4.1.6.1 External Gamma Radiation Exposure
The gamma radiation exposure rate survey results are provided in Section 4.1.1.4. The
maximum average gamma radiation exposure rate measured at any of the POTW plants was
36.3 R/hr. The lowest background gamma radiation exposure rate measured at any of the sites
was 5 R/hr. Assuming the time period of exposure is a full occupational year of 2,000 hours,
the maximum average POTW annual external gamma radiation exposure was estimated as
follows:
Maximum Average POTW External Gamma Radiation Exposure Estimate
(36.3 – 5) µR/hr x 2,000 hr/yr x (1 mrem/1,000 µR gamma) = 62.6 mrem/yr
This is an estimate of the maximum average gamma radiation exposure at a single facility based
on 2,000 hours in one year. The result is less than the 100 mrem/yr dose equivalent limit for a
member of the public. Actual exposure is dependent upon the actual exposure rates and
occupancy time for individual workers.
The maximum gamma radiation exposure rate measured at the POTWs was 257 R/hr on
contact with the outside of a wastewater tank. Consequently, the public dose limit of 100 mrem
per year could potentially be reached by a person working 400 hours within the immediate
proximity of the tank. Actual annual exposure for a POTW worker is dependent upon the
exposure rates and time worked in proximity to the tank.
4.1.6.2 Internal Alpha/Beta Radiation Exposure
The total and removable / survey surface radioactivity summary results are provided in
Sections 4.1.1.1 and 4.1.1.2. Nine of the 566 measurements and 68 of the 566 measurements
of total surface radioactivity exceeded the RG 1.86 criteria. One of the 286 removable
measurements and none of the 286 removable measurements exceeded the RG 1.86 criteria.
Fixed or removable and surface radioactivity may present a potential inhalation or ingestion
hazard if disturbed during routine system maintenance.

PA DEP TENORM Study Report – Section 4.0 Rev. 0
January 2015 4-5
4.1.6.3 Internal Radon Exposure
The Rn measured in indoor air averaged 1.7 pCi/L. The average is above the average indoor
level of 1.3 pCi/L in the U.S. as reported by EPA.
4.1.7 POTW Radiological Environmental Impacts
Seven sediment-impacted soil samples were collected at the effluent discharge points of three of
the POTW-I’s. Radium-226 activity concentrations above typical soil background activity
concentrations were identified in all sediment samples, with 156 pCi/g the maximum reported
result.
The presence of Ra in sediment-impacted soil at effluent discharge points indicates effluent
wastewater contained Ra. Radium and gross and radioactivity were identified in effluent
samples. Table 4-21 presents filtered and unfiltered effluent average sample results and
sediment-impacted soil results for POTWs sampled during the study.
4.2 Centralized Wastewater Treatment Plants
Three survey rounds were conducted at nine of the 10 CWTs. The 10th facility was added after
the first survey round was completed, resulting in only two surveys at that facility.
4.2.1 Survey Results
Radiological surveys were conducted at each CWT resulting in four data sets:
Removable / surface radioactivity measurements recorded in units of dpm/100 cm2
Total / surface radioactivity measurements recorded in units of dpm/100 cm2
Gross Gamma Radiation Scan measurements recorded in units of cpm
Gamma Radiation Exposure Rate measurements recorded in units of µR/hr
4.2.1.1 Removable Alpha/Beta Surface Radioactivity Measurement Results
Measurements of removable radioactivity were performed to evaluate potential internal radiation
exposures of workers through ingestion and/or inhalation. The results were evaluated using the
RG 1.86 surface radioactivity guidelines, Table 1. RG 1.86 requires that and surface
radioactivity levels be evaluated separately. The primary emitter of concern is Ra-226, with a
removable surface radioactivity criterion of 20 dpm /100 cm2. The primary emitter of
concern is Ra-228 of the natural Th decay series with a removable surface radioactivity criterion
of 200 dpm /100 cm2.
The average removable and surface radioactivity levels were all below the RG 1.86 criteria.
The maximum removable and surface radioactivity levels were 38.1 dpm/100 cm2 and 133
dpm/100 cm2. The summary results of removable and surface radioactivity are presented in
Table 4-23. Individual removable and surface radioactivity measurement results are
presented in Appendix D.
PA DEP TENORM Study Report – Section 4.0 Rev. 0
January 2015 4-6
4.2.1.2 Total Alpha/Beta Surface Radioactivity Measurement Results
Measurements of total and surface radioactivity were performed to evaluate potential
internal radiation exposures of workers through ingestion and/or inhalation. The results were
evaluated using the RG 1.86 surface radioactivity guidelines, Table 1. RG 1.86 requires that
and surface radioactivity levels be evaluated separately. The primary emitter of concern is
Ra-226, with a total surface radioactivity criterion of 100 dpm /100 cm2. The primary emitter
of concern is Ra-228 of the natural Th decay series with a total surface radioactivity criterion of
1,000 dpm /100 cm2.
Eighteen of the 31 average total surface radioactivity measurements were below the RG 1.86
surface radioactivity criterion. Three of the 31 average total surface radioactivity
measurements were below the RG 1.86 surface radioactivity criterion. The maximum total
and surface radioactivity levels were 3,220 dpm/100 cm2 and 50,400 dpm/100 cm
2. The
summary results of total and surface radioactivity measurements are presented in
Table 4-24. Individual total and surface radioactivity measurement results are presented in
Appendix D.
4.2.1.3 Gross Gamma Radiation Scan Results
Gross gamma radiation scans recorded in cpm were performed on open land areas and accessible
areas of the CWT facilities to identify any areas with levels above local background. The
summary results of the gross gamma radiation scans for each plant are presented in Table 4-25.
The highest average count rate for the plants was 19,281 cpm, and the maximum count rate
recorded was 401,688 cpm. A graphic display of the gamma radiation scan results at each
facility was prepared using GIS software. The resulting figures are in Appendix E.
4.2.1.4 Gamma Radiation Exposure Rate Results Summary
Gross gamma radiation scan results in units of cpm presented in Table 4-25 were converted to
R/hr by dividing by 800 cpm per R/hr, a conversion factor appropriate for Ra-226 gamma
energy as detected with 2-inch by 2-inch NaI detectors rounded to one significant figure
(Table 6.4, NaI Scintillation Detector Scan MDCs for Common Radiological Contaminants,
NUREG-1507, Minimum Detectable Concentrations With Typical Radiation Survey Instruments
for Various Contaminants and Field Conditions, USNRC June 1998). Table 4-26 presents
statistical results for each CWT facility. The highest average gamma radiation exposure rate was
24.1 R/hr, and the maximum gamma radiation exposure rate measured was 502 R/hr.
4.2.2 Solid Sample Results
4.2.2.1 Filter Cake Samples
Three survey rounds were conducted at nine of the 10 CWTs. The 10th facility was added after
the first survey round was completed, resulting in only two surveys at that facility. Also, the
10th facility is a primary treatment facility, so it does not produce a filter cake. A total of 25
filter cake samples were collected from the nine plants. The results are presented in Table 4-27.
The analytical results indicate all the CWT filter cake samples contain elevated Ra-226 and
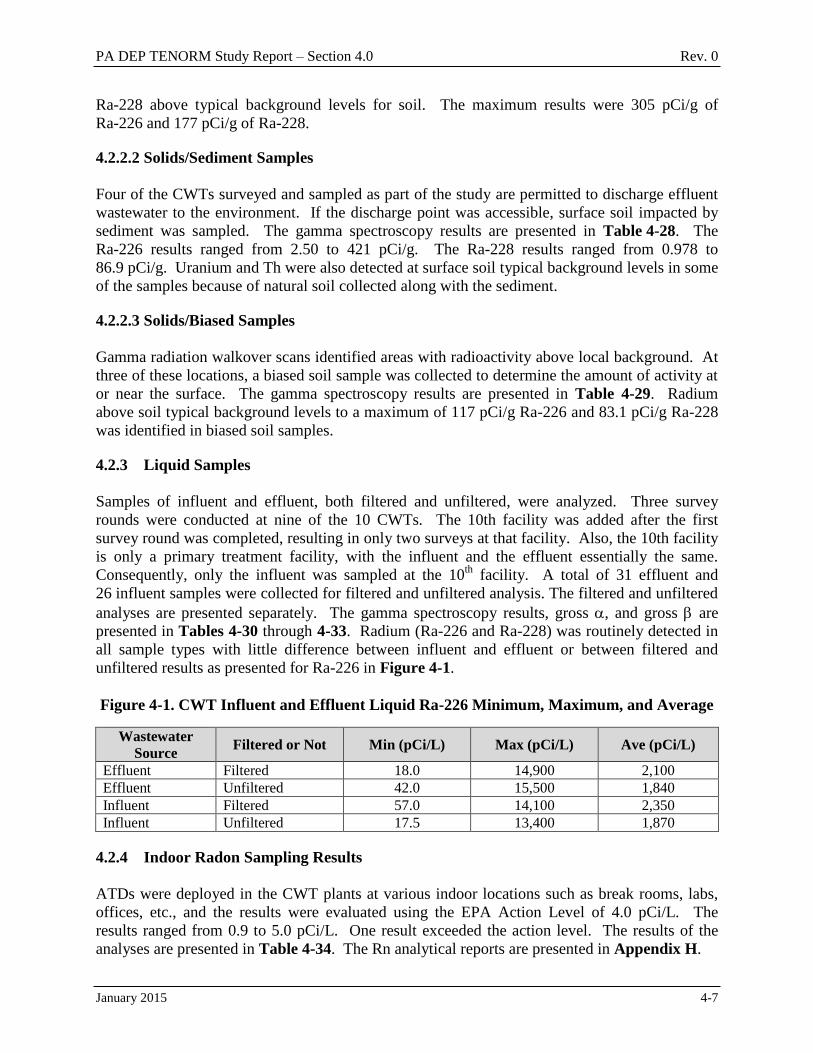
PA DEP TENORM Study Report – Section 4.0 Rev. 0
January 2015 4-7
Ra-228 above typical background levels for soil. The maximum results were 305 pCi/g of
Ra-226 and 177 pCi/g of Ra-228.
4.2.2.2 Solids/Sediment Samples
Four of the CWTs surveyed and sampled as part of the study are permitted to discharge effluent
wastewater to the environment. If the discharge point was accessible, surface soil impacted by
sediment was sampled. The gamma spectroscopy results are presented in Table 4-28. The
Ra-226 results ranged from 2.50 to 421 pCi/g. The Ra-228 results ranged from 0.978 to
86.9 pCi/g. Uranium and Th were also detected at surface soil typical background levels in some
of the samples because of natural soil collected along with the sediment.
4.2.2.3 Solids/Biased Samples
Gamma radiation walkover scans identified areas with radioactivity above local background. At
three of these locations, a biased soil sample was collected to determine the amount of activity at
or near the surface. The gamma spectroscopy results are presented in Table 4-29. Radium
above soil typical background levels to a maximum of 117 pCi/g Ra-226 and 83.1 pCi/g Ra-228
was identified in biased soil samples.
4.2.3 Liquid Samples
Samples of influent and effluent, both filtered and unfiltered, were analyzed. Three survey
rounds were conducted at nine of the 10 CWTs. The 10th facility was added after the first
survey round was completed, resulting in only two surveys at that facility. Also, the 10th facility
is only a primary treatment facility, with the influent and the effluent essentially the same.
Consequently, only the influent was sampled at the 10th
facility. A total of 31 effluent and
26 influent samples were collected for filtered and unfiltered analysis. The filtered and unfiltered
analyses are presented separately. The gamma spectroscopy results, gross , and gross are
presented in Tables 4-30 through 4-33. Radium (Ra-226 and Ra-228) was routinely detected in
all sample types with little difference between influent and effluent or between filtered and
unfiltered results as presented for Ra-226 in Figure 4-1.
Figure 4-1. CWT Influent and Effluent Liquid Ra-226 Minimum, Maximum, and Average
Wastewater
Source Filtered or Not Min (pCi/L) Max (pCi/L) Ave (pCi/L)
Effluent Filtered 18.0 14,900 2,100 Effluent Unfiltered 42.0 15,500 1,840 Influent Filtered 57.0 14,100 2,350 Influent Unfiltered 17.5 13,400 1,870
4.2.4 Indoor Radon Sampling Results
ATDs were deployed in the CWT plants at various indoor locations such as break rooms, labs,
offices, etc., and the results were evaluated using the EPA Action Level of 4.0 pCi/L. The
results ranged from 0.9 to 5.0 pCi/L. One result exceeded the action level. The results of the
analyses are presented in Table 4-34. The Rn analytical reports are presented in Appendix H.
PA DEP TENORM Study Report – Section 4.0 Rev. 0
January 2015 4-8
4.2.5 Filtered Versus Unfiltered Sample Data Evaluation
Appendix I presents a complete evaluation of filtered versus unfiltered liquid samples for the
entire study. The conclusion from this evaluation is that there is no apparent trend or bias that
filtering produces. There were some subsets of data where either the unfiltered results or the
filtered results appear to be significantly higher. There was no statistically significant correlation
found within any sample group. Because the liquid samples were preserved by addition of acid
prior to filtering, the radioactive particulates may have entered solution and were therefore not
removed by filtering.
4.2.6 CWT Exposure Assessment
4.2.6.1 CWT External Radiation Exposure
The maximum average gamma radiation exposure rate measured at any of the CWT plants was
24.1 R/hr. The lowest background gamma radiation exposure rate measured at any of the sites
was 5 R/hr. Assuming the time period of exposure is a full occupational year of 2,000 hours,
the maximum average CWT annual external gamma radiation exposure was estimated as
follows:
Maximum Average CWT External Gamma Radiation Exposure Estimate
(24.1 – 5) µR/hr x 2,000 hr/yr x (1 mrem/1,000 µR gamma) = 38 mrem/yr
This is an estimate of the maximum average gamma radiation exposure based on 2,000 hours in
one year. The result is less than the 100 mrem/yr dose equivalent limit for a member of the
public. Actual exposure is dependent upon the actual exposure rates and occupancy time for
individual workers.
The maximum gamma radiation exposure rate measured was 502 rem/hr on contact with the
outside of a wastewater tank. Work in proximity of the tank could potentially result in an
exposure of 100 mrem in 200 hours of annual exposure or 10 percent of an employee’s
2,000-hour occupational year. Actual annual exposure for a CWT worker is dependent upon
actual exposure rates and actual time worked in the proximity of the tank.
4.2.6.2 CWT Potential Internal Alpha/Beta Radioactivity Exposure
The total and removable / surface radioactivity survey results are discussed in Sections 4.2.1.1
and 4.2.1.2. One hundred eighty-six of the 777 measurements and 461 of the 777
measurements of total surface radioactivity exceeded the RG 1.86 criteria. Seven of the 805
removable measurements and 6 of the 805 removable measurements exceeded the RG 1.86
criteria. The average of the total surface radioactivity measurements exceeded the RG 1.86
criteria in 10 of the 11 CWT facilities surveyed. The average of the total surface radioactivity
measurements exceeded the RG 1.86 criteria in four of the 11 CWT facilities surveyed. The
corresponding removable radioactivity measurements are mostly less than the RG 1.86 criteria,
indicating the total radioactive contamination measured is fixed to the surface and not
immediately available for inhalation or ingestion. Fixed and surface radioactivity may
present a potential inhalation or ingestion hazard if disturbed during routine system maintenance.
PA DEP TENORM Study Report – Section 4.0 Rev. 0
January 2015 4-9
4.2.6.3 Internal Radon Exposure
The Rn in ambient indoor area air averaged 2.0 pCi/L. The average is above the average typical
background indoor level of 1.3 pCi/L in the U.S. as reported by EPA.
4.2.7 CWT Radiological Environmental Impacts
Sediment-impacted soil was collected at the accessible effluent discharge points at the CWTs. A
total of nine samples were collected. Radium above typical soil background levels to a
maximum of 508 pCi/g of total Ra was identified in the sediment-impacted soil samples.
Effluent wastewater also contained Ra and is the likely source of the Ra in sediment-impacted
soil above soil typical background levels.
4.3 Zero Liquid Discharge Plants
4.3.1 Survey Results
Radiological surveys were conducted at each ZLD facility resulting in four data sets:
Removable / surface radioactivity measurements recorded in units of dpm/100 cm2
Total / surface radioactivity measurements recorded in units of dpm/100 cm2
Gross Gamma Radiation Scan measurements recorded in units of cpm
Gamma Radiation Exposure Rate measurements recorded in units of µR/hr
4.3.1.1 Removable Alpha/Beta Surface Radioactivity Measurement Results
Measurements of removable surface radioactivity were performed to evaluate potential internal
radiation exposures of workers through ingestion and/or inhalation. The results were evaluated
using the RG 1.86 guidelines, Table 1. RG 1.86 requires that and surface radioactivity levels
be evaluated separately. The primary emitter of concern is Ra-226, with a removable surface
radioactivity criterion of 20 dpm /100 cm2. The primary emitter of concern is Ra-228 of the
natural Th decay series with a removable surface radioactivity criterion of 200 dpm /100 cm2.
The average removable and surface radioactivity levels were below the RG 1.86 criteria.
The maximum removable and surface radioactivity levels were 294 dpm/100 cm2 and
342 dpm/100 cm2. The summary results of removable and surface radioactivity are
presented in Table 4-35. Individual removable and surface radioactivity measurement
results are presented in Appendix D.
4.3.1.2 Total Alpha/Beta Surface Radioactivity Measurement Results
Measurements of total and surface radioactivity were performed to evaluate potential
internal radiation exposures of workers through ingestion and/or inhalation. The results were
evaluated using the RG 1.86 guidelines, Table 1. RG 1.86 requires that and surface
radioactivity levels be evaluated separately. The primary emitter of concern is Ra-226, with a
total surface radioactivity criterion of 100 dpm /100 cm2. The primary emitter of concern is
Ra-228 of the natural Th decay series with a total surface radioactivity criterion of 1,000 dpm
/100 cm2. The highest average total and surface radioactivity levels were 239 dpm/100 cm
2
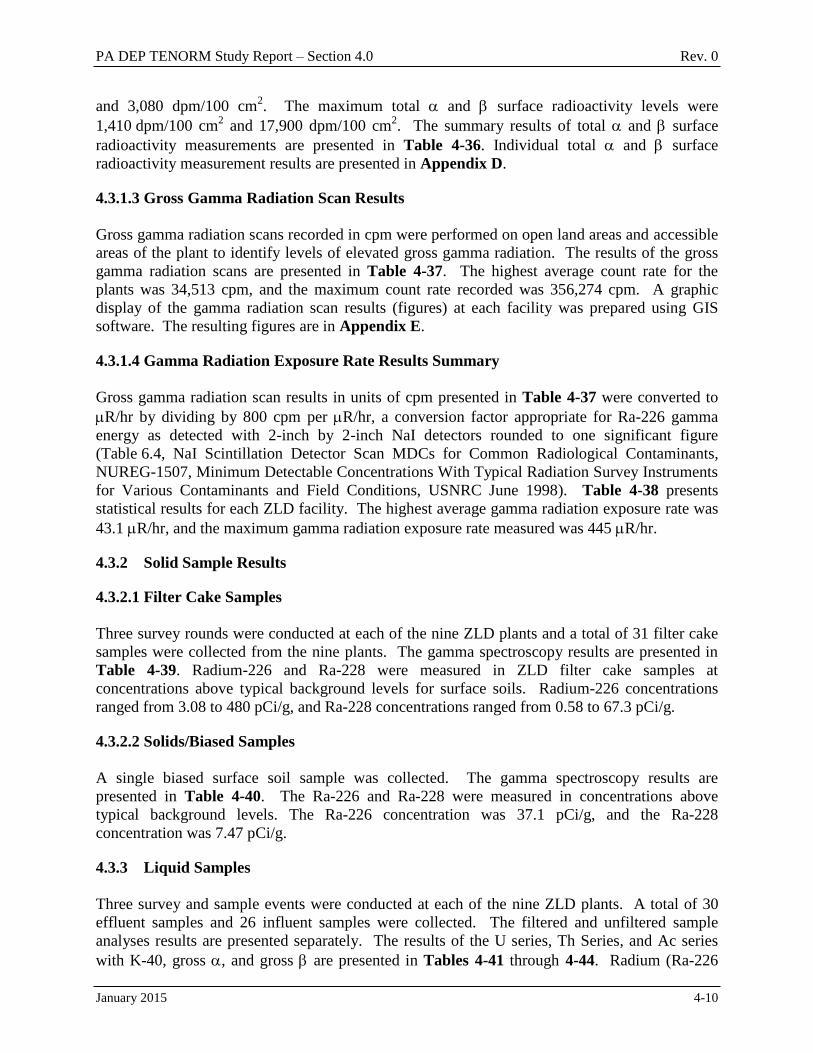
PA DEP TENORM Study Report – Section 4.0 Rev. 0
January 2015 4-10
and 3,080 dpm/100 cm2. The maximum total and surface radioactivity levels were
1,410 dpm/100 cm2 and 17,900 dpm/100 cm
2. The summary results of total and surface
radioactivity measurements are presented in Table 4-36. Individual total and surface
radioactivity measurement results are presented in Appendix D.
4.3.1.3 Gross Gamma Radiation Scan Results
Gross gamma radiation scans recorded in cpm were performed on open land areas and accessible
areas of the plant to identify levels of elevated gross gamma radiation. The results of the gross
gamma radiation scans are presented in Table 4-37. The highest average count rate for the
plants was 34,513 cpm, and the maximum count rate recorded was 356,274 cpm. A graphic
display of the gamma radiation scan results (figures) at each facility was prepared using GIS
software. The resulting figures are in Appendix E.
4.3.1.4 Gamma Radiation Exposure Rate Results Summary
Gross gamma radiation scan results in units of cpm presented in Table 4-37 were converted to
R/hr by dividing by 800 cpm per R/hr, a conversion factor appropriate for Ra-226 gamma
energy as detected with 2-inch by 2-inch NaI detectors rounded to one significant figure
(Table 6.4, NaI Scintillation Detector Scan MDCs for Common Radiological Contaminants,
NUREG-1507, Minimum Detectable Concentrations With Typical Radiation Survey Instruments
for Various Contaminants and Field Conditions, USNRC June 1998). Table 4-38 presents
statistical results for each ZLD facility. The highest average gamma radiation exposure rate was
43.1 R/hr, and the maximum gamma radiation exposure rate measured was 445 R/hr.
4.3.2 Solid Sample Results
4.3.2.1 Filter Cake Samples
Three survey rounds were conducted at each of the nine ZLD plants and a total of 31 filter cake
samples were collected from the nine plants. The gamma spectroscopy results are presented in
Table 4-39. Radium-226 and Ra-228 were measured in ZLD filter cake samples at
concentrations above typical background levels for surface soils. Radium-226 concentrations
ranged from 3.08 to 480 pCi/g, and Ra-228 concentrations ranged from 0.58 to 67.3 pCi/g.
4.3.2.2 Solids/Biased Samples
A single biased surface soil sample was collected. The gamma spectroscopy results are
presented in Table 4-40. The Ra-226 and Ra-228 were measured in concentrations above
typical background levels. The Ra-226 concentration was 37.1 pCi/g, and the Ra-228
concentration was 7.47 pCi/g.
4.3.3 Liquid Samples
Three survey and sample events were conducted at each of the nine ZLD plants. A total of 30
effluent samples and 26 influent samples were collected. The filtered and unfiltered sample
analyses results are presented separately. The results of the U series, Th Series, and Ac series
with K-40, gross , and gross are presented in Tables 4-41 through 4-44. Radium (Ra-226
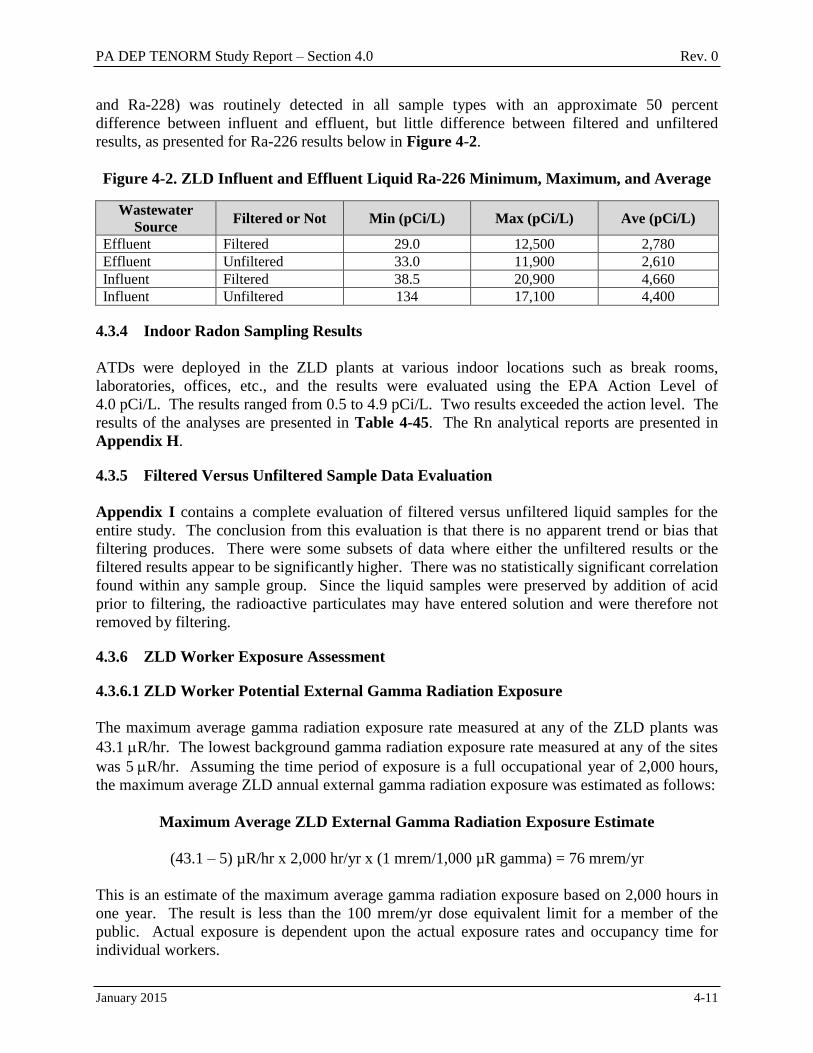
PA DEP TENORM Study Report – Section 4.0 Rev. 0
January 2015 4-11
and Ra-228) was routinely detected in all sample types with an approximate 50 percent
difference between influent and effluent, but little difference between filtered and unfiltered
results, as presented for Ra-226 results below in Figure 4-2.
Figure 4-2. ZLD Influent and Effluent Liquid Ra-226 Minimum, Maximum, and Average
Wastewater
Source Filtered or Not Min (pCi/L) Max (pCi/L) Ave (pCi/L)
Effluent Filtered 29.0 12,500 2,780 Effluent Unfiltered 33.0 11,900 2,610 Influent Filtered 38.5 20,900 4,660 Influent Unfiltered 134 17,100 4,400
4.3.4 Indoor Radon Sampling Results
ATDs were deployed in the ZLD plants at various indoor locations such as break rooms,
laboratories, offices, etc., and the results were evaluated using the EPA Action Level of
4.0 pCi/L. The results ranged from 0.5 to 4.9 pCi/L. Two results exceeded the action level. The
results of the analyses are presented in Table 4-45. The Rn analytical reports are presented in
Appendix H.
4.3.5 Filtered Versus Unfiltered Sample Data Evaluation
Appendix I contains a complete evaluation of filtered versus unfiltered liquid samples for the
entire study. The conclusion from this evaluation is that there is no apparent trend or bias that
filtering produces. There were some subsets of data where either the unfiltered results or the
filtered results appear to be significantly higher. There was no statistically significant correlation
found within any sample group. Since the liquid samples were preserved by addition of acid
prior to filtering, the radioactive particulates may have entered solution and were therefore not
removed by filtering.
4.3.6 ZLD Worker Exposure Assessment
4.3.6.1 ZLD Worker Potential External Gamma Radiation Exposure
The maximum average gamma radiation exposure rate measured at any of the ZLD plants was
43.1 R/hr. The lowest background gamma radiation exposure rate measured at any of the sites
was 5 R/hr. Assuming the time period of exposure is a full occupational year of 2,000 hours,
the maximum average ZLD annual external gamma radiation exposure was estimated as follows:
Maximum Average ZLD External Gamma Radiation Exposure Estimate
(43.1 – 5) µR/hr x 2,000 hr/yr x (1 mrem/1,000 µR gamma) = 76 mrem/yr
This is an estimate of the maximum average gamma radiation exposure based on 2,000 hours in
one year. The result is less than the 100 mrem/yr dose equivalent limit for a member of the
public. Actual exposure is dependent upon the actual exposure rates and occupancy time for
individual workers.

PA DEP TENORM Study Report – Section 4.0 Rev. 0
January 2015 4-12
The maximum gamma radiation exposure rate measured was 445 rem/hr on contact with the
outside of a wastewater tank. Work performed in the immediate proximity to the tank could
potentially result in an exposure of 100 mrem in 225 hours of annual exposure, or about
10 percent of an employee’s 2,000-hour occupational year. Actual annual exposure for a ZLD
worker is dependent upon actual exposure rates and actual time worked in the proximity of the
tank.
4.3.6.2 ZLD Worker Potential Internal Alpha/Beta Exposure
The total and removable / survey surface radioactivity results are discussed in Sections 4.3.1.1
and 4.3.1.2. One hundred fifty-nine of the 566 measurements and 175 of the 566
measurements of total surface radioactivity exceeded the RG 1.86 criteria. Fourteen of the 589
removable measurements and two of the 589 removable measurements exceeded the RG
1.86 criteria. The highest average total and surface radioactivity levels were 239 dpm/100
cm2 and 4,740 dpm/100 cm
2. The maximum total and surface radioactivity levels were
1,410 dpm/100 cm2 and 49,700 dpm/100 cm
2. The corresponding removable surface
radioactivity measurements are mostly less than the RG 1.86 criteria, indicating the total surface
radioactivity measured is fixed to the surface and not immediately available for inhalation or
ingestion. Fixed and surface radioactivity may present a potential inhalation or ingestion
hazard if disturbed during routine system maintenance.
4.3.6.3 ZLD Worker Potential Internal Radon Exposure
The Rn in ambient indoor area air averaged 2.3 pCi/L. The average is above the average typical
background indoor level of 1.3 pCi/L in the U.S. as reported by EPA.
4.3.6.4 Gamma Radiation Exposure during Transport of Wastewater and Wastewater
Sludge
Gamma radiation exposure was estimated for the transport of wastewater from well sites to
WWTPs, and sludge from WWTPs to landfills. This was done for the driver of the transport
truck. The truck driver spends the most time near the TENORM-influenced wastewater during
transport.
It was assumed a truck driver hauled full containers with either wastewater or sludge/filter cake
for four hours per day and made return trips with empty containers for four hours per day. The
driver was assumed to work 40 hours per week for 10 weeks per year hauling O&G wastewater
or sludge. Therefore, the total exposure time was assumed to be 200 hours per year as calculated
below:
Estimated Duration of Gamma Radiation Exposure for Truck Driver per Year
4 hr/day x 5 days/wk x 10 wks/yr = 200 hrs/yr
Radiation exposure rates to the driver were not measured; they were modeled using the computer
program MicroShield®. The MicroShield
® output files are presented in Appendix J. Two
external exposure scenarios were evaluated:
PA DEP TENORM Study Report – Section 4.0 Rev. 0
January 2015 4-13
1. Exposure rate to a driver hauling wastewater based on the maximum measured
concentrations of Ra-226 and Ra-228 in wastewater.
2. Exposure rate to a driver hauling sludge or filter cake based on the maximum measured
concentrations of Ra-226 and Ra-228 in sludge.
The input and output of MicroShield® based on the two scenarios are summarized in Figure 4-3.
Figure 4-3. MicroShield® External Exposure Scenarios Input/Output
Parameter
Scenario
Wastewater Truck Maximum
Measured Concentration,
Scenario 1
Sludge/Filter Cake Roll-off Maximum Measured
Concentration, Scenario 2
Volume 3,800 gallons 20 cubic yards
Shielding Material Stainless steel, 0.5 cm thick Iron, 0.3 cm thick
Ra-226 and Progeny Input
Concentration
18,400 pCi/L 480 pCi/g
Ra-228 and Progeny Input
Concentration
1,440 pCi/L 183 pCi/g
Resulting Driver Exposure
Rate (µrem/hr)
14.7
1,340
Exposure Rate per Radium
Concentration
0.000741 rem/hr / pCi/L of total
Ra 2.02 rem/hr / pCi/g of total Ra
Maximum Wastewater Truck Driver External Gamma Radiation Exposure Estimate
0.000741 µrem/hr / pCi/L x 2,380 pCi/L x 200 hr/yr x (1 mrem/1,000 µrem gamma) =
0.35 mrem/yr
This is an estimate of the maximum annual gamma radiation exposure based on the maximum
total Ra activity concentration of influent wastewater measured and 200 hours exposure in one
year. The result is less than the 100 mrem/yr dose equivalent limit for a member of the public.
Actual exposure is dependent upon the actual exposure rates and occupancy time for individual
workers.
Maximum Sludge Truck Driver External Gamma Radiation Exposure Estimate
2.02 µrem/hr / pCi/g x 129 pCi/g x 200 hr/yr x (1 mrem/1,000 µrem gamma) = 52 mrem/yr
This is an estimate of the maximum annual gamma radiation exposure based on the maximum
total Ra activity concentration in sludge measured and 200 hours of exposure in one year. The
result is less than the 100 mrem/yr dose equivalent limit for a member of the public. Actual
exposure is dependent upon the actual exposure rates and occupancy time for individual workers.
The sludge truck driver assessment is conservative due to the following: solid samples were
dried prior to gamma spectroscopy analysis, artificially increasing the activity concentration
results in direct proportion to the moisture content of the sample, i.e., after removal of the weight
of the wastewater within the sludge sample. In addition, the MicroShield® activity input includes
PA DEP TENORM Study Report – Section 4.0 Rev. 0
January 2015 4-14
all of the Ra progeny in secular equilibrium. Often the sludge is “fresh,” i.e., progeny ingrowth
has not progressed to secular equilibrium and the progeny activity is only a fraction of the Ra
activity.
4.3.7 Alpha Spectroscopy Analysis of Filter Cake
Elevated Ra-226 and Ra-228 and progeny activity were detected in CWT and ZLD filter cake
samples analyzed by gamma spectroscopy. Due to the low solubility in water of U and Th,
relative to Ra, U and Th were not present in wastewater and resulting filter cake at the elevated
levels observed for Ra. Because gamma spectroscopy analysis of solid and liquid samples is
limited in regards to the quantification of U and Th isotopes (Section 2.3), spectroscopy
analysis to measure U (U-238, U-234, and U-235) and Th (Th-232, Th-230, and Th-228), isotope
activity levels was performed on 10 filter cake samples. The results are presented in Table 4-46.
The U-238, U-234, and Th-230, all members of the natural U decay series above Ra-226, were
measured at approximately 1/3 of typical background activity in soil. Uranium-235 is only
identified once > MDC. Th-232, a member of the natural Th decay series above Ra-228, was
measured at approximately ¼ of typical background activity in soil. Only Th-228, a progeny of
Ra-228, was measured at activity concentrations comparable to Ra-228 identified by gamma
spectroscopy. The spectroscopy results confirm the low solubility of U and Th, resulting in
low activity levels in wastewater and sludge/filter cake.
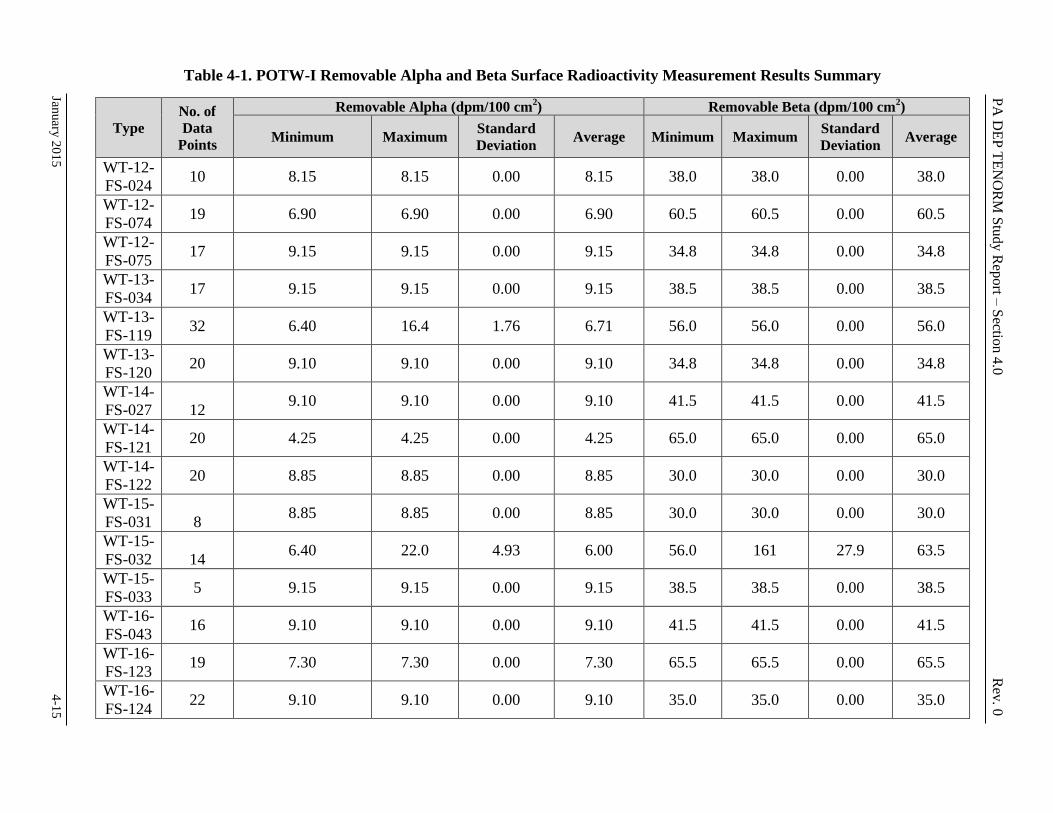
PA
DE
P T
EN
OR
M S
tudy R
eport –
Sectio
n 4
.0
Rev
. 0
January
20
15
4
-15
Table 4-1. POTW-I Removable Alpha and Beta Surface Radioactivity Measurement Results Summary
Type
No. of
Data
Points
Removable Alpha (dpm/100 cm2) Removable Beta (dpm/100 cm
2)
Minimum Maximum Standard
Deviation Average Minimum Maximum
Standard
Deviation Average
WT-12-
FS-024 10 8.15 8.15 0.00 8.15 38.0 38.0 0.00 38.0
WT-12-
FS-074 19 6.90 6.90 0.00 6.90 60.5 60.5 0.00 60.5
WT-12-
FS-075 17 9.15 9.15 0.00 9.15 34.8 34.8 0.00 34.8
WT-13-
FS-034 17 9.15 9.15 0.00 9.15 38.5 38.5 0.00 38.5
WT-13-
FS-119 32 6.40 16.4 1.76 6.71 56.0 56.0 0.00 56.0
WT-13-
FS-120 20 9.10 9.10 0.00 9.10 34.8 34.8 0.00 34.8
WT-14-
FS-027 12 9.10 9.10 0.00 9.10 41.5 41.5 0.00 41.5
WT-14-
FS-121 20 4.25 4.25 0.00 4.25 65.0 65.0 0.00 65.0
WT-14-
FS-122 20 8.85 8.85 0.00 8.85 30.0 30.0 0.00 30.0
WT-15-
FS-031 8 8.85 8.85 0.00 8.85 30.0 30.0 0.00 30.0
WT-15-
FS-032 14 6.40 22.0 4.93 6.00 56.0 161 27.9 63.5
WT-15-
FS-033 5 9.15 9.15 0.00 9.15 38.5 38.5 0.00 38.5
WT-16-
FS-043 16 9.10 9.10 0.00 9.10 41.5 41.5 0.00 41.5
WT-16-
FS-123 19 7.30 7.30 0.00 7.30 65.5 65.5 0.00 65.5
WT-16-
FS-124 22 9.10 9.10 0.00 9.10 35.0 35.0 0.00 35.0
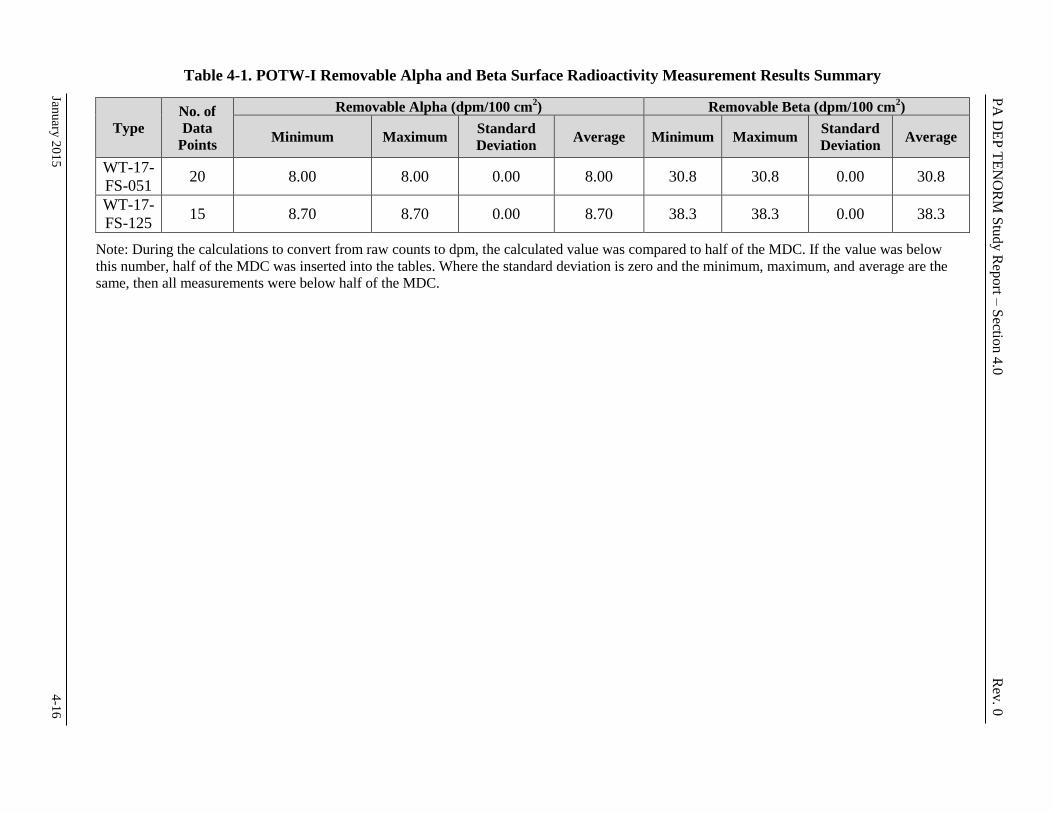
PA
DE
P T
EN
OR
M S
tudy R
eport –
Sectio
n 4
.0
Rev
. 0
January
20
15
4
-16
Table 4-1. POTW-I Removable Alpha and Beta Surface Radioactivity Measurement Results Summary
Type
No. of
Data
Points
Removable Alpha (dpm/100 cm2) Removable Beta (dpm/100 cm
2)
Minimum Maximum Standard
Deviation Average Minimum Maximum
Standard
Deviation Average
WT-17-
FS-051 20 8.00 8.00 0.00 8.00 30.8 30.8 0.00 30.8
WT-17-
FS-125 15 8.70 8.70 0.00 8.70 38.3 38.3 0.00 38.3
Note: During the calculations to convert from raw counts to dpm, the calculated value was compared to half of the MDC. If the value was below
this number, half of the MDC was inserted into the tables. Where the standard deviation is zero and the minimum, maximum, and average are the
same, then all measurements were below half of the MDC.
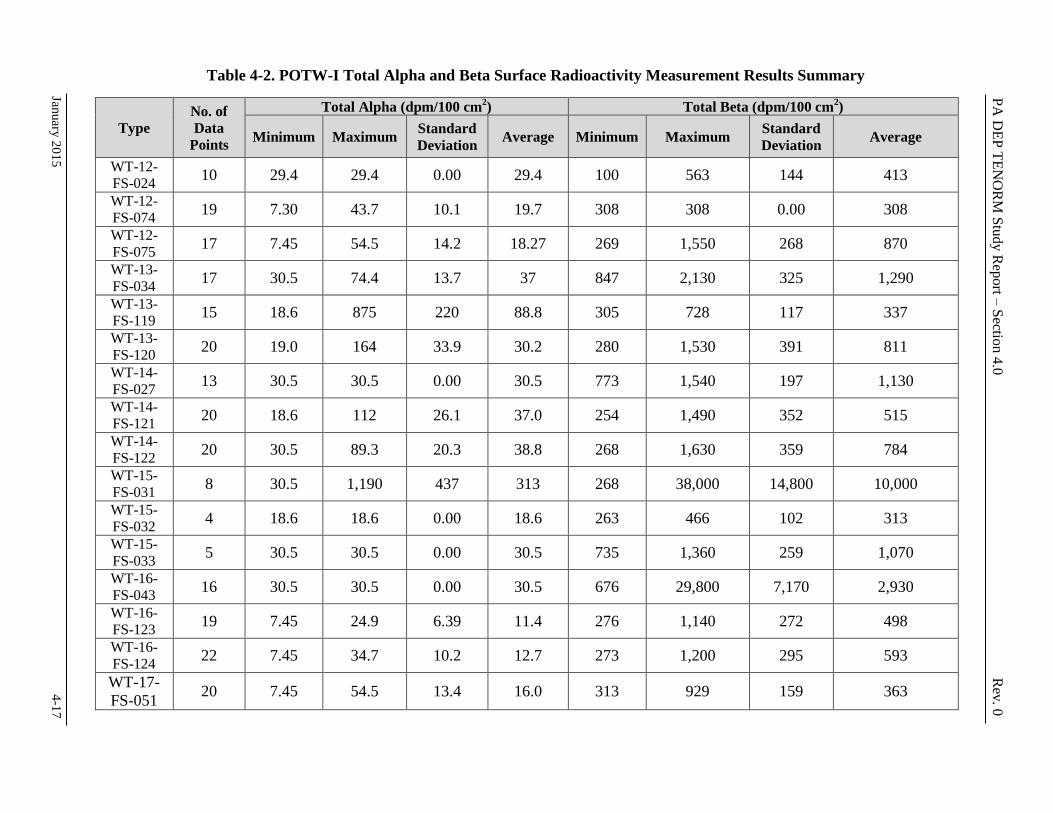
PA
DE
P T
EN
OR
M S
tudy R
eport –
Sectio
n 4
.0
Rev
. 0
January
20
15
4
-17
Table 4-2. POTW-I Total Alpha and Beta Surface Radioactivity Measurement Results Summary
Type
No. of
Data
Points
Total Alpha (dpm/100 cm2) Total Beta (dpm/100 cm
2)
Minimum Maximum Standard
Deviation Average Minimum Maximum
Standard
Deviation Average
WT-12-
FS-024 10 29.4 29.4 0.00 29.4 100 563 144 413
WT-12-
FS-074 19 7.30 43.7 10.1 19.7 308 308 0.00 308
WT-12-
FS-075 17 7.45 54.5 14.2 18.27 269 1,550 268 870
WT-13-
FS-034 17 30.5 74.4 13.7 37 847 2,130 325 1,290
WT-13-
FS-119 15 18.6 875 220 88.8 305 728 117 337
WT-13-
FS-120 20 19.0 164 33.9 30.2 280 1,530 391 811
WT-14-
FS-027 13 30.5 30.5 0.00 30.5 773 1,540 197 1,130
WT-14-
FS-121 20 18.6 112 26.1 37.0 254 1,490 352 515
WT-14-
FS-122 20 30.5 89.3 20.3 38.8 268 1,630 359 784
WT-15-
FS-031 8 30.5 1,190 437 313 268 38,000 14,800 10,000
WT-15-
FS-032 4 18.6 18.6 0.00 18.6 263 466 102 313
WT-15-
FS-033 5 30.5 30.5 0.00 30.5 735 1,360 259 1,070
WT-16-
FS-043 16 30.5 30.5 0.00 30.5 676 29,800 7,170 2,930
WT-16-
FS-123 19 7.45 24.9 6.39 11.4 276 1,140 272 498
WT-16-
FS-124 22 7.45 34.7 10.2 12.7 273 1,200 295 593
WT-17-
FS-051 20 7.45 54.5 13.4 16.0 313 929 159 363
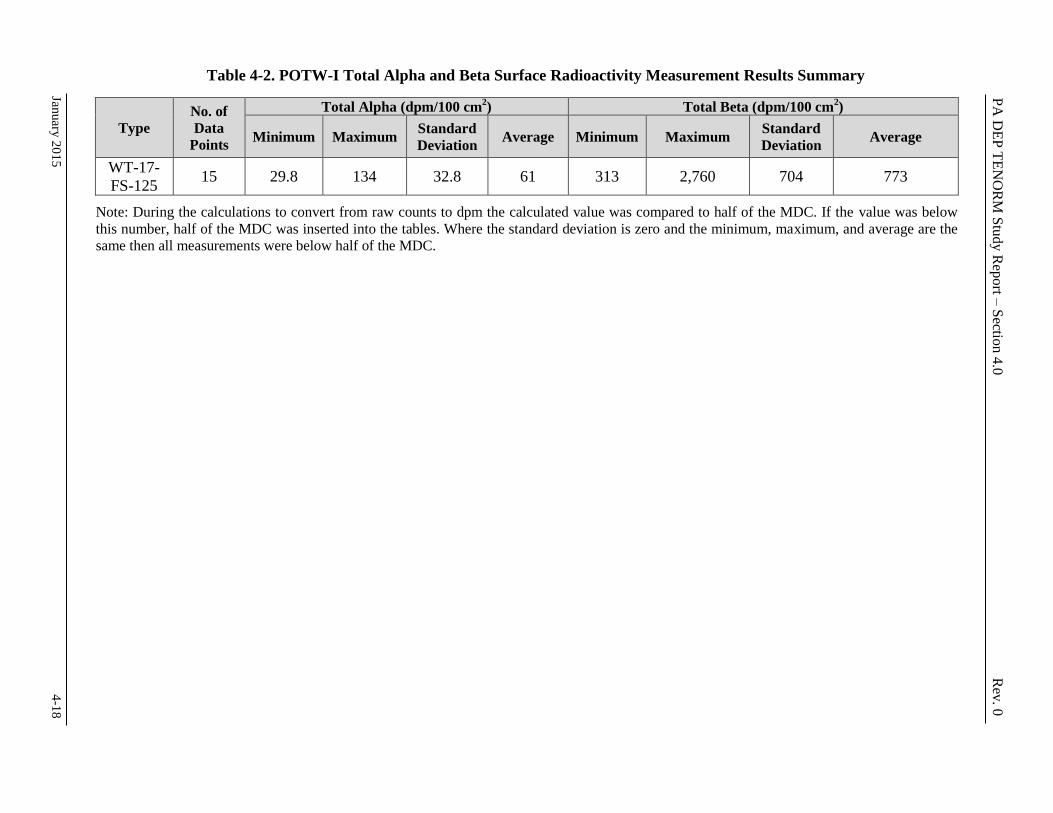
PA
DE
P T
EN
OR
M S
tudy R
eport –
Sectio
n 4
.0
Rev
. 0
January
20
15
4
-18
Table 4-2. POTW-I Total Alpha and Beta Surface Radioactivity Measurement Results Summary
Type
No. of
Data
Points
Total Alpha (dpm/100 cm2) Total Beta (dpm/100 cm
2)
Minimum Maximum Standard
Deviation Average Minimum Maximum
Standard
Deviation Average
WT-17-
FS-125 15 29.8 134 32.8 61 313 2,760 704 773
Note: During the calculations to convert from raw counts to dpm the calculated value was compared to half of the MDC. If the value was below
this number, half of the MDC was inserted into the tables. Where the standard deviation is zero and the minimum, maximum, and average are the
same then all measurements were below half of the MDC.
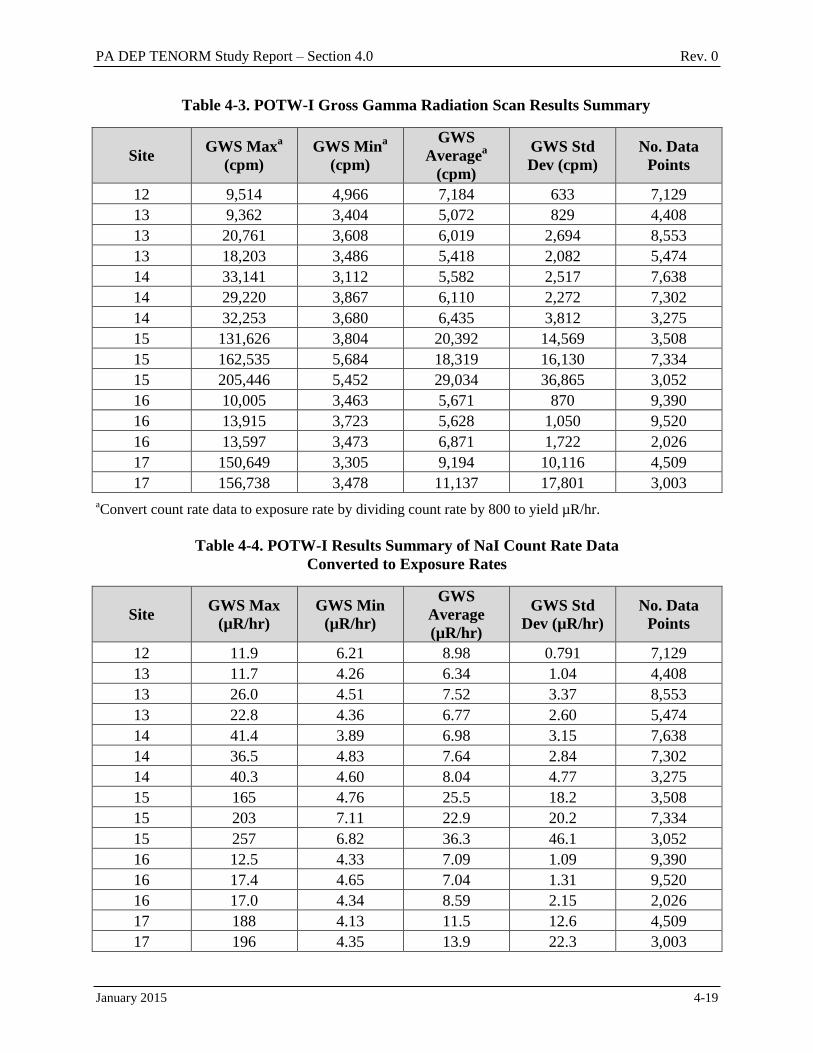
PA DEP TENORM Study Report – Section 4.0 Rev. 0
January 2015 4-19
Table 4-3. POTW-I Gross Gamma Radiation Scan Results Summary
Site GWS Max
a
(cpm)
GWS Mina
(cpm)
GWS
Averagea
(cpm)
GWS Std
Dev (cpm)
No. Data
Points
12 9,514 4,966 7,184 633 7,129
13 9,362 3,404 5,072 829 4,408
13 20,761 3,608 6,019 2,694 8,553
13 18,203 3,486 5,418 2,082 5,474
14 33,141 3,112 5,582 2,517 7,638
14 29,220 3,867 6,110 2,272 7,302
14 32,253 3,680 6,435 3,812 3,275
15 131,626 3,804 20,392 14,569 3,508
15 162,535 5,684 18,319 16,130 7,334
15 205,446 5,452 29,034 36,865 3,052
16 10,005 3,463 5,671 870 9,390
16 13,915 3,723 5,628 1,050 9,520
16 13,597 3,473 6,871 1,722 2,026
17 150,649 3,305 9,194 10,116 4,509
17 156,738 3,478 11,137 17,801 3,003
aConvert count rate data to exposure rate by dividing count rate by 800 to yield µR/hr.
Table 4-4. POTW-I Results Summary of NaI Count Rate Data
Converted to Exposure Rates
Site GWS Max
(µR/hr)
GWS Min
(µR/hr)
GWS
Average
(µR/hr)
GWS Std
Dev (µR/hr)
No. Data
Points
12 11.9 6.21 8.98 0.791 7,129
13 11.7 4.26 6.34 1.04 4,408
13 26.0 4.51 7.52 3.37 8,553
13 22.8 4.36 6.77 2.60 5,474
14 41.4 3.89 6.98 3.15 7,638
14 36.5 4.83 7.64 2.84 7,302
14 40.3 4.60 8.04 4.77 3,275
15 165 4.76 25.5 18.2 3,508
15 203 7.11 22.9 20.2 7,334
15 257 6.82 36.3 46.1 3,052
16 12.5 4.33 7.09 1.09 9,390
16 17.4 4.65 7.04 1.31 9,520
16 17.0 4.34 8.59 2.15 2,026
17 188 4.13 11.5 12.6 4,509
17 196 4.35 13.9 22.3 3,003
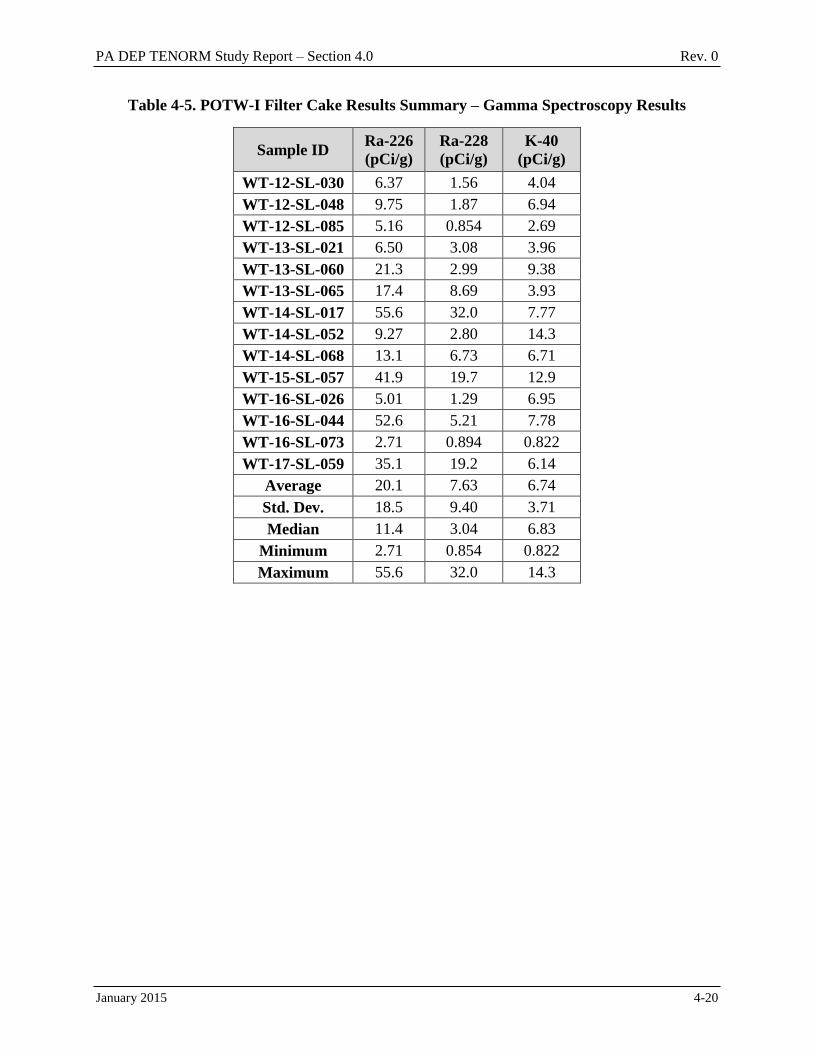
PA DEP TENORM Study Report – Section 4.0 Rev. 0
January 2015 4-20
Table 4-5. POTW-I Filter Cake Results Summary – Gamma Spectroscopy Results
Sample ID Ra-226
(pCi/g)
Ra-228
(pCi/g)
K-40
(pCi/g)
WT-12-SL-030 6.37 1.56 4.04
WT-12-SL-048 9.75 1.87 6.94
WT-12-SL-085 5.16 0.854 2.69
WT-13-SL-021 6.50 3.08 3.96
WT-13-SL-060 21.3 2.99 9.38
WT-13-SL-065 17.4 8.69 3.93
WT-14-SL-017 55.6 32.0 7.77
WT-14-SL-052 9.27 2.80 14.3
WT-14-SL-068 13.1 6.73 6.71
WT-15-SL-057 41.9 19.7 12.9
WT-16-SL-026 5.01 1.29 6.95
WT-16-SL-044 52.6 5.21 7.78
WT-16-SL-073 2.71 0.894 0.822
WT-17-SL-059 35.1 19.2 6.14
Average 20.1 7.63 6.74
Std. Dev. 18.5 9.40 3.71
Median 11.4 3.04 6.83
Minimum 2.71 0.854 0.822
Maximum 55.6 32.0 14.3

PA DEP TENORM Study Report – Section 4.0 Rev. 0
January 2015 4-21
Table 4-6. POTW-N Filter Cake Results Summary – Gamma Spectroscopy Results
Sample ID Ra-226
(pCi/g)
Ra-228
(pCi/g)
K-40
(pCi/g)
WT-26-SL-094 3.97 1.31 5.47
WT-26-SL-095 3.61 1.46 5.41
WT-27-SL-096 2.33 0.817 6.51
WT-27-SL-097 5.76 1.12 4.31
WT-28-SL-098 7.36 1.84 6.57
WT-28-SL-099 3.78 1.07 6.55
WT-29-SL-100 35.4 7.26 7.66
WT-29-SL-101 15.6 3.28 7.34
Average 8.89 2.13 6.07
Std. Dev. 11.8 2.29 1.09
Median 3.97 1.31 6.51
Minimum 2.33 0.817 4.31
Maximum 35.4 7.26 7.66
Table 4-7. POTW-I Sediment Sample Results Summary – Gamma Spectroscopy Results
Sample ID Ra-226
(pCi/g)
Ra-228
(pCi/g)
K-40
(pCi/g)
WT-14-SL-018 4.25 1.96 10.3
WT-14-SL-053 1.83 0.799 8.71
WT-14-SL-069 3.94 1.96 5.53
WT-15-SL-020 16.6 6.25 15.7
WT-15-SL-056 18.2 6.19 13.0
WT-15-SL-067 15.3 5.77 24.5
WT-17-SL-058 2.91 1.69 6.20
Average 9.00 3.52 12.0
Std. Dev. 7.29 2.42 6.58
Median 4.25 1.96 10.3
Minimum 1.83 0.799 5.53
Maximum 18.2 6.25 24.5

PA DEP TENORM Study Report – Section 4.0 Rev. 0
January 2015 4-22
Table 4-8. POTW-I Filtered Effluent Results Summary –
Gamma Spectroscopy and Miscellaneous Results
Sample ID Ra-226
(pCi/L)
Ra-228
(pCi/L)
K-40
(pCi/L)
Gross
Alpha
(pCi/L)
Gross
Beta
(pCi/L)
WT-12-LQ-098 < 118 < 18.0 < 66.0 < 196 < 392
WT-12-LQ-159 < 127 < 25.0 81.0 < 5.77 10.6
WT-12-LQ-295 77.0 < 13.0 42.0 195 365
WT-13-LQ-054 < 126 < 22.0 73.0 < 29.6 < 18.9
WT-13-LQ-193 < 79.0 < 16.0 46.0 < 114 < 198
WT-13-LQ-209 363 < 10.0 53.0 < 123 < 203
WT-14-LQ-044 < 130 < 24.0 56.0 < 25.8 < 163
WT-14-LQ-171 87.0 < 12.0 60.0 < 111 < 186
WT-14-LQ-215 104 < 13.0 71.0 < 118 < 202
WT-15-LQ-052 < 139 < 24.0 < 81.0 < 21.3 < 16.2
WT-15-LQ-185 < 139 < 25 < 98.0 < 5.67 8.70
WT-15-LQ-223 120 25.0 52.0 < 161 < 198
WT-16-LQ-079 101 < 8.00 34.0 < 2.26 5.77
WT-16-LQ-145 < 43.0 < 6.00 55.0 < 6.96 11.3
WT-16-LQ-241 335 < 9.00 < 32.0 4.64 10.7
WT-17-LQ-191 154 < 18.0 < 48.0 < 121 < 187
WT-17-LQ-217 116 12.0 < 33.0 < 127 < 203
Average 129 9.34 48.1 42.9 75.0
Std. Dev. 93.1 5.35 19.0 49.6 88.8
Median 101 8.50 50.5 35.12 87.3
Minimum 57.0 3.00 16.0 1.13 5.77
Maximum 363 25.0 81 195 365
< – indicates a value less than the reported number which is the MDC.

PA DEP TENORM Study Report – Section 4.0 Rev. 0
January 2015 4-23
Table 4-9. POTW-I Unfiltered Effluent Results Summary –
Gamma Spectroscopy and Miscellaneous Results
Sample ID Ra-226
(pCi/L)
Ra-228
(pCi/L)
K-40
(pCi/L)
Gross
Alpha
(pCi/L)
Gross
Beta
(pCi/L)
WT-12-LQ-097 < 67.0 < 10.0 51.1 < 284 < 396
WT-12-LQ-160 < 58 < 11.0 41.0 9.63 10.9
WT-12-LQ-296 59.0 < 5.00 40.0 < 192 < 207
WT-13-LQ-053 113 < 8.00 37.0 < 36.5 < 135
WT-13-LQ-194 82.0 < 5.00 55.0 < 117 < 187
WT-13-LQ-210 < 35.0 < 23.0 < 11.0 < 144 < 194
WT-14-LQ-043 < 101 < 18.0 80.0 < 84.2 < 158
WT-14-LQ-172 340 < 15.0 < 58.0 < 464 < 218
WT-14-LQ-216 < 128 < 27.0 < 106 < 136 < 193
WT-15-LQ-051 80.0 < 9.00 53.0 < 177 < 163
WT-15-LQ-186 < 50.0 < 9.00 < 27.0 11.0 9.60
WT-15-LQ-224 < 79.0 27.0 64.0 < 235 < 209
WT-16-LQ-080 100 < 9.00 33.0 < 3.13 7.16
WT-16-LQ-146 < 67.0 < 11.0 < 41.0 < 2.16 7.71
WT-16-LQ-242 107 < 9.00 44.0 < 2.51 10.5
WT-17-LQ-192 100 < 9.00 < 51.0 1,110 337
WT-17-LQ-218 156 35.0 31.0 < 152 < 197
Average 103 9.57 42.6 125 82.0
Std. Dev. 73.7 9.32 21.5 269 79.3
Median 97.0 5.50 40.5 63.3 87.5
Minimum 17.5 2.50 5.50 1.08 7.16
Maximum 340 35.0 82.0 1,110 337
< – indicates a value less than the reported number which is the MDC.
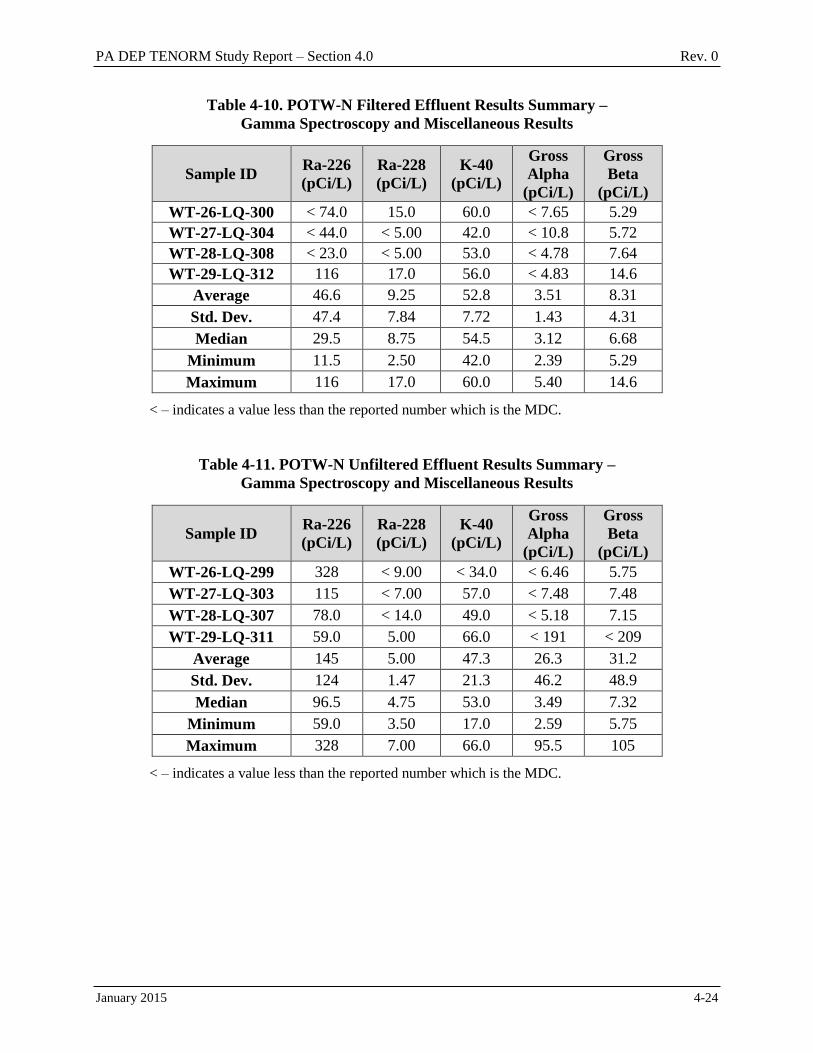
PA DEP TENORM Study Report – Section 4.0 Rev. 0
January 2015 4-24
Table 4-10. POTW-N Filtered Effluent Results Summary –
Gamma Spectroscopy and Miscellaneous Results
Sample ID Ra-226
(pCi/L)
Ra-228
(pCi/L)
K-40
(pCi/L)
Gross
Alpha
(pCi/L)
Gross
Beta
(pCi/L)
WT-26-LQ-300 < 74.0 15.0 60.0 < 7.65 5.29
WT-27-LQ-304 < 44.0 < 5.00 42.0 < 10.8 5.72
WT-28-LQ-308 < 23.0 < 5.00 53.0 < 4.78 7.64
WT-29-LQ-312 116 17.0 56.0 < 4.83 14.6
Average 46.6 9.25 52.8 3.51 8.31
Std. Dev. 47.4 7.84 7.72 1.43 4.31
Median 29.5 8.75 54.5 3.12 6.68
Minimum 11.5 2.50 42.0 2.39 5.29
Maximum 116 17.0 60.0 5.40 14.6
< – indicates a value less than the reported number which is the MDC.
Table 4-11. POTW-N Unfiltered Effluent Results Summary –
Gamma Spectroscopy and Miscellaneous Results
Sample ID Ra-226
(pCi/L)
Ra-228
(pCi/L)
K-40
(pCi/L)
Gross
Alpha
(pCi/L)
Gross
Beta
(pCi/L)
WT-26-LQ-299 328 < 9.00 < 34.0 < 6.46 5.75
WT-27-LQ-303 115 < 7.00 57.0 < 7.48 7.48
WT-28-LQ-307 78.0 < 14.0 49.0 < 5.18 7.15
WT-29-LQ-311 59.0 5.00 66.0 < 191 < 209
Average 145 5.00 47.3 26.3 31.2
Std. Dev. 124 1.47 21.3 46.2 48.9
Median 96.5 4.75 53.0 3.49 7.32
Minimum 59.0 3.50 17.0 2.59 5.75
Maximum 328 7.00 66.0 95.5 105
< – indicates a value less than the reported number which is the MDC.
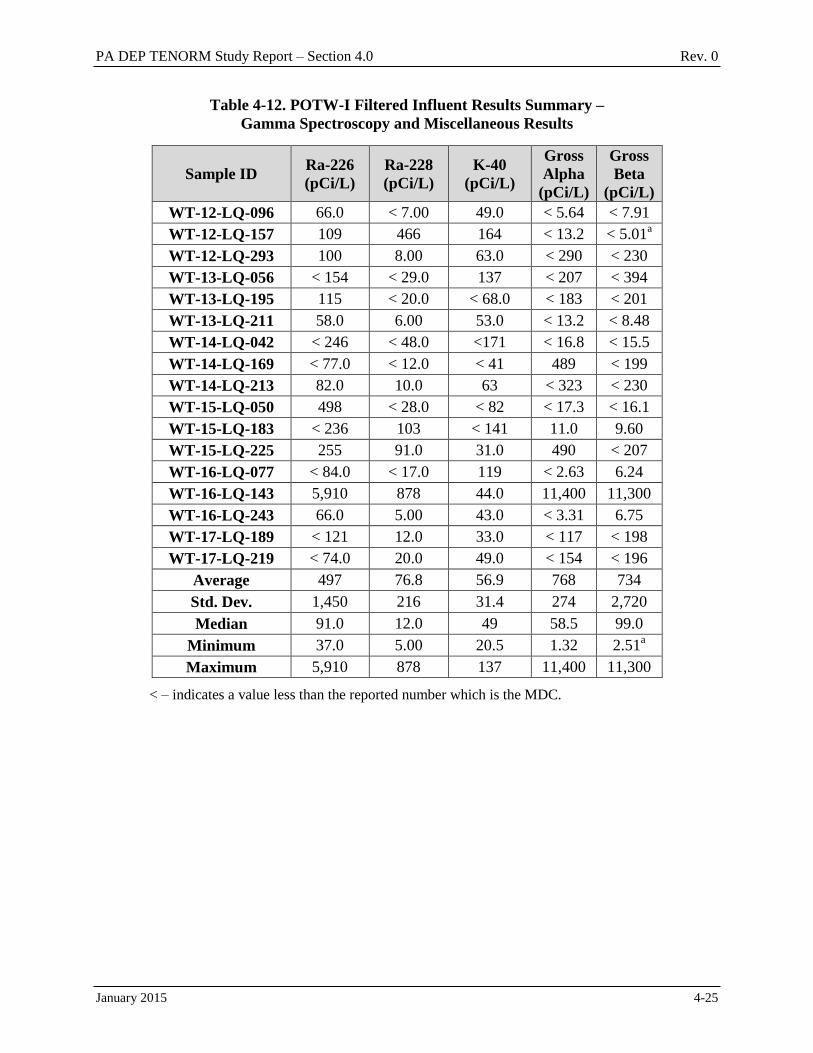
PA DEP TENORM Study Report – Section 4.0 Rev. 0
January 2015 4-25
Table 4-12. POTW-I Filtered Influent Results Summary –
Gamma Spectroscopy and Miscellaneous Results
Sample ID Ra-226
(pCi/L)
Ra-228
(pCi/L)
K-40
(pCi/L)
Gross
Alpha
(pCi/L)
Gross
Beta
(pCi/L)
WT-12-LQ-096 66.0 < 7.00 49.0 < 5.64 < 7.91
WT-12-LQ-157 109 466 164 < 13.2 < 5.01a
WT-12-LQ-293 100 8.00 63.0 < 290 < 230
WT-13-LQ-056 < 154 < 29.0 137 < 207 < 394
WT-13-LQ-195 115 < 20.0 < 68.0 < 183 < 201
WT-13-LQ-211 58.0 6.00 53.0 < 13.2 < 8.48
WT-14-LQ-042 < 246 < 48.0 <171 < 16.8 < 15.5
WT-14-LQ-169 < 77.0 < 12.0 < 41 489 < 199
WT-14-LQ-213 82.0 10.0 63 < 323 < 230
WT-15-LQ-050 498 < 28.0 < 82 < 17.3 < 16.1
WT-15-LQ-183 < 236 103 < 141 11.0 9.60
WT-15-LQ-225 255 91.0 31.0 490 < 207
WT-16-LQ-077 < 84.0 < 17.0 119 < 2.63 6.24
WT-16-LQ-143 5,910 878 44.0 11,400 11,300
WT-16-LQ-243 66.0 5.00 43.0 < 3.31 6.75
WT-17-LQ-189 < 121 12.0 33.0 < 117 < 198
WT-17-LQ-219 < 74.0 20.0 49.0 < 154 < 196
Average 497 76.8 56.9 768 734
Std. Dev. 1,450 216 31.4 274 2,720
Median 91.0 12.0 49 58.5 99.0
Minimum 37.0 5.00 20.5 1.32 2.51a
Maximum 5,910 878 137 11,400 11,300
< – indicates a value less than the reported number which is the MDC.
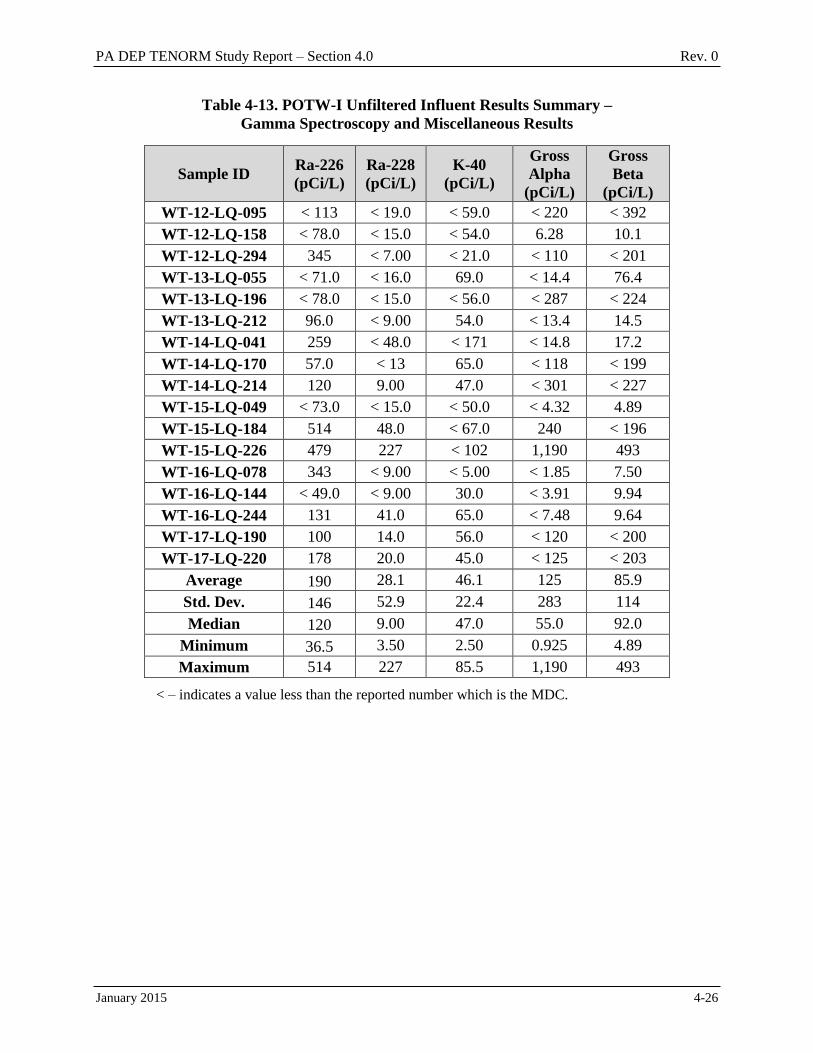
PA DEP TENORM Study Report – Section 4.0 Rev. 0
January 2015 4-26
Table 4-13. POTW-I Unfiltered Influent Results Summary –
Gamma Spectroscopy and Miscellaneous Results
Sample ID Ra-226
(pCi/L)
Ra-228
(pCi/L)
K-40
(pCi/L)
Gross
Alpha
(pCi/L)
Gross
Beta
(pCi/L)
WT-12-LQ-095 < 113 < 19.0 < 59.0 < 220 < 392
WT-12-LQ-158 < 78.0 < 15.0 < 54.0 6.28 10.1
WT-12-LQ-294 345 < 7.00 < 21.0 < 110 < 201
WT-13-LQ-055 < 71.0 < 16.0 69.0 < 14.4 76.4
WT-13-LQ-196 < 78.0 < 15.0 < 56.0 < 287 < 224
WT-13-LQ-212 96.0 < 9.00 54.0 < 13.4 14.5
WT-14-LQ-041 259 < 48.0 < 171 < 14.8 17.2
WT-14-LQ-170 57.0 < 13 65.0 < 118 < 199
WT-14-LQ-214 120 9.00 47.0 < 301 < 227
WT-15-LQ-049 < 73.0 < 15.0 < 50.0 < 4.32 4.89
WT-15-LQ-184 514 48.0 < 67.0 240 < 196
WT-15-LQ-226 479 227 < 102 1,190 493
WT-16-LQ-078 343 < 9.00 < 5.00 < 1.85 7.50
WT-16-LQ-144 < 49.0 < 9.00 30.0 < 3.91 9.94
WT-16-LQ-244 131 41.0 65.0 < 7.48 9.64
WT-17-LQ-190 100 14.0 56.0 < 120 < 200
WT-17-LQ-220 178 20.0 45.0 < 125 < 203
Average 190 28.1 46.1 125 85.9
Std. Dev. 146 52.9 22.4 283 114
Median 120 9.00 47.0 55.0 92.0
Minimum 36.5 3.50 2.50 0.925 4.89
Maximum 514 227 85.5 1,190 493
< – indicates a value less than the reported number which is the MDC.

PA DEP TENORM Study Report – Section 4.0 Rev. 0
January 2015 4-27
Table 4-14. POTW-N Filtered Influent Results Summary –
Gamma Spectroscopy and Miscellaneous Results
Sample ID Ra-226
(pCi/L)
Ra-228
(pCi/L)
K-40
(pCi/L)
Gross
Alpha
(pCi/L)
Gross
Beta
(pCi/L)
WT-26-LQ-298 134 10.0 30.0 13.0 6.62
WT-27-LQ-302 64.0 < 5.00 38.0 15.2 11.6
WT-28-LQ-306 84.0 < 14.0 62.0 4.57 12.4
WT-29-LQ-310 58.0 < 4.00 52.0 < 5.29 8.38
Average 85.0 5.38 45.5 8.85 9.75
Std. Dev. 34.5 3.82 14.3 6.17 2.71
Median 74.0 4.75 45.0 8.79 9.99
Minimum 58.0 2.00 30.0 2.645 6.62
Maximum 134 10.0 62.0 15.2 12.4
< – indicates a value less than the reported number which is the MDC.
Table 4-15. POTW-N Unfiltered Influent Results Summary –
Gamma Spectroscopy and Miscellaneous Results
Sample ID Ra-226
(pCi/L)
Ra-228
(pCi/L)
K-40
(pCi/L)
Gross
Alpha
(pCi/L)
Gross
Beta
(pCi/L)
WT-26-LQ-297 113 < 10.0 < 33.0 < 173 < 207
WT-27-LQ-301 92.0 32.0 44.0 < 192 < 209
WT-28-LQ-305 91.0 < 10.0 43.0 < 169 < 207
WT-29-LQ-309 114 < 9.00 < 29.0 < 4.21 8.63
Average 103 11.6 29.5 67.3 80.0
Std. Dev. 12.7 13.6 16.2 43.7 47.6
Median 103 5.00 29.8 85.5 104
Minimum 91.0 4.50 14.5 2.11 8.63
Maximum 114 32.0 44.0 96.0 105
< – indicates a value less than the reported number which is the MDC.
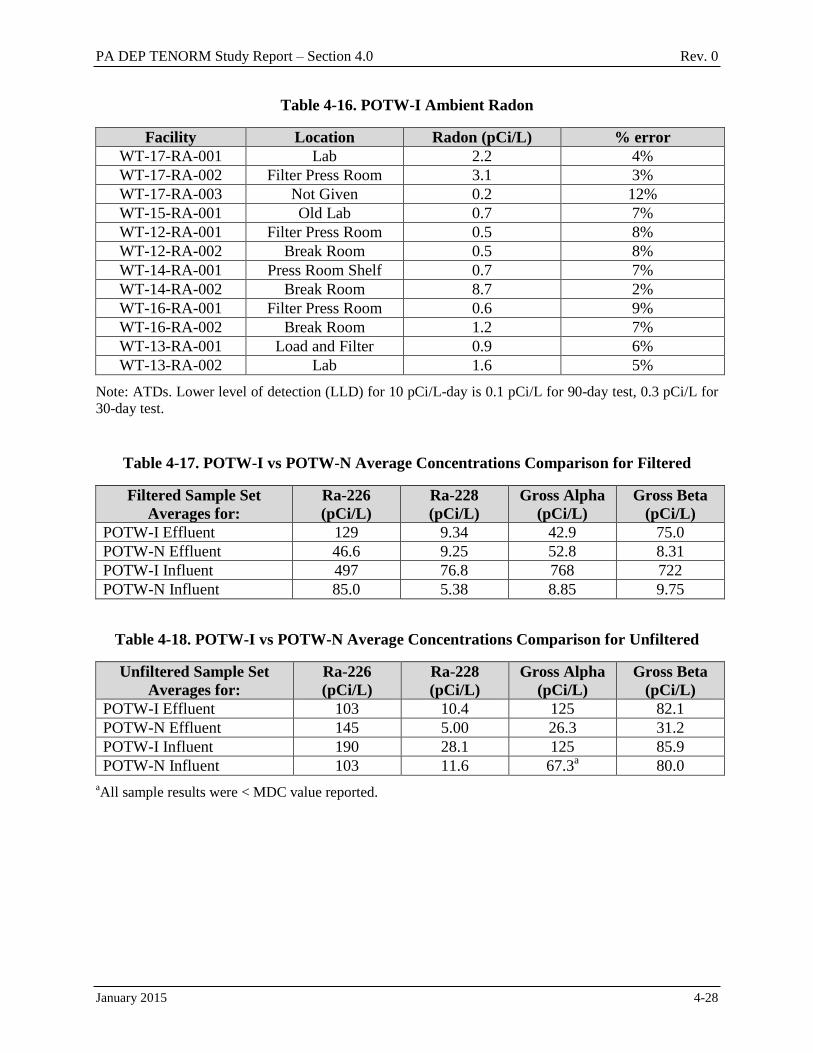
PA DEP TENORM Study Report – Section 4.0 Rev. 0
January 2015 4-28
Table 4-16. POTW-I Ambient Radon
Facility Location Radon (pCi/L) % error
WT-17-RA-001 Lab 2.2 4%
WT-17-RA-002 Filter Press Room 3.1 3%
WT-17-RA-003 Not Given 0.2 12%
WT-15-RA-001 Old Lab 0.7 7%
WT-12-RA-001 Filter Press Room 0.5 8%
WT-12-RA-002 Break Room 0.5 8%
WT-14-RA-001 Press Room Shelf 0.7 7%
WT-14-RA-002 Break Room 8.7 2%
WT-16-RA-001 Filter Press Room 0.6 9%
WT-16-RA-002 Break Room 1.2 7%
WT-13-RA-001 Load and Filter 0.9 6%
WT-13-RA-002 Lab 1.6 5%
Note: ATDs. Lower level of detection (LLD) for 10 pCi/L-day is 0.1 pCi/L for 90-day test, 0.3 pCi/L for
30-day test.
Table 4-17. POTW-I vs POTW-N Average Concentrations Comparison for Filtered
Filtered Sample Set
Averages for:
Ra-226
(pCi/L)
Ra-228
(pCi/L)
Gross Alpha
(pCi/L)
Gross Beta
(pCi/L)
POTW-I Effluent 129 9.34 42.9 75.0
POTW-N Effluent 46.6 9.25 52.8 8.31
POTW-I Influent 497 76.8 768 722
POTW-N Influent 85.0 5.38 8.85 9.75
Table 4-18. POTW-I vs POTW-N Average Concentrations Comparison for Unfiltered
Unfiltered Sample Set
Averages for:
Ra-226
(pCi/L)
Ra-228
(pCi/L)
Gross Alpha
(pCi/L)
Gross Beta
(pCi/L)
POTW-I Effluent 103 10.4 125 82.1
POTW-N Effluent 145 5.00 26.3 31.2
POTW-I Influent 190 28.1 125 85.9
POTW-N Influent 103 11.6 67.3a
80.0
aAll sample results were < MDC value reported.
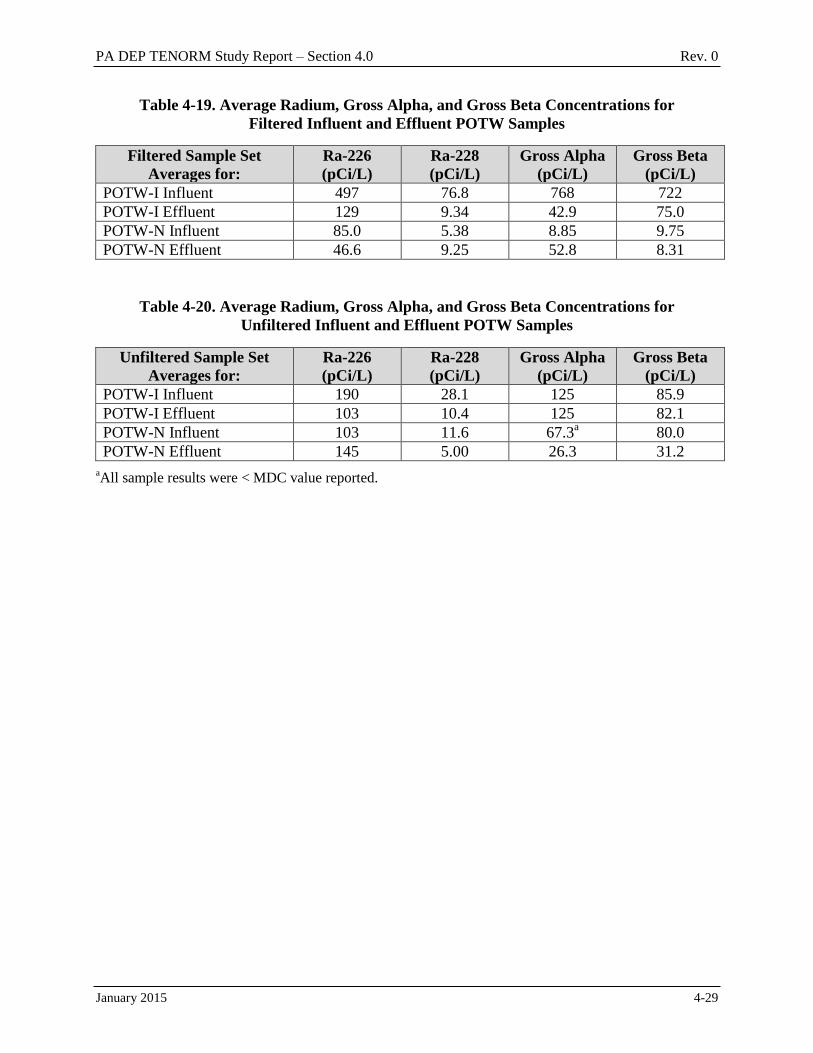
PA DEP TENORM Study Report – Section 4.0 Rev. 0
January 2015 4-29
Table 4-19. Average Radium, Gross Alpha, and Gross Beta Concentrations for
Filtered Influent and Effluent POTW Samples
Filtered Sample Set
Averages for:
Ra-226
(pCi/L)
Ra-228
(pCi/L)
Gross Alpha
(pCi/L)
Gross Beta
(pCi/L)
POTW-I Influent 497 76.8 768 722
POTW-I Effluent 129 9.34 42.9 75.0
POTW-N Influent 85.0 5.38 8.85 9.75
POTW-N Effluent 46.6 9.25 52.8 8.31
Table 4-20. Average Radium, Gross Alpha, and Gross Beta Concentrations for
Unfiltered Influent and Effluent POTW Samples
Unfiltered Sample Set
Averages for:
Ra-226
(pCi/L)
Ra-228
(pCi/L)
Gross Alpha
(pCi/L)
Gross Beta
(pCi/L)
POTW-I Influent 190 28.1 125 85.9
POTW-I Effluent 103 10.4 125 82.1
POTW-N Influent 103 11.6 67.3a
80.0
POTW-N Effluent 145 5.00 26.3 31.2
aAll sample results were < MDC value reported.
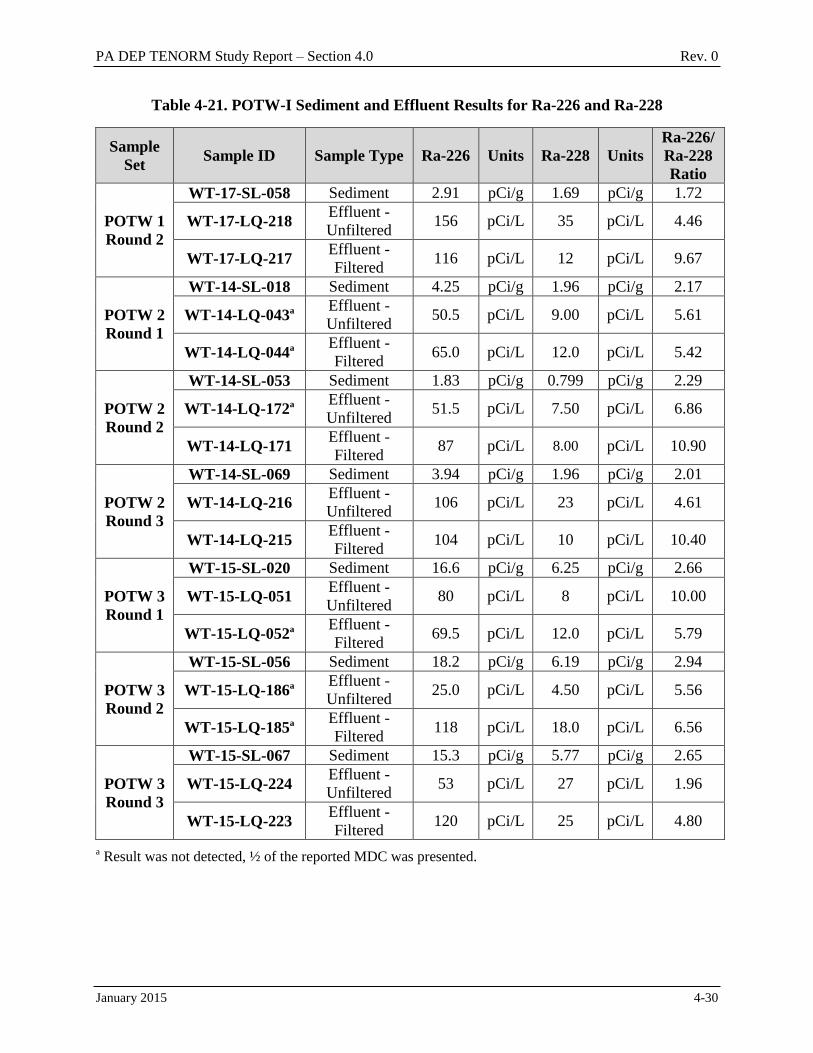
PA DEP TENORM Study Report – Section 4.0 Rev. 0
January 2015 4-30
Table 4-21. POTW-I Sediment and Effluent Results for Ra-226 and Ra-228
Sample
Set Sample ID Sample Type Ra-226 Units Ra-228 Units
Ra-226/
Ra-228
Ratio
POTW 1
Round 2
WT-17-SL-058 Sediment 2.91 pCi/g 1.69 pCi/g 1.72
WT-17-LQ-218 Effluent -
Unfiltered 156 pCi/L 35 pCi/L 4.46
WT-17-LQ-217 Effluent -
Filtered 116 pCi/L 12 pCi/L 9.67
POTW 2
Round 1
WT-14-SL-018 Sediment 4.25 pCi/g 1.96 pCi/g 2.17
WT-14-LQ-043a Effluent -
Unfiltered 50.5 pCi/L 9.00 pCi/L 5.61
WT-14-LQ-044a Effluent -
Filtered 65.0 pCi/L 12.0 pCi/L 5.42
POTW 2
Round 2
WT-14-SL-053 Sediment 1.83 pCi/g 0.799 pCi/g 2.29
WT-14-LQ-172a Effluent -
Unfiltered 51.5 pCi/L 7.50 pCi/L 6.86
WT-14-LQ-171 Effluent -
Filtered 87 pCi/L 8.00 pCi/L 10.90
POTW 2
Round 3
WT-14-SL-069 Sediment 3.94 pCi/g 1.96 pCi/g 2.01
WT-14-LQ-216 Effluent -
Unfiltered 106 pCi/L 23 pCi/L 4.61
WT-14-LQ-215 Effluent -
Filtered 104 pCi/L 10 pCi/L 10.40
POTW 3
Round 1
WT-15-SL-020 Sediment 16.6 pCi/g 6.25 pCi/g 2.66
WT-15-LQ-051 Effluent -
Unfiltered 80 pCi/L 8 pCi/L 10.00
WT-15-LQ-052a Effluent -
Filtered 69.5 pCi/L 12.0 pCi/L 5.79
POTW 3
Round 2
WT-15-SL-056 Sediment 18.2 pCi/g 6.19 pCi/g 2.94
WT-15-LQ-186a Effluent -
Unfiltered 25.0 pCi/L 4.50 pCi/L 5.56
WT-15-LQ-185a Effluent -
Filtered 118 pCi/L 18.0 pCi/L 6.56
POTW 3
Round 3
WT-15-SL-067 Sediment 15.3 pCi/g 5.77 pCi/g 2.65
WT-15-LQ-224 Effluent -
Unfiltered 53 pCi/L 27 pCi/L 1.96
WT-15-LQ-223 Effluent -
Filtered 120 pCi/L 25 pCi/L 4.80
a Result was not detected, ½ of the reported MDC was presented.
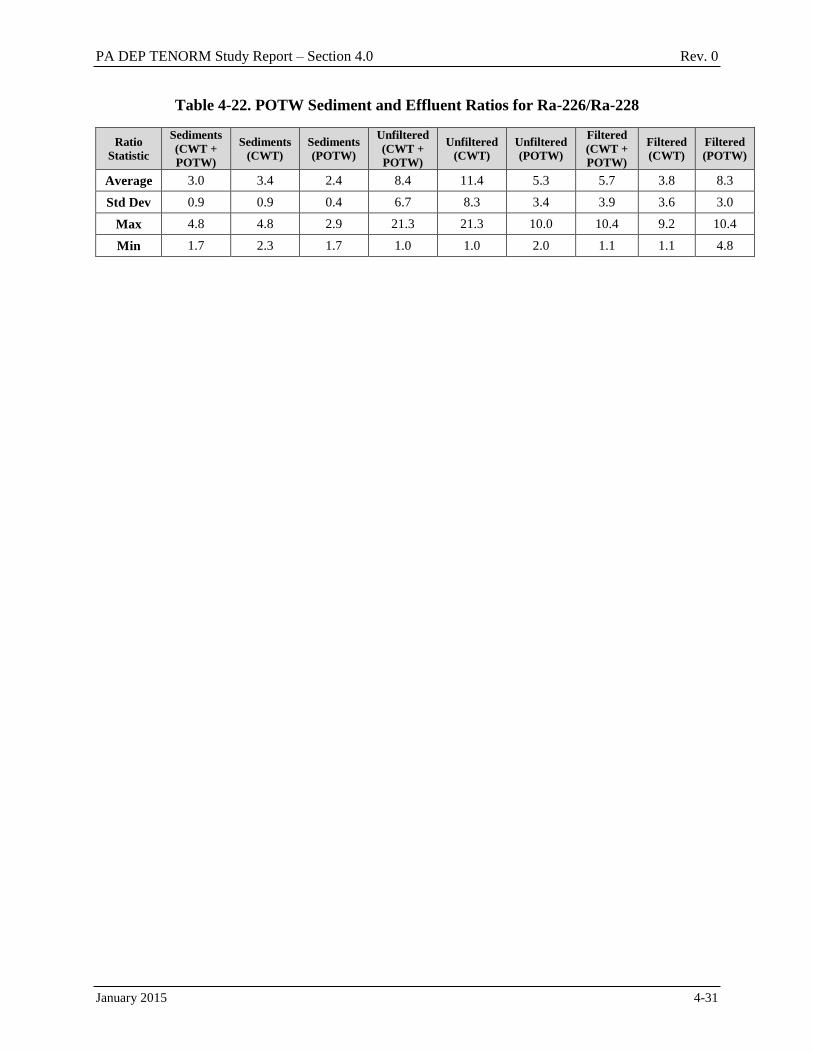
PA DEP TENORM Study Report – Section 4.0 Rev. 0
January 2015 4-31
Table 4-22. POTW Sediment and Effluent Ratios for Ra-226/Ra-228
Ratio
Statistic
Sediments
(CWT +
POTW)
Sediments
(CWT)
Sediments
(POTW)
Unfiltered
(CWT +
POTW)
Unfiltered
(CWT)
Unfiltered
(POTW)
Filtered
(CWT +
POTW)
Filtered
(CWT)
Filtered
(POTW)
Average 3.0 3.4 2.4 8.4 11.4 5.3 5.7 3.8 8.3
Std Dev 0.9 0.9 0.4 6.7 8.3 3.4 3.9 3.6 3.0
Max 4.8 4.8 2.9 21.3 21.3 10.0 10.4 9.2 10.4
Min 1.7 2.3 1.7 1.0 1.0 2.0 1.1 1.1 4.8
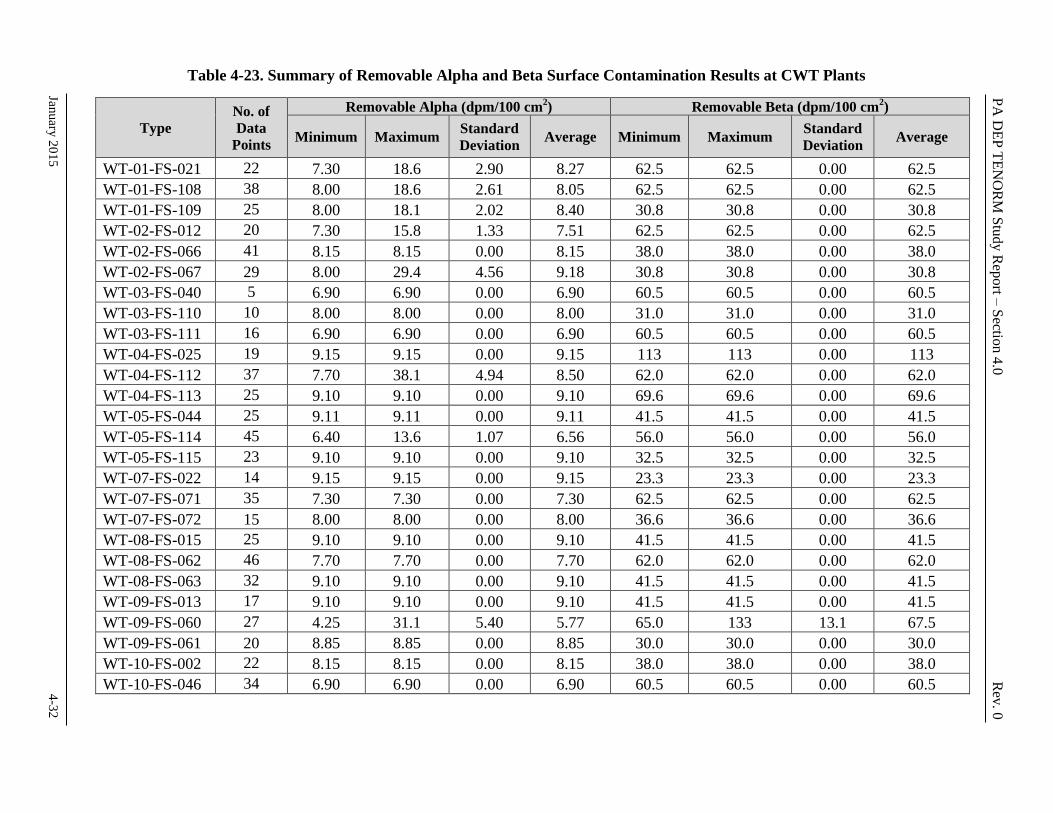
January
20
15
4
-32
PA
DE
P T
EN
OR
M S
tudy R
eport –
Sectio
n 4
.0
Rev
. 0
Table 4-23. Summary of Removable Alpha and Beta Surface Contamination Results at CWT Plants
Type
No. of
Data
Points
Removable Alpha (dpm/100 cm2) Removable Beta (dpm/100 cm
2)
Minimum Maximum Standard
Deviation Average Minimum Maximum
Standard
Deviation Average
WT-01-FS-021 22 7.30 18.6 2.90 8.27 62.5 62.5 0.00 62.5
WT-01-FS-108 38 8.00 18.6 2.61 8.05 62.5 62.5 0.00 62.5
WT-01-FS-109 25 8.00 18.1 2.02 8.40 30.8 30.8 0.00 30.8
WT-02-FS-012 20 7.30 15.8 1.33 7.51 62.5 62.5 0.00 62.5
WT-02-FS-066 41 8.15 8.15 0.00 8.15 38.0 38.0 0.00 38.0
WT-02-FS-067 29 8.00 29.4 4.56 9.18 30.8 30.8 0.00 30.8
WT-03-FS-040 5 6.90 6.90 0.00 6.90 60.5 60.5 0.00 60.5
WT-03-FS-110 10 8.00 8.00 0.00 8.00 31.0 31.0 0.00 31.0
WT-03-FS-111 16 6.90 6.90 0.00 6.90 60.5 60.5 0.00 60.5
WT-04-FS-025 19 9.15 9.15 0.00 9.15 113 113 0.00 113
WT-04-FS-112 37 7.70 38.1 4.94 8.50 62.0 62.0 0.00 62.0
WT-04-FS-113 25 9.10 9.10 0.00 9.10 69.6 69.6 0.00 69.6
WT-05-FS-044 25 9.11 9.11 0.00 9.11 41.5 41.5 0.00 41.5
WT-05-FS-114 45 6.40 13.6 1.07 6.56 56.0 56.0 0.00 56.0
WT-05-FS-115 23 9.10 9.10 0.00 9.10 32.5 32.5 0.00 32.5
WT-07-FS-022 14 9.15 9.15 0.00 9.15 23.3 23.3 0.00 23.3
WT-07-FS-071 35 7.30 7.30 0.00 7.30 62.5 62.5 0.00 62.5
WT-07-FS-072 15 8.00 8.00 0.00 8.00 36.6 36.6 0.00 36.6
WT-08-FS-015 25 9.10 9.10 0.00 9.10 41.5 41.5 0.00 41.5
WT-08-FS-062 46 7.70 7.70 0.00 7.70 62.0 62.0 0.00 62.0
WT-08-FS-063 32 9.10 9.10 0.00 9.10 41.5 41.5 0.00 41.5
WT-09-FS-013 17 9.10 9.10 0.00 9.10 41.5 41.5 0.00 41.5
WT-09-FS-060 27 4.25 31.1 5.40 5.77 65.0 133 13.1 67.5
WT-09-FS-061 20 8.85 8.85 0.00 8.85 30.0 30.0 0.00 30.0
WT-10-FS-002 22 8.15 8.15 0.00 8.15 38.0 38.0 0.00 38.0
WT-10-FS-046 34 6.90 6.90 0.00 6.90 60.5 60.5 0.00 60.5
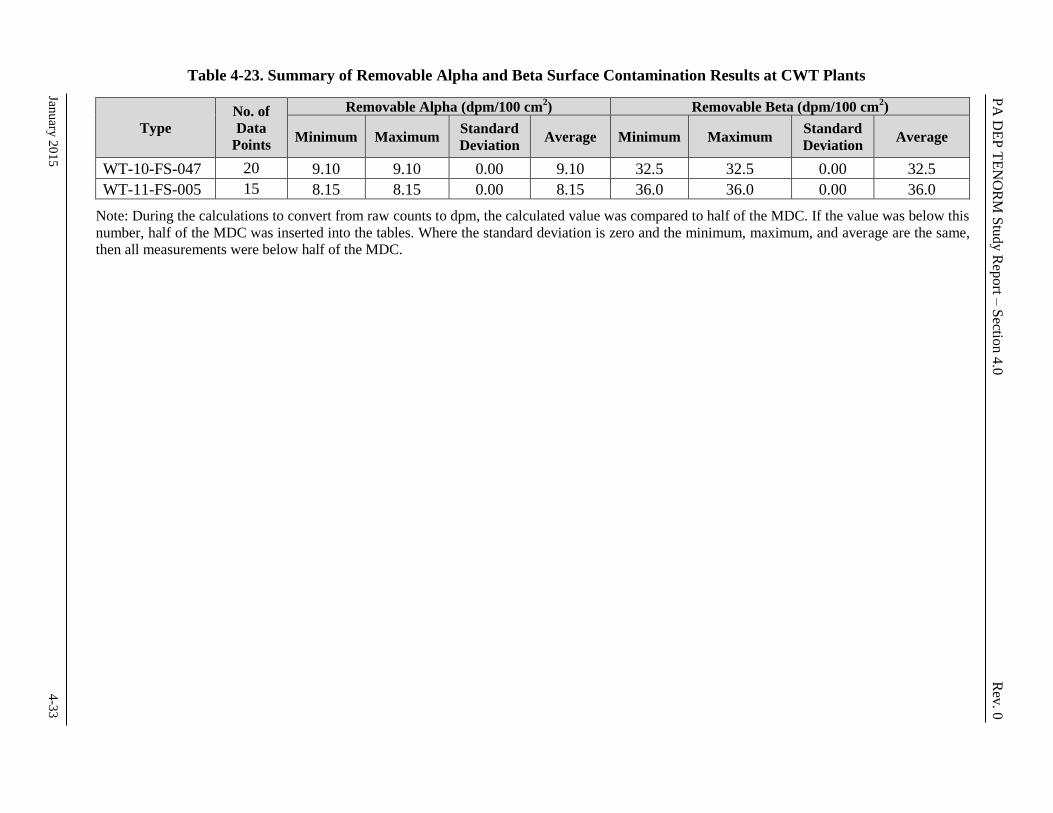
January
20
15
4
-33
PA
DE
P T
EN
OR
M S
tudy R
eport –
Sectio
n 4
.0
Rev
. 0
Table 4-23. Summary of Removable Alpha and Beta Surface Contamination Results at CWT Plants
Type
No. of
Data
Points
Removable Alpha (dpm/100 cm2) Removable Beta (dpm/100 cm
2)
Minimum Maximum Standard
Deviation Average Minimum Maximum
Standard
Deviation Average
WT-10-FS-047 20 9.10 9.10 0.00 9.10 32.5 32.5 0.00 32.5
WT-11-FS-005 15 8.15 8.15 0.00 8.15 36.0 36.0 0.00 36.0
Note: During the calculations to convert from raw counts to dpm, the calculated value was compared to half of the MDC. If the value was below this
number, half of the MDC was inserted into the tables. Where the standard deviation is zero and the minimum, maximum, and average are the same,
then all measurements were below half of the MDC.
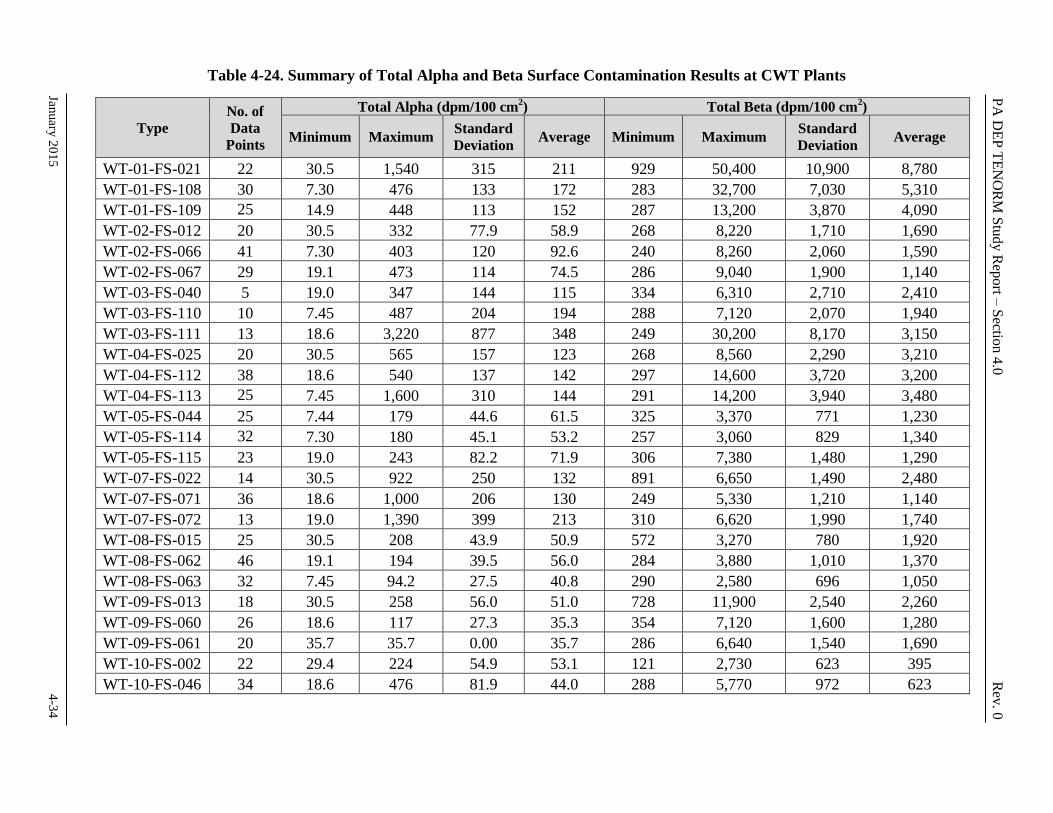
January
20
15
4
-34
PA
DE
P T
EN
OR
M S
tudy R
eport –
Sectio
n 4
.0
Rev
. 0
Table 4-24. Summary of Total Alpha and Beta Surface Contamination Results at CWT Plants
Type
No. of
Data
Points
Total Alpha (dpm/100 cm2) Total Beta (dpm/100 cm
2)
Minimum Maximum Standard
Deviation Average Minimum Maximum
Standard
Deviation Average
WT-01-FS-021 22 30.5 1,540 315 211 929 50,400 10,900 8,780
WT-01-FS-108 30 7.30 476 133 172 283 32,700 7,030 5,310
WT-01-FS-109 25 14.9 448 113 152 287 13,200 3,870 4,090
WT-02-FS-012 20 30.5 332 77.9 58.9 268 8,220 1,710 1,690
WT-02-FS-066 41 7.30 403 120 92.6 240 8,260 2,060 1,590
WT-02-FS-067 29 19.1 473 114 74.5 286 9,040 1,900 1,140
WT-03-FS-040 5 19.0 347 144 115 334 6,310 2,710 2,410
WT-03-FS-110 10 7.45 487 204 194 288 7,120 2,070 1,940
WT-03-FS-111 13 18.6 3,220 877 348 249 30,200 8,170 3,150
WT-04-FS-025 20 30.5 565 157 123 268 8,560 2,290 3,210
WT-04-FS-112 38 18.6 540 137 142 297 14,600 3,720 3,200
WT-04-FS-113 25 7.45 1,600 310 144 291 14,200 3,940 3,480
WT-05-FS-044 25 7.44 179 44.6 61.5 325 3,370 771 1,230
WT-05-FS-114 32 7.30 180 45.1 53.2 257 3,060 829 1,340
WT-05-FS-115 23 19.0 243 82.2 71.9 306 7,380 1,480 1,290
WT-07-FS-022 14 30.5 922 250 132 891 6,650 1,490 2,480
WT-07-FS-071 36 18.6 1,000 206 130 249 5,330 1,210 1,140
WT-07-FS-072 13 19.0 1,390 399 213 310 6,620 1,990 1,740
WT-08-FS-015 25 30.5 208 43.9 50.9 572 3,270 780 1,920
WT-08-FS-062 46 19.1 194 39.5 56.0 284 3,880 1,010 1,370
WT-08-FS-063 32 7.45 94.2 27.5 40.8 290 2,580 696 1,050
WT-09-FS-013 18 30.5 258 56.0 51.0 728 11,900 2,540 2,260
WT-09-FS-060 26 18.6 117 27.3 35.3 354 7,120 1,600 1,280
WT-09-FS-061 20 35.7 35.7 0.00 35.7 286 6,640 1,540 1,690
WT-10-FS-002 22 29.4 224 54.9 53.1 121 2,730 623 395
WT-10-FS-046 34 18.6 476 81.9 44.0 288 5,770 972 623

January
20
15
4
-35
PA
DE
P T
EN
OR
M S
tudy R
eport –
Sectio
n 4
.0
Rev
. 0
Table 4-24. Summary of Total Alpha and Beta Surface Contamination Results at CWT Plants
Type
No. of
Data
Points
Total Alpha (dpm/100 cm2) Total Beta (dpm/100 cm
2)
Minimum Maximum Standard
Deviation Average Minimum Maximum
Standard
Deviation Average
WT-10-FS-047 21 7.45 174 37.6 24.0 297 1,760 366 482
WT-11-FS-005 15 30.5 114 26.6 49.0 617 3,380 746 1,350
Note: During the calculations to convert from raw counts to dpm, the calculated value was compared to half of the MDC. If the value was below this
number, half of the MDC was inserted into the tables. Where the standard deviation is zero and the minimum, maximum, and average are the same,
then all measurements were below half of the MDC.
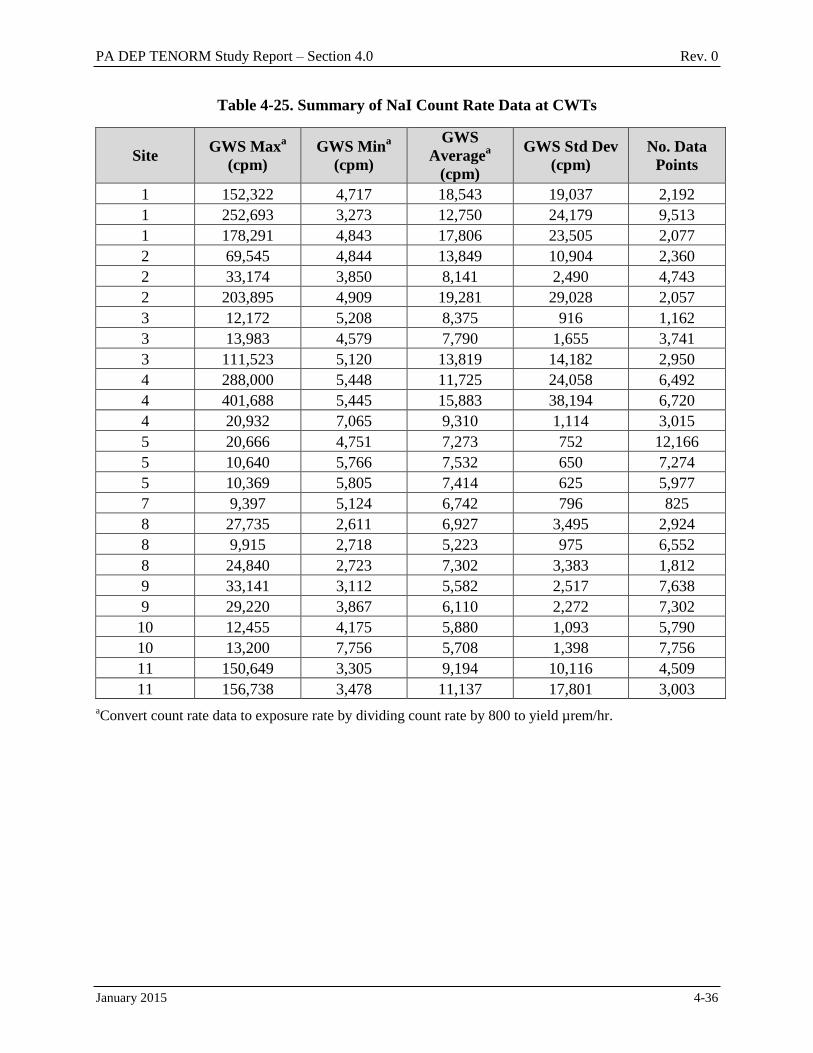
PA DEP TENORM Study Report – Section 4.0 Rev. 0
January 2015 4-36
Table 4-25. Summary of NaI Count Rate Data at CWTs
Site GWS Max
a
(cpm)
GWS Mina
(cpm)
GWS
Averagea
(cpm)
GWS Std Dev
(cpm)
No. Data
Points
1 152,322 4,717 18,543 19,037 2,192
1 252,693 3,273 12,750 24,179 9,513
1 178,291 4,843 17,806 23,505 2,077
2 69,545 4,844 13,849 10,904 2,360
2 33,174 3,850 8,141 2,490 4,743
2 203,895 4,909 19,281 29,028 2,057
3 12,172 5,208 8,375 916 1,162
3 13,983 4,579 7,790 1,655 3,741
3 111,523 5,120 13,819 14,182 2,950
4 288,000 5,448 11,725 24,058 6,492
4 401,688 5,445 15,883 38,194 6,720
4 20,932 7,065 9,310 1,114 3,015
5 20,666 4,751 7,273 752 12,166
5 10,640 5,766 7,532 650 7,274
5 10,369 5,805 7,414 625 5,977
7 9,397 5,124 6,742 796 825
8 27,735 2,611 6,927 3,495 2,924
8 9,915 2,718 5,223 975 6,552
8 24,840 2,723 7,302 3,383 1,812
9 33,141 3,112 5,582 2,517 7,638
9 29,220 3,867 6,110 2,272 7,302
10 12,455 4,175 5,880 1,093 5,790
10 13,200 7,756 5,708 1,398 7,756
11 150,649 3,305 9,194 10,116 4,509
11 156,738 3,478 11,137 17,801 3,003
aConvert count rate data to exposure rate by dividing count rate by 800 to yield µrem/hr.
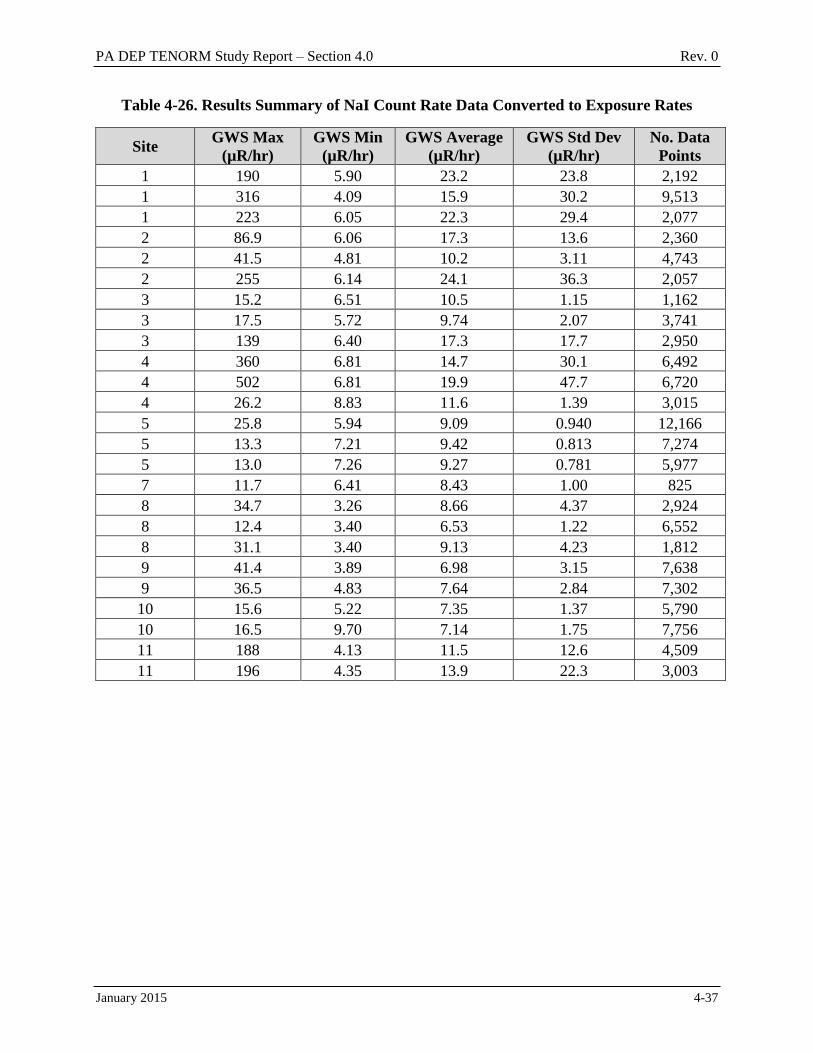
PA DEP TENORM Study Report – Section 4.0 Rev. 0
January 2015 4-37
Table 4-26. Results Summary of NaI Count Rate Data Converted to Exposure Rates
Site GWS Max
(µR/hr)
GWS Min
(µR/hr)
GWS Average
(µR/hr)
GWS Std Dev
(µR/hr)
No. Data
Points
1 190 5.90 23.2 23.8 2,192
1 316 4.09 15.9 30.2 9,513
1 223 6.05 22.3 29.4 2,077
2 86.9 6.06 17.3 13.6 2,360
2 41.5 4.81 10.2 3.11 4,743
2 255 6.14 24.1 36.3 2,057
3 15.2 6.51 10.5 1.15 1,162
3 17.5 5.72 9.74 2.07 3,741
3 139 6.40 17.3 17.7 2,950
4 360 6.81 14.7 30.1 6,492
4 502 6.81 19.9 47.7 6,720
4 26.2 8.83 11.6 1.39 3,015
5 25.8 5.94 9.09 0.940 12,166
5 13.3 7.21 9.42 0.813 7,274
5 13.0 7.26 9.27 0.781 5,977
7 11.7 6.41 8.43 1.00 825
8 34.7 3.26 8.66 4.37 2,924
8 12.4 3.40 6.53 1.22 6,552
8 31.1 3.40 9.13 4.23 1,812
9 41.4 3.89 6.98 3.15 7,638
9 36.5 4.83 7.64 2.84 7,302
10 15.6 5.22 7.35 1.37 5,790
10 16.5 9.70 7.14 1.75 7,756
11 188 4.13 11.5 12.6 4,509
11 196 4.35 13.9 22.3 3,003
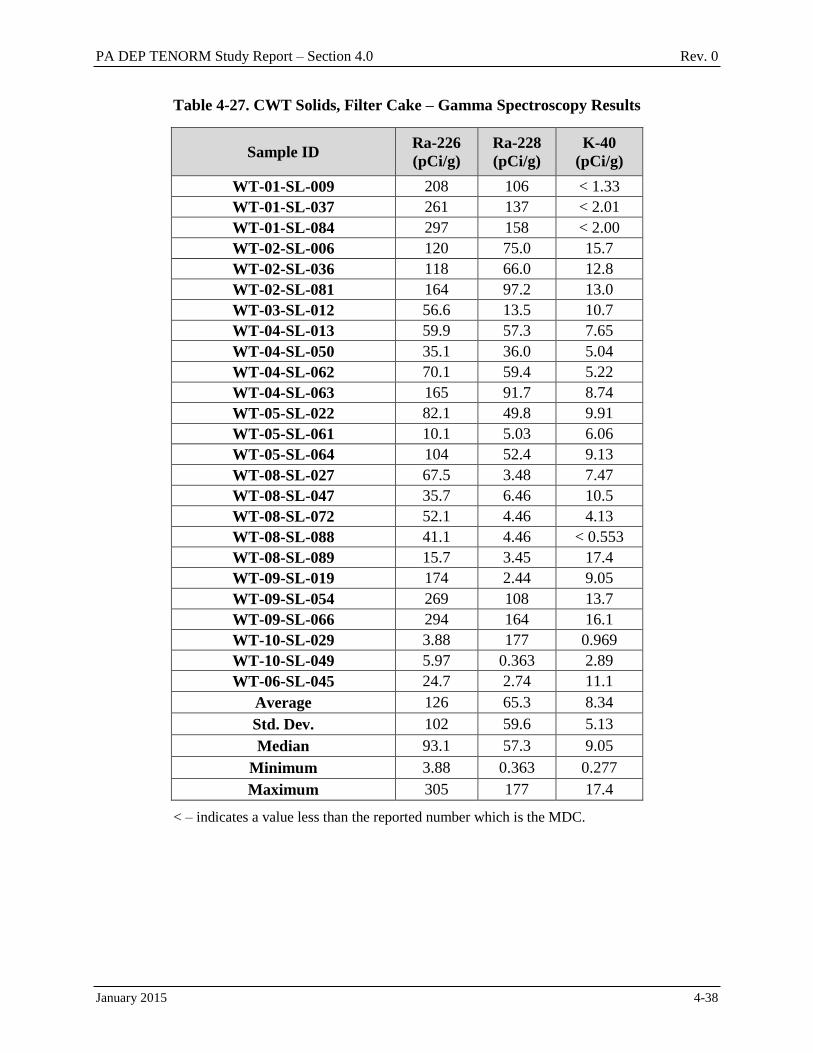
PA DEP TENORM Study Report – Section 4.0 Rev. 0
January 2015 4-38
Table 4-27. CWT Solids, Filter Cake – Gamma Spectroscopy Results
Sample ID Ra-226
(pCi/g)
Ra-228
(pCi/g)
K-40
(pCi/g)
WT-01-SL-009 208 106 < 1.33
WT-01-SL-037 261 137 < 2.01
WT-01-SL-084 297 158 < 2.00
WT-02-SL-006 120 75.0 15.7
WT-02-SL-036 118 66.0 12.8
WT-02-SL-081 164 97.2 13.0
WT-03-SL-012 56.6 13.5 10.7
WT-04-SL-013 59.9 57.3 7.65
WT-04-SL-050 35.1 36.0 5.04
WT-04-SL-062 70.1 59.4 5.22
WT-04-SL-063 165 91.7 8.74
WT-05-SL-022 82.1 49.8 9.91
WT-05-SL-061 10.1 5.03 6.06
WT-05-SL-064 104 52.4 9.13
WT-08-SL-027 67.5 3.48 7.47
WT-08-SL-047 35.7 6.46 10.5
WT-08-SL-072 52.1 4.46 4.13
WT-08-SL-088 41.1 4.46 < 0.553
WT-08-SL-089 15.7 3.45 17.4
WT-09-SL-019 174 2.44 9.05
WT-09-SL-054 269 108 13.7
WT-09-SL-066 294 164 16.1
WT-10-SL-029 3.88 177 0.969
WT-10-SL-049 5.97 0.363 2.89
WT-06-SL-045 24.7 2.74 11.1
Average 126 65.3 8.34
Std. Dev. 102 59.6 5.13
Median 93.1 57.3 9.05
Minimum 3.88 0.363 0.277
Maximum 305 177 17.4
< – indicates a value less than the reported number which is the MDC.
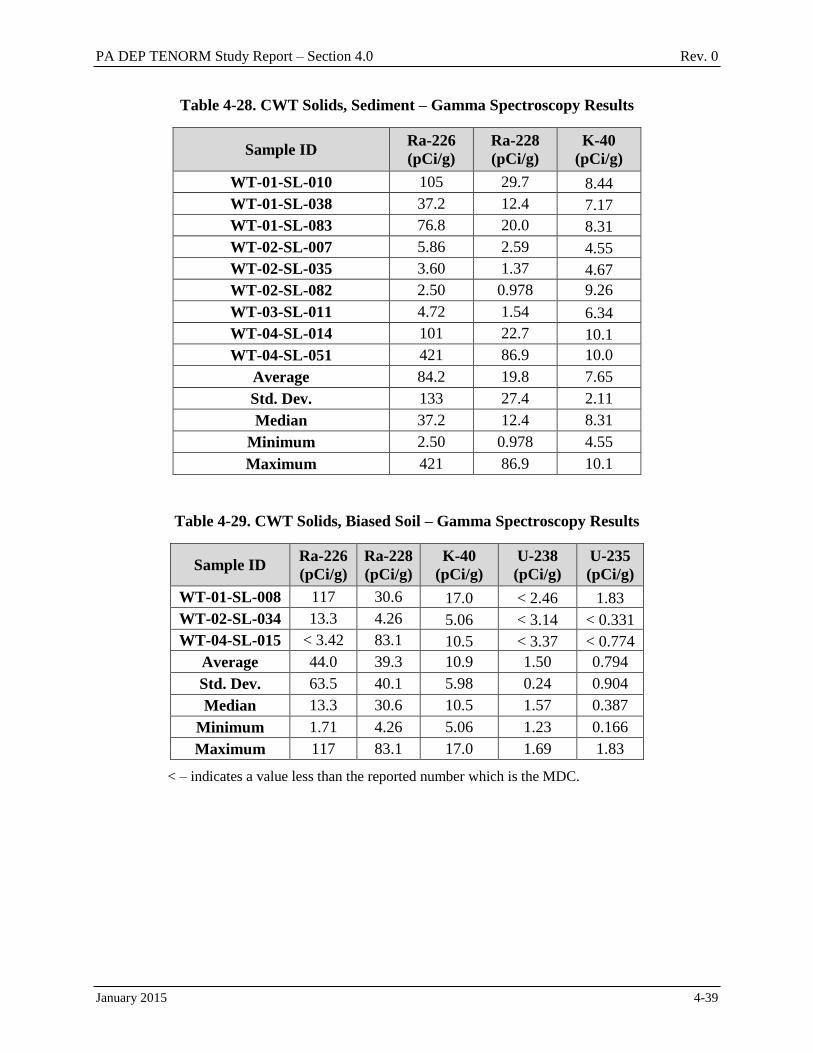
PA DEP TENORM Study Report – Section 4.0 Rev. 0
January 2015 4-39
Table 4-28. CWT Solids, Sediment – Gamma Spectroscopy Results
Sample ID Ra-226
(pCi/g)
Ra-228
(pCi/g)
K-40
(pCi/g)
WT-01-SL-010 105 29.7 8.44
WT-01-SL-038 37.2 12.4 7.17
WT-01-SL-083 76.8 20.0 8.31
WT-02-SL-007 5.86 2.59 4.55
WT-02-SL-035 3.60 1.37 4.67
WT-02-SL-082 2.50 0.978 9.26
WT-03-SL-011 4.72 1.54 6.34
WT-04-SL-014 101 22.7 10.1
WT-04-SL-051 421 86.9 10.0
Average 84.2 19.8 7.65
Std. Dev. 133 27.4 2.11
Median 37.2 12.4 8.31
Minimum 2.50 0.978 4.55
Maximum 421 86.9 10.1
Table 4-29. CWT Solids, Biased Soil – Gamma Spectroscopy Results
Sample ID Ra-226
(pCi/g)
Ra-228
(pCi/g)
K-40
(pCi/g)
U-238
(pCi/g)
U-235
(pCi/g)
WT-01-SL-008 117 30.6 17.0 < 2.46 1.83
WT-02-SL-034 13.3 4.26 5.06 < 3.14 < 0.331
WT-04-SL-015 < 3.42 83.1 10.5 < 3.37 < 0.774
Average 44.0 39.3 10.9 1.50 0.794
Std. Dev. 63.5 40.1 5.98 0.24 0.904
Median 13.3 30.6 10.5 1.57 0.387
Minimum 1.71 4.26 5.06 1.23 0.166
Maximum 117 83.1 17.0 1.69 1.83
< – indicates a value less than the reported number which is the MDC.
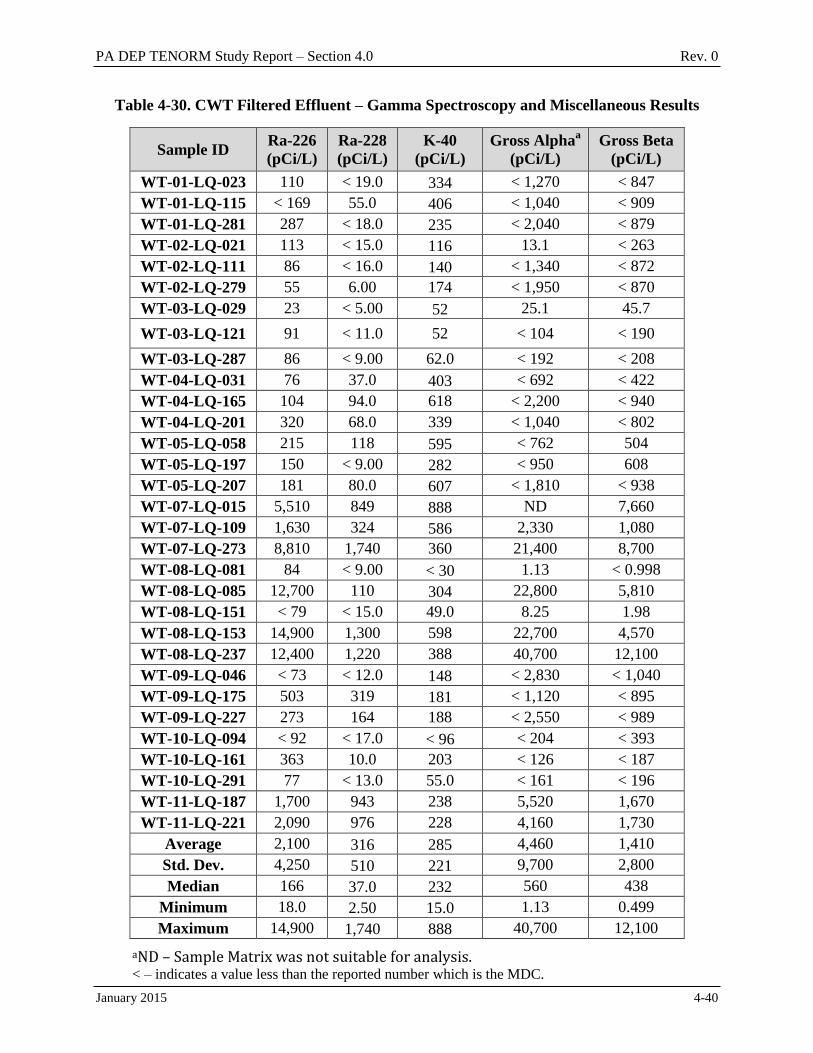
PA DEP TENORM Study Report – Section 4.0 Rev. 0
January 2015 4-40
Table 4-30. CWT Filtered Effluent – Gamma Spectroscopy and Miscellaneous Results
Sample ID Ra-226
(pCi/L)
Ra-228
(pCi/L)
K-40
(pCi/L)
Gross Alphaa
(pCi/L)
Gross Beta
(pCi/L)
WT-01-LQ-023 110 < 19.0 334 < 1,270 < 847
WT-01-LQ-115 < 169 55.0 406 < 1,040 < 909
WT-01-LQ-281 287 < 18.0 235 < 2,040 < 879
WT-02-LQ-021 113 < 15.0 116 13.1 < 263
WT-02-LQ-111 86 < 16.0 140 < 1,340 < 872
WT-02-LQ-279 55 6.00 174 < 1,950 < 870
WT-03-LQ-029 23 < 5.00 52 25.1 45.7
WT-03-LQ-121 91 < 11.0 52 < 104 < 190
WT-03-LQ-287 86 < 9.00 62.0 < 192 < 208
WT-04-LQ-031 76 37.0 403 < 692 < 422
WT-04-LQ-165 104 94.0 618 < 2,200 < 940
WT-04-LQ-201 320 68.0 339 < 1,040 < 802
WT-05-LQ-058 215 118 595 < 762 504
WT-05-LQ-197 150 < 9.00 282 < 950 608
WT-05-LQ-207 181 80.0 607 < 1,810 < 938
WT-07-LQ-015 5,510 849 888 ND 7,660
WT-07-LQ-109 1,630 324 586 2,330 1,080
WT-07-LQ-273 8,810 1,740 360 21,400 8,700
WT-08-LQ-081 84 < 9.00 < 30 1.13 < 0.998
WT-08-LQ-085 12,700 110 304 22,800 5,810
WT-08-LQ-151 < 79 < 15.0 49.0 8.25 1.98
WT-08-LQ-153 14,900 1,300 598 22,700 4,570
WT-08-LQ-237 12,400 1,220 388 40,700 12,100
WT-09-LQ-046 < 73 < 12.0 148 < 2,830 < 1,040
WT-09-LQ-175 503 319 181 < 1,120 < 895
WT-09-LQ-227 273 164 188 < 2,550 < 989
WT-10-LQ-094 < 92 < 17.0 < 96 < 204 < 393
WT-10-LQ-161 363 10.0 203 < 126 < 187
WT-10-LQ-291 77 < 13.0 55.0 < 161 < 196
WT-11-LQ-187 1,700 943 238 5,520 1,670
WT-11-LQ-221 2,090 976 228 4,160 1,730
Average 2,100 316 285 4,460 1,410
Std. Dev. 4,250 510 221 9,700 2,800
Median 166 37.0 232 560 438
Minimum 18.0 2.50 15.0 1.13 0.499
Maximum 14,900 1,740 888 40,700 12,100
aND – Sample Matrix was not suitable for analysis. < – indicates a value less than the reported number which is the MDC.
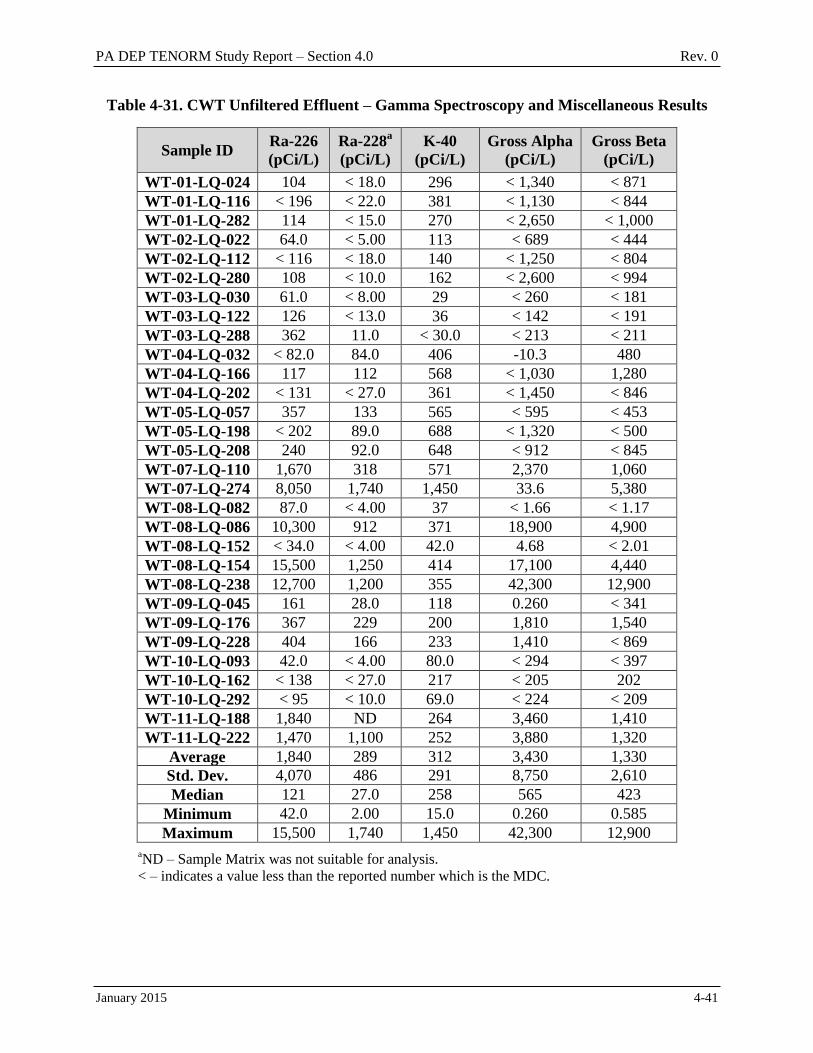
PA DEP TENORM Study Report – Section 4.0 Rev. 0
January 2015 4-41
Table 4-31. CWT Unfiltered Effluent – Gamma Spectroscopy and Miscellaneous Results
Sample ID Ra-226
(pCi/L)
Ra-228a
(pCi/L)
K-40
(pCi/L)
Gross Alpha
(pCi/L)
Gross Beta
(pCi/L)
WT-01-LQ-024 104 < 18.0 296 < 1,340 < 871
WT-01-LQ-116 < 196 < 22.0 381 < 1,130 < 844
WT-01-LQ-282 114 < 15.0 270 < 2,650 < 1,000
WT-02-LQ-022 64.0 < 5.00 113 < 689 < 444
WT-02-LQ-112 < 116 < 18.0 140 < 1,250 < 804
WT-02-LQ-280 108 < 10.0 162 < 2,600 < 994
WT-03-LQ-030 61.0 < 8.00 29 < 260 < 181
WT-03-LQ-122 126 < 13.0 36 < 142 < 191
WT-03-LQ-288 362 11.0 < 30.0 < 213 < 211
WT-04-LQ-032 < 82.0 84.0 406 -10.3 480
WT-04-LQ-166 117 112 568 < 1,030 1,280
WT-04-LQ-202 < 131 < 27.0 361 < 1,450 < 846
WT-05-LQ-057 357 133 565 < 595 < 453
WT-05-LQ-198 < 202 89.0 688 < 1,320 < 500
WT-05-LQ-208 240 92.0 648 < 912 < 845
WT-07-LQ-110 1,670 318 571 2,370 1,060
WT-07-LQ-274 8,050 1,740 1,450 33.6 5,380
WT-08-LQ-082 87.0 < 4.00 37 < 1.66 < 1.17
WT-08-LQ-086 10,300 912 371 18,900 4,900
WT-08-LQ-152 < 34.0 < 4.00 42.0 4.68 < 2.01
WT-08-LQ-154 15,500 1,250 414 17,100 4,440
WT-08-LQ-238 12,700 1,200 355 42,300 12,900
WT-09-LQ-045 161 28.0 118 0.260 < 341
WT-09-LQ-176 367 229 200 1,810 1,540
WT-09-LQ-228 404 166 233 1,410 < 869
WT-10-LQ-093 42.0 < 4.00 80.0 < 294 < 397
WT-10-LQ-162 < 138 < 27.0 217 < 205 202
WT-10-LQ-292 < 95 < 10.0 69.0 < 224 < 209
WT-11-LQ-188 1,840 ND 264 3,460 1,410
WT-11-LQ-222 1,470 1,100 252 3,880 1,320
Average 1,840 289 312 3,430 1,330
Std. Dev. 4,070 486 291 8,750 2,610
Median 121 27.0 258 565 423
Minimum 42.0 2.00 15.0 0.260 0.585
Maximum 15,500 1,740 1,450 42,300 12,900
aND – Sample Matrix was not suitable for analysis.
< – indicates a value less than the reported number which is the MDC.
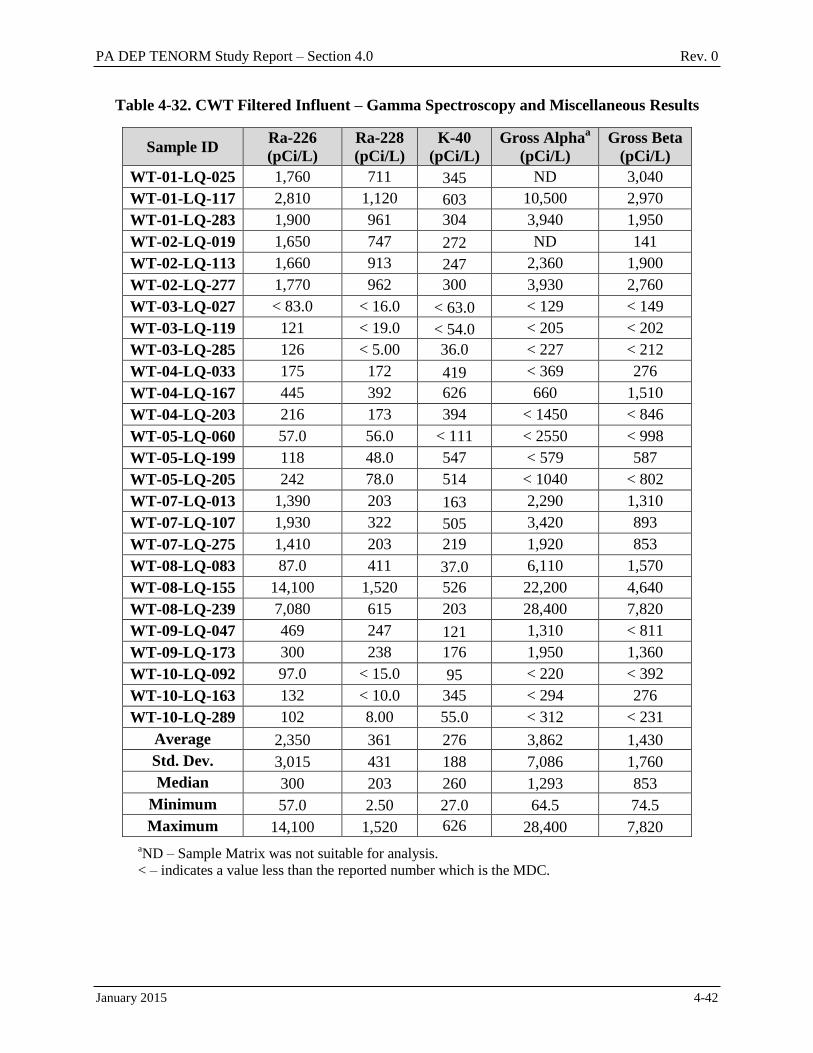
PA DEP TENORM Study Report – Section 4.0 Rev. 0
January 2015 4-42
Table 4-32. CWT Filtered Influent – Gamma Spectroscopy and Miscellaneous Results
Sample ID Ra-226
(pCi/L)
Ra-228
(pCi/L)
K-40
(pCi/L)
Gross Alphaa
(pCi/L)
Gross Beta
(pCi/L)
WT-01-LQ-025 1,760 711 345 ND 3,040
WT-01-LQ-117 2,810 1,120 603 10,500 2,970
WT-01-LQ-283 1,900 961 304 3,940 1,950
WT-02-LQ-019 1,650 747 272 ND 141
WT-02-LQ-113 1,660 913 247 2,360 1,900
WT-02-LQ-277 1,770 962 300 3,930 2,760
WT-03-LQ-027 < 83.0 < 16.0 < 63.0 < 129 < 149
WT-03-LQ-119 121 < 19.0 < 54.0 < 205 < 202
WT-03-LQ-285 126 < 5.00 36.0 < 227 < 212
WT-04-LQ-033 175 172 419 < 369 276
WT-04-LQ-167 445 392 626 660 1,510
WT-04-LQ-203 216 173 394 < 1450 < 846
WT-05-LQ-060 57.0 56.0 < 111 < 2550 < 998
WT-05-LQ-199 118 48.0 547 < 579 587
WT-05-LQ-205 242 78.0 514 < 1040 < 802
WT-07-LQ-013 1,390 203 163 2,290 1,310
WT-07-LQ-107 1,930 322 505 3,420 893
WT-07-LQ-275 1,410 203 219 1,920 853
WT-08-LQ-083 87.0 411 37.0 6,110 1,570
WT-08-LQ-155 14,100 1,520 526 22,200 4,640
WT-08-LQ-239 7,080 615 203 28,400 7,820
WT-09-LQ-047 469 247 121 1,310 < 811
WT-09-LQ-173 300 238 176 1,950 1,360
WT-10-LQ-092 97.0 < 15.0 95 < 220 < 392
WT-10-LQ-163 132 < 10.0 345 < 294 276
WT-10-LQ-289 102 8.00 55.0 < 312 < 231
Average 2,350 361 276 3,862 1,430
Std. Dev. 3,015 431 188 7,086 1,760
Median 300 203 260 1,293 853
Minimum 57.0 2.50 27.0 64.5 74.5
Maximum 14,100 1,520 626 28,400 7,820
aND – Sample Matrix was not suitable for analysis.
< – indicates a value less than the reported number which is the MDC.
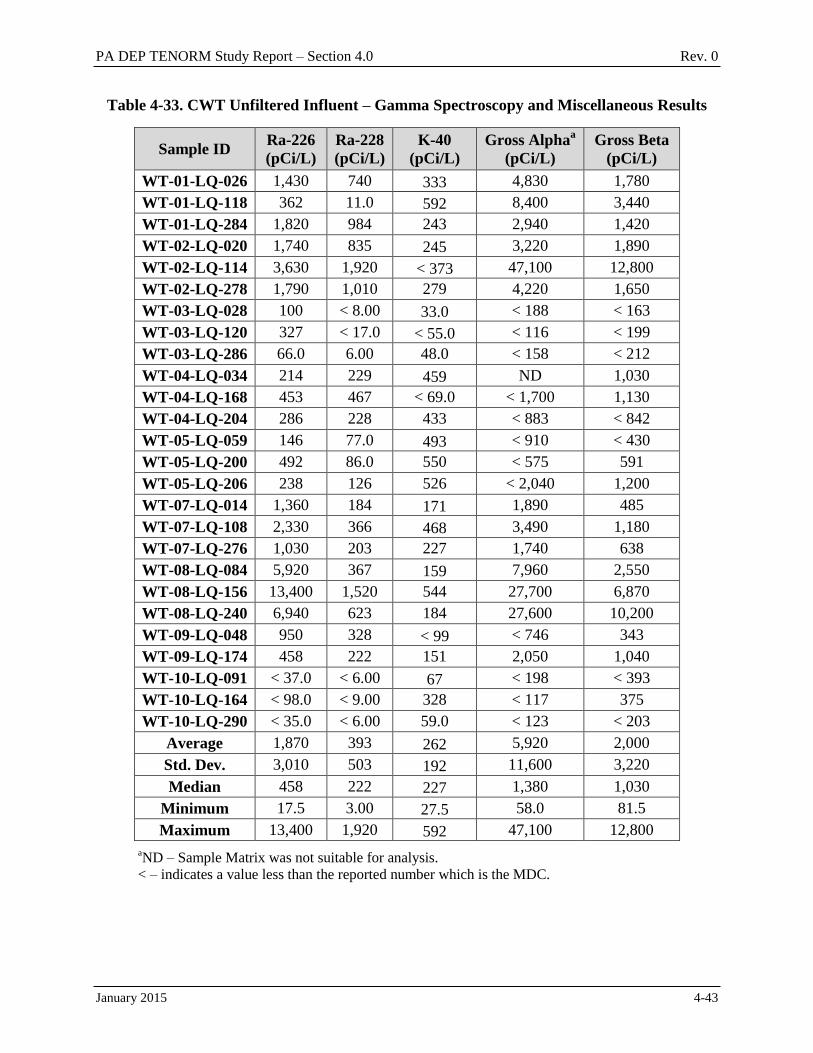
PA DEP TENORM Study Report – Section 4.0 Rev. 0
January 2015 4-43
Table 4-33. CWT Unfiltered Influent – Gamma Spectroscopy and Miscellaneous Results
Sample ID Ra-226
(pCi/L)
Ra-228
(pCi/L)
K-40
(pCi/L)
Gross Alphaa
(pCi/L)
Gross Beta
(pCi/L)
WT-01-LQ-026 1,430 740 333 4,830 1,780
WT-01-LQ-118 362 11.0 592 8,400 3,440
WT-01-LQ-284 1,820 984 243 2,940 1,420
WT-02-LQ-020 1,740 835 245 3,220 1,890
WT-02-LQ-114 3,630 1,920 < 373 47,100 12,800
WT-02-LQ-278 1,790 1,010 279 4,220 1,650
WT-03-LQ-028 100 < 8.00 33.0 < 188 < 163
WT-03-LQ-120 327 < 17.0 < 55.0 < 116 < 199
WT-03-LQ-286 66.0 6.00 48.0 < 158 < 212
WT-04-LQ-034 214 229 459 ND 1,030
WT-04-LQ-168 453 467 < 69.0 < 1,700 1,130
WT-04-LQ-204 286 228 433 < 883 < 842
WT-05-LQ-059 146 77.0 493 < 910 < 430
WT-05-LQ-200 492 86.0 550 < 575 591
WT-05-LQ-206 238 126 526 < 2,040 1,200
WT-07-LQ-014 1,360 184 171 1,890 485
WT-07-LQ-108 2,330 366 468 3,490 1,180
WT-07-LQ-276 1,030 203 227 1,740 638
WT-08-LQ-084 5,920 367 159 7,960 2,550
WT-08-LQ-156 13,400 1,520 544 27,700 6,870
WT-08-LQ-240 6,940 623 184 27,600 10,200
WT-09-LQ-048 950 328 < 99 < 746 343
WT-09-LQ-174 458 222 151 2,050 1,040
WT-10-LQ-091 < 37.0 < 6.00 67 < 198 < 393
WT-10-LQ-164 < 98.0 < 9.00 328 < 117 375
WT-10-LQ-290 < 35.0 < 6.00 59.0 < 123 < 203
Average 1,870 393 262 5,920 2,000
Std. Dev. 3,010 503 192 11,600 3,220
Median 458 222 227 1,380 1,030
Minimum 17.5 3.00 27.5 58.0 81.5
Maximum 13,400 1,920 592 47,100 12,800
aND – Sample Matrix was not suitable for analysis.
< – indicates a value less than the reported number which is the MDC.
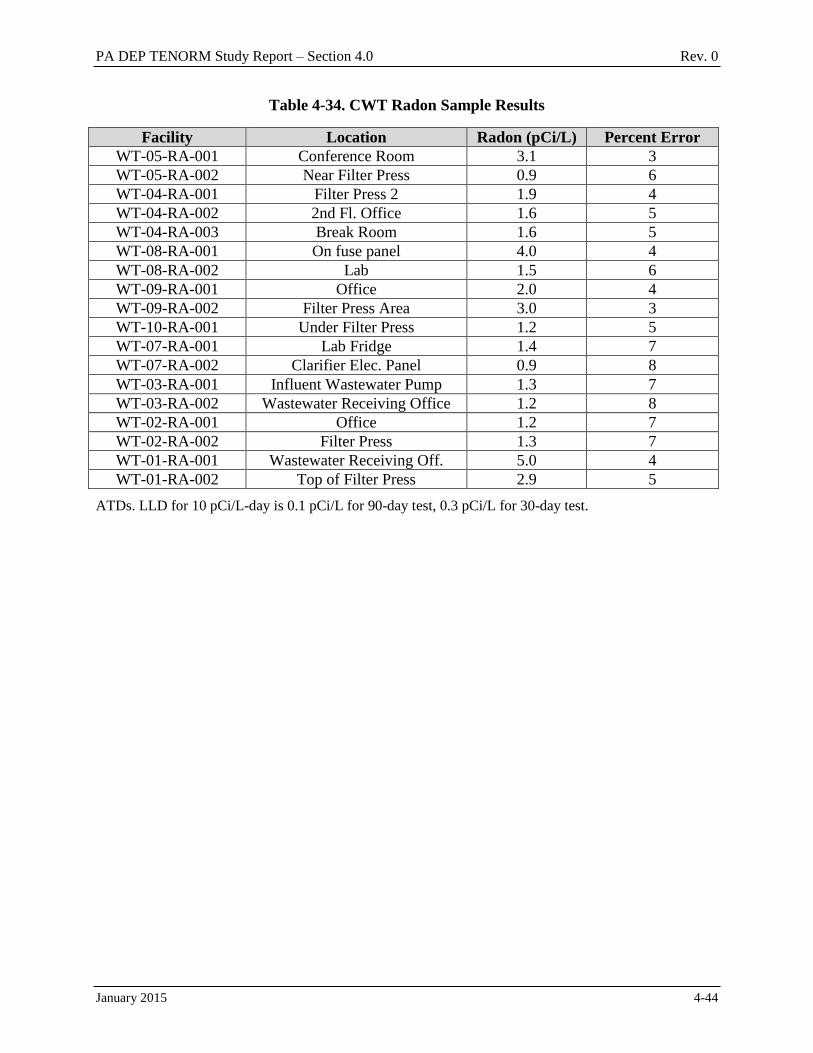
PA DEP TENORM Study Report – Section 4.0 Rev. 0
January 2015 4-44
Table 4-34. CWT Radon Sample Results
Facility Location Radon (pCi/L) Percent Error
WT-05-RA-001 Conference Room 3.1 3
WT-05-RA-002 Near Filter Press 0.9 6
WT-04-RA-001 Filter Press 2 1.9 4
WT-04-RA-002 2nd Fl. Office 1.6 5
WT-04-RA-003 Break Room 1.6 5
WT-08-RA-001 On fuse panel 4.0 4
WT-08-RA-002 Lab 1.5 6
WT-09-RA-001 Office 2.0 4
WT-09-RA-002 Filter Press Area 3.0 3
WT-10-RA-001 Under Filter Press 1.2 5
WT-07-RA-001 Lab Fridge 1.4 7
WT-07-RA-002 Clarifier Elec. Panel 0.9 8
WT-03-RA-001 Influent Wastewater Pump 1.3 7
WT-03-RA-002 Wastewater Receiving Office 1.2 8
WT-02-RA-001 Office 1.2 7
WT-02-RA-002 Filter Press 1.3 7
WT-01-RA-001 Wastewater Receiving Off. 5.0 4
WT-01-RA-002 Top of Filter Press 2.9 5
ATDs. LLD for 10 pCi/L-day is 0.1 pCi/L for 90-day test, 0.3 pCi/L for 30-day test.
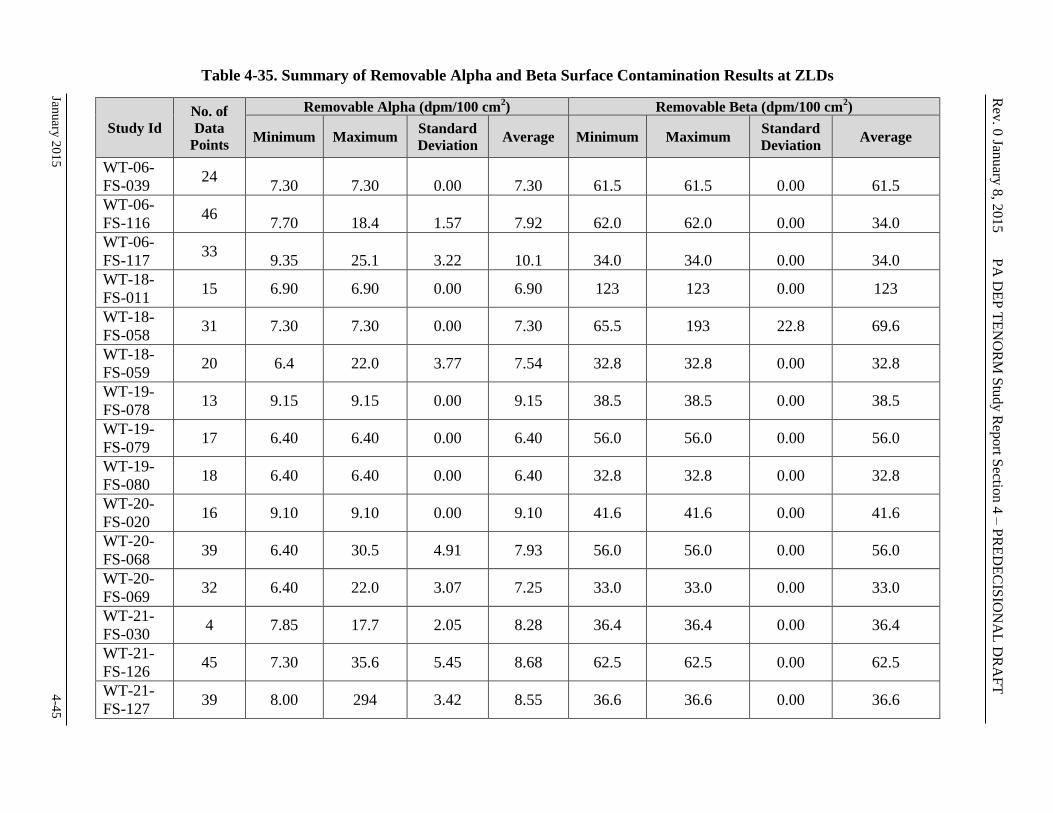
January
20
15
4
-45
Rev
. 0 Jan
uary
8, 2
015 P
A D
EP
TE
NO
RM
Stu
dy R
eport S
ection
4 –
PR
ED
EC
ISIO
NA
L D
RA
FT
Table 4-35. Summary of Removable Alpha and Beta Surface Contamination Results at ZLDs
Study Id
No. of
Data
Points
Removable Alpha (dpm/100 cm2) Removable Beta (dpm/100 cm
2)
Minimum Maximum Standard
Deviation Average Minimum Maximum
Standard
Deviation Average
WT-06-
FS-039 24
7.30 7.30 0.00 7.30 61.5 61.5 0.00 61.5
WT-06-
FS-116 46
7.70 18.4 1.57 7.92 62.0 62.0 0.00 34.0
WT-06-
FS-117 33
9.35 25.1 3.22 10.1 34.0 34.0 0.00 34.0
WT-18-
FS-011 15 6.90 6.90 0.00 6.90 123 123 0.00 123
WT-18-
FS-058 31 7.30 7.30 0.00 7.30 65.5 193 22.8 69.6
WT-18-
FS-059 20 6.4 22.0 3.77 7.54 32.8 32.8 0.00 32.8
WT-19-
FS-078 13 9.15 9.15 0.00 9.15 38.5 38.5 0.00 38.5
WT-19-
FS-079 17 6.40 6.40 0.00 6.40 56.0 56.0 0.00 56.0
WT-19-
FS-080 18 6.40 6.40 0.00 6.40 32.8 32.8 0.00 32.8
WT-20-
FS-020 16 9.10 9.10 0.00 9.10 41.6 41.6 0.00 41.6
WT-20-
FS-068 39 6.40 30.5 4.91 7.93 56.0 56.0 0.00 56.0
WT-20-
FS-069 32 6.40 22.0 3.07 7.25 33.0 33.0 0.00 33.0
WT-21-
FS-030 4 7.85 17.7 2.05 8.28 36.4 36.4 0.00 36.4
WT-21-
FS-126 45 7.30 35.6 5.45 8.68 62.5 62.5 0.00 62.5
WT-21-
FS-127 39 8.00 294 3.42 8.55 36.6 36.6 0.00 36.6
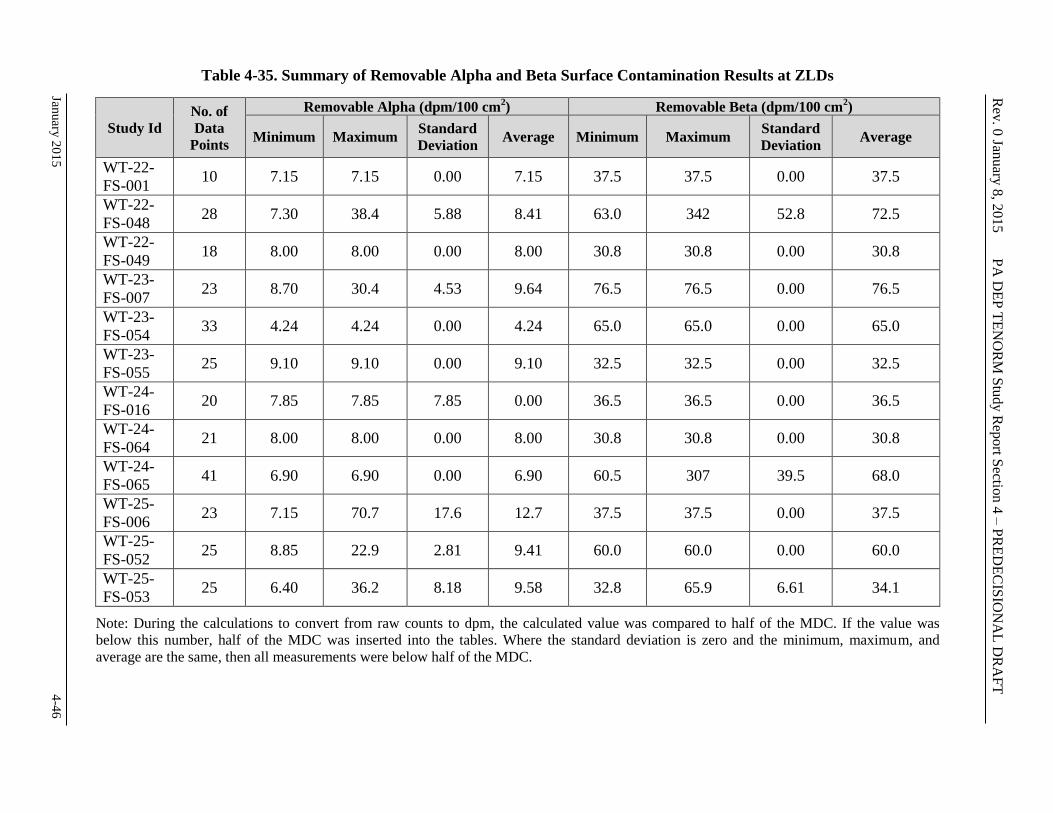
January
20
15
4
-46
Rev
. 0 Jan
uary
8, 2
015 P
A D
EP
TE
NO
RM
Stu
dy R
eport S
ection
4 –
PR
ED
EC
ISIO
NA
L D
RA
FT
Table 4-35. Summary of Removable Alpha and Beta Surface Contamination Results at ZLDs
Study Id
No. of
Data
Points
Removable Alpha (dpm/100 cm2) Removable Beta (dpm/100 cm
2)
Minimum Maximum Standard
Deviation Average Minimum Maximum
Standard
Deviation Average
WT-22-
FS-001 10 7.15 7.15 0.00 7.15 37.5 37.5 0.00 37.5
WT-22-
FS-048 28 7.30 38.4 5.88 8.41 63.0 342 52.8 72.5
WT-22-
FS-049 18 8.00 8.00 0.00 8.00 30.8 30.8 0.00 30.8
WT-23-
FS-007 23 8.70 30.4 4.53 9.64 76.5 76.5 0.00 76.5
WT-23-
FS-054 33 4.24 4.24 0.00 4.24 65.0 65.0 0.00 65.0
WT-23-
FS-055 25 9.10 9.10 0.00 9.10 32.5 32.5 0.00 32.5
WT-24-
FS-016 20 7.85 7.85 7.85 0.00 36.5 36.5 0.00 36.5
WT-24-
FS-064 21 8.00 8.00 0.00 8.00 30.8 30.8 0.00 30.8
WT-24-
FS-065 41 6.90 6.90 0.00 6.90 60.5 307 39.5 68.0
WT-25-
FS-006 23 7.15 70.7 17.6 12.7 37.5 37.5 0.00 37.5
WT-25-
FS-052 25 8.85 22.9 2.81 9.41 60.0 60.0 0.00 60.0
WT-25-
FS-053 25 6.40 36.2 8.18 9.58 32.8 65.9 6.61 34.1
Note: During the calculations to convert from raw counts to dpm, the calculated value was compared to half of the MDC. If the value was
below this number, half of the MDC was inserted into the tables. Where the standard deviation is zero and the minimum, maximum, and
average are the same, then all measurements were below half of the MDC.
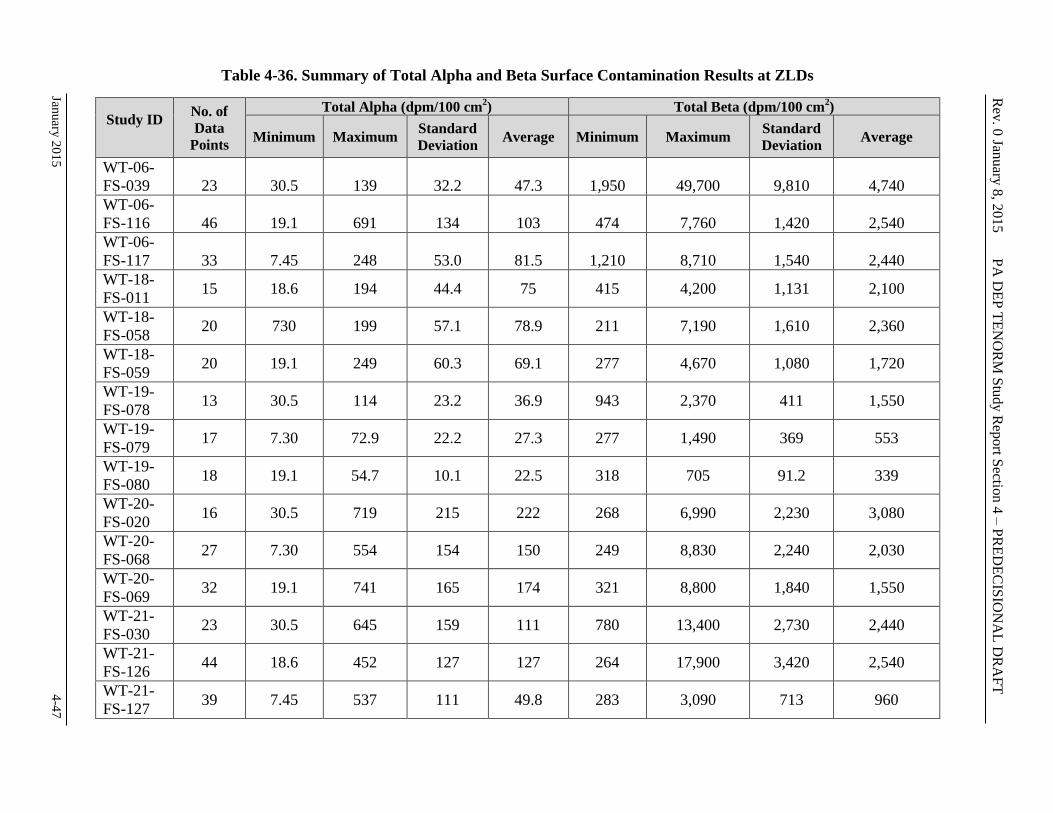
January
20
15
4
-47
Rev
. 0 Jan
uary
8, 2
015 P
A D
EP
TE
NO
RM
Stu
dy R
eport S
ection
4 –
PR
ED
EC
ISIO
NA
L D
RA
FT
Table 4-36. Summary of Total Alpha and Beta Surface Contamination Results at ZLDs
Study ID
No. of
Data
Points
Total Alpha (dpm/100 cm2) Total Beta (dpm/100 cm
2)
Minimum Maximum Standard
Deviation Average Minimum Maximum
Standard
Deviation Average
WT-06-
FS-039 23 30.5 139 32.2 47.3 1,950 49,700 9,810 4,740
WT-06-
FS-116 46 19.1 691 134 103 474 7,760 1,420 2,540
WT-06-
FS-117 33 7.45 248 53.0 81.5 1,210 8,710 1,540 2,440
WT-18-
FS-011 15 18.6 194 44.4 75 415 4,200 1,131 2,100
WT-18-
FS-058 20 730 199 57.1 78.9 211 7,190 1,610 2,360
WT-18-
FS-059 20 19.1 249 60.3 69.1 277 4,670 1,080 1,720
WT-19-
FS-078 13 30.5 114 23.2 36.9 943 2,370 411 1,550
WT-19-
FS-079 17 7.30 72.9 22.2 27.3 277 1,490 369 553
WT-19-
FS-080 18 19.1 54.7 10.1 22.5 318 705 91.2 339
WT-20-
FS-020 16 30.5 719 215 222 268 6,990 2,230 3,080
WT-20-
FS-068 27 7.30 554 154 150 249 8,830 2,240 2,030
WT-20-
FS-069 32 19.1 741 165 174 321 8,800 1,840 1,550
WT-21-
FS-030 23 30.5 645 159 111 780 13,400 2,730 2,440
WT-21-
FS-126 44 18.6 452 127 127 264 17,900 3,420 2,540
WT-21-
FS-127 39 7.45 537 111 49.8 283 3,090 713 960

January
20
15
4
-48
Rev
. 0 Jan
uary
8, 2
015 P
A D
EP
TE
NO
RM
Stu
dy R
eport S
ection
4 –
PR
ED
EC
ISIO
NA
L D
RA
FT
Table 4-36. Summary of Total Alpha and Beta Surface Contamination Results at ZLDs
Study ID
No. of
Data
Points
Total Alpha (dpm/100 cm2) Total Beta (dpm/100 cm
2)
Minimum Maximum Standard
Deviation Average Minimum Maximum
Standard
Deviation Average
WT-22-
FS-001 10 30.5 273 87.0 85.2 269 3,180 1,050 1,620
WT-22-
FS-048 28 7.30 836 226 133 249 15,500 3,290 2,080
WT-22-
FS-049 18 19.1 1,410 350 239 265 6,380 1,640 1,730
WT-23-
FS-007 25 7.45 273 73.1 83.5 313 6,230 1,380 1,550
WT-23-
FS-054 32 18.6 72.9 14.6 25.1 250 2,660 537 920
WT-23-
FS-055 25 7.45 193 43.3 43.1 313 4,520 905 927
WT-24-
FS-016 20 305 466 123 107 268 4,420 977 2,150
WT-24-
FS-064 21 7.45 711 187 125 288 4,380 980 1,060
WT-24-
FS-065 41 18.6 476 90.8 69.2 260 9,410 1,530 985
WT-25-
FS-006 13 30.5 213 55.4 89.5 802 3,980 921 1,660
WT-25-
FS-052 25 7.45 373 109 97.3 307 3,820 1,040 1,120
WT-25-
FS-053 24 19.1 433 97.9 81.7 321 4,900 1,140 893
Note: During the calculations to convert from raw counts to dpm, the calculated value was compared to half of the MDC. If the value was
below this number, half of the MDC was inserted into the tables. Where the standard deviation is zero and the minimum, maximum, and
average are the same, then all measurements were below half of the MDC.
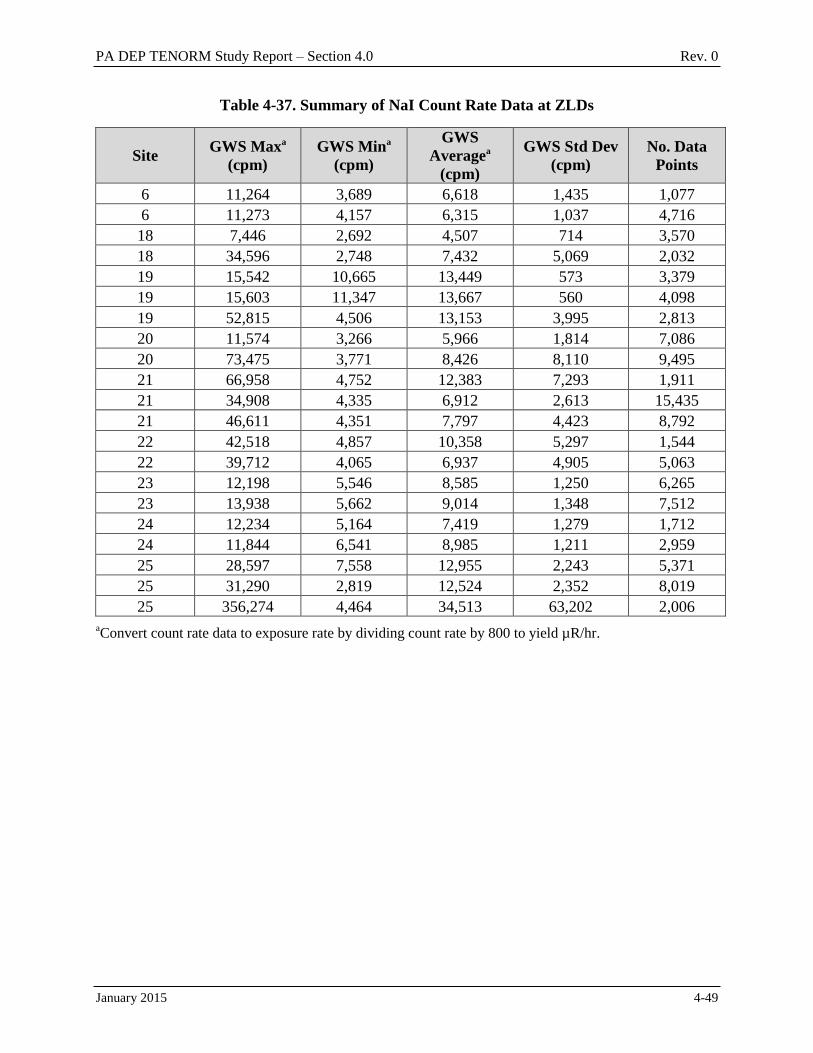
PA DEP TENORM Study Report – Section 4.0 Rev. 0
January 2015 4-49
Table 4-37. Summary of NaI Count Rate Data at ZLDs
Site GWS Maxa
(cpm)
GWS Mina
(cpm)
GWS
Averagea
(cpm)
GWS Std Dev
(cpm)
No. Data
Points
6 11,264 3,689 6,618 1,435 1,077
6 11,273 4,157 6,315 1,037 4,716
18 7,446 2,692 4,507 714 3,570
18 34,596 2,748 7,432 5,069 2,032
19 15,542 10,665 13,449 573 3,379
19 15,603 11,347 13,667 560 4,098
19 52,815 4,506 13,153 3,995 2,813
20 11,574 3,266 5,966 1,814 7,086
20 73,475 3,771 8,426 8,110 9,495
21 66,958 4,752 12,383 7,293 1,911
21 34,908 4,335 6,912 2,613 15,435
21 46,611 4,351 7,797 4,423 8,792
22 42,518 4,857 10,358 5,297 1,544
22 39,712 4,065 6,937 4,905 5,063
23 12,198 5,546 8,585 1,250 6,265
23 13,938 5,662 9,014 1,348 7,512
24 12,234 5,164 7,419 1,279 1,712
24 11,844 6,541 8,985 1,211 2,959
25 28,597 7,558 12,955 2,243 5,371
25 31,290 2,819 12,524 2,352 8,019
25 356,274 4,464 34,513 63,202 2,006
aConvert count rate data to exposure rate by dividing count rate by 800 to yield µR/hr.
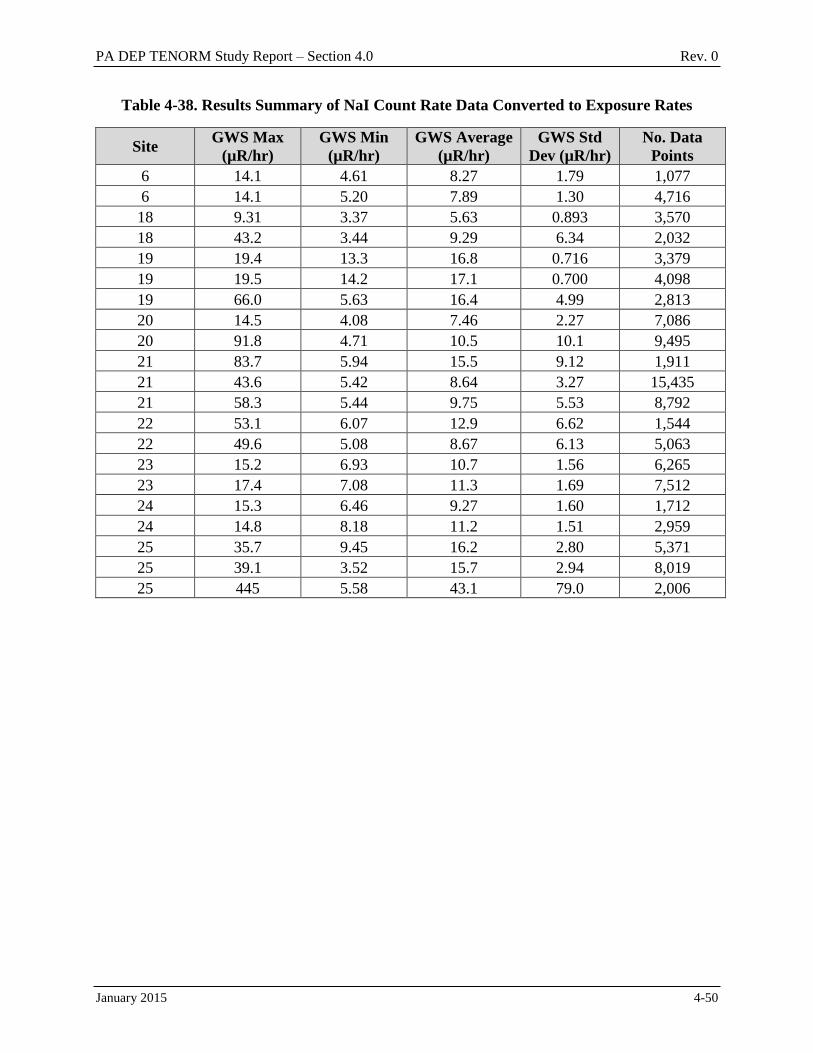
PA DEP TENORM Study Report – Section 4.0 Rev. 0
January 2015 4-50
Table 4-38. Results Summary of NaI Count Rate Data Converted to Exposure Rates
Site GWS Max
(µR/hr)
GWS Min
(µR/hr)
GWS Average
(µR/hr)
GWS Std
Dev (µR/hr)
No. Data
Points
6 14.1 4.61 8.27 1.79 1,077
6 14.1 5.20 7.89 1.30 4,716
18 9.31 3.37 5.63 0.893 3,570
18 43.2 3.44 9.29 6.34 2,032
19 19.4 13.3 16.8 0.716 3,379
19 19.5 14.2 17.1 0.700 4,098
19 66.0 5.63 16.4 4.99 2,813
20 14.5 4.08 7.46 2.27 7,086
20 91.8 4.71 10.5 10.1 9,495
21 83.7 5.94 15.5 9.12 1,911
21 43.6 5.42 8.64 3.27 15,435
21 58.3 5.44 9.75 5.53 8,792
22 53.1 6.07 12.9 6.62 1,544
22 49.6 5.08 8.67 6.13 5,063
23 15.2 6.93 10.7 1.56 6,265
23 17.4 7.08 11.3 1.69 7,512
24 15.3 6.46 9.27 1.60 1,712
24 14.8 8.18 11.2 1.51 2,959
25 35.7 9.45 16.2 2.80 5,371
25 39.1 3.52 15.7 2.94 8,019
25 445 5.58 43.1 79.0 2,006
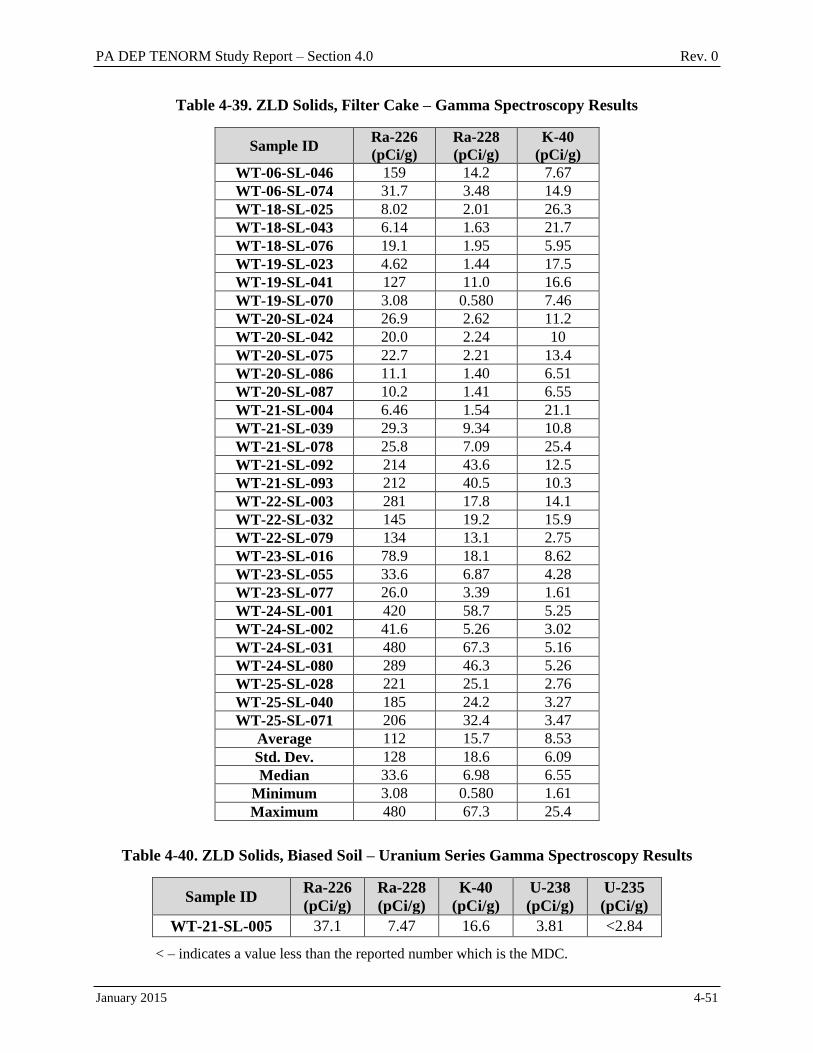
PA DEP TENORM Study Report – Section 4.0 Rev. 0
January 2015 4-51
Table 4-39. ZLD Solids, Filter Cake – Gamma Spectroscopy Results
Sample ID Ra-226
(pCi/g)
Ra-228
(pCi/g)
K-40
(pCi/g)
WT-06-SL-046 159 14.2 7.67
WT-06-SL-074 31.7 3.48 14.9
WT-18-SL-025 8.02 2.01 26.3
WT-18-SL-043 6.14 1.63 21.7
WT-18-SL-076 19.1 1.95 5.95
WT-19-SL-023 4.62 1.44 17.5
WT-19-SL-041 127 11.0 16.6
WT-19-SL-070 3.08 0.580 7.46
WT-20-SL-024 26.9 2.62 11.2
WT-20-SL-042 20.0 2.24 10
WT-20-SL-075 22.7 2.21 13.4
WT-20-SL-086 11.1 1.40 6.51
WT-20-SL-087 10.2 1.41 6.55
WT-21-SL-004 6.46 1.54 21.1
WT-21-SL-039 29.3 9.34 10.8
WT-21-SL-078 25.8 7.09 25.4
WT-21-SL-092 214 43.6 12.5
WT-21-SL-093 212 40.5 10.3
WT-22-SL-003 281 17.8 14.1
WT-22-SL-032 145 19.2 15.9
WT-22-SL-079 134 13.1 2.75
WT-23-SL-016 78.9 18.1 8.62
WT-23-SL-055 33.6 6.87 4.28
WT-23-SL-077 26.0 3.39 1.61
WT-24-SL-001 420 58.7 5.25
WT-24-SL-002 41.6 5.26 3.02
WT-24-SL-031 480 67.3 5.16
WT-24-SL-080 289 46.3 5.26
WT-25-SL-028 221 25.1 2.76
WT-25-SL-040 185 24.2 3.27
WT-25-SL-071 206 32.4 3.47
Average 112 15.7 8.53
Std. Dev. 128 18.6 6.09
Median 33.6 6.98 6.55
Minimum 3.08 0.580 1.61
Maximum 480 67.3 25.4
Table 4-40. ZLD Solids, Biased Soil – Uranium Series Gamma Spectroscopy Results
Sample ID Ra-226
(pCi/g)
Ra-228
(pCi/g)
K-40
(pCi/g)
U-238
(pCi/g)
U-235
(pCi/g)
WT-21-SL-005 37.1 7.47 16.6 3.81 <2.84
< – indicates a value less than the reported number which is the MDC.
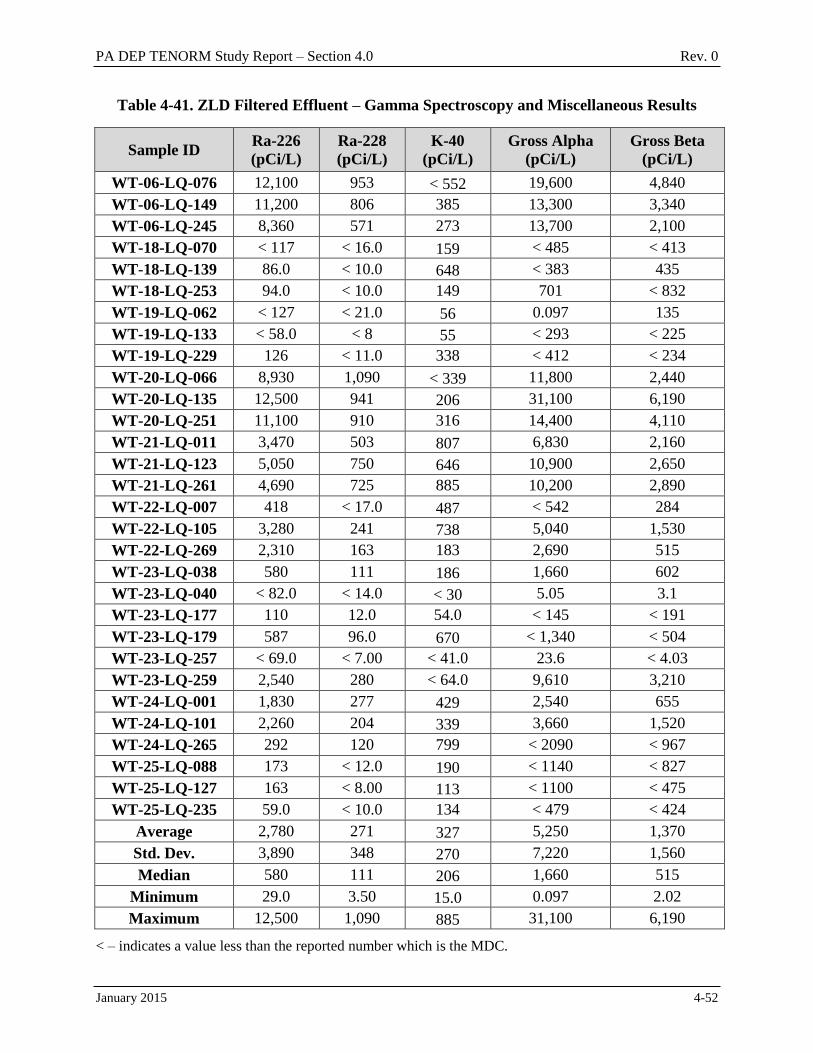
PA DEP TENORM Study Report – Section 4.0 Rev. 0
January 2015 4-52
Table 4-41. ZLD Filtered Effluent – Gamma Spectroscopy and Miscellaneous Results
Sample ID Ra-226
(pCi/L)
Ra-228
(pCi/L)
K-40
(pCi/L)
Gross Alpha
(pCi/L)
Gross Beta
(pCi/L)
WT-06-LQ-076 12,100 953 < 552 19,600 4,840
WT-06-LQ-149 11,200 806 385 13,300 3,340
WT-06-LQ-245 8,360 571 273 13,700 2,100
WT-18-LQ-070 < 117 < 16.0 159 < 485 < 413
WT-18-LQ-139 86.0 < 10.0 648 < 383 435
WT-18-LQ-253 94.0 < 10.0 149 701 < 832
WT-19-LQ-062 < 127 < 21.0 56 0.097 135
WT-19-LQ-133 < 58.0 < 8 55 < 293 < 225
WT-19-LQ-229 126 < 11.0 338 < 412 < 234
WT-20-LQ-066 8,930 1,090 < 339 11,800 2,440
WT-20-LQ-135 12,500 941 206 31,100 6,190
WT-20-LQ-251 11,100 910 316 14,400 4,110
WT-21-LQ-011 3,470 503 807 6,830 2,160
WT-21-LQ-123 5,050 750 646 10,900 2,650
WT-21-LQ-261 4,690 725 885 10,200 2,890
WT-22-LQ-007 418 < 17.0 487 < 542 284
WT-22-LQ-105 3,280 241 738 5,040 1,530
WT-22-LQ-269 2,310 163 183 2,690 515
WT-23-LQ-038 580 111 186 1,660 602
WT-23-LQ-040 < 82.0 < 14.0 < 30 5.05 3.1
WT-23-LQ-177 110 12.0 54.0 < 145 < 191
WT-23-LQ-179 587 96.0 670 < 1,340 < 504
WT-23-LQ-257 < 69.0 < 7.00 < 41.0 23.6 < 4.03
WT-23-LQ-259 2,540 280 < 64.0 9,610 3,210
WT-24-LQ-001 1,830 277 429 2,540 655
WT-24-LQ-101 2,260 204 339 3,660 1,520
WT-24-LQ-265 292 120 799 < 2090 < 967
WT-25-LQ-088 173 < 12.0 190 < 1140 < 827
WT-25-LQ-127 163 < 8.00 113 < 1100 < 475
WT-25-LQ-235 59.0 < 10.0 134 < 479 < 424
Average 2,780 271 327 5,250 1,370
Std. Dev. 3,890 348 270 7,220 1,560
Median 580 111 206 1,660 515
Minimum 29.0 3.50 15.0 0.097 2.02
Maximum 12,500 1,090 885 31,100 6,190
< – indicates a value less than the reported number which is the MDC.
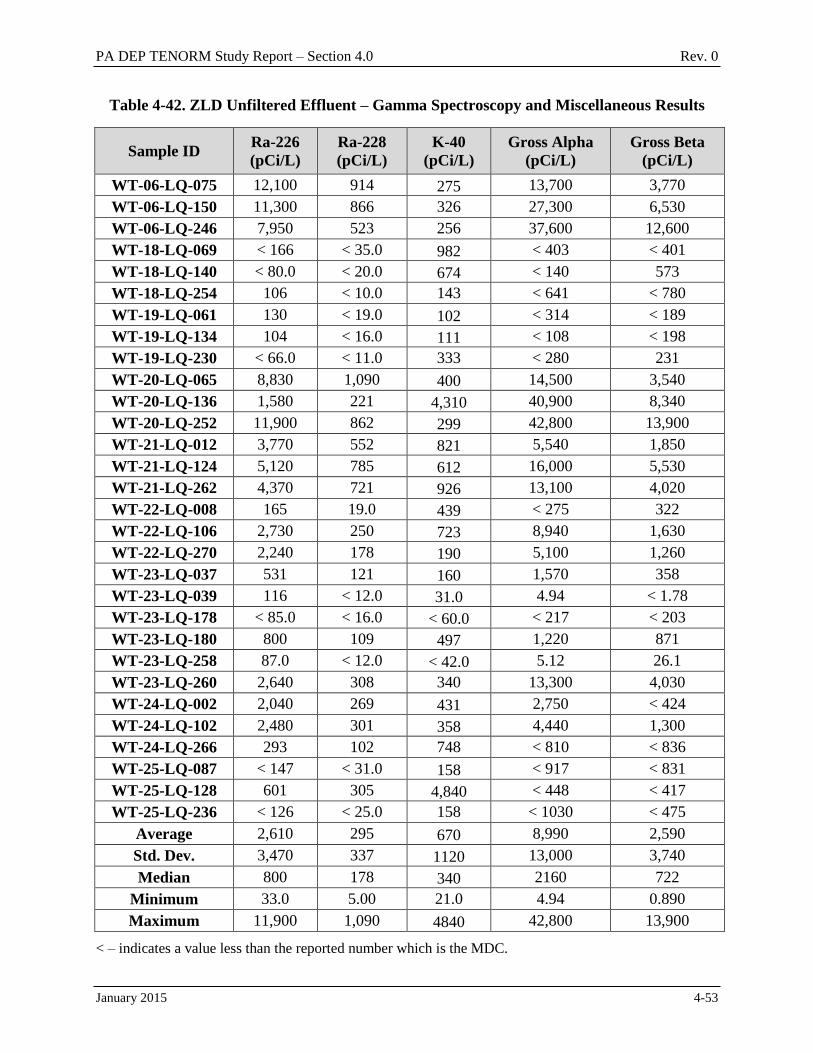
PA DEP TENORM Study Report – Section 4.0 Rev. 0
January 2015 4-53
Table 4-42. ZLD Unfiltered Effluent – Gamma Spectroscopy and Miscellaneous Results
Sample ID Ra-226
(pCi/L)
Ra-228
(pCi/L)
K-40
(pCi/L)
Gross Alpha
(pCi/L)
Gross Beta
(pCi/L)
WT-06-LQ-075 12,100 914 275 13,700 3,770
WT-06-LQ-150 11,300 866 326 27,300 6,530
WT-06-LQ-246 7,950 523 256 37,600 12,600
WT-18-LQ-069 < 166 < 35.0 982 < 403 < 401
WT-18-LQ-140 < 80.0 < 20.0 674 < 140 573
WT-18-LQ-254 106 < 10.0 143 < 641 < 780
WT-19-LQ-061 130 < 19.0 102 < 314 < 189
WT-19-LQ-134 104 < 16.0 111 < 108 < 198
WT-19-LQ-230 < 66.0 < 11.0 333 < 280 231
WT-20-LQ-065 8,830 1,090 400 14,500 3,540
WT-20-LQ-136 1,580 221 4,310 40,900 8,340
WT-20-LQ-252 11,900 862 299 42,800 13,900
WT-21-LQ-012 3,770 552 821 5,540 1,850
WT-21-LQ-124 5,120 785 612 16,000 5,530
WT-21-LQ-262 4,370 721 926 13,100 4,020
WT-22-LQ-008 165 19.0 439 < 275 322
WT-22-LQ-106 2,730 250 723 8,940 1,630
WT-22-LQ-270 2,240 178 190 5,100 1,260
WT-23-LQ-037 531 121 160 1,570 358
WT-23-LQ-039 116 < 12.0 31.0 4.94 < 1.78
WT-23-LQ-178 < 85.0 < 16.0 < 60.0 < 217 < 203
WT-23-LQ-180 800 109 497 1,220 871
WT-23-LQ-258 87.0 < 12.0 < 42.0 5.12 26.1
WT-23-LQ-260 2,640 308 340 13,300 4,030
WT-24-LQ-002 2,040 269 431 2,750 < 424
WT-24-LQ-102 2,480 301 358 4,440 1,300
WT-24-LQ-266 293 102 748 < 810 < 836
WT-25-LQ-087 < 147 < 31.0 158 < 917 < 831
WT-25-LQ-128 601 305 4,840 < 448 < 417
WT-25-LQ-236 < 126 < 25.0 158 < 1030 < 475
Average 2,610 295 670 8,990 2,590
Std. Dev. 3,470 337 1120 13,000 3,740
Median 800 178 340 2160 722
Minimum 33.0 5.00 21.0 4.94 0.890
Maximum 11,900 1,090 4840 42,800 13,900
< – indicates a value less than the reported number which is the MDC.
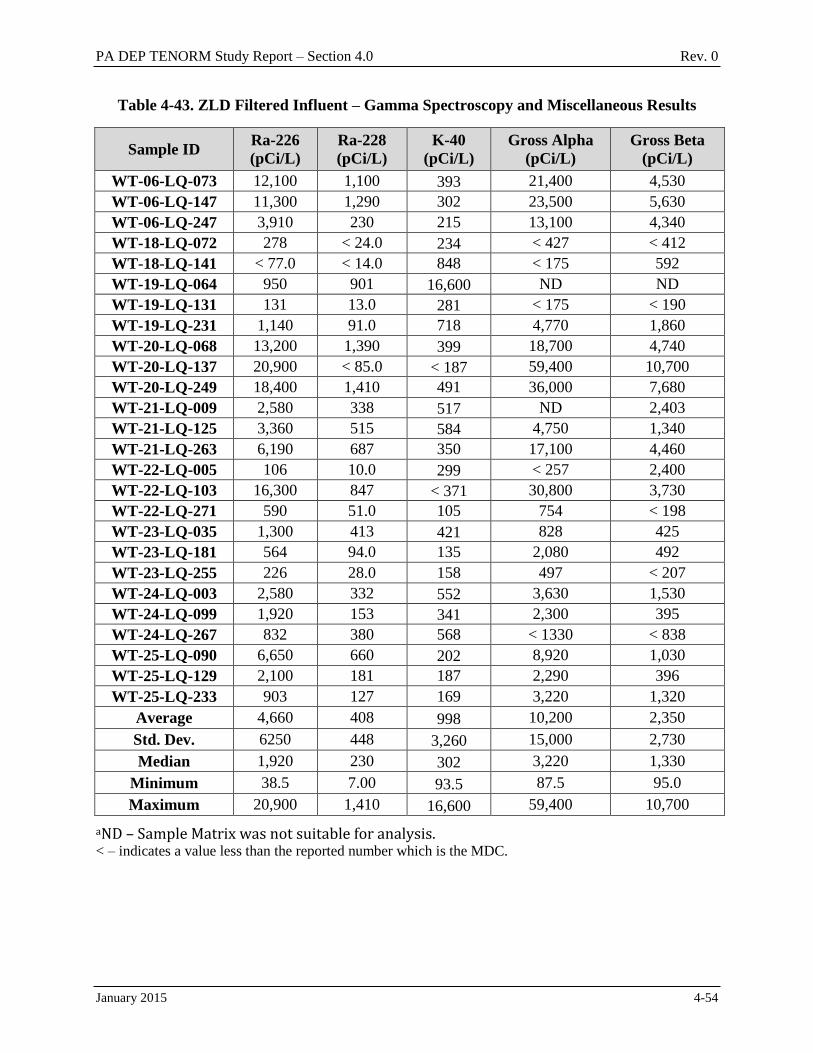
PA DEP TENORM Study Report – Section 4.0 Rev. 0
January 2015 4-54
Table 4-43. ZLD Filtered Influent – Gamma Spectroscopy and Miscellaneous Results
Sample ID Ra-226
(pCi/L)
Ra-228
(pCi/L)
K-40
(pCi/L)
Gross Alpha
(pCi/L)
Gross Beta
(pCi/L)
WT-06-LQ-073 12,100 1,100 393 21,400 4,530
WT-06-LQ-147 11,300 1,290 302 23,500 5,630
WT-06-LQ-247 3,910 230 215 13,100 4,340
WT-18-LQ-072 278 < 24.0 234 < 427 < 412
WT-18-LQ-141 < 77.0 < 14.0 848 < 175 592
WT-19-LQ-064 950 901 16,600 ND ND
WT-19-LQ-131 131 13.0 281 < 175 < 190
WT-19-LQ-231 1,140 91.0 718 4,770 1,860
WT-20-LQ-068 13,200 1,390 399 18,700 4,740
WT-20-LQ-137 20,900 < 85.0 < 187 59,400 10,700
WT-20-LQ-249 18,400 1,410 491 36,000 7,680
WT-21-LQ-009 2,580 338 517 ND 2,403
WT-21-LQ-125 3,360 515 584 4,750 1,340
WT-21-LQ-263 6,190 687 350 17,100 4,460
WT-22-LQ-005 106 10.0 299 < 257 2,400
WT-22-LQ-103 16,300 847 < 371 30,800 3,730
WT-22-LQ-271 590 51.0 105 754 < 198
WT-23-LQ-035 1,300 413 421 828 425
WT-23-LQ-181 564 94.0 135 2,080 492
WT-23-LQ-255 226 28.0 158 497 < 207
WT-24-LQ-003 2,580 332 552 3,630 1,530
WT-24-LQ-099 1,920 153 341 2,300 395
WT-24-LQ-267 832 380 568 < 1330 < 838
WT-25-LQ-090 6,650 660 202 8,920 1,030
WT-25-LQ-129 2,100 181 187 2,290 396
WT-25-LQ-233 903 127 169 3,220 1,320
Average 4,660 408 998 10,200 2,350
Std. Dev. 6250 448 3,260 15,000 2,730
Median 1,920 230 302 3,220 1,330
Minimum 38.5 7.00 93.5 87.5 95.0
Maximum 20,900 1,410 16,600 59,400 10,700
aND – Sample Matrix was not suitable for analysis. < – indicates a value less than the reported number which is the MDC.
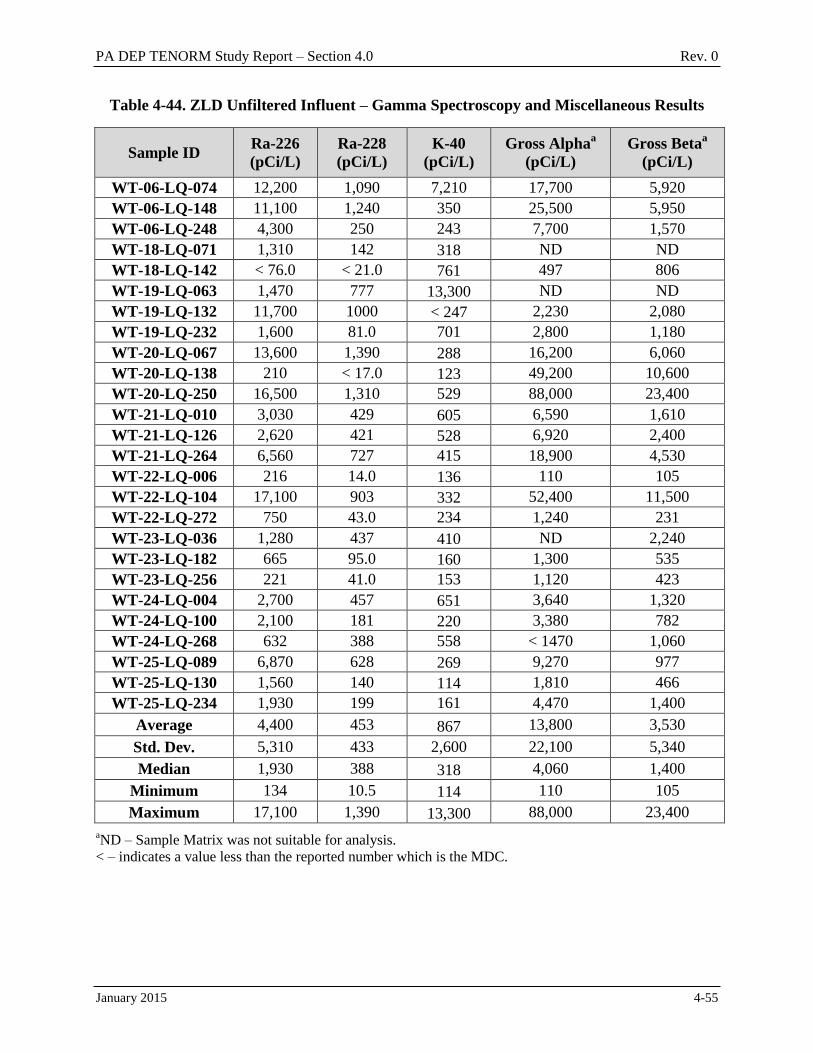
PA DEP TENORM Study Report – Section 4.0 Rev. 0
January 2015 4-55
Table 4-44. ZLD Unfiltered Influent – Gamma Spectroscopy and Miscellaneous Results
Sample ID Ra-226
(pCi/L)
Ra-228
(pCi/L)
K-40
(pCi/L)
Gross Alphaa
(pCi/L)
Gross Betaa
(pCi/L)
WT-06-LQ-074 12,200 1,090 7,210 17,700 5,920
WT-06-LQ-148 11,100 1,240 350 25,500 5,950
WT-06-LQ-248 4,300 250 243 7,700 1,570
WT-18-LQ-071 1,310 142 318 ND ND
WT-18-LQ-142 < 76.0 < 21.0 761 497 806
WT-19-LQ-063 1,470 777 13,300 ND ND
WT-19-LQ-132 11,700 1000 < 247 2,230 2,080
WT-19-LQ-232 1,600 81.0 701 2,800 1,180
WT-20-LQ-067 13,600 1,390 288 16,200 6,060
WT-20-LQ-138 210 < 17.0 123 49,200 10,600
WT-20-LQ-250 16,500 1,310 529 88,000 23,400
WT-21-LQ-010 3,030 429 605 6,590 1,610
WT-21-LQ-126 2,620 421 528 6,920 2,400
WT-21-LQ-264 6,560 727 415 18,900 4,530
WT-22-LQ-006 216 14.0 136 110 105
WT-22-LQ-104 17,100 903 332 52,400 11,500
WT-22-LQ-272 750 43.0 234 1,240 231
WT-23-LQ-036 1,280 437 410 ND 2,240
WT-23-LQ-182 665 95.0 160 1,300 535
WT-23-LQ-256 221 41.0 153 1,120 423
WT-24-LQ-004 2,700 457 651 3,640 1,320
WT-24-LQ-100 2,100 181 220 3,380 782
WT-24-LQ-268 632 388 558 < 1470 1,060
WT-25-LQ-089 6,870 628 269 9,270 977
WT-25-LQ-130 1,560 140 114 1,810 466
WT-25-LQ-234 1,930 199 161 4,470 1,400
Average 4,400 453 867 13,800 3,530
Std. Dev. 5,310 433 2,600 22,100 5,340
Median 1,930 388 318 4,060 1,400
Minimum 134 10.5 114 110 105
Maximum 17,100 1,390 13,300 88,000 23,400
aND – Sample Matrix was not suitable for analysis.
< – indicates a value less than the reported number which is the MDC.
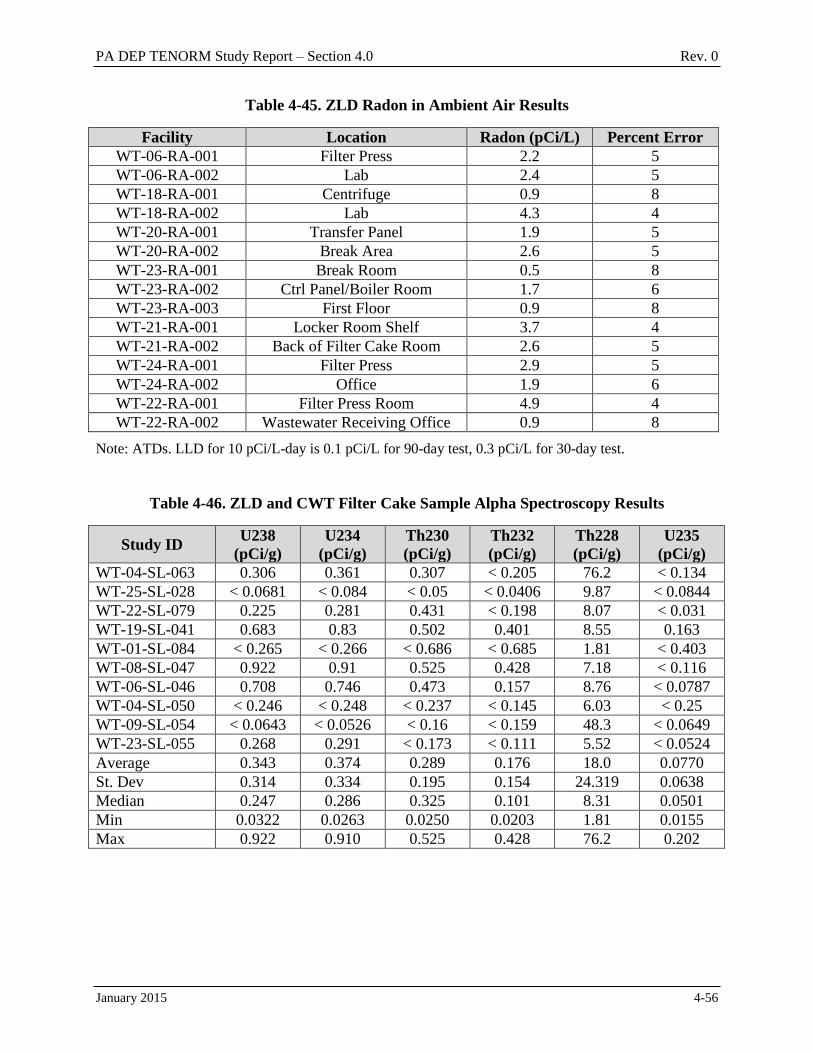
PA DEP TENORM Study Report – Section 4.0 Rev. 0
January 2015 4-56
Table 4-45. ZLD Radon in Ambient Air Results
Facility Location Radon (pCi/L) Percent Error
WT-06-RA-001 Filter Press 2.2 5
WT-06-RA-002 Lab 2.4 5
WT-18-RA-001 Centrifuge 0.9 8
WT-18-RA-002 Lab 4.3 4
WT-20-RA-001 Transfer Panel 1.9 5
WT-20-RA-002 Break Area 2.6 5
WT-23-RA-001 Break Room 0.5 8
WT-23-RA-002 Ctrl Panel/Boiler Room 1.7 6
WT-23-RA-003 First Floor 0.9 8
WT-21-RA-001 Locker Room Shelf 3.7 4
WT-21-RA-002 Back of Filter Cake Room 2.6 5
WT-24-RA-001 Filter Press 2.9 5
WT-24-RA-002 Office 1.9 6
WT-22-RA-001 Filter Press Room 4.9 4
WT-22-RA-002 Wastewater Receiving Office 0.9 8
Note: ATDs. LLD for 10 pCi/L-day is 0.1 pCi/L for 90-day test, 0.3 pCi/L for 30-day test.
Table 4-46. ZLD and CWT Filter Cake Sample Alpha Spectroscopy Results
Study ID U238
(pCi/g)
U234
(pCi/g)
Th230
(pCi/g)
Th232
(pCi/g)
Th228
(pCi/g)
U235
(pCi/g)
WT-04-SL-063 0.306 0.361 0.307 < 0.205 76.2 < 0.134
WT-25-SL-028 < 0.0681 < 0.084 < 0.05 < 0.0406 9.87 < 0.0844
WT-22-SL-079 0.225 0.281 0.431 < 0.198 8.07 < 0.031
WT-19-SL-041 0.683 0.83 0.502 0.401 8.55 0.163
WT-01-SL-084 < 0.265 < 0.266 < 0.686 < 0.685 1.81 < 0.403
WT-08-SL-047 0.922 0.91 0.525 0.428 7.18 < 0.116
WT-06-SL-046 0.708 0.746 0.473 0.157 8.76 < 0.0787
WT-04-SL-050 < 0.246 < 0.248 < 0.237 < 0.145 6.03 < 0.25
WT-09-SL-054 < 0.0643 < 0.0526 < 0.16 < 0.159 48.3 < 0.0649
WT-23-SL-055 0.268 0.291 < 0.173 < 0.111 5.52 < 0.0524
Average 0.343 0.374 0.289 0.176 18.0 0.0770
St. Dev 0.314 0.334 0.195 0.154 24.319 0.0638
Median 0.247 0.286 0.325 0.101 8.31 0.0501
Min 0.0322 0.0263 0.0250 0.0203 1.81 0.0155
Max 0.922 0.910 0.525 0.428 76.2 0.202
PA DEP TENORM Study Report – Section 5.0 Rev. 0
January 2015 5-1
5.0 LANDFILLS
Leachate samples were collected at 51 PA landfills. Nine of the 51 landfills were selected to be
surveyed and sampled in more detail due to the volume of waste accepted from the O&G
industry. Surveys at the nine selected landfills included scans of gamma radiation and
measurements of total and removable / surface radioactivity. Ambient air at the fence line of
these landfills was sampled for Rn analysis, and filter cake was sampled from three of these
landfills.
5.1 Leachate
Samples of leachate were collected from 51 landfills and analyzed using gamma spectroscopy
for Ra-226 and Ra-228. The gamma spectroscopy results are presented in Table 5-1 for the 42
landfills not selected based on volume of O&G waste accepted and Table 5-2 for the nine
landfills selected based on the volume O&G waste accepted. Radium was detected above the
MDC value in 34 of 51 samples. Sample results from the 42 unselected landfills showed Ra-226
results that ranged from 54.0 to 416 pCi/L with an average of 112 pCi/L. Radium-226 results
from the nine selected landfills ranged from 85 pCi/L to 378 pCi/L with an average of 106 pCi/L.
Radium-228 results ranged from 2.5 to 55.0 pCi/L with an average of 11.9 pCi/L in the 42
unselected landfills. Radium-228 results from the nine selected landfills ranged from 10.0 pCi/L
to 1,100 pCi/L with an average of 139 pCi/L.
Due to high solids content, the samples were not filtered in the field or at the laboratory. The
aqueous portion was decanted from 10 of the 51 samples after they had been allowed to settle.
The aqueous portion was analyzed for Ra-226 and Ra-228. These results are presented in
Table 5-3 along with the original gamma spectroscopy results for the entire sample. The entire
sample results include dissolved and undissolved Ra-226 and Ra-228 and are generally one to
two orders of magnitude higher than analyses of only the aqueous phase, indicating that the
Ra-226 and Ra-228 in these samples were mostly in the form of undissolved solids.
5.2 Nine Selected Landfills
5.2.1 Influent and Effluent Leachate
Nine influent and seven effluent leachate samples were collected at the nine selected landfills.
All nine landfills treat leachate onsite. The samples were analyzed using gamma spectroscopy.
The results of the Ra-226, Ra-228, K-40, as well as gross and gross activity levels are
presented in Table 5-4 for effluent samples and in Table 5-5 for influent samples. Radium was
detected in all of the leachate samples. Radium-226 results ranged from 67.0 to 378 pCi/L with
an average of 142 pCi/L for effluent samples. Radium-228 results ranged from 3.00 to
1,100 pCi/L with an average of 178.0 pCi/L for effluent samples. Radium-226 results ranged
from 48.5 to 116 pCi/L with an average of 83.4 pCi/L for influent samples. Radium-228 results
ranged from 4.00 to 15.0 pCi/L with an average of 7.94 pCi/L for influent samples. The influent
and effluent samples from the same facility do not represent the same leachate at different times
in treatment.
PA DEP TENORM Study Report – Section 5.0 Rev. 0
January 2015 5-2
5.2.2 Leachate Filter Cake
Filter cake from three of the nine landfills was sampled and analyzed using gamma spectroscopy.
The results of the Ra-226 and Ra-228 analyses are presented in Table 5-6. Radium was detected
in all of the filter cake samples. Radium-226 results ranged from 8.73 to 53.0 pCi/g, with an
average of 24.3 pCi/g. Radium-228 results ranged from 1.53 to 5.03 pCi/g, with an average of
3.85 pCi/g.
5.2.3 Effluent Discharge Sediment-Impacted Soil
At three landfills that discharged effluent water to the environment, a sediment-impacted soil
sample was collected at each of the three effluent outfalls. The gamma spectroscopy results are
presented in Table 5-7. Radium was detected in all of the samples. Radium-226 results ranged
from 2.82 to 4.46 pCi/g with an average of 3.57 pCi/g. Radium-228 results ranged from 0.979 to
2.53 pCi/g with an average of 1.65 pCi/g.
5.2.4 Ambient Air
Ambient air was sampled at the fence line of each of the nine selected landfills and analyzed for
Rn concentration. A combination of EIC and ATD monitors were used. Because it was
impractical to place monitors on the actual working face of the landfill, monitors were deployed
at the fence line around the landfill in roughly the four cardinal directions. The exact locations
of the monitors are depicted in Appendix E. Duplicate monitors were placed at each location,
inside a single Tyvek® bag. The Tyvek
® bag is permeable to Rn gas, but impermeable to
particulate matter. The monitors were hung on the fence line approximately 5 ft above grade.
Deployment of the Rn monitors ranged from 74 to 103 days. Monitor device selection was
based upon availability at the time of deployment. The results are presented in Table 5-8.
Radon activity ranged from 0.2 to 0.9 pCi/L. The Rn monitor analytical reports are presented in
Appendix H.
5.2.5 Surveys
Radiological surveys were conducted at each of the nine selected landfills, resulting in four data
sets:
Removable / surface radioactivity measurements recorded in units of dpm/100cm2
Total / surface radioactivity measurements recorded in units of dpm/100 cm2
Gross Gamma Radiation Scan measurements recorded in units of cpm
Gamma Radiation Exposure Rate measurements recorded in units of µR/hr
5.2.5.1 Removable Alpha/Beta Surface Radioactivity Measurement Results
Measurements of removable / surface radioactivity were performed to assess potential internal
radiation exposures to workers through ingestion and/or inhalation. The results were evaluated
using the RG 1.86 guidelines, Table 1. RG 1.86 requires that and radioactivity levels be
evaluated separately. The primary emitter of concern is Ra-226, with a removable criterion of
20 dpm /100 cm2. The primary emitter of concern is Ra-228 of the natural Th decay series,
with a removable criterion of 200 dpm /100 cm2. The average removable and levels at each
PA DEP TENORM Study Report – Section 5.0 Rev. 0
January 2015 5-3
landfill were below the RG 1.86 criteria. The maximum removable and levels were also
below the RG 1.86 criteria. The results of removable and surface radioactivity for the
subject landfills surveyed are presented in Table 5-9. Individual removable and surface
radioactivity measurement results are presented in Appendix D.
5.2.5.2 Total Alpha/Beta Surface Radioactivity Measurement Results
Measurements of total / surface radioactivity were performed to assess potential internal
radiation exposures to workers through ingestion and/or inhalation. The results were evaluated
using the RG 1.86 guidelines, Table 1. RG 1.86 requires that and levels be evaluated
separately. The primary emitter of concern is Ra-226, with a total criterion of 100 dpm /
100 cm2. The primary emitter of concern is Ra-228 of the natural Th decay series, with a total
criterion of 1,000 dpm /100 cm2. All average total and surface radioactivity levels were
below the RG 1.86 criteria. The maximum total and concentrations were 84.6 dpm/100 cm2
and 3,630 dpm/100 cm2. The summary results of total and surface radioactivity for the nine
selected landfills surveyed are presented in Table 5-10. Individual total and surface
radioactivity measurement results are presented in Appendix D.
5.2.5.3 Gross Gamma Radiation Scan Results
Gross gamma radiation scans, recorded in cpm, were performed on open land areas and
accessible areas of the nine selected landfills to identify areas with gamma radiation levels above
local background. Summary results for the selected landfills are presented in Table 5-11. The
highest average count rate at any of the nine selected landfills was 10,816 cpm, and the
maximum count rate recorded at any of the nine selected landfills was 74,928 cpm. A graphic
display of the gamma scan results at each facility was prepared using GIS software and is
presented in Appendix E.
5.2.5.4 Gamma Exposure Rate Results Summary
Gross gamma scan results in units of cpm presented in Table 5-11 were converted to R/hr by
using 800 cpm per R/hr, a conversion factor appropriate for Ra-226 gamma energy as detected
with 2-inch by 2-inch NaI detectors, rounded to one significant figure (Table 6.4, NaI
Scintillation Detector Scan MDCs for Common Radiological Contaminants, NUREG-1507,
Minimum Detectable Concentrations With Typical Radiation Survey Instruments for Various
Contaminants and Field Conditions, USNRC June 1998). Table 5-12 presents statistical results
for each of the nine selected landfills. The highest average exposure rate was 13.5 R/hr, and
the maximum gamma exposure rate measured was 93.7 R/hr.
5.3 Radon Ingrowth Within Filter Cake From WWTP to Landfills
Radon in filter cake is the result of the decay of Ra, which is referred to as ingrowth.
Radium-226 from the U series and Ra-228 from the Th series are present in flowback and
produced water. Radioactive precursors to Ra (U-238 and Th-232) are not present due to their
relative insolubility. When these wastewaters are processed at WWTPs, the Ra is removed and
concentrated in the resulting filter cake or sludge.
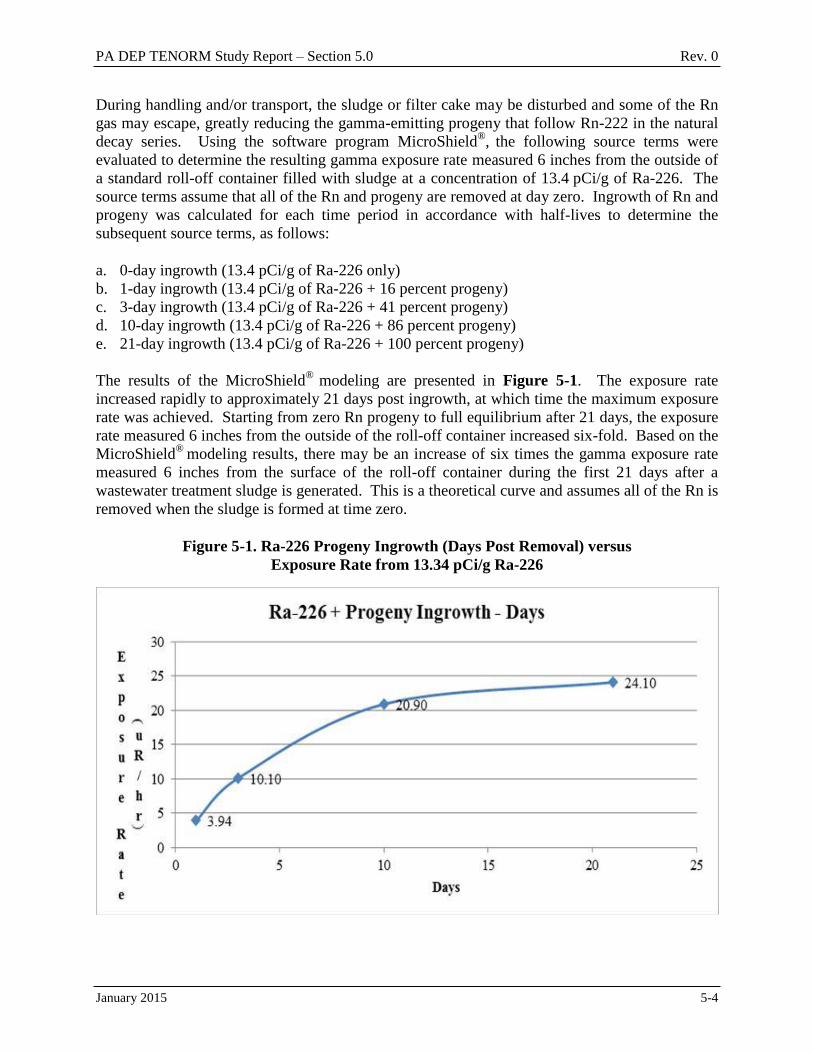
PA DEP TENORM Study Report – Section 5.0 Rev. 0
January 2015 5-4
During handling and/or transport, the sludge or filter cake may be disturbed and some of the Rn
gas may escape, greatly reducing the gamma-emitting progeny that follow Rn-222 in the natural
decay series. Using the software program MicroShield®, the following source terms were
evaluated to determine the resulting gamma exposure rate measured 6 inches from the outside of
a standard roll-off container filled with sludge at a concentration of 13.4 pCi/g of Ra-226. The
source terms assume that all of the Rn and progeny are removed at day zero. Ingrowth of Rn and
progeny was calculated for each time period in accordance with half-lives to determine the
subsequent source terms, as follows:
a. 0-day ingrowth (13.4 pCi/g of Ra-226 only)
b. 1-day ingrowth (13.4 pCi/g of Ra-226 + 16 percent progeny)
c. 3-day ingrowth (13.4 pCi/g of Ra-226 + 41 percent progeny)
d. 10-day ingrowth (13.4 pCi/g of Ra-226 + 86 percent progeny)
e. 21-day ingrowth (13.4 pCi/g of Ra-226 + 100 percent progeny)
The results of the MicroShield®
modeling are presented in Figure 5-1. The exposure rate
increased rapidly to approximately 21 days post ingrowth, at which time the maximum exposure
rate was achieved. Starting from zero Rn progeny to full equilibrium after 21 days, the exposure
rate measured 6 inches from the outside of the roll-off container increased six-fold. Based on the
MicroShield®
modeling results, there may be an increase of six times the gamma exposure rate
measured 6 inches from the surface of the roll-off container during the first 21 days after a
wastewater treatment sludge is generated. This is a theoretical curve and assumes all of the Rn is
removed when the sludge is formed at time zero.
Figure 5-1. Ra-226 Progeny Ingrowth (Days Post Removal) versus
Exposure Rate from 13.34 pCi/g Ra-226
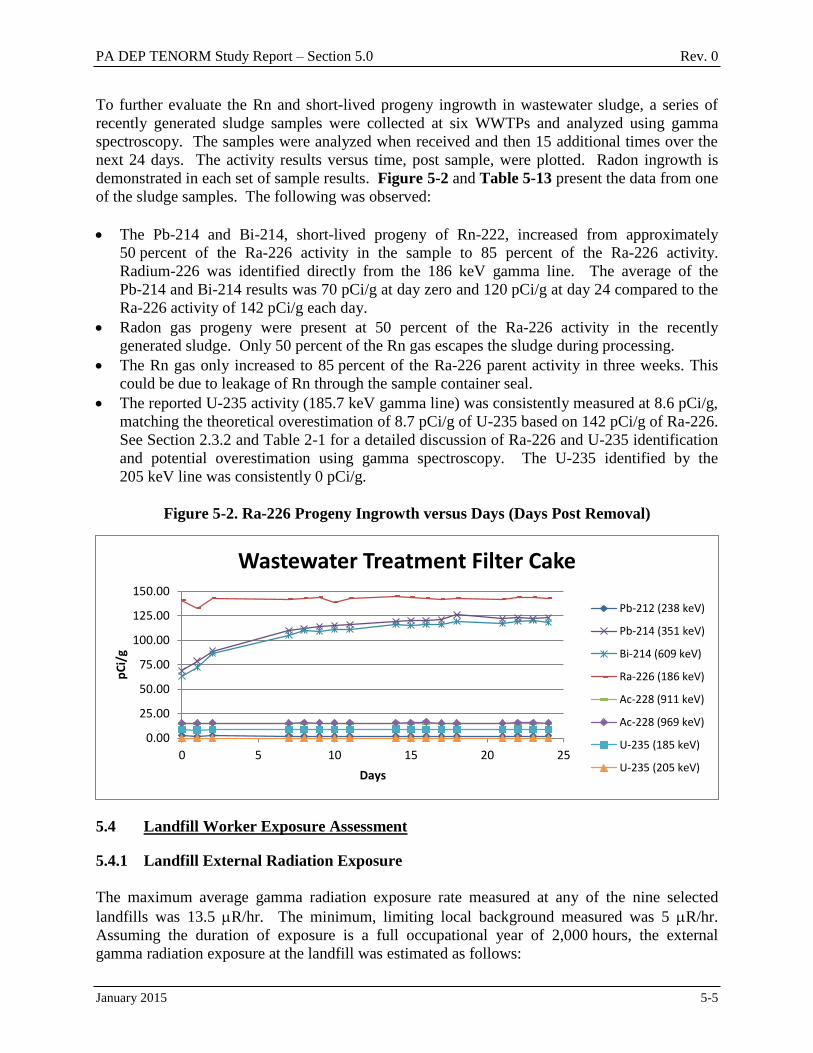
PA DEP TENORM Study Report – Section 5.0 Rev. 0
January 2015 5-5
To further evaluate the Rn and short-lived progeny ingrowth in wastewater sludge, a series of
recently generated sludge samples were collected at six WWTPs and analyzed using gamma
spectroscopy. The samples were analyzed when received and then 15 additional times over the
next 24 days. The activity results versus time, post sample, were plotted. Radon ingrowth is
demonstrated in each set of sample results. Figure 5-2 and Table 5-13 present the data from one
of the sludge samples. The following was observed:
The Pb-214 and Bi-214, short-lived progeny of Rn-222, increased from approximately
50 percent of the Ra-226 activity in the sample to 85 percent of the Ra-226 activity.
Radium-226 was identified directly from the 186 keV gamma line. The average of the
Pb-214 and Bi-214 results was 70 pCi/g at day zero and 120 pCi/g at day 24 compared to the
Ra-226 activity of 142 pCi/g each day.
Radon gas progeny were present at 50 percent of the Ra-226 activity in the recently
generated sludge. Only 50 percent of the Rn gas escapes the sludge during processing.
The Rn gas only increased to 85 percent of the Ra-226 parent activity in three weeks. This
could be due to leakage of Rn through the sample container seal.
The reported U-235 activity (185.7 keV gamma line) was consistently measured at 8.6 pCi/g,
matching the theoretical overestimation of 8.7 pCi/g of U-235 based on 142 pCi/g of Ra-226.
See Section 2.3.2 and Table 2-1 for a detailed discussion of Ra-226 and U-235 identification
and potential overestimation using gamma spectroscopy. The U-235 identified by the
205 keV line was consistently 0 pCi/g.
Figure 5-2. Ra-226 Progeny Ingrowth versus Days (Days Post Removal)
5.4 Landfill Worker Exposure Assessment
5.4.1 Landfill External Radiation Exposure
The maximum average gamma radiation exposure rate measured at any of the nine selected
landfills was 13.5 R/hr. The minimum, limiting local background measured was 5 R/hr.
Assuming the duration of exposure is a full occupational year of 2,000 hours, the external
gamma radiation exposure at the landfill was estimated as follows:
0.00
25.00
50.00
75.00
100.00
125.00
150.00
0 5 10 15 20 25
pC
i/g
Days
Wastewater Treatment Filter Cake
Pb-212 (238 keV)
Pb-214 (351 keV)
Bi-214 (609 keV)
Ra-226 (186 keV)
Ac-228 (911 keV)
Ac-228 (969 keV)
U-235 (185 keV)
U-235 (205 keV)
PA DEP TENORM Study Report – Section 5.0 Rev. 0
January 2015 5-6
Maximum Average Landfill External Gamma Exposure Estimate
(13.5 – 5) µR/hr x 2,000 hr/yr x (1 mrem/1,000 µR gamma) = 17 mrem/yr
This is an estimate of the maximum average exposure based on 2,000 hours in one year. The
result is less than the 100 mrem/yr dose equivalent limit for a member of the public. Actual
exposure is dependent upon the actual exposure rates and occupancy time for individual workers.
The maximum exposure rate measured at any of the nine selected landfills was 93.7 R/hr.
Work in this area would result in an exposure of 100 mrem in 1,130 hours of annual exposure of
an employee’s 2,000-hour occupational year. Actual annual exposure for a landfill worker is
dependent upon actual exposure rates and actual time worked in the proximity of the tank.
5.4.1.1 Landfill Worker Potential Internal Alpha/Beta Radioactivity Exposure
The total and removable / survey results are presented in Sections 5.2.5.1 and 5.2.5.2. None
of the 195 measurements and 17 of the 195 measurements of total surface radioactivity
exceeded the RG 1.86 criteria. None of the 205 removable or surface radioactivity
measurements exceeded the RG 1.86 criteria. The average values for total and removable and
surface radioactivity are below the RG 1.86 criteria, indicating that there is little potential for
internal and exposure to landfill workers.
5.4.1.2 Landfill Worker Internal Radon Exposure
The results of the landfill ambient air Rn samples are presented in Section 5.2.4. The Rn in
ambient air at the fence line of the landfills ranged from 0.2 to 0.9 pCi/L consistent with U.S.
background levels of 0.2 – 0.7 pCi/L in outdoor ambient air. Consequently, the potential for
internal Rn exposure is low.
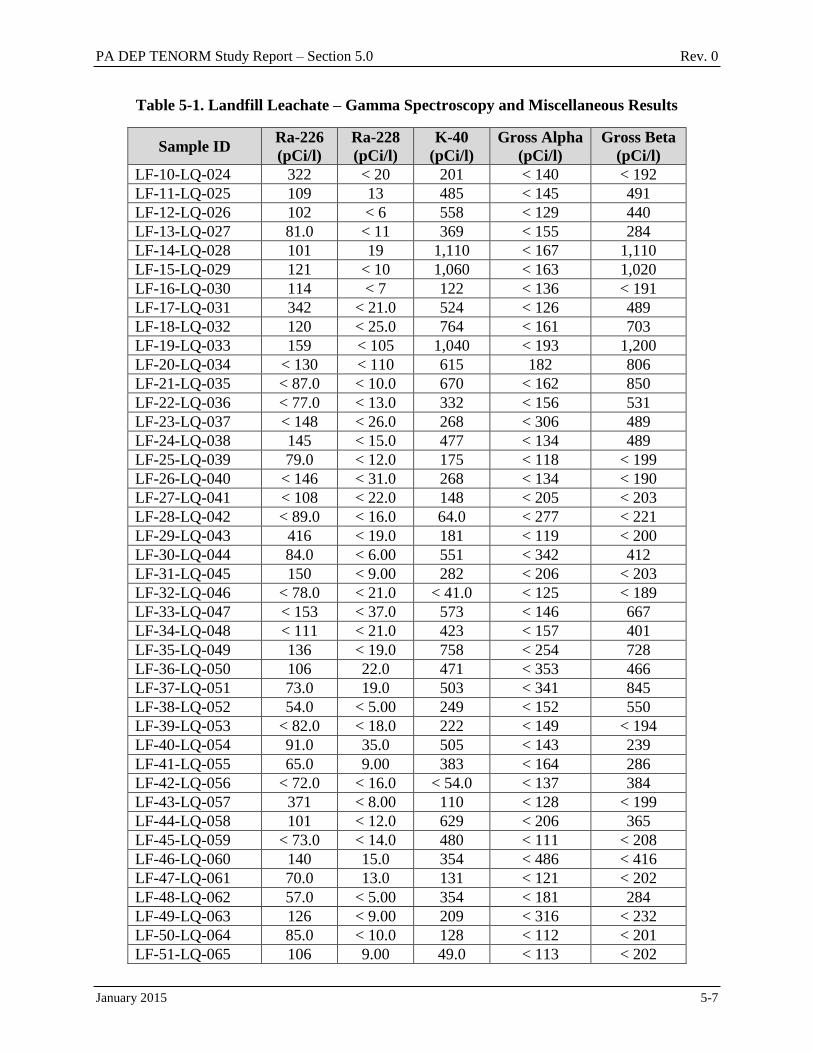
PA DEP TENORM Study Report – Section 5.0 Rev. 0
January 2015 5-7
Table 5-1. Landfill Leachate – Gamma Spectroscopy and Miscellaneous Results
Sample ID Ra-226
(pCi/l)
Ra-228
(pCi/l)
K-40
(pCi/l)
Gross Alpha
(pCi/l)
Gross Beta
(pCi/l)
LF-10-LQ-024 322 < 20 201 < 140 < 192
LF-11-LQ-025 109 13 485 < 145 491
LF-12-LQ-026 102 < 6 558 < 129 440
LF-13-LQ-027 81.0 < 11 369 < 155 284
LF-14-LQ-028 101 19 1,110 < 167 1,110
LF-15-LQ-029 121 < 10 1,060 < 163 1,020
LF-16-LQ-030 114 < 7 122 < 136 < 191
LF-17-LQ-031 342 < 21.0 524 < 126 489
LF-18-LQ-032 120 < 25.0 764 < 161 703
LF-19-LQ-033 159 < 105 1,040 < 193 1,200
LF-20-LQ-034 < 130 < 110 615 182 806
LF-21-LQ-035 < 87.0 < 10.0 670 < 162 850
LF-22-LQ-036 < 77.0 < 13.0 332 < 156 531
LF-23-LQ-037 < 148 < 26.0 268 < 306 489
LF-24-LQ-038 145 < 15.0 477 < 134 489
LF-25-LQ-039 79.0 < 12.0 175 < 118 < 199
LF-26-LQ-040 < 146 < 31.0 268 < 134 < 190
LF-27-LQ-041 < 108 < 22.0 148 < 205 < 203
LF-28-LQ-042 < 89.0 < 16.0 64.0 < 277 < 221
LF-29-LQ-043 416 < 19.0 181 < 119 < 200
LF-30-LQ-044 84.0 < 6.00 551 < 342 412
LF-31-LQ-045 150 < 9.00 282 < 206 < 203
LF-32-LQ-046 < 78.0 < 21.0 < 41.0 < 125 < 189
LF-33-LQ-047 < 153 < 37.0 573 < 146 667
LF-34-LQ-048 < 111 < 21.0 423 < 157 401
LF-35-LQ-049 136 < 19.0 758 < 254 728
LF-36-LQ-050 106 22.0 471 < 353 466
LF-37-LQ-051 73.0 19.0 503 < 341 845
LF-38-LQ-052 54.0 < 5.00 249 < 152 550
LF-39-LQ-053 < 82.0 < 18.0 222 < 149 < 194
LF-40-LQ-054 91.0 35.0 505 < 143 239
LF-41-LQ-055 65.0 9.00 383 < 164 286
LF-42-LQ-056 < 72.0 < 16.0 < 54.0 < 137 384
LF-43-LQ-057 371 < 8.00 110 < 128 < 199
LF-44-LQ-058 101 < 12.0 629 < 206 365
LF-45-LQ-059 < 73.0 < 14.0 480 < 111 < 208
LF-46-LQ-060 140 15.0 354 < 486 < 416
LF-47-LQ-061 70.0 13.0 131 < 121 < 202
LF-48-LQ-062 57.0 < 5.00 354 < 181 284
LF-49-LQ-063 126 < 9.00 209 < 316 < 232
LF-50-LQ-064 85.0 < 10.0 128 < 112 < 201
LF-51-LQ-065 106 9.00 49.0 < 113 < 202
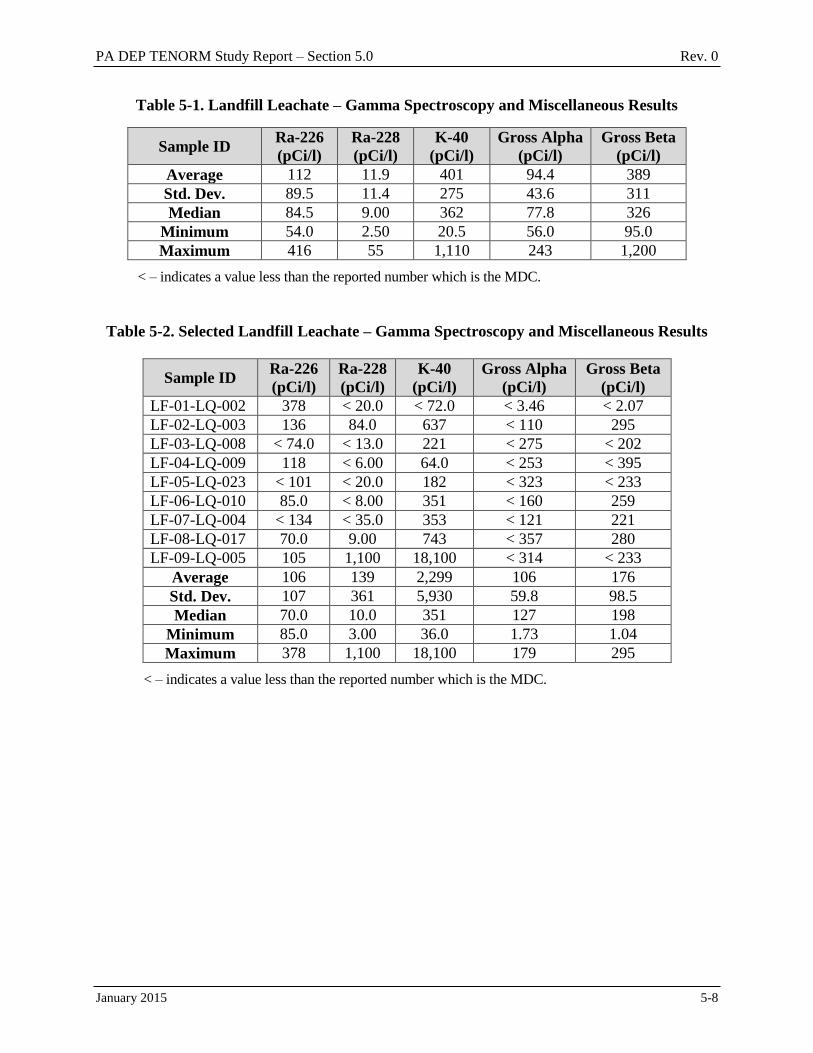
PA DEP TENORM Study Report – Section 5.0 Rev. 0
January 2015 5-8
Table 5-1. Landfill Leachate – Gamma Spectroscopy and Miscellaneous Results
Sample ID Ra-226
(pCi/l)
Ra-228
(pCi/l)
K-40
(pCi/l)
Gross Alpha
(pCi/l)
Gross Beta
(pCi/l)
Average 112 11.9 401 94.4 389
Std. Dev. 89.5 11.4 275 43.6 311
Median 84.5 9.00 362 77.8 326
Minimum 54.0 2.50 20.5 56.0 95.0
Maximum 416 55 1,110 243 1,200
< – indicates a value less than the reported number which is the MDC.
Table 5-2. Selected Landfill Leachate – Gamma Spectroscopy and Miscellaneous Results
Sample ID Ra-226
(pCi/l)
Ra-228
(pCi/l)
K-40
(pCi/l)
Gross Alpha
(pCi/l)
Gross Beta
(pCi/l)
LF-01-LQ-002 378 < 20.0 < 72.0 < 3.46 < 2.07
LF-02-LQ-003 136 84.0 637 < 110 295
LF-03-LQ-008 < 74.0 < 13.0 221 < 275 < 202
LF-04-LQ-009 118 < 6.00 64.0 < 253 < 395
LF-05-LQ-023 < 101 < 20.0 182 < 323 < 233
LF-06-LQ-010 85.0 < 8.00 351 < 160 259
LF-07-LQ-004 < 134 < 35.0 353 < 121 221
LF-08-LQ-017 70.0 9.00 743 < 357 280
LF-09-LQ-005 105 1,100 18,100 < 314 < 233
Average 106 139 2,299 106 176
Std. Dev. 107 361 5,930 59.8 98.5
Median 70.0 10.0 351 127 198
Minimum 85.0 3.00 36.0 1.73 1.04
Maximum 378 1,100 18,100 179 295
< – indicates a value less than the reported number which is the MDC.
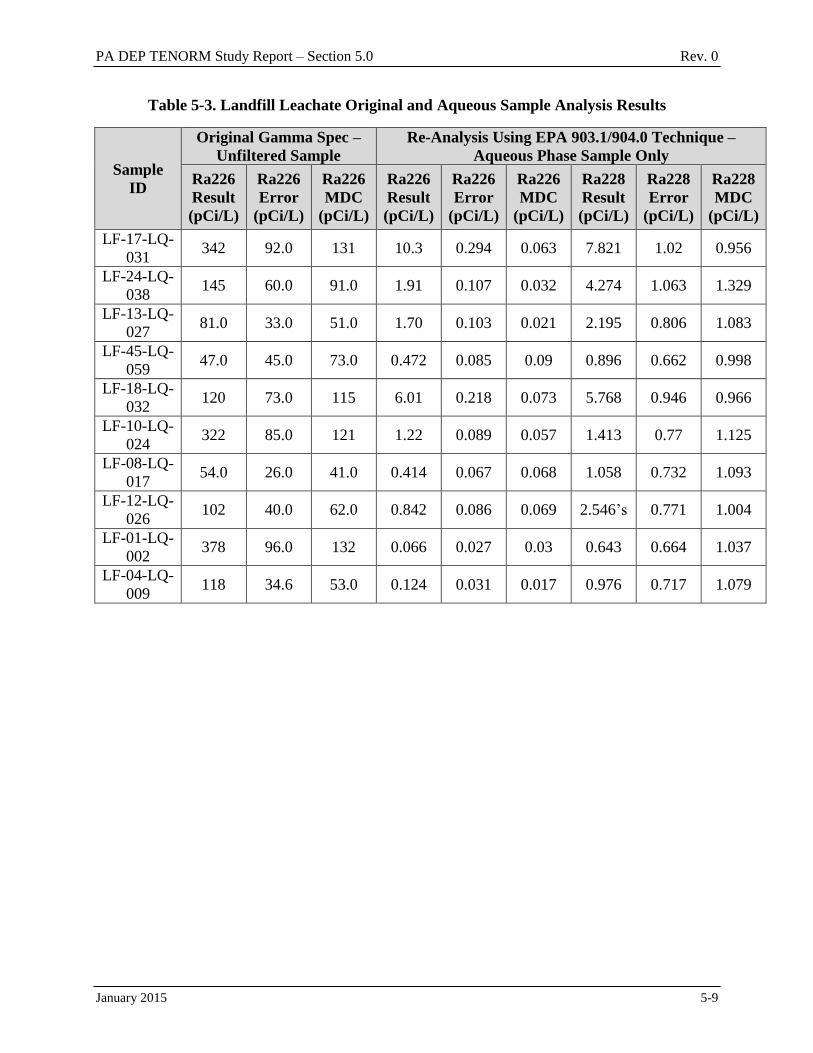
PA DEP TENORM Study Report – Section 5.0 Rev. 0
January 2015 5-9
Table 5-3. Landfill Leachate Original and Aqueous Sample Analysis Results
Sample
ID
Original Gamma Spec –
Unfiltered Sample
Re-Analysis Using EPA 903.1/904.0 Technique –
Aqueous Phase Sample Only
Ra226
Result
(pCi/L)
Ra226
Error
(pCi/L)
Ra226
MDC
(pCi/L)
Ra226
Result
(pCi/L)
Ra226
Error
(pCi/L)
Ra226
MDC
(pCi/L)
Ra228
Result
(pCi/L)
Ra228
Error
(pCi/L)
Ra228
MDC
(pCi/L)
LF-17-LQ-
031 342 92.0 131 10.3 0.294 0.063 7.821 1.02 0.956
LF-24-LQ-
038 145 60.0 91.0 1.91 0.107 0.032 4.274 1.063 1.329
LF-13-LQ-
027 81.0 33.0 51.0 1.70 0.103 0.021 2.195 0.806 1.083
LF-45-LQ-
059 47.0 45.0 73.0 0.472 0.085 0.09 0.896 0.662 0.998
LF-18-LQ-
032 120 73.0 115 6.01 0.218 0.073 5.768 0.946 0.966
LF-10-LQ-
024 322 85.0 121 1.22 0.089 0.057 1.413 0.77 1.125
LF-08-LQ-
017 54.0 26.0 41.0 0.414 0.067 0.068 1.058 0.732 1.093
LF-12-LQ-
026 102 40.0 62.0 0.842 0.086 0.069 2.546’s 0.771 1.004
LF-01-LQ-
002 378 96.0 132 0.066 0.027 0.03 0.643 0.664 1.037
LF-04-LQ-
009 118 34.6 53.0 0.124 0.031 0.017 0.976 0.717 1.079
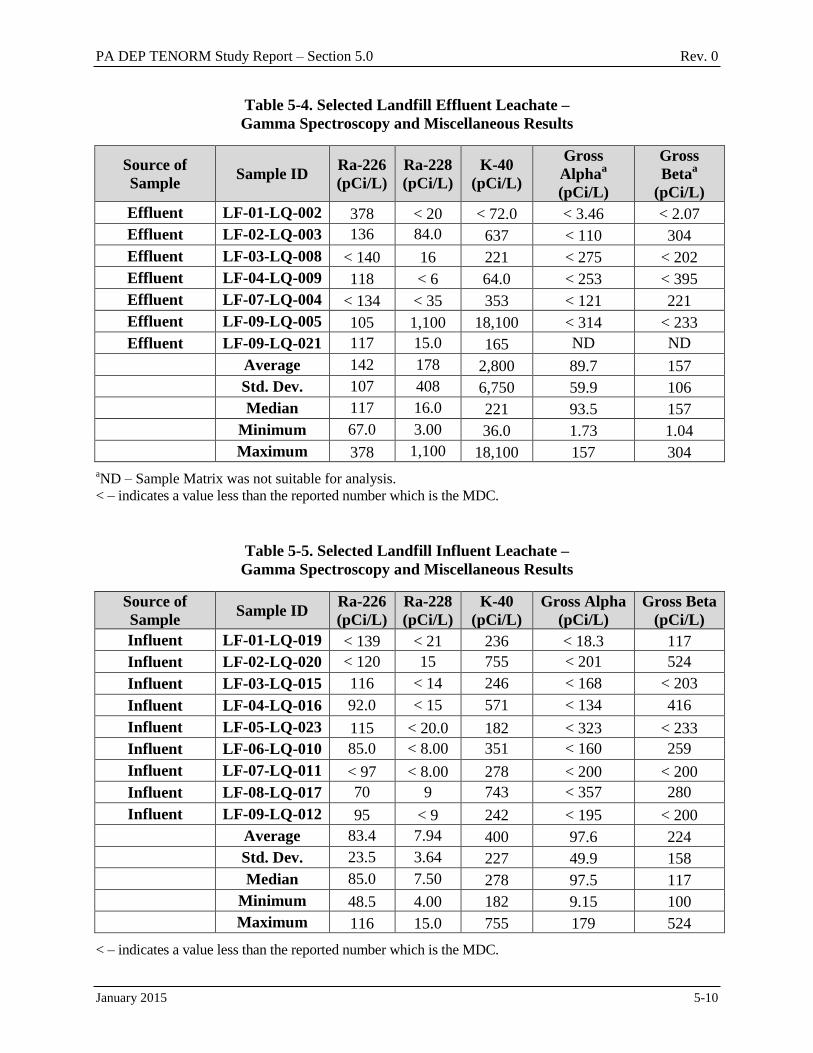
PA DEP TENORM Study Report – Section 5.0 Rev. 0
January 2015 5-10
Table 5-4. Selected Landfill Effluent Leachate –
Gamma Spectroscopy and Miscellaneous Results
Source of
Sample Sample ID
Ra-226
(pCi/L)
Ra-228
(pCi/L)
K-40
(pCi/L)
Gross
Alphaa
(pCi/L)
Gross
Betaa
(pCi/L)
Effluent LF-01-LQ-002 378 < 20 < 72.0 < 3.46 < 2.07
Effluent LF-02-LQ-003 136 84.0 637 < 110 304
Effluent LF-03-LQ-008 < 140 16 221 < 275 < 202
Effluent LF-04-LQ-009 118 < 6 64.0 < 253 < 395
Effluent LF-07-LQ-004 < 134 < 35 353 < 121 221
Effluent LF-09-LQ-005 105 1,100 18,100 < 314 < 233
Effluent LF-09-LQ-021 117 15.0 165 ND ND
Average 142 178 2,800 89.7 157
Std. Dev. 107 408 6,750 59.9 106
Median 117 16.0 221 93.5 157
Minimum 67.0 3.00 36.0 1.73 1.04
Maximum 378 1,100 18,100 157 304
aND – Sample Matrix was not suitable for analysis.
< – indicates a value less than the reported number which is the MDC.
Table 5-5. Selected Landfill Influent Leachate –
Gamma Spectroscopy and Miscellaneous Results
Source of
Sample Sample ID
Ra-226
(pCi/L)
Ra-228
(pCi/L)
K-40
(pCi/L)
Gross Alpha
(pCi/L)
Gross Beta
(pCi/L)
Influent LF-01-LQ-019 < 139 < 21 236 < 18.3 117
Influent LF-02-LQ-020 < 120 15 755 < 201 524
Influent LF-03-LQ-015 116 < 14 246 < 168 < 203
Influent LF-04-LQ-016 92.0 < 15 571 < 134 416
Influent LF-05-LQ-023 115 < 20.0 182 < 323 < 233
Influent LF-06-LQ-010 85.0 < 8.00 351 < 160 259
Influent LF-07-LQ-011 < 97 < 8.00 278 < 200 < 200
Influent LF-08-LQ-017 70 9 743 < 357 280
Influent LF-09-LQ-012 95 < 9 242 < 195 < 200
Average 83.4 7.94 400 97.6 224
Std. Dev. 23.5 3.64 227 49.9 158
Median 85.0 7.50 278 97.5 117
Minimum 48.5 4.00 182 9.15 100
Maximum 116 15.0 755 179 524
< – indicates a value less than the reported number which is the MDC.
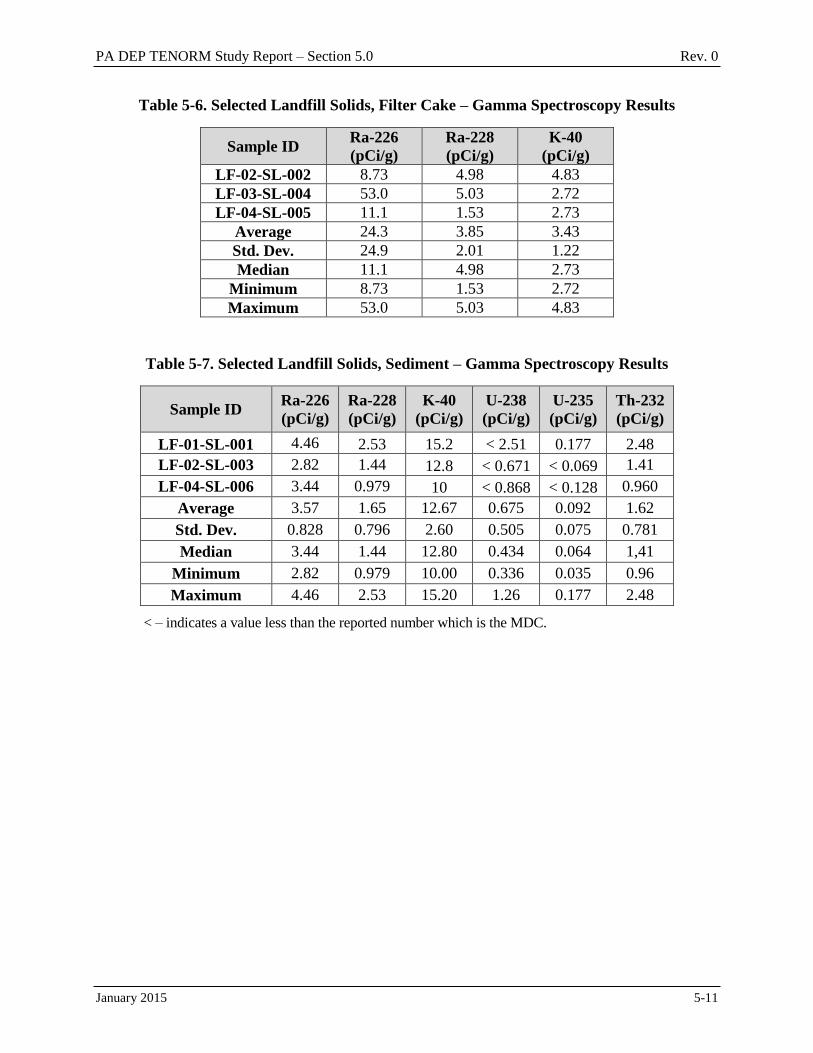
PA DEP TENORM Study Report – Section 5.0 Rev. 0
January 2015 5-11
Table 5-6. Selected Landfill Solids, Filter Cake – Gamma Spectroscopy Results
Sample ID Ra-226
(pCi/g)
Ra-228
(pCi/g)
K-40
(pCi/g)
LF-02-SL-002 8.73 4.98 4.83
LF-03-SL-004 53.0 5.03 2.72
LF-04-SL-005 11.1 1.53 2.73
Average 24.3 3.85 3.43
Std. Dev. 24.9 2.01 1.22
Median 11.1 4.98 2.73
Minimum 8.73 1.53 2.72
Maximum 53.0 5.03 4.83
Table 5-7. Selected Landfill Solids, Sediment – Gamma Spectroscopy Results
Sample ID Ra-226
(pCi/g)
Ra-228
(pCi/g)
K-40
(pCi/g)
U-238
(pCi/g)
U-235
(pCi/g)
Th-232
(pCi/g)
LF-01-SL-001 4.46 2.53 15.2 < 2.51 0.177 2.48
LF-02-SL-003 2.82 1.44 12.8 < 0.671 < 0.069 1.41
LF-04-SL-006 3.44 0.979 10 < 0.868 < 0.128 0.960
Average 3.57 1.65 12.67 0.675 0.092 1.62
Std. Dev. 0.828 0.796 2.60 0.505 0.075 0.781
Median 3.44 1.44 12.80 0.434 0.064 1,41
Minimum 2.82 0.979 10.00 0.336 0.035 0.96
Maximum 4.46 2.53 15.20 1.26 0.177 2.48
< – indicates a value less than the reported number which is the MDC.
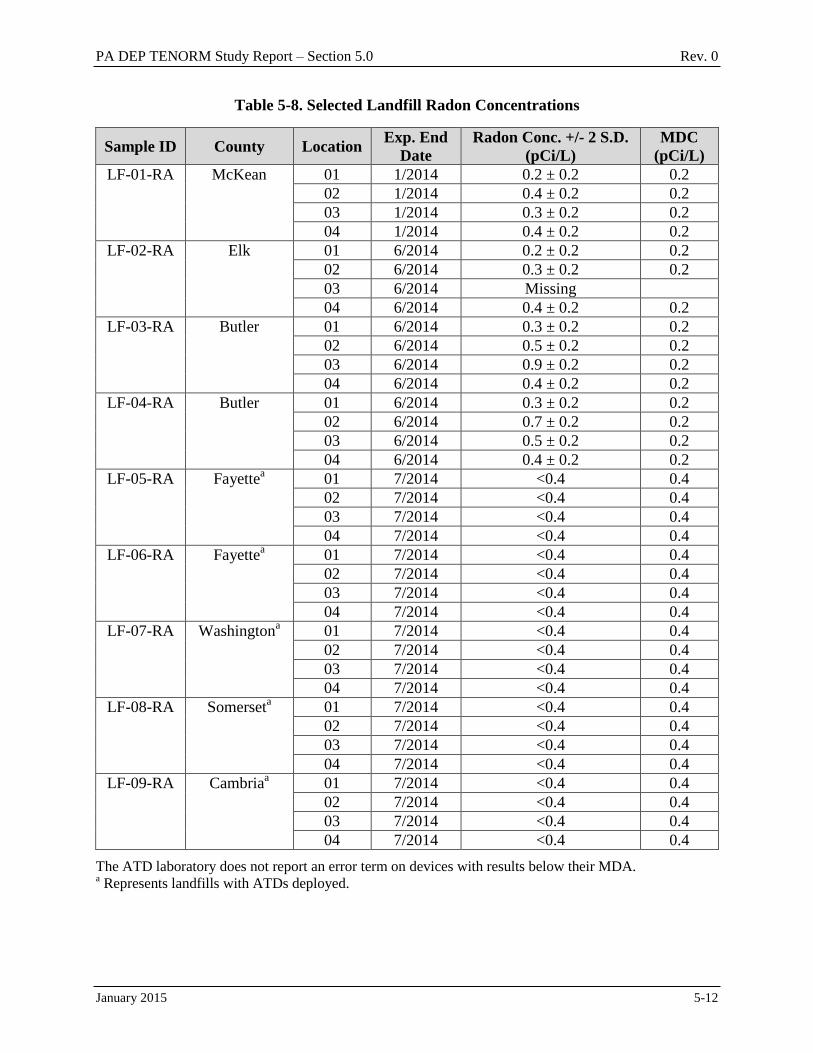
PA DEP TENORM Study Report – Section 5.0 Rev. 0
January 2015 5-12
Table 5-8. Selected Landfill Radon Concentrations
Sample ID County Location Exp. End
Date
Radon Conc. +/- 2 S.D.
(pCi/L)
MDC
(pCi/L)
LF-01-RA McKean 01 1/2014 0.2 ± 0.2 0.2
02 1/2014 0.4 ± 0.2 0.2
03 1/2014 0.3 ± 0.2 0.2
04 1/2014 0.4 ± 0.2 0.2
LF-02-RA Elk 01 6/2014 0.2 ± 0.2 0.2
02 6/2014 0.3 ± 0.2 0.2
03 6/2014 Missing
04 6/2014 0.4 ± 0.2 0.2
LF-03-RA Butler 01 6/2014 0.3 ± 0.2 0.2
02 6/2014 0.5 ± 0.2 0.2
03 6/2014 0.9 ± 0.2 0.2
04 6/2014 0.4 ± 0.2 0.2
LF-04-RA Butler 01 6/2014 0.3 ± 0.2 0.2
02 6/2014 0.7 ± 0.2 0.2
03 6/2014 0.5 ± 0.2 0.2
04 6/2014 0.4 ± 0.2 0.2
LF-05-RA Fayettea 01 7/2014 <0.4 0.4
02 7/2014 <0.4 0.4
03 7/2014 <0.4 0.4
04 7/2014 <0.4 0.4
LF-06-RA Fayettea 01 7/2014 <0.4 0.4
02 7/2014 <0.4 0.4
03 7/2014 <0.4 0.4
04 7/2014 <0.4 0.4
LF-07-RA Washingtona 01 7/2014 <0.4 0.4
02 7/2014 <0.4 0.4
03 7/2014 <0.4 0.4
04 7/2014 <0.4 0.4
LF-08-RA Somerseta 01 7/2014 <0.4 0.4
02 7/2014 <0.4 0.4
03 7/2014 <0.4 0.4
04 7/2014 <0.4 0.4
LF-09-RA Cambriaa 01 7/2014 <0.4 0.4
02 7/2014 <0.4 0.4
03 7/2014 <0.4 0.4
04 7/2014 <0.4 0.4
The ATD laboratory does not report an error term on devices with results below their MDA. a Represents landfills with ATDs deployed.
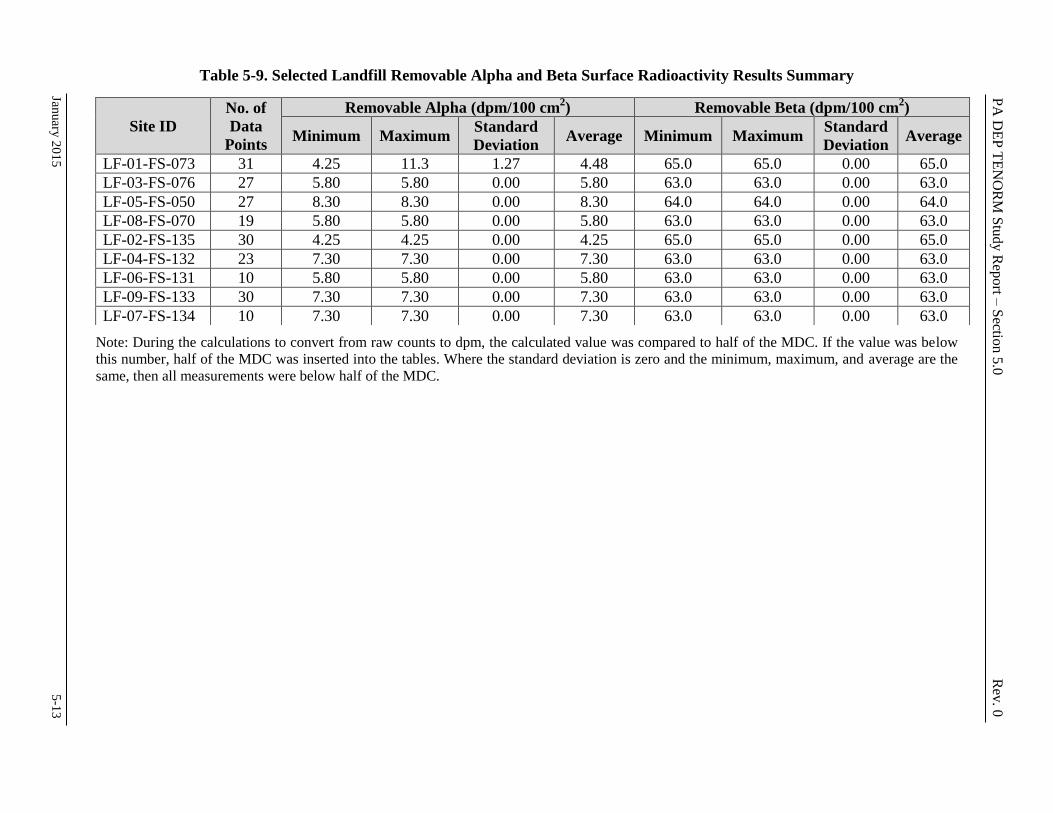
PA
DE
P T
EN
OR
M S
tudy R
eport –
Sectio
n 5
.0 R
ev. 0
January
20
15
5
-13
Table 5-9. Selected Landfill Removable Alpha and Beta Surface Radioactivity Results Summary
Note: During the calculations to convert from raw counts to dpm, the calculated value was compared to half of the MDC. If the value was below
this number, half of the MDC was inserted into the tables. Where the standard deviation is zero and the minimum, maximum, and average are the
same, then all measurements were below half of the MDC.
Site ID
No. of
Data
Points
Removable Alpha (dpm/100 cm2) Removable Beta (dpm/100 cm
2)
Minimum Maximum Standard
Deviation Average Minimum Maximum
Standard
Deviation Average
LF-01-FS-073 31 4.25 11.3 1.27 4.48 65.0 65.0 0.00 65.0
LF-03-FS-076 27 5.80 5.80 0.00 5.80 63.0 63.0 0.00 63.0
LF-05-FS-050 27 8.30 8.30 0.00 8.30 64.0 64.0 0.00 64.0
LF-08-FS-070 19 5.80 5.80 0.00 5.80 63.0 63.0 0.00 63.0
LF-02-FS-135 30 4.25 4.25 0.00 4.25 65.0 65.0 0.00 65.0
LF-04-FS-132 23 7.30 7.30 0.00 7.30 63.0 63.0 0.00 63.0
LF-06-FS-131 10 5.80 5.80 0.00 5.80 63.0 63.0 0.00 63.0
LF-09-FS-133 30 7.30 7.30 0.00 7.30 63.0 63.0 0.00 63.0
LF-07-FS-134 10 7.30 7.30 0.00 7.30 63.0 63.0 0.00 63.0

PA
DE
P T
EN
OR
M S
tudy R
eport –
Sectio
n 5
.0 R
ev. 0
January
20
15
5
-14
Table 5-10. Selected Landfill Total Alpha and Beta Surface Radioactivity Results Summary
Site ID
No. of
Data
Points
Total Alpha (dpm/100 cm2) Total Beta (dpm/100 cm
2)
Minimum Maximum Standard
Deviation Average Minimum Maximum
Standard
Deviation Average
LF-01-FS-073 26 7.45 39.8 9.42 13.0 301 779 112 332
LF-03-FS-076 28 7.45 84.6 21.7 18.1 288 3,630 642 682
LF-05-FS-050 27 7.45 29.8 6.84 11.4 285 942 221 410
LF-08-FS-070 19 7.45 24.9 5.08 9.81 268 1,900 524 580
LF-02-FS-135 22 18.6 38.9 4.61 20.3 288 1,270 356 692
LF-04-FS-132 22 7.50 69.6 17.5 13.3 274 1,559 371 646
LF-06-FS-131 10 7.45 49.7 13.5 14.9 289 766 194 381
LF-09-FS-133 30 7.45 19.9 5.00 10.8 272 1,360 250 401
LF-07-FS-134 11 7.45 19.9 4.45 9.94 468 1,960 578 730
Note: During the calculations to convert from raw counts to dpm, the calculated value was compared to half of the MDC. If the value was below
this number, half of the MDC was inserted into the tables. Where the standard deviation is zero and the minimum, maximum, and average are the
same, then all measurements were below half of the MDC.
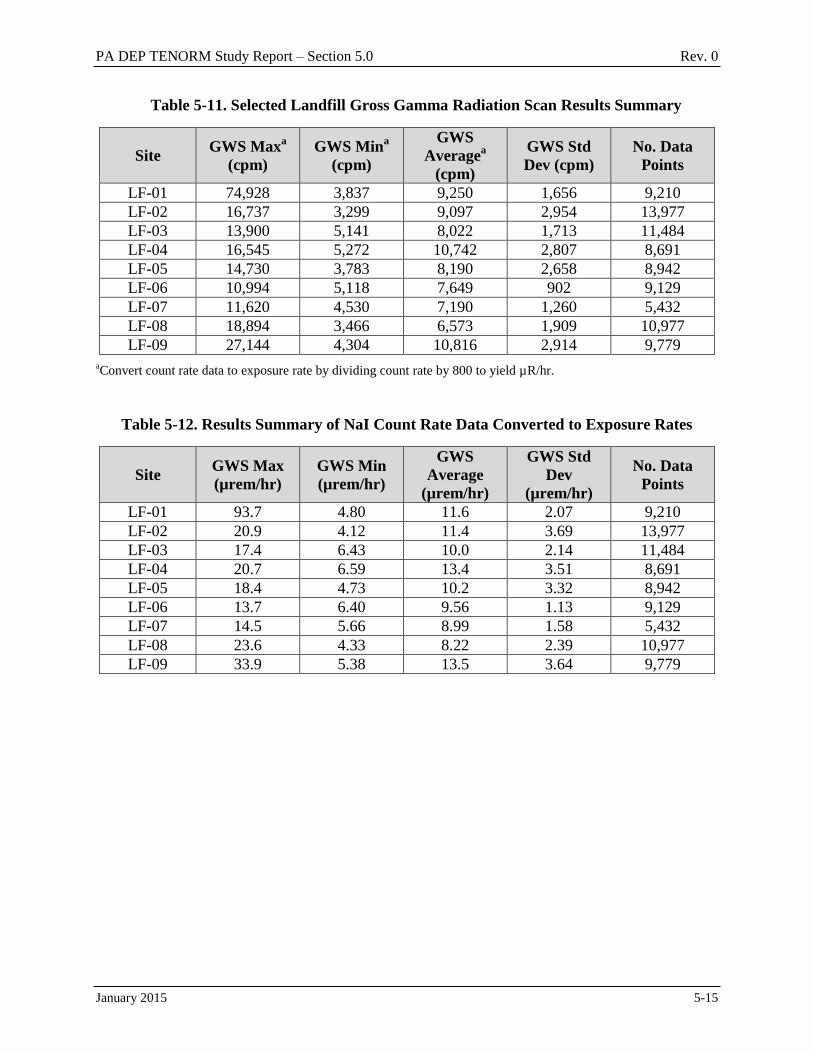
PA DEP TENORM Study Report – Section 5.0 Rev. 0
January 2015 5-15
Table 5-11. Selected Landfill Gross Gamma Radiation Scan Results Summary
Site GWS Max
a
(cpm)
GWS Mina
(cpm)
GWS
Averagea
(cpm)
GWS Std
Dev (cpm)
No. Data
Points
LF-01 74,928 3,837 9,250 1,656 9,210
LF-02 16,737 3,299 9,097 2,954 13,977
LF-03 13,900 5,141 8,022 1,713 11,484
LF-04 16,545 5,272 10,742 2,807 8,691
LF-05 14,730 3,783 8,190 2,658 8,942
LF-06 10,994 5,118 7,649 902 9,129
LF-07 11,620 4,530 7,190 1,260 5,432
LF-08 18,894 3,466 6,573 1,909 10,977
LF-09 27,144 4,304 10,816 2,914 9,779
aConvert count rate data to exposure rate by dividing count rate by 800 to yield µR/hr.
Table 5-12. Results Summary of NaI Count Rate Data Converted to Exposure Rates
Site GWS Max
(µrem/hr)
GWS Min
(µrem/hr)
GWS
Average
(µrem/hr)
GWS Std
Dev
(µrem/hr)
No. Data
Points
LF-01 93.7 4.80 11.6 2.07 9,210
LF-02 20.9 4.12 11.4 3.69 13,977
LF-03 17.4 6.43 10.0 2.14 11,484
LF-04 20.7 6.59 13.4 3.51 8,691
LF-05 18.4 4.73 10.2 3.32 8,942
LF-06 13.7 6.40 9.56 1.13 9,129
LF-07 14.5 5.66 8.99 1.58 5,432
LF-08 23.6 4.33 8.22 2.39 10,977
LF-09 33.9 5.38 13.5 3.64 9,779
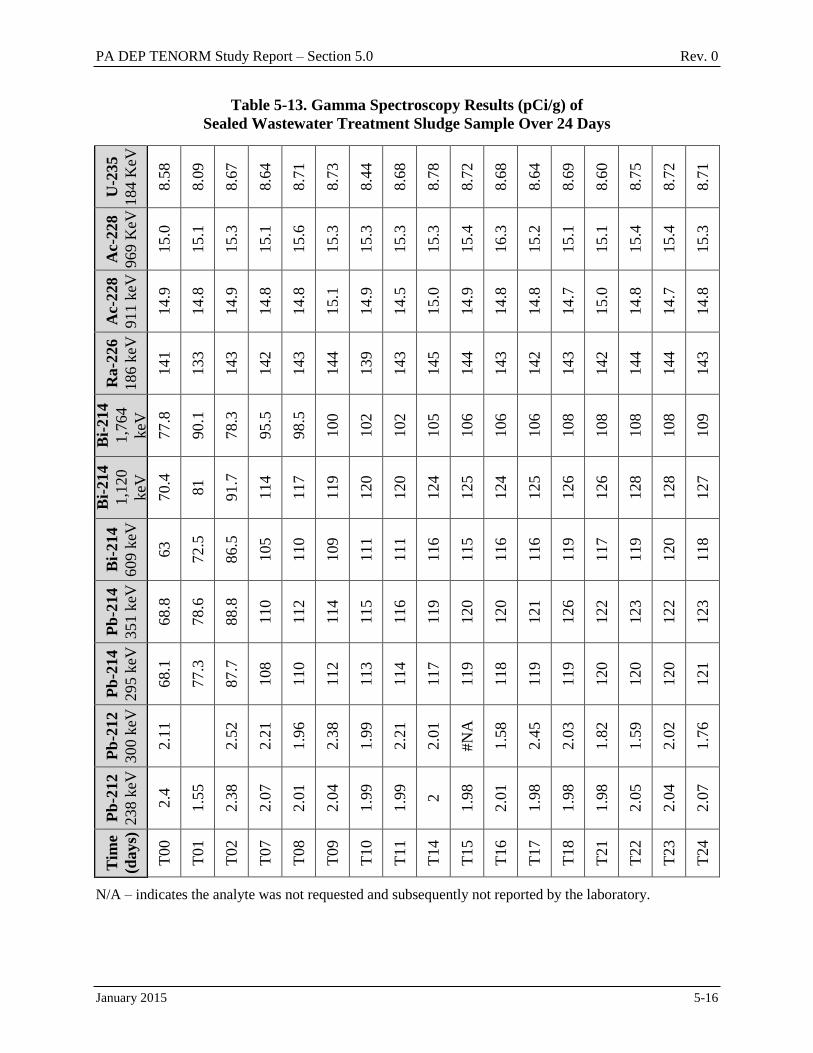
PA DEP TENORM Study Report – Section 5.0 Rev. 0
January 2015 5-16
Table 5-13. Gamma Spectroscopy Results (pCi/g) of
Sealed Wastewater Treatment Sludge Sample Over 24 Days U
-235
184 K
eV
8.5
8
8.0
9
8.6
7
8.6
4
8.7
1
8.7
3
8.4
4
8.6
8
8.7
8
8.7
2
8.6
8
8.6
4
8.6
9
8.6
0
8.7
5
8.7
2
8.7
1
Ac-
228
969 K
eV
15.0
15.1
15.3
15.1
15.6
15.3
15.3
15.3
15.3
15.4
16.3
15.2
15.1
15.1
15.4
15.4
15.3
Ac-
228
911 k
eV
14.9
14.8
14.9
14.8
14.8
15.1
14.9
14.5
15.0
14.9
14.8
14.8
14.7
15.0
14.8
14.7
14.8
Ra-2
26
186 k
eV
141
133
143
142
143
144
139
143
145
144
143
142
143
142
144
144
143
Bi-
214
1,7
64
keV
77.8
90.1
78.3
95.5
98.5
100
102
102
105
106
106
106
108
108
108
108
109
Bi-
214
1,1
20
keV
70.4
81
91.7
114
117
119
120
120
124
125
124
125
126
126
128
128
127
Bi-
214
609 k
eV
63
72.5
86.5
105
110
109
111
111
116
115
116
116
119
117
119
120
118
Pb
-214
351 k
eV
68.8
78.6
88.8
110
112
114
115
116
119
120
120
121
126
122
123
122
123
Pb
-214
295 k
eV
68.1
77.3
87.7
108
110
112
113
114
117
119
118
119
119
120
120
120
121
Pb
-212
300 k
eV
2.1
1
2.5
2
2.2
1
1.9
6
2.3
8
1.9
9
2.2
1
2.0
1
#N
A
1.5
8
2.4
5
2.0
3
1.8
2
1.5
9
2.0
2
1.7
6
Pb
-212
238 k
eV
2.4
1.5
5
2.3
8
2.0
7
2.0
1
2.0
4
1.9
9
1.9
9
2
1.9
8
2.0
1
1.9
8
1.9
8
1.9
8
2.0
5
2.0
4
2.0
7
Tim
e
(days)
T00
T01
T02
T07
T08
T09
T10
T11
T14
T15
T16
T17
T18
T21
T22
T23
T24
N/A – indicates the analyte was not requested and subsequently not reported by the laboratory.
PA DEP TENORM Study Report – Section 6.0 Rev. 0
January 2015 6-1
6.0 GAS DISTRIBUTION AND END USE
Uranium-238 is distributed throughout the crust of the earth, typically at concentrations of
0.33 to 1.0 pCi/g. However, concentrations can be much higher in certain rock types or
formations. The U-238 decay series consists of 18 decay progeny, including Rn. Radon is the
only member of the decay series that is a gas at typical ambient conditions. All of the other
decay series members are solids. Because Rn is a gas, it is highly mobile within the soil and
rock matrix and it easily enters into structures. There are two additional potential pathways for
Rn entry into structures: well water and natural gas combustion, e.g., cooking and unvented
heating. Natural gas samples were collected at underground storage sites, natural gas-fired
power plants, gas compression and transmission facilities, and natural gas processing plants.
6.1 Natural Gas in Underground Storage
Natural gas samples were collected at four underground storage sites in Pennsylvania. Duplicate
samples were collected at each site during injection into the storage formation and during
withdrawal from the storage formation. Sampling during injection was conducted during the
period of May to August 2013. Sampling during withdrawal was conducted during the period of
January to early February 2014. At three of the sites the samples were obtained from the exhaust
of the gas chromatograph, which continuously analyzes the natural gas. At the fourth site, the
sample was collected from the injection flow dehydration unit. The results for injection
sampling are presented in Table 6-1. The results for withdrawal sampling are presented in
Table 6-2. The results indicate Rn concentrations are lower after underground storage. The Rn
analytical reports are presented in Appendix H.
6.2 Natural Gas-Fired Power Plants
Two natural gas-fired power plants (PP-01 and PP-02) were surveyed for gamma radiation
exposure rates. Natural gas samples were collected at both plants, and ambient Rn
measurements were performed at the PP-02 fence line. The natural gas Rn concentration results
are presented in Table 6-3, and the ambient Rn concentrations measured at the plant fence line
are presented in Table 6-4. All of the Rn analytical reports are presented in Appendix H.
The gamma radiation exposure rate survey at the PP-02 power plant was conducted using a
Ludlum Model 19 Micro-R Meter. With the exception of one area, the range of measurement
results observed were 5-10 µR/hr, which is within the range of natural background of gamma
radiation for Pennsylvania. The exception occurred on the external surface of a pipe elbow
where the range of measurement results observed were 15-17 µR/hr. During a subsequent
survey event, the measurement results observed at the surface of that pipe elbow were 5-10
µR/hr, which is within the range of natural background of gamma radiation levels.
Ambient air was sampled at the PP-02 power plant site fence line. Eight EIC passive Rn
monitors were used. The monitors were deployed at the fence line around the power plant in
roughly the four cardinal directions. See figures in Appendix E for exact locations. The
monitors were placed, in duplicate, inside a single Tyvek® bag. The Tyvek
® bag is permeable to
Rn gas but impermeable to particulate matter. The monitors were hung on the fence line
approximately 5 ft above grade. Deployment of the Rn monitors was for 64 days. The fence line
PA DEP TENORM Study Report – Section 6.0 Rev. 0
January 2015 6-2
Rn monitor results were all at or below the MDC value for the analysis. The results are
presented in Table 6-4. The Rn analytical reports are presented in Appendix H.
6.3 Compressor Stations
Duplicate natural gas samples were collected at intake flow lines of both facility CS-01 and
CS-03. Duplicate samples were collected at the compressor station discharge at facility CS-04.
The CS-04 compressor station is associated with the natural gas processing plant (CP-01)
discussed below. Because of high pressure in the intake flow lines, duplicate natural gas samples
were collected at the continuous natural gas quality analyzer at CS-02. This sample point is a
small line off of a main exhaust for CS-02. All compressor stations were receiving
predominately Marcellus Shale unconventional natural gas at the time of sample collection.
Radon-measured concentrations are presented in Table 6-5. The compressor station natural gas
Rn results are consistent with the production site Rn sample results. The Rn analytical reports
are presented in Appendix H.
Ambient air was sampled at the CS-01 compressor station fence line for the measurement of Rn
concentrations. Eight EIC passive Rn monitors were used. The monitors were deployed at the
fence line around the power plant in roughly the four cardinal directions. See figures in
Appendix E for exact locations. The monitors were placed, in duplicate, inside a single Tyvek®
bag. The Tyvek® bag is permeable to Rn gas but impermeable to particulate matter. The
monitors were hung on the fence line approximately 5 ft above grade. Deployment of the Rn
monitors was for 62 days. The fence line Rn monitor results ranged from 0.1 to 0.8 pCi/L. The
average concentration at each fence line location was within the range of typical ambient
background Rn concentrations in outdoor ambient air in the U.S. The results are presented in
Table 6-6. The Rn analytical reports are presented in Appendix H.
6.4 Natural Gas Processing Plant
Two natural gas samples were collected at the processing plant (CP-01) on two separate
occasions: March 12, 2014 and September 11, 2014. The results are presented in Table 6-7.
The Rn analytical reports are presented in Appendix H.
Gamma radiation exposure rate surveys were performed during the two site visits. The exposure
rate surveys were performed using a Ludlum Model 19 Micro-R Meter. The first survey was
performed on a rainy, windy day, limiting the outdoor areas surveyed. The results include:
Background in areas not impacted by the plant – 5-10 R/hr.
General areas of the plant – 5-10 R/hr.
Filter housings (exposure rate measured on the outside surface):
Contact readings measured on contact with filter housings ranged from background to
75 R/hr, with two exceptions; one measured 350 R/hr and the other measured
900 R/hr.
Propane processing – radiation exposure rates measured up to 380 R/hr on contact with heat
exchangers, reboilers, pipelines, and pumps.
Propane storage area:
Pipeline exposure rates measured from local background to 400 R/hr on contact.
PA DEP TENORM Study Report – Section 6.0 Rev. 0
January 2015 6-3
Ladder to decking area measured 80 R/hr general area.
Decking above ladder measured 50 R/hr general area.
Propane storage tank measured 210 R/hr on contact.
Propane tank trailer being filled – 100 R/hr on contact with the tank.
Rail yard:
Tank filling area – local background to 20 R/hr general area.
Racks of filling pipes – local background to 100R/hr on contact.
Propane rail car tank – 30 R/hr on contact.
Radon in natural gas sample results are presented in Table 6-7. The highest concentration of Rn,
71.1 pCi/L, was measured in natural gas entering the processing plant. The lowest concentration
of Rn, 8.6 pCi/L, was measured in natural gas at the processing plant outflow. The Rn analytical
reports are presented in Appendix H.
A second visit to the facility was made to survey and sample filter media. The filter housing
with the highest exposure rate measured was selected for sampling and gamma spectroscopy
analysis. The outside of the filter housing measured 50 R/hr. The general radiation exposure
rate in the area of the filters was 15 R/hr. The filter housing on the facility propenizer
equipment was opened during a filter change-out and a sample of the cardboard filter media was
collected. The filter media sample was smeared for removable and surface radioactivity.
Smear samples of removable and surface radioactivity were taken on each of the individual
filter cases housing the filter media within the filter bank. The gross and removable surface
radioactivity results summary statistics of the 11 smear sample counts from the filter case are
presented in Table 6-8. The average and surface radioactivity levels are below the RG 1.86
and removable surface radioactivity criterion.
The results of the filter gamma spectrometry analysis are presented in Table 6-9. A Pb-210
activity result of 3,580 pCi/g was identified, but no other gamma-emitting NORM radionuclide
results were above 1 pCi/g. The gross and removable surface radioactivity results for the
filter media sample are presented in Table 6-10. The results are elevated relative to the RG 1.86
gross and removable surface radioactivity criterion.
6.5 Potential Exposure from Gas Scale Inside Pipes and Equipment
Materials deposited on interior surfaces of natural gas plant pipes and equipment are different
from conventional oil industry Ra-based pipe scale. Natural gas plant scale typically consists of
Rn decay progeny that accumulate on the interior surfaces of plant pipes and equipment without
the long-lived Ra parent.
As a result, the only radionuclides that remain and adhere to the interior surfaces of
machinery/pipes are the Rn decay progeny Po-210 and Pb-210. These longer-lived decay
progeny are not readily detected on the outside of pipes. However, Pb-210 and Po-210 emit
and radioactive particles that may be a potential inhalation or ingestion hazard when pipes and
machinery are opened for maintenance and/or cleaning.
Access to the internal surfaces of pipes and equipment for surveys of surface and activity
was not available. However, the facility propenizer equipment opened and sampled during filter
PA DEP TENORM Study Report – Section 6.0 Rev. 0
January 2015 6-4
change-out is representative of interior conditions and was described in Section 6.4. The results
are presented in Table 6-9. A Pb-210 activity result of 3,580 pCi/g was identified. No other
gamma-emitting NORM radionuclides above 1 pCi/g were identified. The results confirm the
build-up of the longer-lived Rn decay progeny in equipment and pipes. The concentration of
Pb-210 identified may present a potential inhalation or ingestion hazard during routine system
maintenance.
6.6 Radon Dosimetry
Radon exposure in homes due to the use of natural gas appliances is presented in this section.
Radon is transported with natural gas into structures (homes, apartments, and buildings) that use
natural gas for purposes such as heating and cooking.
The incremental increase of Rn-222 for a typical home was estimated using the values and
assumptions presented in Table 6-11 and as follows:
1. Well Site Rn-222 Concentration in Natural Gas For the Rn gas concentration, only
production site samples from Marcellus Shale well sites were used (n=16). The median
value was 43.6 pCi/L, and the maximum value was 148 pCi/L. Both of these values are used
in the estimations of potential Rn exposure.
2. Natural Gas/Rn-222 Transit Time and Decay Assumed there is no Rn decay during transit.
3. Radon-222 Influx Rate The American Gas Association average natural gas use per day
value of 5,465 L/day was used. The value does not consider the types of appliances used.
The amount of Rn liberated into the home per hour is calculated using the estimated natural
gas use per day (5,465 L/day) and the Rn concentration in that natural gas (43.6 and
148 pCi/L). The resulting values are 238,274 pCi/day for the median concentration and
808,820 pCi/day for the maximum concentration. Dividing each value by 24 hours per day
results in 9,928 pCi/hr and 33,700 pCi/hr, respectively. These estimates assume that none of
the appliances are vented. Consequently, all of the Rn in the natural gas is assumed to be
liberated into the residence.
Rn-222 Influx Rate = (5,465 L/day x 43.64 pCi/L) / 24 hrs/day = 9,928 pCi/hr
Rn-222 Influx Rate = (5,465 L/day x 148 pCi/L)/ 24 hrs/day = 33,700 pCi/hr
4. Air Exchange Rate Using a residence volume of 385,152 L and an air exchange rate of
0.68 air changes per hour, 261,903 L/hr of home air is exchanged with outdoor air.
5. Consistent with EPA Rn assessments, an equilibrium factor of 40 percent is assumed.
6. Indoor Rn-222 Activity Concentration The Rn-222 influx per hour divided by the home air
exchange rate per hour, 9,928 pCi/hr / 261,903 L/hr = 0.04 pCi/L for the median value.
The Rn-222 influx per hour divided by the home air exchange rate per hour, 33,700 pCi/hr /
261,903 L/hr = 0.13 pCi/L for the maximum value. This is the increase in Rn-222 in the
home resulting from natural gas use containing both a median value of 43.6 pCi/L and a
maximum value of 148 pCi/L of Rn-222.
PA DEP TENORM Study Report – Section 6.0 Rev. 0
January 2015 6-5
The increase in Rn concentration of 0.04 and 0.13 pCi/L along with the standard values
presented in Table 6-11 are used to estimate potential additional annual radiation dose to an
exposed individual.
Therefore,
0.04 𝑝𝐶𝑖 𝐿⁄ ∗ 0.4
100= 0.00016 𝑊𝐿
The cumulative exposure is then WL multiplied by the number of hours exposed divided by
170 hrs/working month.
0.00016 𝑊𝐿 ∗ 6,136 ℎ𝑟𝑠/𝑦𝑟
170 ℎ𝑟𝑠 𝑤𝑜𝑟𝑘𝑖𝑛𝑔 𝑚𝑜𝑛𝑡ℎ⁄= .006 𝑊𝐿𝑀/𝑦𝑟
This value was converted to a radiation dose by multiplying by the dose conversion factor, the
tissue weighting factor, and the radiation weighting factor:
0.08 ∗0.006 𝑊𝐿𝑀
𝑦𝑟∗
0.54 𝑟𝑎𝑑
𝑊𝐿𝑀∗
20 𝑟𝑒𝑚
𝑟𝑎𝑑∗
1000 𝑚𝑟𝑒𝑚
𝑟𝑒𝑚 = 5.2 𝑚𝑟𝑒𝑚 𝑦𝑟⁄
The result is 5.2 mrem/yr for the median dose and 17.8 mrem/yr for the maximum whole
body effective dose.
Based on the Rn and natural gas data collected as part of this study and the conservative
assumptions made, the incremental Rn increase in a home using natural gas appliances is
estimated to be very small and would not be detectable by commercially available Rn testing
devices. The radiation dose received by home residents is a small fraction of the allowable
general public dose limit of 100 mrem/yr.
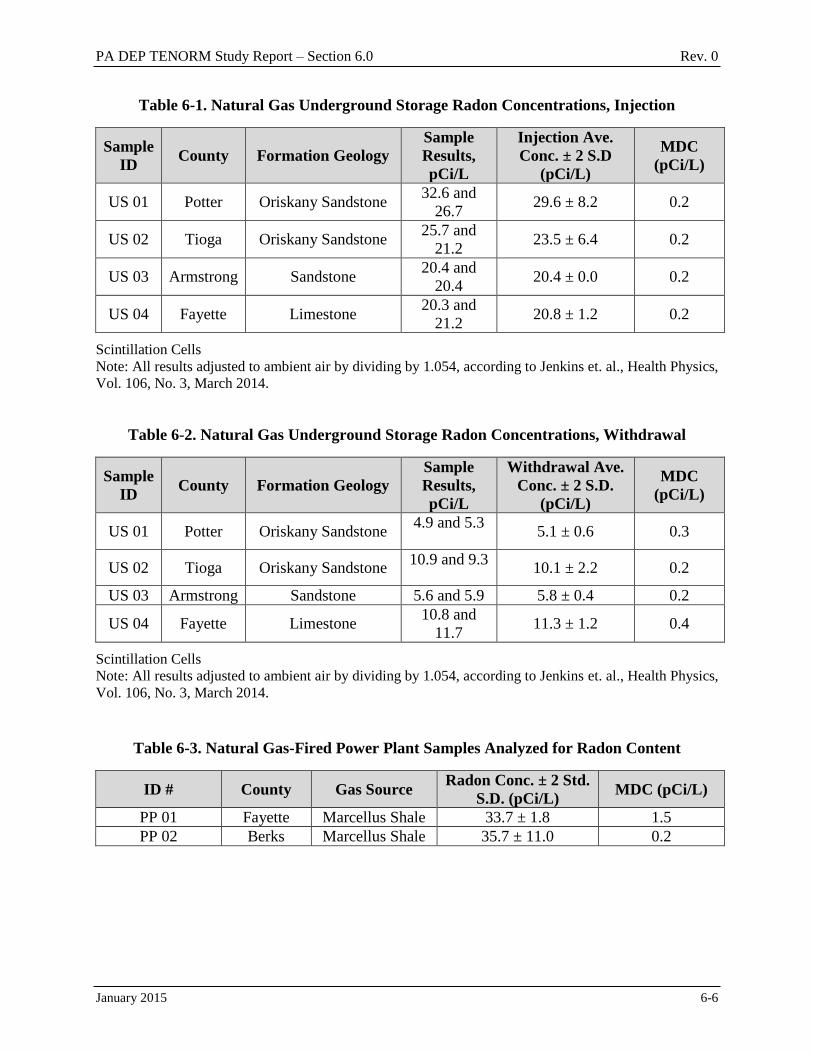
PA DEP TENORM Study Report – Section 6.0 Rev. 0
January 2015 6-6
Table 6-1. Natural Gas Underground Storage Radon Concentrations, Injection
Sample
ID County Formation Geology
Sample
Results,
pCi/L
Injection Ave.
Conc. ± 2 S.D
(pCi/L)
MDC
(pCi/L)
US 01 Potter Oriskany Sandstone 32.6 and
26.7 29.6 ± 8.2 0.2
US 02 Tioga Oriskany Sandstone 25.7 and
21.2 23.5 ± 6.4 0.2
US 03 Armstrong Sandstone 20.4 and
20.4 20.4 ± 0.0 0.2
US 04 Fayette Limestone 20.3 and
21.2 20.8 ± 1.2 0.2
Scintillation Cells
Note: All results adjusted to ambient air by dividing by 1.054, according to Jenkins et. al., Health Physics,
Vol. 106, No. 3, March 2014.
Table 6-2. Natural Gas Underground Storage Radon Concentrations, Withdrawal
Sample
ID County Formation Geology
Sample
Results,
pCi/L
Withdrawal Ave.
Conc. ± 2 S.D.
(pCi/L)
MDC
(pCi/L)
US 01 Potter Oriskany Sandstone 4.9 and 5.3
5.1 ± 0.6 0.3
US 02 Tioga Oriskany Sandstone 10.9 and 9.3
10.1 ± 2.2 0.2
US 03 Armstrong Sandstone 5.6 and 5.9 5.8 ± 0.4 0.2
US 04 Fayette Limestone 10.8 and
11.7 11.3 ± 1.2 0.4
Scintillation Cells
Note: All results adjusted to ambient air by dividing by 1.054, according to Jenkins et. al., Health Physics,
Vol. 106, No. 3, March 2014.
Table 6-3. Natural Gas-Fired Power Plant Samples Analyzed for Radon Content
ID # County Gas Source Radon Conc. ± 2 Std.
S.D. (pCi/L) MDC (pCi/L)
PP 01 Fayette Marcellus Shale 33.7 ± 1.8 1.5
PP 02 Berks Marcellus Shale 35.7 ± 11.0 0.2
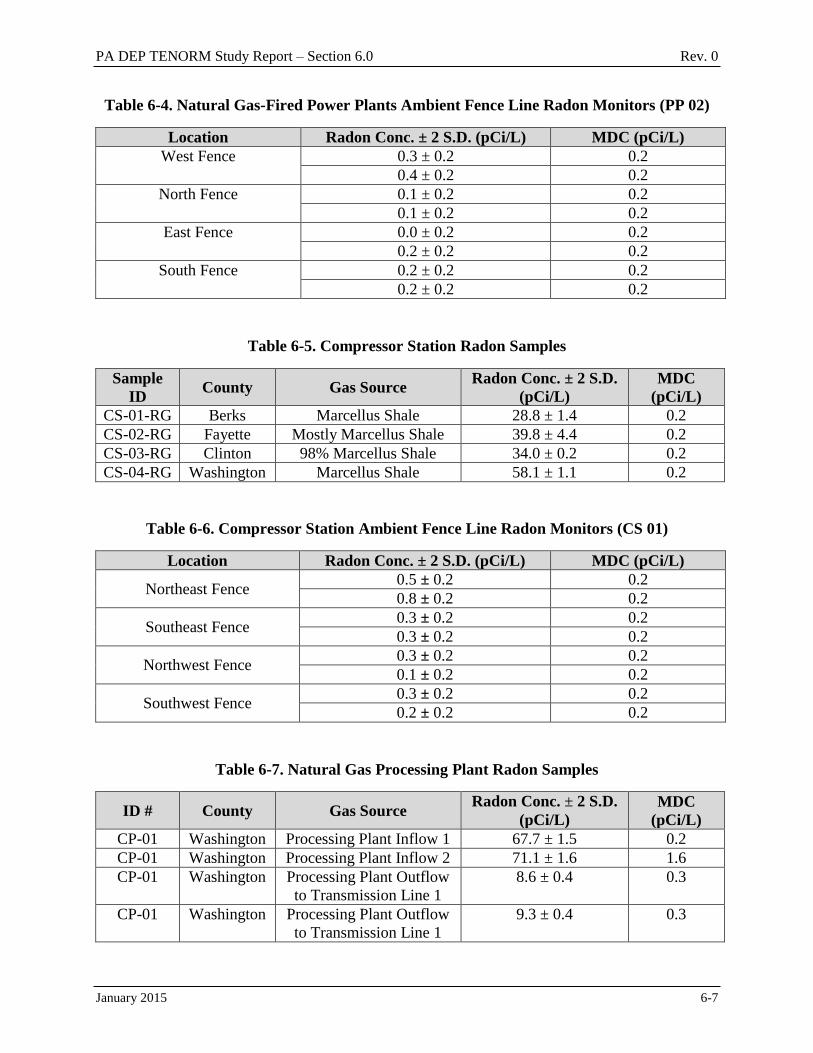
PA DEP TENORM Study Report – Section 6.0 Rev. 0
January 2015 6-7
Table 6-4. Natural Gas-Fired Power Plants Ambient Fence Line Radon Monitors (PP 02)
Location Radon Conc. ± 2 S.D. (pCi/L) MDC (pCi/L)
West Fence 0.3 ± 0.2 0.2
0.4 ± 0.2 0.2
North Fence 0.1 ± 0.2 0.2
0.1 ± 0.2 0.2
East Fence 0.0 ± 0.2 0.2
0.2 ± 0.2 0.2
South Fence 0.2 ± 0.2 0.2
0.2 ± 0.2 0.2
Table 6-5. Compressor Station Radon Samples
Sample
ID County Gas Source
Radon Conc. ± 2 S.D.
(pCi/L)
MDC
(pCi/L)
CS-01-RG Berks Marcellus Shale 28.8 ± 1.4 0.2
CS-02-RG Fayette Mostly Marcellus Shale 39.8 ± 4.4 0.2
CS-03-RG Clinton 98% Marcellus Shale 34.0 ± 0.2 0.2
CS-04-RG Washington Marcellus Shale 58.1 ± 1.1 0.2
Table 6-6. Compressor Station Ambient Fence Line Radon Monitors (CS 01)
Location Radon Conc. ± 2 S.D. (pCi/L) MDC (pCi/L)
Northeast Fence 0.5 ± 0.2 0.2
0.8 ± 0.2 0.2
Southeast Fence 0.3 ± 0.2 0.2
0.3 ± 0.2 0.2
Northwest Fence 0.3 ± 0.2 0.2
0.1 ± 0.2 0.2
Southwest Fence 0.3 ± 0.2 0.2
0.2 ± 0.2 0.2
Table 6-7. Natural Gas Processing Plant Radon Samples
ID # County Gas Source Radon Conc. ± 2 S.D.
(pCi/L)
MDC
(pCi/L)
CP-01 Washington Processing Plant Inflow 1 67.7 ± 1.5 0.2
CP-01 Washington Processing Plant Inflow 2 71.1 ± 1.6 1.6
CP-01 Washington Processing Plant Outflow
to Transmission Line 1
8.6 ± 0.4 0.3
CP-01 Washington Processing Plant Outflow
to Transmission Line 1
9.3 ± 0.4 0.3

PA DEP TENORM Study Report – Section 6.0 Rev. 0
January 2015 6-8
Table 6-8. Compressor Station and Natural Gas
Processing Plant Filter Case Removable Radioactivity Results
Facility ID No. of
Data Points
Removable Alpha (dpm/100 cm2)
Minimum Maximum Standard Deviation Average
CP-01-FS-136 11 4.70 29.6 8.78 15.5
Facility ID No. of Data
Points
Removable Beta (dpm/100 cm2)
Minimum Maximum Standard Deviation Average
CP-01-FS-136 11 8.25 96.0 23.9 32.2
Table 6-9. Compressor and Natural Gas
Processing Plant Filter Media, Gamma Spectroscopy
Nuclide Result Error MDC Units
Ac-228 0.141 0.053 0.077 pCi/g
Bi-212 0.287 0.000 0.373 pCi/g
Bi-214 0.564 0.082 0.054 pCi/g
K-40 1.30 0.216 0.225 pCi/g
Pb-210 3,580 552 14.2 pCi/g
Pb-212 0.066 0.044 0.071 pCi/g
Pb-214 0.629 0.070 0.076 pCi/g
Ra-226 0.585 0.566 0.926 pCi/g
Ra-228 0.141 0.053 0.077 pCi/g
Th-232 0.125 0.047 0.077 pCi/g
U-235 -0.105 0.000 0.382 pCi/g
U-238 -14.7 0.000 3.15 pCi/g
Table 6-10. Natural Gas Processing Plant Filter Media, Gross Alpha/Gross Beta
Sample Gross Alpha Gross Beta
Filter Media 708 ± 15.2 dpm/cm2
1,914 ± 11.9 dpm/cm2
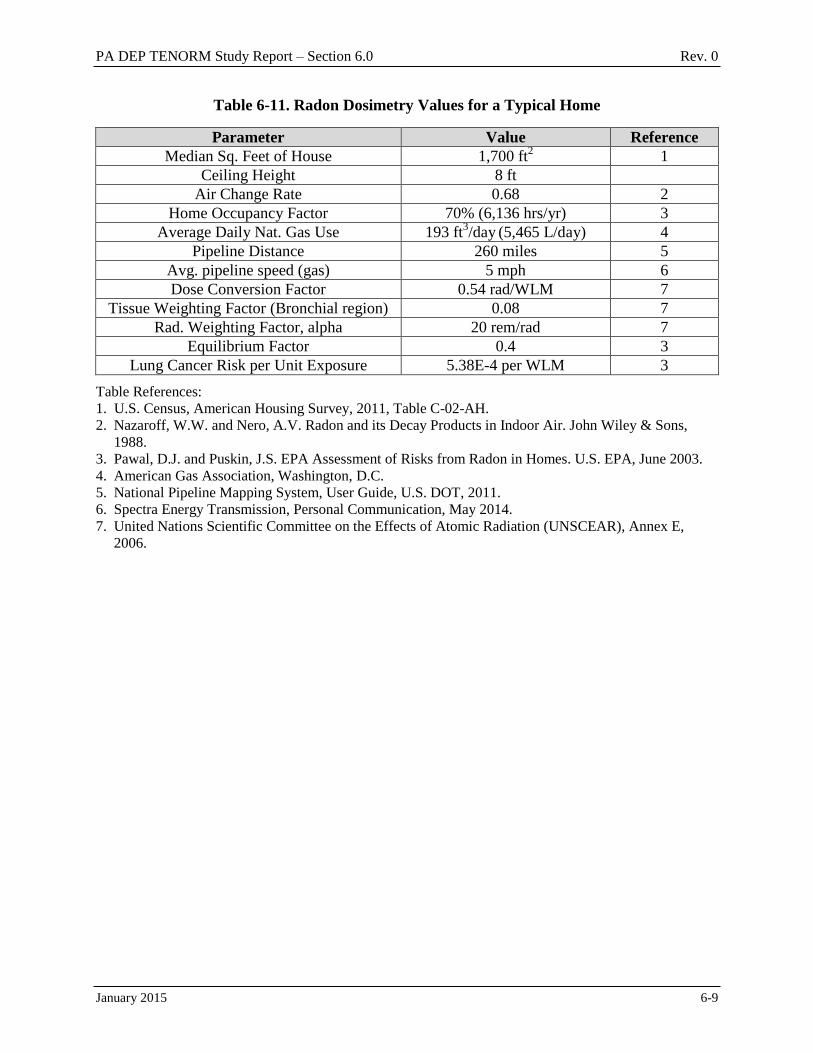
PA DEP TENORM Study Report – Section 6.0 Rev. 0
January 2015 6-9
Table 6-11. Radon Dosimetry Values for a Typical Home
Parameter Value Reference
Median Sq. Feet of House 1,700 ft2 1
Ceiling Height 8 ft
Air Change Rate 0.68 2
Home Occupancy Factor 70% (6,136 hrs/yr) 3
Average Daily Nat. Gas Use 193 ft3/day
(5,465 L/day) 4
Pipeline Distance 260 miles 5
Avg. pipeline speed (gas) 5 mph 6
Dose Conversion Factor 0.54 rad/WLM 7
Tissue Weighting Factor (Bronchial region) 0.08 7
Rad. Weighting Factor, alpha 20 rem/rad 7
Equilibrium Factor 0.4 3
Lung Cancer Risk per Unit Exposure 5.38E-4 per WLM 3
Table References:
1. U.S. Census, American Housing Survey, 2011, Table C-02-AH.
2. Nazaroff, W.W. and Nero, A.V. Radon and its Decay Products in Indoor Air. John Wiley & Sons,
1988.
3. Pawal, D.J. and Puskin, J.S. EPA Assessment of Risks from Radon in Homes. U.S. EPA, June 2003.
4. American Gas Association, Washington, D.C.
5. National Pipeline Mapping System, User Guide, U.S. DOT, 2011.
6. Spectra Energy Transmission, Personal Communication, May 2014.
7. United Nations Scientific Committee on the Effects of Atomic Radiation (UNSCEAR), Annex E,
2006.
PA DEP TENORM Study Report – Section 7.0 Rev. 0
January 2015 7-1
7.0 OIL AND GAS BRINE-TREATED ROADS
Brine produced from O&G wells and other sources such as brine treatment plants and brine wells
is used as a dust suppressant and road stabilizer on unpaved secondary roads in Pennsylvania.
The O&G brine used is from conventional formations only. DEP has developed a fact sheet,
Roadspreading of Brine for Dust Control and Road Stabilization, for use as a guide when
utilizing brine on unpaved roads. The fact sheet was developed under the authority of the Clean
Streams Law, the Solid Waste Management Act, and Chapters 78 and 101 of DEP’s Rules and
Regulations (DEP 2013).
For this study, roads in the southwest, northwest, and north-central regions were surveyed and
sampled. Most O&G operations occur in these regions. The surveys and sampling included:
Thirty-two O&G brine-treated roads were surveyed. Thirty-one biased surface samples were
collected from the O&G brine-treated roads. The biased locations were selected based on
increased instrument audio response monitored by the technician during scan surveys.
Eighteen reference background roads were surveyed, consisting of roads geographically
close to an O&G brine-treated road that had not been identified as O&G brine-treated.
Fourteen surface samples were collected from reference background roads.
7.1 Gamma Radioactivity Survey Results
The surveys included gross gamma radiation scans performed using 2-inch x 2-inch NaI
detectors and a Ludlum Model 2221 scaler/ratemeter instrument. Two detectors were attached to
the hitch of a standard sport utility vehicle (SUV) approximately 3 ft apart. This detector array
was offset to provide as much edge/shoulder coverage as possible. Each detector was mounted
approximately 6 inches above the road surface. Every road had a complete scan on both sides.
A total of four detector passes on each road were conducted. The instrument data were recorded
along with the location information using a pair of Trimble™ ProXT global positioning system
(GPS) units.
7.1.1 Gross Gamma Radiation Scan Results
Gross gamma radiation scans, recorded in cpm, were performed on 32 road surfaces treated with
O&G brine for dust suppression and road stabilization. The gamma radiation count rate data and
GPS data were downloaded and placed on maps using the most recent aerial maps available from
Pennsylvania Spatial Data Access (PASDA). GIS software was used to develop a graphic
display of the gamma scan results. The resulting gamma radiation count rate intensity images
are presented in Appendix E. The minimum, maximum, median, mean, and standard deviations
for each data set are presented in Table 7-1. In addition to calculating the file statistics, a two-
sample student t-test was performed.
The two-sample student t-test was used to compare the subject road (O&G brine-treated) results
with a reference background road. ProUCL version 5.0 was used to perform the student t-test on
the data. The Null Hypothesis tested is that the mean value of the treated road gamma radiation
count rate data is statistically different from the mean value of the reference background road
gamma radiation count rate data at the 95 percent confidence level. The results of the t-test for
PA DEP TENORM Study Report – Section 7.0 Rev. 0
January 2015 7-2
each pair of road results are included in Table 7-1. Sixteen of 28 comparisons of O&G brine-
treated and reference background roads are statistically different at the 95 percent confidence
level. The t-test output files are included in Appendix G.
7.1.2 Gamma Radiation Exposure Rate Results Summary
Gross gamma radiation scan results in units of cpm were converted to R/hr using 800 cpm per
R/hr, a conversion factor appropriate for Ra-226 gamma energy as detected with 2-inch by
2-inch NaI detectors rounded to one significant figure (Table 6.4, NaI Scintillation Detector Scan
MDCs for Common Radiological Contaminants, NUREG-1507, Minimum Detectable
Concentrations With Typical Radiation Survey Instruments for Various Contaminants and Field
Conditions, USNRC June 1998). Table 7-2 presents the results for each road.
7.2 Soil Sample Results
Biased surface soil samples were collected based on the audio response of the gamma scan
survey instrument ratemeter on 31 of the 32 O&G brine-treated roads. When an area with
elevated radioactivity was detected, surface soil samples were collected at that area.
7.2.1 Road Surface Soils Biased Sample Results
The gamma spectroscopy results are presented in Tables 7-3 through 7-5 for the U, Th, and Ac
series radionuclides. A review of the U series radionuclides indicates excess Ra-226 activity in
19 of 33 surface soil samples. For the purposes of this study, excess Ra-226 activity is defined
as Ra-226 activity greater than the natural background U decay series activity in surface soil.
The excess Ra-226 activity was determined as follows:
The O&G brine applied to road surfaces contains Ra-226 and its progeny. It does not contain
U, which is insoluble. Therefore, the U-238 activity identified in the gamma spectroscopy
analysis results represents the natural background U series activity in surface soil for the
area. The average U-238 activity of the 31 samples is 0.882 pCi/g.
U-235 makes up 0.7 percent by weight of natural U, which equates to 1/22 of the U-238
activity. Therefore, 0.040 pCi/g of U-235 is present in the surface soil samples.
Radium-226 is measured directly by detection of its 186.2 keV energy line (3.28 percent
yield). However, the presence of U-235 can cause interference with direct Ra-226 detection
because it has a gamma line of similar energy (185.7 keV at 54 percent yield). In solid
samples where natural U including U-238 and Ra-226 are at equal activity and U-235 is at
1/22 the activity of U-238, overestimation of Ra-226 is quantified by multiplying the U-235
activity by the ratio of the yields of the similar gamma radiation emissions, i.e., 54/3.28.
Therefore, the Ra-226 overestimation in the surface soil samples is equal to 0.660 pCi/g
[0.040 pCi/g x (54/3.28) = 0.660 pCi/g].
After correcting the reported Ra-226 activity by 0.882 pCi/g of natural background activity
and 0.662 pCi/g of U-235 bias, 19 of 31 samples have excess Ra ranging from 0.108 to
5.42 pCi/g above natural background.
PA DEP TENORM Study Report – Section 7.0 Rev. 0
January 2015 7-3
See Section 2.3 for a complete discussion of the identification of NORM radionuclides by
gamma spectroscopy.
The gamma spectroscopy results for the Th series radionuclides indicate the Th series is in
secular equilibrium. The Th-232 mean and median values are essentially equal and the standard
deviation is a fraction of the mean value, indicating the data is normally distributed. A normal
distribution of radioactivity measurements is indicative of natural background radioactivity,
which is more homogeneous than contaminated soil. The mean Ra-228 activity of the 31 surface
soil samples is 0.977 + 0.351 pCi/g. The range of the results is from 0.455 to 1.85 pCi/g.
7.2.2 Road Surface Soils – Reference Background Roads Soils
As a point of reference and for comparison, 18 roads in the geographic vicinity of the subject
roads that have not been identified as O&G brine-treated were selected for surveying, and 14
biased soil samples were collected. The gamma spectroscopy results of the background samples
are presented in Tables 7-6 through 7-8 for the U, Th, and Ac series radionuclides. A review of
the U series radionuclides indicates excess Ra-226 activity in 14 surface soil samples. Excess
Ra-226 activity is greater than the natural background U decay series activity in surface soil.
The excess Ra-226 activity was determined as follows:
The O&G brine applied to road surfaces contains Ra-226 and its progeny. It does not contain
U, which is insoluble. Therefore, the U-238 activity identified in the gamma spectroscopy
analysis results represents the natural background U series activity in surface soil for the
area. The average U-238 activity of the 14 samples is 0.819 pCi/g.
U-235 makes up 0.7 percent by weight of natural U, which equates to 1/22 of the U-238
activity. Therefore, there is 0.037 pCi/g of U-235 present in the surface soil samples.
Radium-226 is measured directly by detection of its 186.2 keV energy line (3.28 percent
yield). However, the presence of U-235 can cause interference with direct Ra-226 detection
since it has a gamma line of similar energy (185.7 keV at 54 percent yield). In solid samples
where natural U including U-238 and Ra-226 at equal activity and U-235 at 1/22 the activity
of U-238, overestimation of Ra-226 is quantified by multiplying the U-235 activity by the
ratio of the yields of the similar gamma emissions, i.e., 54/3.28. Therefore, the Ra-226
overestimation in the surface soil samples is equal to 0.037 pCi/g x (54/3.28) = 0.61 pCi/g.
After correcting the reported Ra-226 activity by 0.819 pCi/g of natural background activity
and 0.71 pCi/g of U-235 bias, 11 of 14 samples have excess Ra ranging from 0.118 to
61.5 pCi/g above natural background.
See Section 2.3 for a complete discussion of the identification of NORM radionuclides by
gamma spectroscopy.
The gamma spectroscopy results for the Th decay series are not normally distributed nor
indicative of natural Th background radioactivity. Thorium-232 mean and median values are not
equal and the standard deviation is large relative to the mean value, indicating the data are not
normally distributed and heterogeneous. A normal distribution of radioactivity measurements is
indicative of natural background radioactivity, which is more homogeneous than contaminated

PA DEP TENORM Study Report – Section 7.0 Rev. 0
January 2015 7-4
soil. The mean Ra-228 activity of the 14 surface soil samples is 1.93 + 2.81 pCi/g. The range of
the results is from 0.396 to 11.2 pCi/g.
The background reference road soil sample results are positive for excess Ra-226 at 11 of 14
roads sampled. Three of the Ra-228 results are greater than 2.98 pCi/g, which is approximately
three times natural background for the Th series. The excess Ra is higher than for the identified
O&G brine-treated roads. The average excess Ra-226 for roads identified as having been O&G
brine-treated is 1.13 pCi/g compared to an average of 8.23 pCi/g on the background reference
roads. One possible explanation is that all of the roads have been treated with O&G brine. After
the 32 roads had been identified as O&G brine-treated, the reference background roads were
selected by proximity to the 32 roads. Nothing precluded the selected background roads from
having been treated with O&G brine.
7.3 Public Exposure to Oil and Gas Brine-Treated Roads
A total of 31 samples were collected from roads treated with O&G brine. An additional 14
surface soil samples were taken in reference background areas not expected to be impacted by
O&G brine treatment. Both the treated and the reference background roads were positive for
excess Ra. To evaluate potential exposure to the public from the O&G brine-treated roads, a
source term of 1 pCi/g of Ra-226 and 0.5 pCi/g of Ra-228 was assumed within a 6-inch layer of
surface material (treated road surface).
The Argonne National Laboratory RESidual RADioactivity (RESRAD) Version 7.0 code for
modeling exposure from residual radioactivity was used to evaluate potential exposure from the
O&G brine-treated roads. RESRAD is a computer model designed to estimate radiation doses
and risks from residual radioactive materials. RESRAD has been used widely by DOE, its
operations and area offices, and its contractors for deriving limits for radionuclides in soil.
RESRAD has also been used by EPA, U.S. Army Corps of Engineers (USACE), NRC, industrial
firms, universities, and foreign government agencies and institutions. The recreationist is an
appropriate exposure scenario based on the remote location of the roads. A recreationist, such as
a jogger or hunter, usually spends less time on the impacted area, e.g., two hours a day, three
days a week, than a resident. However, a recreationist may have a higher inhalation rate than a
resident. Recreational land use addresses exposure to people who spend a limited amount of
time at or near a site while playing, fishing, hunting, hiking, or engaging in other outdoor
activities. Environmental exposure pathways included in the recreationist scenario include
ground external gamma, inhalation, Rn, plant consumption, meat consumption, milk
consumption, and soil ingestion.
The estimated total dose from 1 pCi/g of Ra-226 and 0.5 pCi/g of Ra-228 above natural
background in surface soil, to a recreationist, in the year of maximum exposure (year 1) is
0.441 mrem/yr, which is below the 100 mrem/yr public exposure criteria based on assumed
activity concentrations. The results of the environmental pathways for year 1, the year of
maximum dose, are presented in Table 7-9. The actual dose received is dependent upon both the
excess Ra radioactivity in surface soil and the time spent exposed to the soil surface.
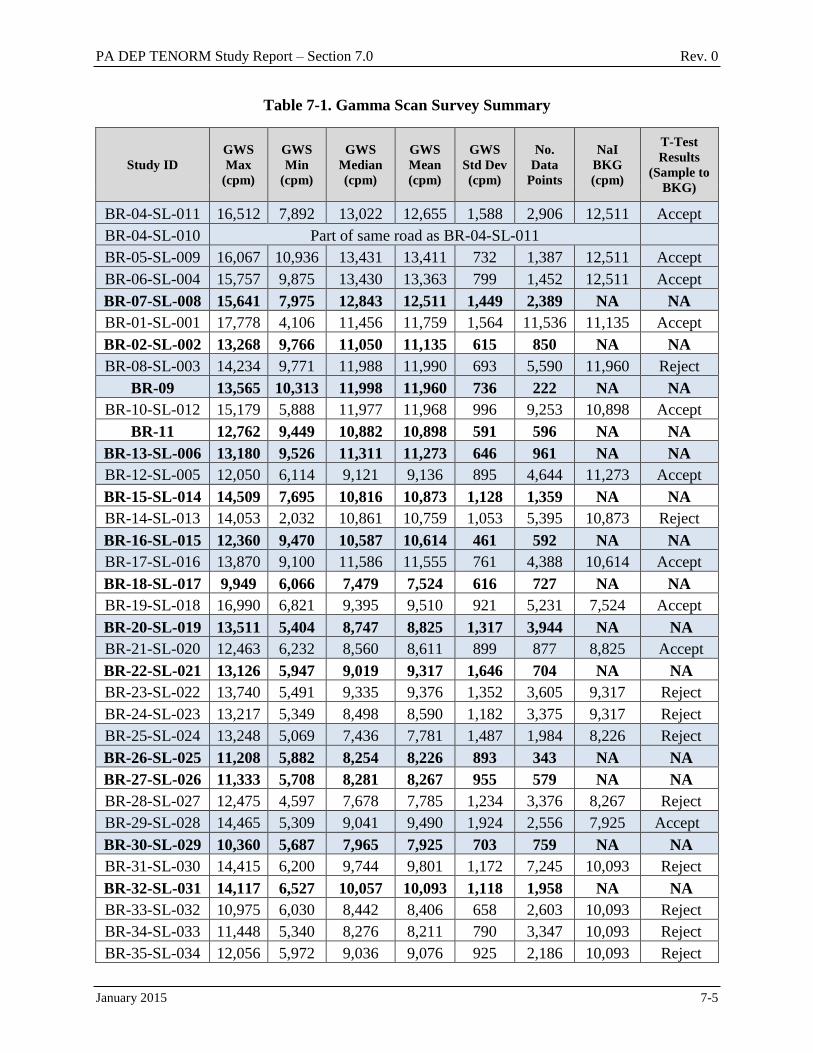
PA DEP TENORM Study Report – Section 7.0 Rev. 0
January 2015 7-5
Table 7-1. Gamma Scan Survey Summary
Study ID
GWS
Max
(cpm)
GWS
Min
(cpm)
GWS
Median
(cpm)
GWS
Mean
(cpm)
GWS
Std Dev
(cpm)
No.
Data
Points
NaI
BKG
(cpm)
T-Test
Results
(Sample to
BKG)
BR-04-SL-011 16,512 7,892 13,022 12,655 1,588 2,906 12,511 Accept
BR-04-SL-010 Part of same road as BR-04-SL-011
BR-05-SL-009 16,067 10,936 13,431 13,411 732 1,387 12,511 Accept
BR-06-SL-004 15,757 9,875 13,430 13,363 799 1,452 12,511 Accept
BR-07-SL-008 15,641 7,975 12,843 12,511 1,449 2,389 NA NA
BR-01-SL-001 17,778 4,106 11,456 11,759 1,564 11,536 11,135 Accept
BR-02-SL-002 13,268 9,766 11,050 11,135 615 850 NA NA
BR-08-SL-003 14,234 9,771 11,988 11,990 693 5,590 11,960 Reject
BR-09 13,565 10,313 11,998 11,960 736 222 NA NA
BR-10-SL-012 15,179 5,888 11,977 11,968 996 9,253 10,898 Accept
BR-11 12,762 9,449 10,882 10,898 591 596 NA NA
BR-13-SL-006 13,180 9,526 11,311 11,273 646 961 NA NA
BR-12-SL-005 12,050 6,114 9,121 9,136 895 4,644 11,273 Accept
BR-15-SL-014 14,509 7,695 10,816 10,873 1,128 1,359 NA NA
BR-14-SL-013 14,053 2,032 10,861 10,759 1,053 5,395 10,873 Reject
BR-16-SL-015 12,360 9,470 10,587 10,614 461 592 NA NA
BR-17-SL-016 13,870 9,100 11,586 11,555 761 4,388 10,614 Accept
BR-18-SL-017 9,949 6,066 7,479 7,524 616 727 NA NA
BR-19-SL-018 16,990 6,821 9,395 9,510 921 5,231 7,524 Accept
BR-20-SL-019 13,511 5,404 8,747 8,825 1,317 3,944 NA NA
BR-21-SL-020 12,463 6,232 8,560 8,611 899 877 8,825 Accept
BR-22-SL-021 13,126 5,947 9,019 9,317 1,646 704 NA NA
BR-23-SL-022 13,740 5,491 9,335 9,376 1,352 3,605 9,317 Reject
BR-24-SL-023 13,217 5,349 8,498 8,590 1,182 3,375 9,317 Reject
BR-25-SL-024 13,248 5,069 7,436 7,781 1,487 1,984 8,226 Reject
BR-26-SL-025 11,208 5,882 8,254 8,226 893 343 NA NA
BR-27-SL-026 11,333 5,708 8,281 8,267 955 579 NA NA
BR-28-SL-027 12,475 4,597 7,678 7,785 1,234 3,376 8,267 Reject
BR-29-SL-028 14,465 5,309 9,041 9,490 1,924 2,556 7,925 Accept
BR-30-SL-029 10,360 5,687 7,965 7,925 703 759 NA NA
BR-31-SL-030 14,415 6,200 9,744 9,801 1,172 7,245 10,093 Reject
BR-32-SL-031 14,117 6,527 10,057 10,093 1,118 1,958 NA NA
BR-33-SL-032 10,975 6,030 8,442 8,406 658 2,603 10,093 Reject
BR-34-SL-033 11,448 5,340 8,276 8,211 790 3,347 10,093 Reject
BR-35-SL-034 12,056 5,972 9,036 9,076 925 2,186 10,093 Reject
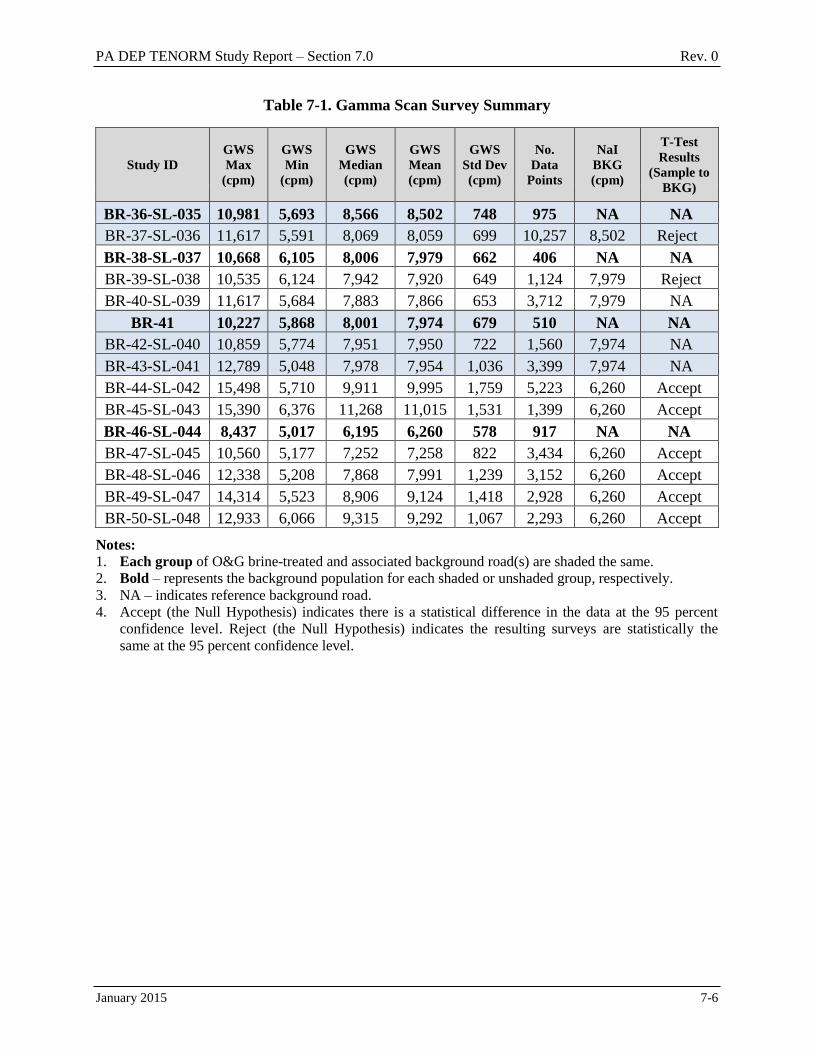
PA DEP TENORM Study Report – Section 7.0 Rev. 0
January 2015 7-6
Table 7-1. Gamma Scan Survey Summary
Study ID
GWS
Max
(cpm)
GWS
Min
(cpm)
GWS
Median
(cpm)
GWS
Mean
(cpm)
GWS
Std Dev
(cpm)
No.
Data
Points
NaI
BKG
(cpm)
T-Test
Results
(Sample to
BKG)
BR-36-SL-035 10,981 5,693 8,566 8,502 748 975 NA NA
BR-37-SL-036 11,617 5,591 8,069 8,059 699 10,257 8,502 Reject
BR-38-SL-037 10,668 6,105 8,006 7,979 662 406 NA NA
BR-39-SL-038 10,535 6,124 7,942 7,920 649 1,124 7,979 Reject
BR-40-SL-039 11,617 5,684 7,883 7,866 653 3,712 7,979 NA
BR-41 10,227 5,868 8,001 7,974 679 510 NA NA
BR-42-SL-040 10,859 5,774 7,951 7,950 722 1,560 7,974 NA
BR-43-SL-041 12,789 5,048 7,978 7,954 1,036 3,399 7,974 NA
BR-44-SL-042 15,498 5,710 9,911 9,995 1,759 5,223 6,260 Accept
BR-45-SL-043 15,390 6,376 11,268 11,015 1,531 1,399 6,260 Accept
BR-46-SL-044 8,437 5,017 6,195 6,260 578 917 NA NA
BR-47-SL-045 10,560 5,177 7,252 7,258 822 3,434 6,260 Accept
BR-48-SL-046 12,338 5,208 7,868 7,991 1,239 3,152 6,260 Accept
BR-49-SL-047 14,314 5,523 8,906 9,124 1,418 2,928 6,260 Accept
BR-50-SL-048 12,933 6,066 9,315 9,292 1,067 2,293 6,260 Accept
Notes:
1. Each group of O&G brine-treated and associated background road(s) are shaded the same.
2. Bold – represents the background population for each shaded or unshaded group, respectively.
3. NA – indicates reference background road.
4. Accept (the Null Hypothesis) indicates there is a statistical difference in the data at the 95 percent
confidence level. Reject (the Null Hypothesis) indicates the resulting surveys are statistically the
same at the 95 percent confidence level.

PA DEP TENORM Study Report – Section 7.0 Rev. 0
January 2015 7-7
Table 7-2. Summary of NaI Gamma Count Rate Data Converted to Exposure Rate
Site GWS Max
(µR/hr)
GWS Min
(µR/hr)
GWS
Median
(µR/hr)
GWS
Mean
(µR/hr)
GWS Std.
Dev.
(µR/hr)
No. Data
Points
BR-04-
SL-011 20.6 9.90 16.3 15.8 2.00 2,906
BR-04-
SL-010 Part of same road as BR-04-SL-011 – file statistics are same.
BR-05-
SL-009 20.1 13.7 16.8 16.8 0.90 1,387
BR-06-
SL-004 19.7 12.3 16.8 16.7 1.00 1,452
BR-07-
SL-008 19.6 10.0 16.1 15.6 1.80 2,389
BR-01-
SL-001 22.2 5.10 14.3 14.7 2.00 11,536
BR-02-
SL-002 16.6 12.2 13.8 13.9 0.800 850
BR-08-
SL-003 17.8 12.2 15.0 15.0 0.900 5,590
BR-09 17.0 12.9 15.0 15.0 0.90 222
BR-10-
SL-012 19.0 7.40 15.0 15.0 1.20 9,253
BR-11 16.0 11.8 13.6 13.6 0.70 596
BR-13-
SL-006 16.5 11.9 14.1 14.1 0.80 961
BR-12-
SL-005 15.1 7.60 11.4 11.4 1.10 4,644
BR-15-
SL-014 18.1 9.60 13.5 13.6 1.40 1,359
BR-14-
SL-013 17.6 2.50 13.6 13.4 1.30 5,395
BR-16-
SL-015 15.5 11.8 13.2 13.3 0.600 592
BR-17-
SL-016 17.3 11.4 14.5 14.4 1.00 4,388
BR-18-
SL-017 12.4 7.60 9.30 9.40 0.800 727
BR-19-
SL-018 21.2 8.50 11.7 11.9 1.20 5,231
BR-20-
SL-019 16.9 6.80 10.9 11.0 1.60 3,944
BR-21-
SL-020 15.6 7.80 10.7 10.8 1.10 877
BR-22-
SL-021 16.4 7.40 11.3 11.6 2.10 704
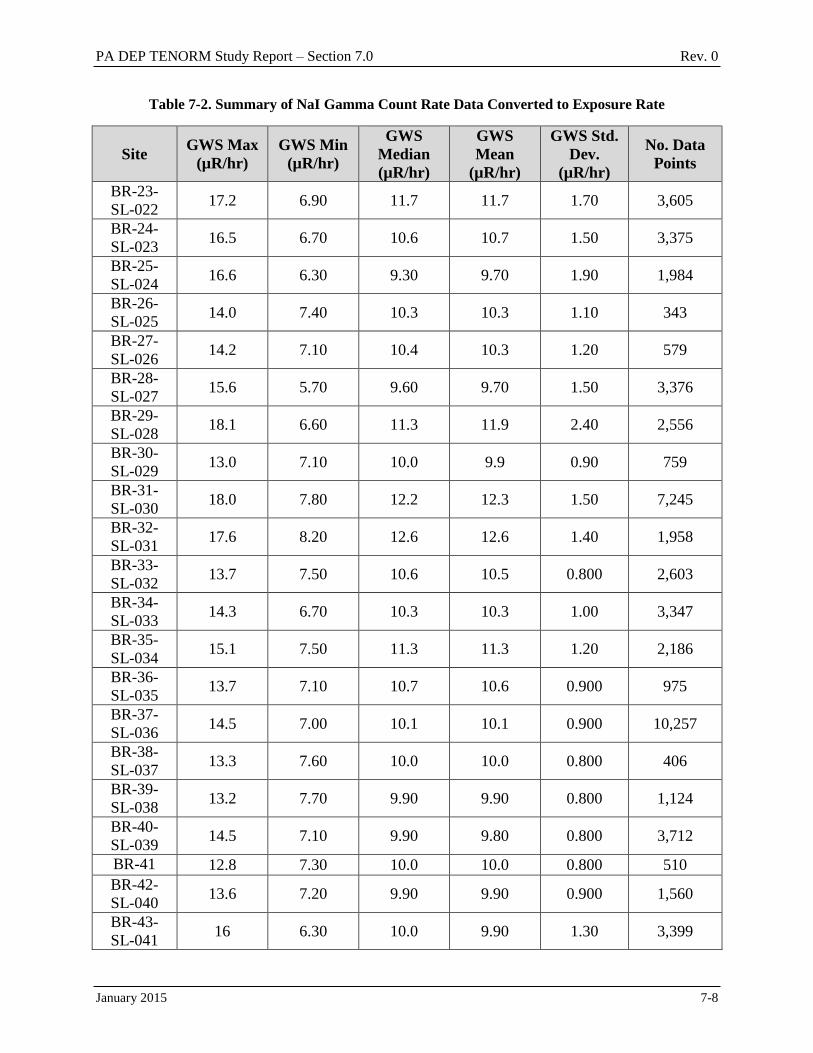
PA DEP TENORM Study Report – Section 7.0 Rev. 0
January 2015 7-8
Table 7-2. Summary of NaI Gamma Count Rate Data Converted to Exposure Rate
Site GWS Max
(µR/hr)
GWS Min
(µR/hr)
GWS
Median
(µR/hr)
GWS
Mean
(µR/hr)
GWS Std.
Dev.
(µR/hr)
No. Data
Points
BR-23-
SL-022 17.2 6.90 11.7 11.7 1.70 3,605
BR-24-
SL-023 16.5 6.70 10.6 10.7 1.50 3,375
BR-25-
SL-024 16.6 6.30 9.30 9.70 1.90 1,984
BR-26-
SL-025 14.0 7.40 10.3 10.3 1.10 343
BR-27-
SL-026 14.2 7.10 10.4 10.3 1.20 579
BR-28-
SL-027 15.6 5.70 9.60 9.70 1.50 3,376
BR-29-
SL-028 18.1 6.60 11.3 11.9 2.40 2,556
BR-30-
SL-029 13.0 7.10 10.0 9.9 0.90 759
BR-31-
SL-030 18.0 7.80 12.2 12.3 1.50 7,245
BR-32-
SL-031 17.6 8.20 12.6 12.6 1.40 1,958
BR-33-
SL-032 13.7 7.50 10.6 10.5 0.800 2,603
BR-34-
SL-033 14.3 6.70 10.3 10.3 1.00 3,347
BR-35-
SL-034 15.1 7.50 11.3 11.3 1.20 2,186
BR-36-
SL-035 13.7 7.10 10.7 10.6 0.900 975
BR-37-
SL-036 14.5 7.00 10.1 10.1 0.900 10,257
BR-38-
SL-037 13.3 7.60 10.0 10.0 0.800 406
BR-39-
SL-038 13.2 7.70 9.90 9.90 0.800 1,124
BR-40-
SL-039 14.5 7.10 9.90 9.80 0.800 3,712
BR-41 12.8 7.30 10.0 10.0 0.800 510
BR-42-
SL-040 13.6 7.20 9.90 9.90 0.900 1,560
BR-43-
SL-041 16 6.30 10.0 9.90 1.30 3,399

PA DEP TENORM Study Report – Section 7.0 Rev. 0
January 2015 7-9
Table 7-2. Summary of NaI Gamma Count Rate Data Converted to Exposure Rate
Site GWS Max
(µR/hr)
GWS Min
(µR/hr)
GWS
Median
(µR/hr)
GWS
Mean
(µR/hr)
GWS Std.
Dev.
(µR/hr)
No. Data
Points
BR-44-
SL-042 19.4 7.14 12.4 12.5 2.20 5,223
BR-45-
SL-043 19.2 7.97 14.1 13.8 1.91 1,399
BR-46-
SL-044 10.5 6.27 7.74 7.82 0.722 917
BR-47-
SL-045 13.2 6.47 9.06 9.07 1.03 3,434
BR-48-
SL-046 15.4 6.51 9.84 9.99 1.55 3,152
BR-49-
SL-047 17.9 6.90 11.1 11.4 1.77 2,928
BR-50-
SL-048 16.2 7.58 11.6 11.6 1.33 2,293
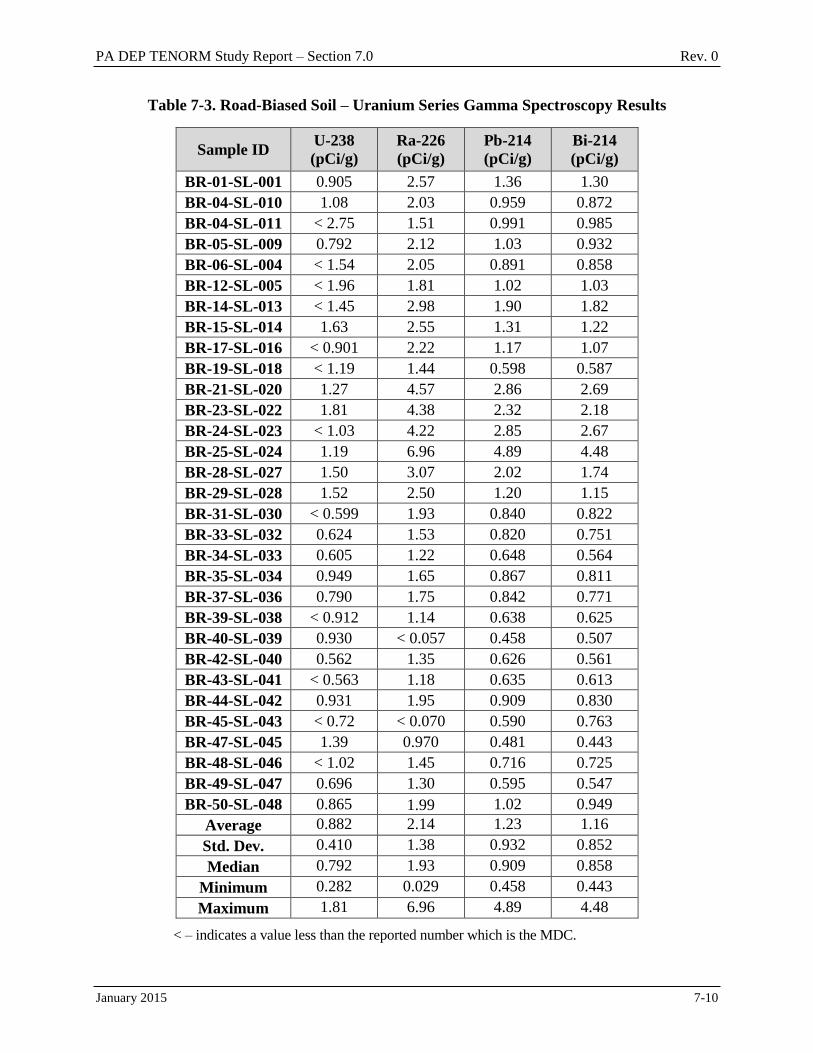
PA DEP TENORM Study Report – Section 7.0 Rev. 0
January 2015 7-10
Table 7-3. Road-Biased Soil – Uranium Series Gamma Spectroscopy Results
Sample ID U-238
(pCi/g)
Ra-226
(pCi/g)
Pb-214
(pCi/g)
Bi-214
(pCi/g)
BR-01-SL-001 0.905 2.57 1.36 1.30
BR-04-SL-010 1.08 2.03 0.959 0.872
BR-04-SL-011 < 2.75 1.51 0.991 0.985
BR-05-SL-009 0.792 2.12 1.03 0.932
BR-06-SL-004 < 1.54 2.05 0.891 0.858
BR-12-SL-005 < 1.96 1.81 1.02 1.03
BR-14-SL-013 < 1.45 2.98 1.90 1.82
BR-15-SL-014 1.63 2.55 1.31 1.22
BR-17-SL-016 < 0.901 2.22 1.17 1.07
BR-19-SL-018 < 1.19 1.44 0.598 0.587
BR-21-SL-020 1.27 4.57 2.86 2.69
BR-23-SL-022 1.81 4.38 2.32 2.18
BR-24-SL-023 < 1.03 4.22 2.85 2.67
BR-25-SL-024 1.19 6.96 4.89 4.48
BR-28-SL-027 1.50 3.07 2.02 1.74
BR-29-SL-028 1.52 2.50 1.20 1.15
BR-31-SL-030 < 0.599 1.93 0.840 0.822
BR-33-SL-032 0.624 1.53 0.820 0.751
BR-34-SL-033 0.605 1.22 0.648 0.564
BR-35-SL-034 0.949 1.65 0.867 0.811
BR-37-SL-036 0.790 1.75 0.842 0.771
BR-39-SL-038 < 0.912 1.14 0.638 0.625
BR-40-SL-039 0.930 < 0.057 0.458 0.507
BR-42-SL-040 0.562 1.35 0.626 0.561
BR-43-SL-041 < 0.563 1.18 0.635 0.613
BR-44-SL-042 0.931 1.95 0.909 0.830
BR-45-SL-043 < 0.72 < 0.070 0.590 0.763
BR-47-SL-045 1.39 0.970 0.481 0.443
BR-48-SL-046 < 1.02 1.45 0.716 0.725
BR-49-SL-047 0.696 1.30 0.595 0.547
BR-50-SL-048 0.865 1.99 1.02 0.949
Average 0.882 2.14 1.23 1.16
Std. Dev. 0.410 1.38 0.932 0.852
Median 0.792 1.93 0.909 0.858
Minimum 0.282 0.029 0.458 0.443
Maximum 1.81 6.96 4.89 4.48
< – indicates a value less than the reported number which is the MDC.
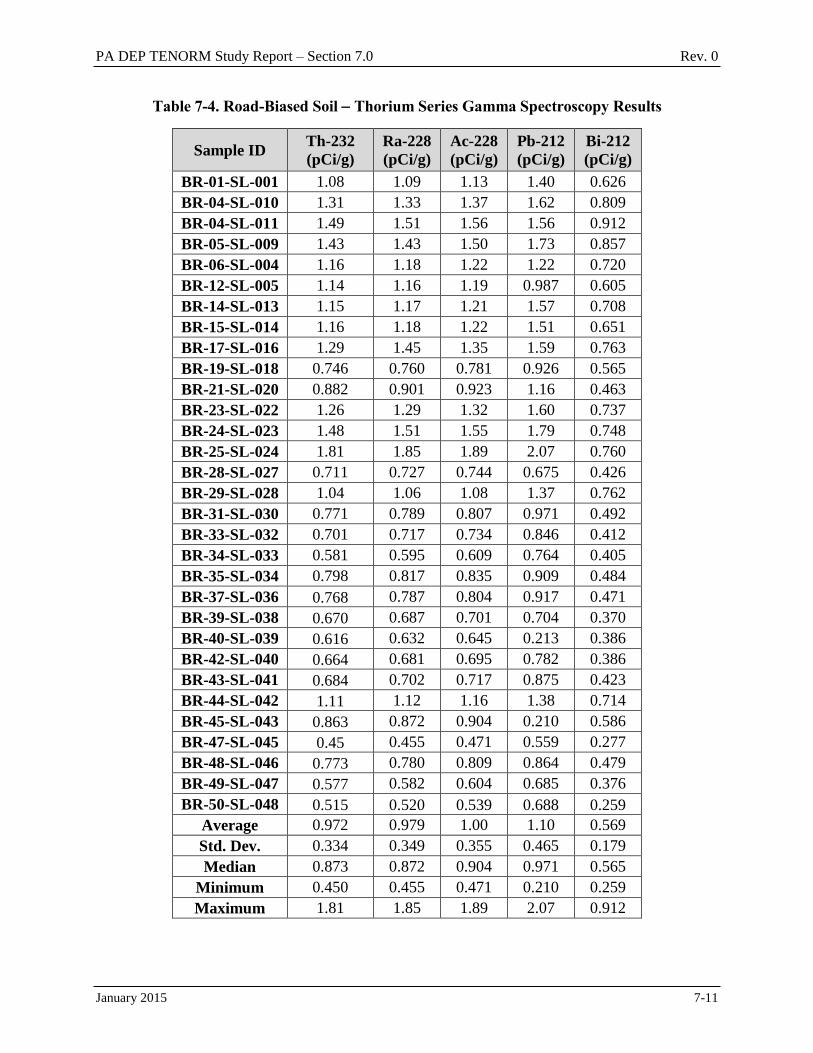
PA DEP TENORM Study Report – Section 7.0 Rev. 0
January 2015 7-11
Table 7-4. Road-Biased Soil Thorium Series Gamma Spectroscopy Results
Sample ID Th-232
(pCi/g)
Ra-228
(pCi/g)
Ac-228
(pCi/g)
Pb-212
(pCi/g)
Bi-212
(pCi/g)
BR-01-SL-001 1.08 1.09 1.13 1.40 0.626
BR-04-SL-010 1.31 1.33 1.37 1.62 0.809
BR-04-SL-011 1.49 1.51 1.56 1.56 0.912
BR-05-SL-009 1.43 1.43 1.50 1.73 0.857
BR-06-SL-004 1.16 1.18 1.22 1.22 0.720
BR-12-SL-005 1.14 1.16 1.19 0.987 0.605
BR-14-SL-013 1.15 1.17 1.21 1.57 0.708
BR-15-SL-014 1.16 1.18 1.22 1.51 0.651
BR-17-SL-016 1.29 1.45 1.35 1.59 0.763
BR-19-SL-018 0.746 0.760 0.781 0.926 0.565
BR-21-SL-020 0.882 0.901 0.923 1.16 0.463
BR-23-SL-022 1.26 1.29 1.32 1.60 0.737
BR-24-SL-023 1.48 1.51 1.55 1.79 0.748
BR-25-SL-024 1.81 1.85 1.89 2.07 0.760
BR-28-SL-027 0.711 0.727 0.744 0.675 0.426
BR-29-SL-028 1.04 1.06 1.08 1.37 0.762
BR-31-SL-030 0.771 0.789 0.807 0.971 0.492
BR-33-SL-032 0.701 0.717 0.734 0.846 0.412
BR-34-SL-033 0.581 0.595 0.609 0.764 0.405
BR-35-SL-034 0.798 0.817 0.835 0.909 0.484
BR-37-SL-036 0.768 0.787 0.804 0.917 0.471
BR-39-SL-038 0.670 0.687 0.701 0.704 0.370
BR-40-SL-039 0.616 0.632 0.645 0.213 0.386
BR-42-SL-040 0.664 0.681 0.695 0.782 0.386
BR-43-SL-041 0.684 0.702 0.717 0.875 0.423
BR-44-SL-042 1.11 1.12 1.16 1.38 0.714
BR-45-SL-043 0.863 0.872 0.904 0.210 0.586
BR-47-SL-045 0.45 0.455 0.471 0.559 0.277
BR-48-SL-046 0.773 0.780 0.809 0.864 0.479
BR-49-SL-047 0.577 0.582 0.604 0.685 0.376
BR-50-SL-048 0.515 0.520 0.539 0.688 0.259
Average 0.972 0.979 1.00 1.10 0.569
Std. Dev. 0.334 0.349 0.355 0.465 0.179
Median 0.873 0.872 0.904 0.971 0.565
Minimum 0.450 0.455 0.471 0.210 0.259
Maximum 1.81 1.85 1.89 2.07 0.912
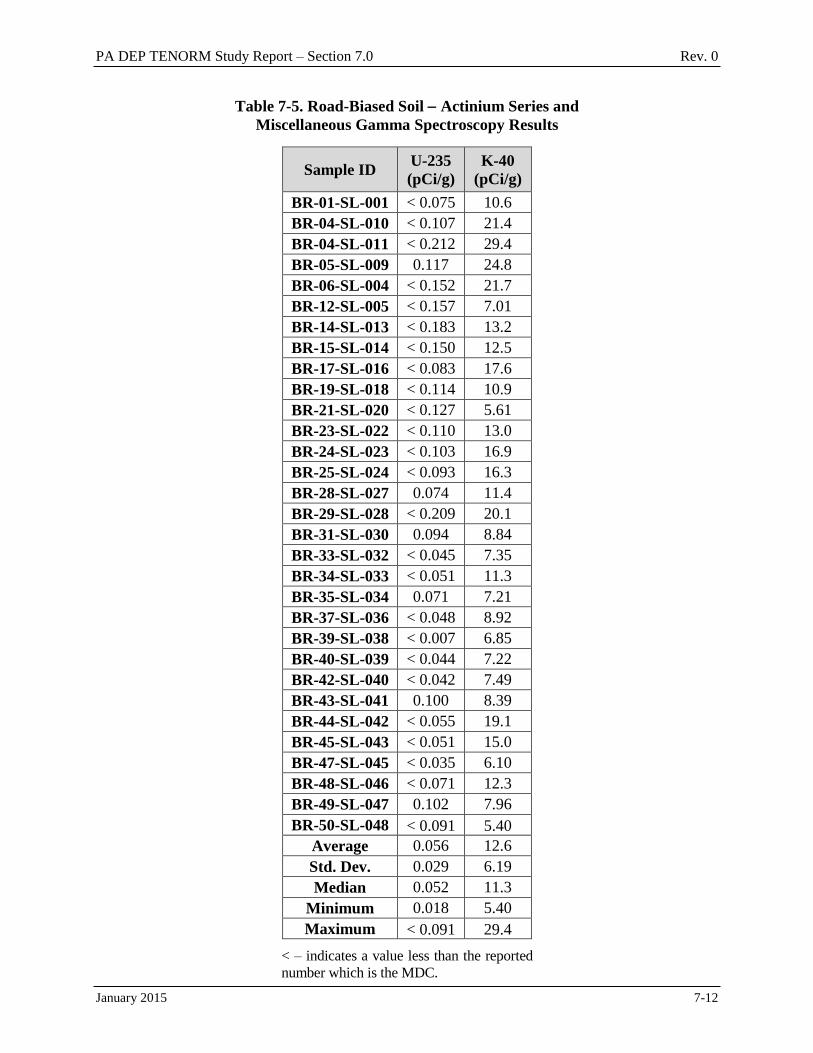
PA DEP TENORM Study Report – Section 7.0 Rev. 0
January 2015 7-12
Table 7-5. Road-Biased Soil Actinium Series and
Miscellaneous Gamma Spectroscopy Results
Sample ID U-235
(pCi/g)
K-40
(pCi/g)
BR-01-SL-001 < 0.075 10.6
BR-04-SL-010 < 0.107 21.4
BR-04-SL-011 < 0.212 29.4
BR-05-SL-009 0.117 24.8
BR-06-SL-004 < 0.152 21.7
BR-12-SL-005 < 0.157 7.01
BR-14-SL-013 < 0.183 13.2
BR-15-SL-014 < 0.150 12.5
BR-17-SL-016 < 0.083 17.6
BR-19-SL-018 < 0.114 10.9
BR-21-SL-020 < 0.127 5.61
BR-23-SL-022 < 0.110 13.0
BR-24-SL-023 < 0.103 16.9
BR-25-SL-024 < 0.093 16.3
BR-28-SL-027 0.074 11.4
BR-29-SL-028 < 0.209 20.1
BR-31-SL-030 0.094 8.84
BR-33-SL-032 < 0.045 7.35
BR-34-SL-033 < 0.051 11.3
BR-35-SL-034 0.071 7.21
BR-37-SL-036 < 0.048 8.92
BR-39-SL-038 < 0.007 6.85
BR-40-SL-039 < 0.044 7.22
BR-42-SL-040 < 0.042 7.49
BR-43-SL-041 0.100 8.39
BR-44-SL-042 < 0.055 19.1
BR-45-SL-043 < 0.051 15.0
BR-47-SL-045 < 0.035 6.10
BR-48-SL-046 < 0.071 12.3
BR-49-SL-047 0.102 7.96
BR-50-SL-048 < 0.091 5.40
Average 0.056 12.6
Std. Dev. 0.029 6.19
Median 0.052 11.3
Minimum 0.018 5.40
Maximum < 0.091 29.4
< – indicates a value less than the reported
number which is the MDC.
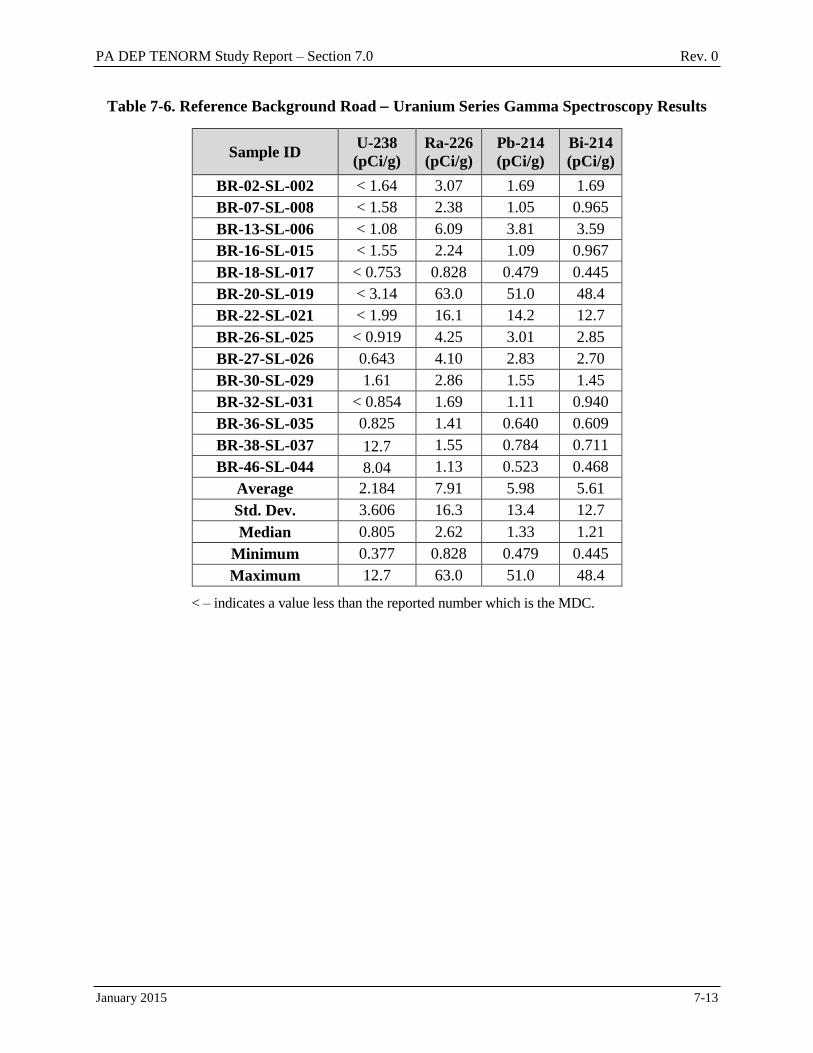
PA DEP TENORM Study Report – Section 7.0 Rev. 0
January 2015 7-13
Table 7-6. Reference Background Road Uranium Series Gamma Spectroscopy Results
Sample ID U-238
(pCi/g)
Ra-226
(pCi/g)
Pb-214
(pCi/g)
Bi-214
(pCi/g)
BR-02-SL-002 < 1.64 3.07 1.69 1.69
BR-07-SL-008 < 1.58 2.38 1.05 0.965
BR-13-SL-006 < 1.08 6.09 3.81 3.59
BR-16-SL-015 < 1.55 2.24 1.09 0.967
BR-18-SL-017 < 0.753 0.828 0.479 0.445
BR-20-SL-019 < 3.14 63.0 51.0 48.4
BR-22-SL-021 < 1.99 16.1 14.2 12.7
BR-26-SL-025 < 0.919 4.25 3.01 2.85
BR-27-SL-026 0.643 4.10 2.83 2.70
BR-30-SL-029 1.61 2.86 1.55 1.45
BR-32-SL-031 < 0.854 1.69 1.11 0.940
BR-36-SL-035 0.825 1.41 0.640 0.609
BR-38-SL-037 12.7 1.55 0.784 0.711
BR-46-SL-044 8.04 1.13 0.523 0.468
Average 2.184 7.91 5.98 5.61
Std. Dev. 3.606 16.3 13.4 12.7
Median 0.805 2.62 1.33 1.21
Minimum 0.377 0.828 0.479 0.445
Maximum 12.7 63.0 51.0 48.4
< – indicates a value less than the reported number which is the MDC.
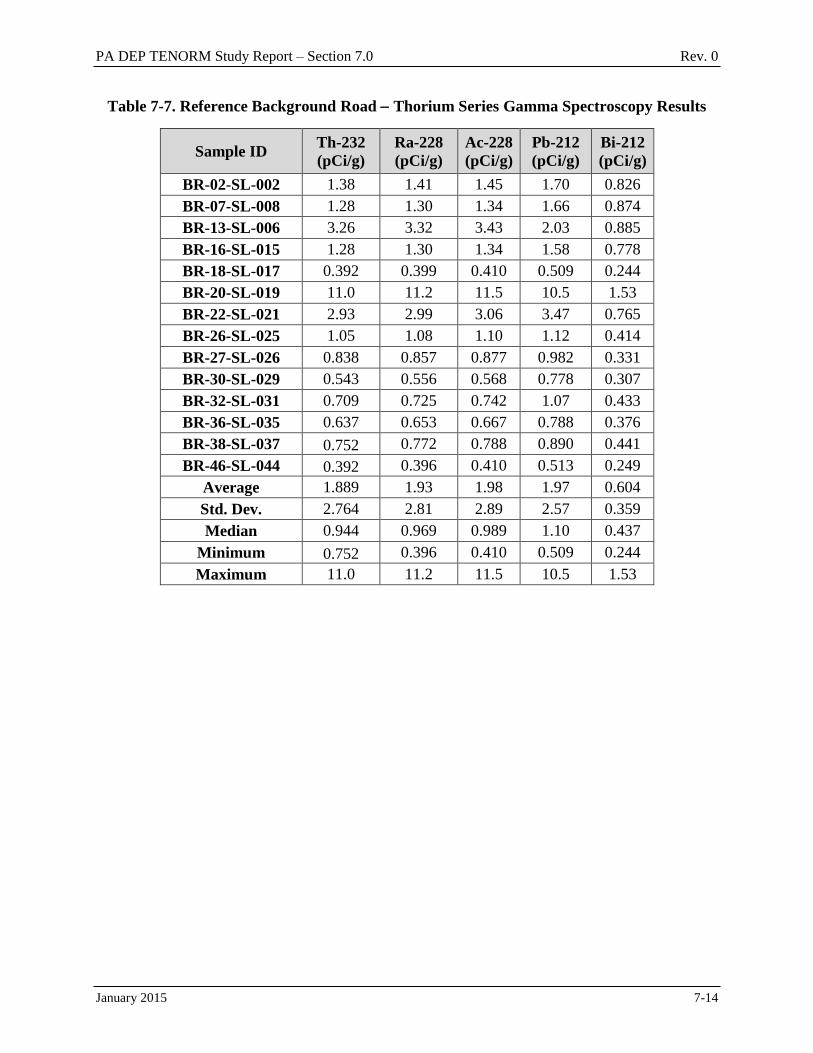
PA DEP TENORM Study Report – Section 7.0 Rev. 0
January 2015 7-14
Table 7-7. Reference Background Road Thorium Series Gamma Spectroscopy Results
Sample ID Th-232
(pCi/g)
Ra-228
(pCi/g)
Ac-228
(pCi/g)
Pb-212
(pCi/g)
Bi-212
(pCi/g)
BR-02-SL-002 1.38 1.41 1.45 1.70 0.826
BR-07-SL-008 1.28 1.30 1.34 1.66 0.874
BR-13-SL-006 3.26 3.32 3.43 2.03 0.885
BR-16-SL-015 1.28 1.30 1.34 1.58 0.778
BR-18-SL-017 0.392 0.399 0.410 0.509 0.244
BR-20-SL-019 11.0 11.2 11.5 10.5 1.53
BR-22-SL-021 2.93 2.99 3.06 3.47 0.765
BR-26-SL-025 1.05 1.08 1.10 1.12 0.414
BR-27-SL-026 0.838 0.857 0.877 0.982 0.331
BR-30-SL-029 0.543 0.556 0.568 0.778 0.307
BR-32-SL-031 0.709 0.725 0.742 1.07 0.433
BR-36-SL-035 0.637 0.653 0.667 0.788 0.376
BR-38-SL-037 0.752 0.772 0.788 0.890 0.441
BR-46-SL-044 0.392 0.396 0.410 0.513 0.249
Average 1.889 1.93 1.98 1.97 0.604
Std. Dev. 2.764 2.81 2.89 2.57 0.359
Median 0.944 0.969 0.989 1.10 0.437
Minimum 0.752 0.396 0.410 0.509 0.244
Maximum 11.0 11.2 11.5 10.5 1.53
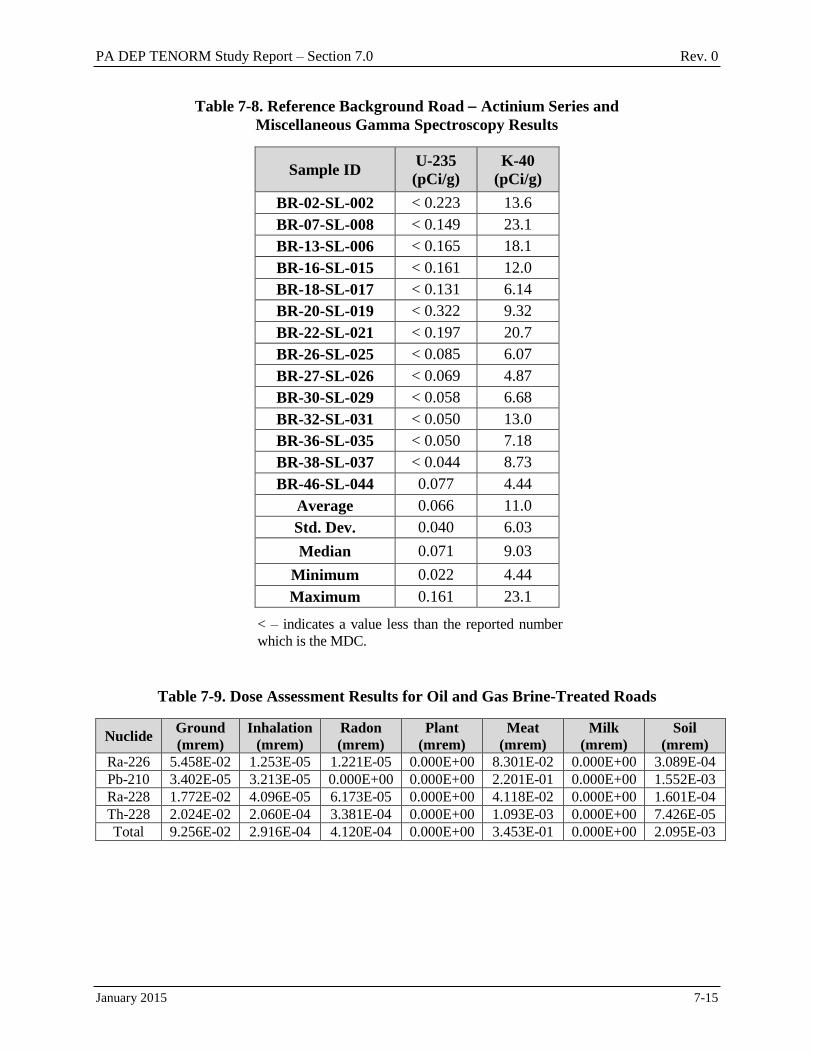
PA DEP TENORM Study Report – Section 7.0 Rev. 0
January 2015 7-15
Table 7-8. Reference Background Road Actinium Series and
Miscellaneous Gamma Spectroscopy Results
Sample ID U-235
(pCi/g)
K-40
(pCi/g)
BR-02-SL-002 < 0.223 13.6
BR-07-SL-008 < 0.149 23.1
BR-13-SL-006 < 0.165 18.1
BR-16-SL-015 < 0.161 12.0
BR-18-SL-017 < 0.131 6.14
BR-20-SL-019 < 0.322 9.32
BR-22-SL-021 < 0.197 20.7
BR-26-SL-025 < 0.085 6.07
BR-27-SL-026 < 0.069 4.87
BR-30-SL-029 < 0.058 6.68
BR-32-SL-031 < 0.050 13.0
BR-36-SL-035 < 0.050 7.18
BR-38-SL-037 < 0.044 8.73
BR-46-SL-044 0.077 4.44
Average 0.066 11.0
Std. Dev. 0.040 6.03
Median 0.071 9.03
Minimum 0.022 4.44
Maximum 0.161 23.1
< – indicates a value less than the reported number
which is the MDC.
Table 7-9. Dose Assessment Results for Oil and Gas Brine-Treated Roads
Nuclide Ground
(mrem)
Inhalation
(mrem)
Radon
(mrem)
Plant
(mrem)
Meat
(mrem)
Milk
(mrem)
Soil
(mrem)
Ra-226 5.458E-02 1.253E-05 1.221E-05 0.000E+00 8.301E-02 0.000E+00 3.089E-04
Pb-210 3.402E-05 3.213E-05 0.000E+00 0.000E+00 2.201E-01 0.000E+00 1.552E-03
Ra-228 1.772E-02 4.096E-05 6.173E-05 0.000E+00 4.118E-02 0.000E+00 1.601E-04
Th-228 2.024E-02 2.060E-04 3.381E-04 0.000E+00 1.093E-03 0.000E+00 7.426E-05
Total 9.256E-02 2.916E-04 4.120E-04 0.000E+00 3.453E-01 0.000E+00 2.095E-03
PA DEP TENORM Study Report – Section 8.0 Rev. 0
January 2015 8-1
8.0 QUALITY ASSURANCE AND QUALITY CONTROL
The quality assurance (QA) and QC objectives and criteria for this study were established in the
study-specific Quality Assurance Project Plan (QAPP) which, along with the FSP, is available on
the DEP website.
The purpose of the QAPP is to provide procedures and metrics for evaluating and ensuring that
all data are technically sound and legally defensible. This is accomplished by establishing
sample collection and preservation procedures, data collection procedures, analytical
requirements and data evaluation processes, which result in accurate, precise, representative and
complete data.
All sampling and analyses performed for this study were conducted in accordance with the
QAPP standards.
8.1 Data Quality Levels (DQLs)
The requirements for this study were based on DQL I for field screening methods and DQL III
for Non-Contract Laboratory Program (non-CLP) laboratory methods.
8.2 Quality Control Parameters
The established QC parameters for evaluating data in this study were precision [duplicates,
matrix spikes (MS), matrix spike duplicates (MSD)], accuracy (spiked samples, laboratory
control samples), and completeness (percentage of valid data).
Precision and accuracy obtained during this study met QC parameters unless otherwise noted.
Completeness is determined by calculating the percentage of valid data. Approximately eight
percent of the gross / analyses were invalidated due to excessive concentrations of total
dissolved solids (TDS). The TDS remaining after the water was evaporated were in excess of
the allowable mass. Attempts to dilute the samples to allow valid analyses to be performed were
unsuccessful.
8.3 Field Screening
Field surveys were performed by Perma-Fix personnel trained in the use of the survey
instrumentation required. DQL I criteria were used to collect the following types of data:
Gamma radiation exposure rate measurements
Gross gamma radiation measurements
Total and surface radioactivity
Removable and surface radioactivity
Background gamma radiation exposure rate and gross gamma radioactivity measurements
(outside the influence of sampling areas)
Liquid and solid samples for off-site analysis
PA DEP TENORM Study Report – Section 8.0 Rev. 0
January 2015 8-2
8.4 Sample Identification
Field samples were assigned a unique number to identify information such as the sampling
technician, the sequential number corresponding to the sample type, and the order in which it
was collected in accordance with the FSP.
8.5 Sample Custody
A field chain-of-custody form or sample submission form was used to record the custody of all
samples collected. This chain-of-custody form documented the transfer of the custody from the
sampling personnel to another person, to the laboratory, or another party, such as a courier
delivery service.
Field samples were packaged and shipped to the laboratory on the day of collection in
accordance with chain-of-custody protocols. All samples were transported to the laboratory by
the quick courier service or hand delivered to the laboratory. The original chain-of-custody form
was sent with the samples. The remaining copy was stored in the field team files.
Further details pertaining to chain-of-custody may be found in the FSP.
8.6 Analytical Procedures
Analytical methods and procedures were established before the study began based on
preliminary assumptions and are listed in Table 8-1. Additional analytical methods were
subsequently added and/or modified when preliminary assumptions were found to be different
due to the amount of TDS in the samples. Additional analytical method selection was based on
the following:
Original specified methodologies for radiochemistry failed due to elevated dissolved solids
and Barium (Ba) concentrations.
Alternate EPA methods, which were used as necessary.
All procedures for environmental sample handling, storage, and documentation while in the
laboratory’s custody and deliverable requirements upon delivery of the data to the user are
documented in the laboratory’s quality assurance manual (QAM). 8.7 Instrument Calibrations
All field and laboratory equipment were calibrated to NIST traceable standards before use to
ensure proper operating accuracy. Laboratory instrument calibration procedures are presented in
the laboratory QAMs. Field calibrations were performed in accordance with specified
procedures. Prior to the use of field equipment, daily operational QC checks were completed.
All daily QC instrumentation checks are presented in Appendix B.
8.8 Data Evaluation and Validation
The following subsections describe the field and laboratory data validation processes used for the
study.
PA DEP TENORM Study Report – Section 8.0 Rev. 0
January 2015 8-3
8.8.1 Validation of Field Data
During the field operations, field measurements were validated at the time of collection by the
field sampler through the use of standard operating procedures (SOPs) and field QC checks.
Field-obtained data, as well as ongoing QA/QC checks of environmental samples collected, were
validated by trained Perma-Fix and DEP field technicians. All field data were reviewed at the
time of sample collection.
8.8.2 Validation of Laboratory Data
Prior to reporting laboratory data, the analyst validated the sample results based on the QC
criteria specified in the analytical methods. The data validation process included verification of
the following steps:
Ensure the standard regression coefficient is within the acceptable range.
Ensure standard reference materials were analyzed at the proper frequencies and acceptable
results were obtained.
Ensure the reagent blanks were analyzed at the proper frequency.
Ensure precision requirements of the plan were met.
Ensure accuracy requirements of the plan were met.
Ensure completeness requirements of the plan were met.
Ensure samples were analyzed within the proper sample holding times.
Verify all calculations were correct.
Ensure proper units were reported.
Ensure the proper methodologies were used.
In addition to the review of analytical results and project-specific precision, accuracy, and
completeness requirements, the laboratory department manager or senior chemist performed
internal audits of report forms and other data sheets as well as regular reviews of instrument logs,
performance test results, and analysts’ performance. Where review of analytical results or
internal QA/QC checks indicated discrepancies, immediate corrective actions were taken and all
data results collected since the previous approved QC audits were reviewed for validity. Specific
laboratory procedures for validation of the analytical data generated are described in the
laboratory QAMs.
8.9 Data Reporting Analytical Laboratory
After the data were validated internally by the laboratory, the results were entered into the
laboratory’s data management system. The laboratory data management system contains the
final data results. When data entries were completed, the laboratory director (or his/her
designee) issued a final data report. The director then issued the final data report to the data user.
The data reports prepared for this project contain all pertinent information for the data user in
determining the applicability and validity of the data. A specified and uniform data reporting
format was implemented to facilitate this effort. For this project, DQL III data packages were
reported as a DQL IV (CLP-like) deliverable to facilitate data validation and are presented in
PA DEP TENORM Study Report – Section 8.0 Rev. 0
January 2015 8-4
Appendix K. The following criteria and information were supplied, as a minimum, for data
reports generated for this project:
A descriptive case narrative describing the internal data validation.
Completed and legible chains-of-custody for all analyses contained within each submitted
data package.
A laboratory sample record documenting which analyses were performed for the samples
contained in the data package is presented in Table 8-1.
All of the laboratory sample identifications and the correlating field sample identifications.
All applicable analytical results, counting errors, and MDCs reported in the correct number
of significant figures and reporting units.
Included in the individual sample reporting results are the complete sample identifications,
the sample dilutions (if necessary), and the individual sample analysis dates.
8.9.1 DQL III Reporting
The following summary forms and raw data deliverable requirements apply for DQL III.
The following forms are required for all analyses using gamma spectroscopy; isotopic U and Th;
and gross , gross and Ra methods, and were provided by the DEP Laboratory in various
forms:
Narrative and sample identification cross reference
Copies of chain-of-custody documentation
Laboratory chronicle
Method summaries and references
MS/MSD summary or any laboratory duplicate
Method blank summary and results
Instrument performance check summary
Initial calibration summary for all constituents of interest
8.10 Quality Control Procedures
QC procedures and checks ensure the accuracy of the data.
For any laboratory QC result that was outside of the acceptance criteria, the samples were
reanalyzed and/or the results were qualified in the final report.
8.10.1 Field QC Checks
Duplicate samples were collected and analyzed to assess the quality of field sampling techniques.
These samples were treated as separate and discrete samples and analyzed by the selected offsite
laboratory. The results are provided in Section 8.16.
PA DEP TENORM Study Report – Section 8.0 Rev. 0
January 2015 8-5
8.10.2 Internal Laboratory QC Checks
The laboratory followed the internal QC checks specified in the QAPP for each analysis type
employed. In addition, these QC checks have met the requirements specified in the respective
EPA analytical methods.
8.10.2.1 Initial and Continuing Calibration
Each instrument and measurement system was calibrated prior to use to verify the instrument
met performance criteria throughout the course of the analytical cycle. Continuing calibration
checks were performed at a minimum frequency in accordance with the DEP Laboratory QAM.
For instruments used for radiological analysis, performance checks are conducted each day
samples are analyzed. For instruments used for non-radiological analysis, performance checks
are conducted for each batch of 20 samples or less.
8.10.2.2 Reagent Blanks
A reagent blank was analyzed with each set of samples received for analysis. No responses
above the reportable detection limit were observed in any of the blanks, indicating no possible
laboratory contamination. The exact frequency and method of use is presented in the laboratory
QAM.
8.10.2.3 Matrix Spike and Duplicate (Matrix Spike Duplicate) Analysis
One in 20 samples were analyzed as MSs and MSDs or one per day, whichever was greater.
MS/MSD QC is not required for gamma spectroscopy analysis because no sample preparation is
involved. The MS/MSD QC measures the effects of the sample matrix on method performance.
The percent recovery for spiked samples was calculated using the equations documented in
Section 11.0 of the QAPP and compared to the accuracy criteria specified in the QAM for the
associated analytical method. The relative percent difference (RPD) of replicate spikes or
replicate analytical results was calculated using the equations documented in Section 11.0 of the
QAPP and compared to the precision criteria for the associated analytical method.
8.10.2.4 Calibration Standards
Calibration standards were analyzed as required in the reference methods throughout the course
of the analysis. The exact frequencies and methods of use are presented in the laboratory QAM.
8.11 Laboratory Performance Audits
Laboratory performance audits are conducted by the DEP Laboratory QA officer three times per
year. Each laboratory analyst is provided a performance evaluation or proficiency test sample
containing analytes for the parameters which he/she usually performs. These proficiency test
sample results are used to identify issues in sample preparation, analysis techniques, or
methodologies. Any issues are identified, investigated, documented on the proper form, resolved
with a corrective action plan to eliminate the issues and prevent reoccurrence, and then shared
with the accreditation bodies.
PA DEP TENORM Study Report – Section 8.0 Rev. 0
January 2015 8-6
The DEP Laboratory internal audits include verification of each analyst’s record keeping, proper
use and understanding of procedures, and performance documentation. Deficiencies/findings are
discussed with the analyst, documented, and resolved through the implementation of a corrective
action.
8.12 Laboratory System Audits
Laboratory system audits are conducted by an external third-party assessor once every two years.
These audits are used to ensure that all aspects of the DEP Laboratory’s QAM are operative and
within compliance. This involves a thorough review of all laboratory methods performed and
documentation to confirm that all analytical procedures are performed according to the DEP
Laboratory’s QAM. An external third-party assessment was not conducted during the time
period that samples from the TENORM study were received, processed, analyzed, and reported.
8.13 Assessment Procedures for Data Acceptability
The following subsections describe the data validation procedures that were used to evaluate the
precision, accuracy, and completeness of the data generated.
8.13.1 Precision
Precision is the evaluation of agreement among individual measurements of the same property
under prescribed similar conditions. Precision is assessed by calculating the RPD of replicate
spike samples or replicate sample analyses according to the following equation:
Relative Percent Difference: 𝑅𝑃𝐷 = 𝑅1−𝑅2
(𝑅1+𝑅2) 2⁄× 100
Where: R1 = result 1
R2 = result 2
8.13.2 Accuracy
Accuracy is the evaluation of closeness of an individual measurement to the true value.
Accuracy is measured by calculating the percent recovery (%R) of known levels of spike
compounds as follows:
Percent Recovery:
%𝑅 =[𝑠𝑝𝑖𝑘𝑒 𝑠𝑎𝑚𝑝𝑙𝑒] − [𝑢𝑛𝑠𝑝𝑖𝑘𝑒𝑑 𝑠𝑎𝑚𝑝𝑙𝑒]
[𝑠𝑝𝑖𝑘𝑒 𝑎𝑑𝑑𝑒𝑑]× 100
8.13.3 Completeness
Completeness is the quantification of the amount of valid data obtained from a measurement
system, expressed as a percentage of the number of valid measurements that could have been
accomplished. More than one completeness check can be evaluated. It is calculated as follows:
PA DEP TENORM Study Report – Section 8.0 Rev. 0
January 2015 8-7
𝐶𝑜𝑚𝑝𝑙𝑒𝑡𝑒𝑛𝑒𝑠𝑠 (%) =𝑛𝑢𝑚𝑏𝑒𝑟 𝑜𝑓 𝑣𝑎𝑙𝑖𝑑 𝑠𝑎𝑚𝑝𝑙𝑒𝑠 𝑟𝑒𝑝𝑜𝑟𝑡𝑒𝑑
𝑡𝑜𝑡𝑎𝑙 𝑛𝑢𝑚𝑏𝑒𝑟 𝑜𝑓 𝑠𝑎𝑚𝑝𝑙𝑒𝑠 𝑎𝑛𝑎𝑙𝑦𝑧𝑒𝑑× 100
8.13.4 Quality Control Charts
Valid QC charts can be prepared after the initial 20 analytical determinations to graphically
evaluate precision and accuracy criteria. The charts are prepared by calculating the mean value
of the determinations and setting control limits at + 3 standard deviations from that mean. The
following equations are used:
Mean:
�̅� =1
𝑁∑ 𝑥𝑖
𝑁
𝑖=1
Where: N = number of samples
Xi = sample value
Standard Deviation:
𝜎 = √∑ (𝑥𝑖 − �̅�)2𝑁
𝑖=1
𝑁 − 1
The control limits must be within acceptance limits or ranges presented in the DEP Laboratory’s
SOPs. If the values are found to be outside these limits or ranges, the measurement system is
examined to determine if possible problems exist. Most of the values were found inside the
limits; however, those values which exceeded the control limits were reported with an
appropriate data qualifier.
8.14 Preventative Maintenance
Performance of preventative maintenance was completed on equipment to ensure operability.
Instrument manuals are kept on file and used for reference whenever equipment required repair
or maintenance.
8.14.1 Field Equipment
Field sampling personnel were responsible for preventative maintenance of all field instruments.
The field sampling personnel ensured field instrumentation was protected from extreme weather
conditions as well as physical hazards.
8.14.2 Laboratory Instruments
Preventative maintenance schedules and/or procedures for laboratory equipment are presented in
the DEP Laboratory QAM. No major preventative maintenance was performed on the DEP
Laboratory equipment during the time period that samples from the TENORM study were
received, processed, analyzed and reported.

PA DEP TENORM Study Report – Section 8.0 Rev. 0
January 2015 8-8
8.15 QA Reports to Management
Audit reports have been provided by the DEP Laboratory director (or his/her designee) as a
means of tracking program performance. An annual method internal audit was performed
covering the period of January 1, 2013, to present. In addition, the state of New Jersey
Department of Environmental Protection (NJDEP) performed an audit of the DEP Laboratory
management system, QA program, and analytical testing procedures performed by the DEP
Laboratory. The NJDEP submitted a February 11, 2013, report to the DEP Laboratory that
concluded no findings for the Radiation Measurement Section.
Field QA reports were not necessary due to the size and length of individual sample collection
activities. Any problems noted during sampling were immediately communicated to the project
certified health physicist.
8.16 Third-Party Quality Control
QC samples were collected as follows:
Solid Samples – five percent (field replicate/split) QC samples, i.e., one every 20 samples
collected to verify results of onsite laboratory per total samples in a calendar year.
Aqueous Samples – five percent (field replicate/split) QC samples, i.e., one every 20 samples
collected to verify results of onsite laboratory per total samples in a calendar year.
The samples were sent offsite to an independent, third-party, accredited laboratory for gamma
spectroscopy analysis and compared to the DEP Laboratory gamma spectroscopy analysis of the
split sample using NRC Inspection Manual Procedure 84750:
Divide each offsite laboratory result by its associated uncertainty to obtain the resolution.
For purposes of this procedure, the uncertainty is defined as the relative standard deviation,
one sigma, of the offsite laboratory results as calculated from counting statistics, i.e., the 95
percent confidence level reported error divided by 1.96.
Divide each DEP Laboratory result by the corresponding offsite laboratory result to obtain
the ratio (DEP Laboratory/offsite laboratory).
The DEP Laboratory’s measurement is in agreement if the value of the ratio falls within the
limits shown in the following table for the corresponding resolution:
Criteria for Accepting the DEP Laboratory’s Measurements
Resolution Ratio
<4 Statistics are too poor for comparison
4-7 0.5-2.0
8-15 0.6-1.66
16-50 0.75-1.33
Resolution Ratio
51-200 0.80-1.25
>200 0.85-1.18
PA DEP TENORM Study Report – Section 8.0 Rev. 0
January 2015 8-9
The results of the comparison for solid samples are presented in Tables 8-2 through 8-5 for four
of the radionuclides identified using gamma spectroscopy. If either the DEP Laboratory or the
third-party laboratory (GEL) result was < MDC value reported, the comparison was not made.
There were 28 comparisons of split solid samples made; 14 passed and 14 failed. The pass/fail
rate of 50 percent is likely due to the difficulty with splitting solid samples in regards to the total
radioactivity concentration. The performance has been determined to be acceptable based on the
following criteria: split sampling of solid samples, especially at low-activity concentrations,
rarely results in equal activity for both resulting samples. Radioactive particulate contamination
within solids is usually not homogenous, making split sampling improbable to split activity
evenly between the two aliquots.
Mixing or blending of the solid sample prior to splitting into equal aliquots does not ensure
the radioactivity is evenly divided.
Duplicate analysis of the same solid sample is more appropriate as a third-party QC
comparison, eliminating the large variability of split samples, but was not possible for this
study.
Liquid samples are much easier to mix prior to splitting and are a more appropriate measure
of the agreement between the two laboratories.
The results of the comparison for liquid samples are presented in Tables 8-6 through 8-9 for four
of the radionuclides identified using gamma spectroscopy. If either the DEP Laboratory or the
independent laboratory (GEL) result was < MDC value reported, the comparison was not made.
Of the 33 comparisons made on split liquid sample gamma spectroscopy analysis results, 28 met
acceptance criteria. The agreement between the DEP Laboratory and the independent laboratory
(GEL) gamma spectroscopy results is acceptable.
The following actions and/or conclusions were made based on the split solid sample analytical
results:
1. Split sampling of radioactive solid samples does not result in equal radioactivity in the two
resulting samples. Solid samples were mixed in the field prior to filling two sample
containers (splitting the sample). Low-activity solid sample media does not readily split into
equal radioactivity concentration.
2. All of the split solid samples failing the comparison acceptance criteria were reviewed by
asking the question: “Would the result of one of the two splits result in a different
conclusion?” For example, would the result of one split pass a compliance test that may be
applicable to the media and the result of the other split fail? Only one sample, with results of
363 versus 6.02 pCi/g, would result in a different action based on the result.
3. Duplicate analysis of the same sample (no splitting) is a much better comparison of
laboratory performance and is recommended for any future sample and analysis study.

PA DEP TENORM Study Report – Section 8.0 Rev. 0
January 2015 8-10
Table 8-1. Summary of Analytical Procedures
Sample Type
Media/
Sample
Type
Analytical Parameters Analytical
(a)
Methods Frequency
(b)
Cuttings as produced on a
drilling rig including cuttings
stored temporarily on site in
lined pits or containers
Solid phase from flowback and
produced water
Solids accumulated in vessels
or on equipment
Scale from drilling rigs and
associated equipment
Soil/salt samples from
beneficial reuse areas
(Off-site Lab)
Soil/soil-
like
Gamma spectroscopy to
identify TENORM
radionuclides
Alpha spectroscopy to
identify isotopic U
(233/234, 235, and 238)
and isotopic Th (228,
230, and 232)
USEPA 901.1
Health and Safety
Laboratory
(HASL) 300
Once per site
WWTP sludge
WWTP discharge sediments
(Off-site Lab)
Soil/soil-
like
Gamma spectroscopy to
identify TENORM
radionuclides
Alpha spectroscopy to
identify isotopic U
(U-233/234, 235, and
238) and isotopic Th
(Th-228, 230, and 232)
USEPA 901.1
HASL 300
Three times per
facility
Flowback and produced waters
Accumulated liquids from
production equipment
(Off-site Lab)
Aqueous
(Grab) Gross and
Gamma spectroscopy to
identify TENORM
radionuclides
USEPA 900.0
USEPA 901.1
Once per site
Influent Marcellus Shale
industry water (as is and
filtered)
WWTP effluent discharge
water (as is and filtered)
(Off-site Lab)
Aqueous
(Grab) Gross and
Gamma spectroscopy to
identify TENORM
radionuclides
USEPA 900.0
USEPA 901.1
Quarterly x3
Landfill Leachate Aqueous
(Grab) Gross and
Gamma spectroscopy
analysis
Radium (Ra-226 and
Ra-228)
USEPA 900.0
USEPA 901.1
EPA 903.1 and
EPA 904.0
equivalent
Once per landfill

PA DEP TENORM Study Report – Section 8.0 Rev. 0
January 2015 8-11
Table 8-1. Summary of Analytical Procedures
Sample Type
Media/
Sample
Type
Analytical Parameters Analytical
(a)
Methods Frequency
(b)
Gas sampling as necessary
(Off-site Lab)
Ambient Radon
Gaseous
(Grab)
Charcoal
canister
Radon
Radon
As determined by
DEP
(a) Analytical methods are as follows:
Up to 10 percent of the samples, based on the gross and and gamma spectroscopy results, are also
analyzed by spectroscopy for U (U-238, U-235, and U-234), Th-232, Ra (Ra-226 and Ra-228), and for
any unsupported decay chain radionuclides.
Analytical method as specified or an equivalent method where appropriate.
(b) QC samples were collected as follows:
Solid Samples – five percent (field replicate/split) QC samples, i.e., one every 20 samples collected to
verify results of onsite laboratory per total samples in a calendar year.
Aqueous Samples – five percent (field replicate/split) QC samples, i.e., one every 20 samples collected to
verify results of on-site laboratory per total samples in a calendar year.
Table 8-2. Bi-214 Split Solid Sample Comparison Results
Sample ID Bi-214 Result
(pCi/g)
Bi-214 Err
(pCi/g)
Bi-214 MDC
(pCi/g)
Bi-214
Resolution /
Ratio
Bi-214
Criteria /
Pass-Fail
5942116 0.001 0.000 0.016 7 5942116GEL 0.556 0.158 0.12 0.002
5942130 26.5 4.160 0.217 5 0.5-2.0
5942130GEL 12.1 4.77 0.857 2.190 Fail
5942134 0.638 0.106 0.057 5 0.5-2.0
5942134GEL 4.19 1.58 0.461 0.152 Fail
5942145 0.000 0.269 1.050 12 0.6-1.66
5942145GEL 1.14 0.185 0.109 0.000 Fail
5942155 3.77 0.317 0.056 21 0.75-1.33
5942155GEL 2.63 0.25 0.0787 1.433 Fail
5942180 0.780 0.073 0.048 14 0.6-1.66
5942180GEL 0.969 0.133 0.0741 0.805 Pass
5942189 370 25.300 1.108 377 0.85-1.18
5942189GEL 589 3.06 0.973 0.628 Fail
5942188 24.0 1.970 0.156 58 0.80-1.25
5942188GEL 21.6 0.726 0.241 1.111 Pass
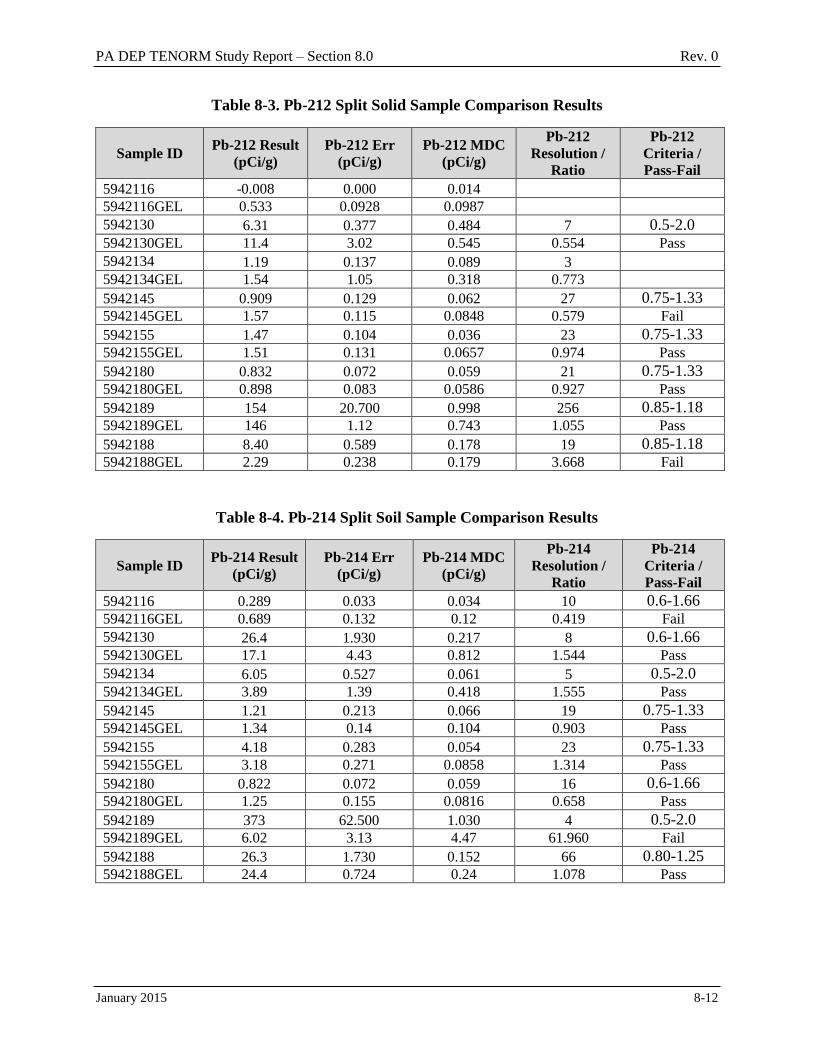
PA DEP TENORM Study Report – Section 8.0 Rev. 0
January 2015 8-12
Table 8-3. Pb-212 Split Solid Sample Comparison Results
Sample ID Pb-212 Result
(pCi/g)
Pb-212 Err
(pCi/g)
Pb-212 MDC
(pCi/g)
Pb-212
Resolution /
Ratio
Pb-212
Criteria /
Pass-Fail
5942116 -0.008 0.000 0.014 5942116GEL 0.533 0.0928 0.0987
5942130 6.31 0.377 0.484 7 0.5-2.0 5942130GEL 11.4 3.02 0.545 0.554 Pass
5942134 1.19 0.137 0.089 3 5942134GEL 1.54 1.05 0.318 0.773
5942145 0.909 0.129 0.062 27 0.75-1.33 5942145GEL 1.57 0.115 0.0848 0.579 Fail
5942155 1.47 0.104 0.036 23 0.75-1.33 5942155GEL 1.51 0.131 0.0657 0.974 Pass
5942180 0.832 0.072 0.059 21 0.75-1.33 5942180GEL 0.898 0.083 0.0586 0.927 Pass
5942189 154 20.700 0.998 256 0.85-1.18 5942189GEL 146 1.12 0.743 1.055 Pass
5942188 8.40 0.589 0.178 19 0.85-1.18 5942188GEL 2.29 0.238 0.179 3.668 Fail
Table 8-4. Pb-214 Split Soil Sample Comparison Results
Sample ID Pb-214 Result
(pCi/g)
Pb-214 Err
(pCi/g)
Pb-214 MDC
(pCi/g)
Pb-214
Resolution /
Ratio
Pb-214
Criteria /
Pass-Fail
5942116 0.289 0.033 0.034 10 0.6-1.66 5942116GEL 0.689 0.132 0.12 0.419 Fail
5942130 26.4 1.930 0.217 8 0.6-1.66 5942130GEL 17.1 4.43 0.812 1.544 Pass
5942134 6.05 0.527 0.061 5 0.5-2.0 5942134GEL 3.89 1.39 0.418 1.555 Pass
5942145 1.21 0.213 0.066 19 0.75-1.33 5942145GEL 1.34 0.14 0.104 0.903 Pass
5942155 4.18 0.283 0.054 23 0.75-1.33 5942155GEL 3.18 0.271 0.0858 1.314 Pass
5942180 0.822 0.072 0.059 16 0.6-1.66 5942180GEL 1.25 0.155 0.0816 0.658 Pass
5942189 373 62.500 1.030 4 0.5-2.0 5942189GEL 6.02 3.13 4.47 61.960 Fail
5942188 26.3 1.730 0.152 66 0.80-1.25 5942188GEL 24.4 0.724 0.24 1.078 Pass
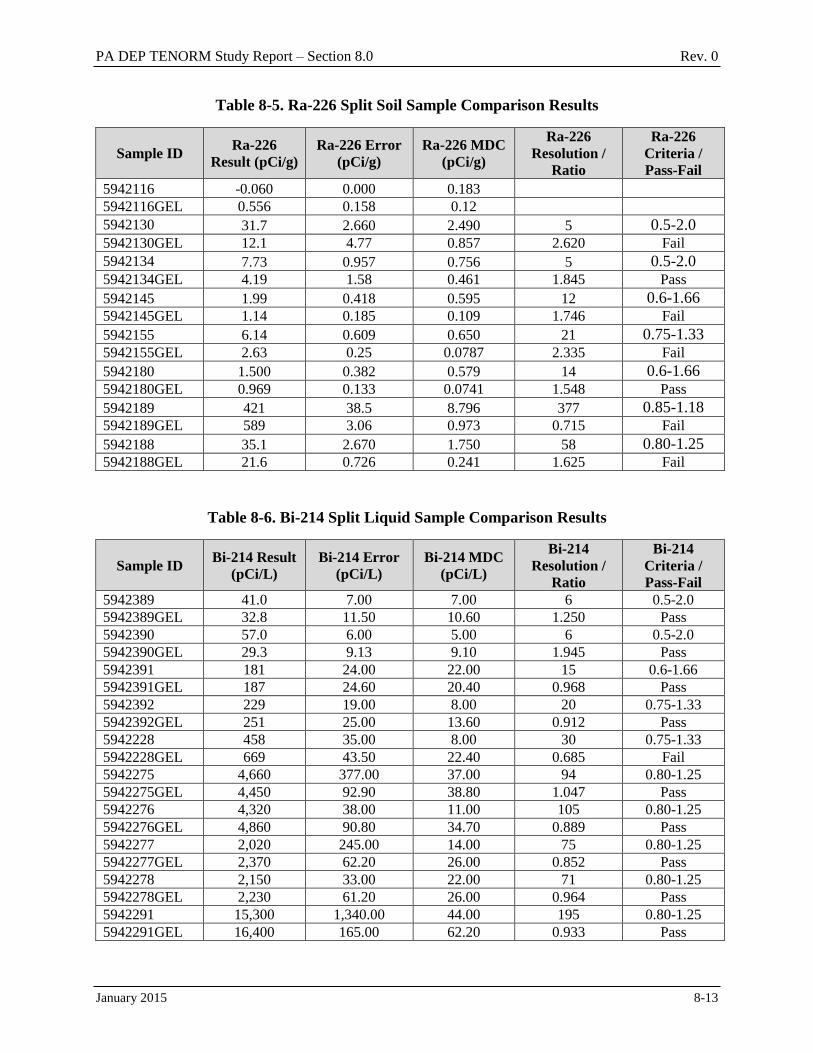
PA DEP TENORM Study Report – Section 8.0 Rev. 0
January 2015 8-13
Table 8-5. Ra-226 Split Soil Sample Comparison Results
Sample ID Ra-226
Result (pCi/g)
Ra-226 Error
(pCi/g)
Ra-226 MDC
(pCi/g)
Ra-226
Resolution /
Ratio
Ra-226
Criteria /
Pass-Fail
5942116 -0.060 0.000 0.183 5942116GEL 0.556 0.158 0.12
5942130 31.7 2.660 2.490 5 0.5-2.0 5942130GEL 12.1 4.77 0.857 2.620 Fail
5942134 7.73 0.957 0.756 5 0.5-2.0 5942134GEL 4.19 1.58 0.461 1.845 Pass
5942145 1.99 0.418 0.595 12 0.6-1.66 5942145GEL 1.14 0.185 0.109 1.746 Fail
5942155 6.14 0.609 0.650 21 0.75-1.33 5942155GEL 2.63 0.25 0.0787 2.335 Fail
5942180 1.500 0.382 0.579 14 0.6-1.66 5942180GEL 0.969 0.133 0.0741 1.548 Pass
5942189 421 38.5 8.796 377 0.85-1.18 5942189GEL 589 3.06 0.973 0.715 Fail
5942188 35.1 2.670 1.750 58 0.80-1.25 5942188GEL 21.6 0.726 0.241 1.625 Fail
Table 8-6. Bi-214 Split Liquid Sample Comparison Results
Sample ID Bi-214 Result
(pCi/L)
Bi-214 Error
(pCi/L)
Bi-214 MDC
(pCi/L)
Bi-214
Resolution /
Ratio
Bi-214
Criteria /
Pass-Fail
5942389 41.0 7.00 7.00 6 0.5-2.0
5942389GEL 32.8 11.50 10.60 1.250 Pass
5942390 57.0 6.00 5.00 6 0.5-2.0
5942390GEL 29.3 9.13 9.10 1.945 Pass
5942391 181 24.00 22.00 15 0.6-1.66
5942391GEL 187 24.60 20.40 0.968 Pass
5942392 229 19.00 8.00 20 0.75-1.33
5942392GEL 251 25.00 13.60 0.912 Pass
5942228 458 35.00 8.00 30 0.75-1.33
5942228GEL 669 43.50 22.40 0.685 Fail
5942275 4,660 377.00 37.00 94 0.80-1.25
5942275GEL 4,450 92.90 38.80 1.047 Pass
5942276 4,320 38.00 11.00 105 0.80-1.25
5942276GEL 4,860 90.80 34.70 0.889 Pass
5942277 2,020 245.00 14.00 75 0.80-1.25
5942277GEL 2,370 62.20 26.00 0.852 Pass
5942278 2,150 33.00 22.00 71 0.80-1.25
5942278GEL 2,230 61.20 26.00 0.964 Pass
5942291 15,300 1,340.00 44.00 195 0.80-1.25
5942291GEL 16,400 165.00 62.20 0.933 Pass
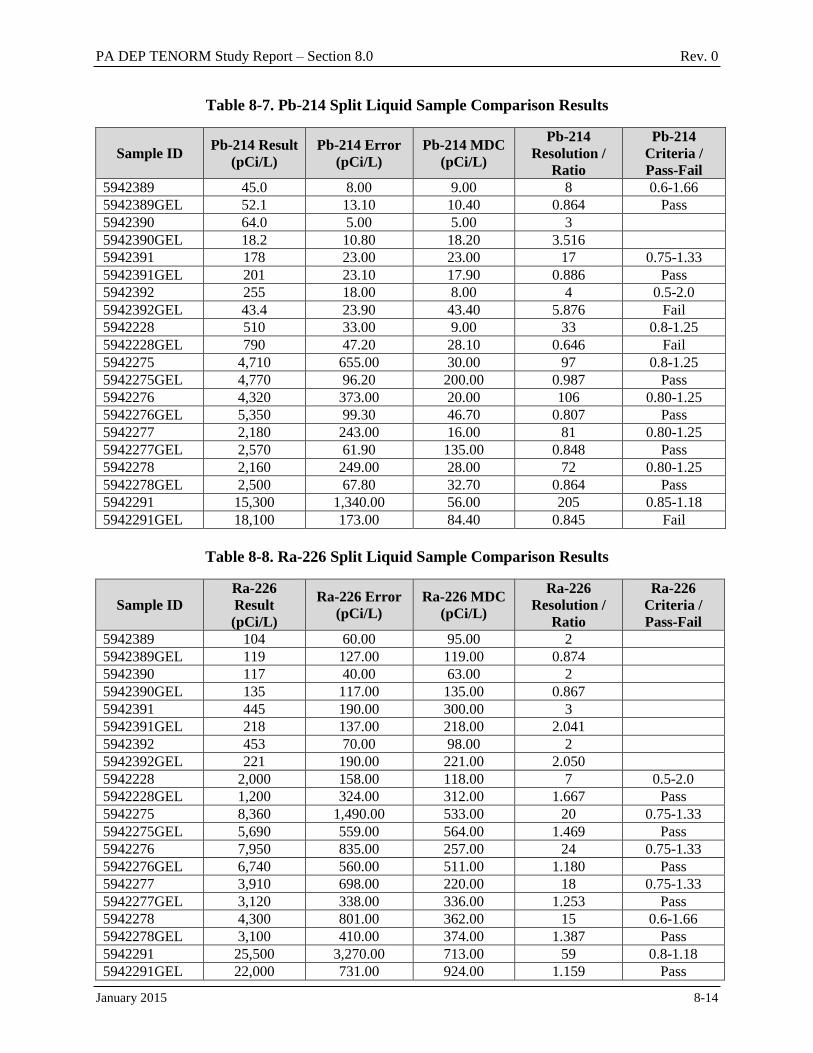
PA DEP TENORM Study Report – Section 8.0 Rev. 0
January 2015 8-14
Table 8-7. Pb-214 Split Liquid Sample Comparison Results
Sample ID Pb-214 Result
(pCi/L)
Pb-214 Error
(pCi/L)
Pb-214 MDC
(pCi/L)
Pb-214
Resolution /
Ratio
Pb-214
Criteria /
Pass-Fail
5942389 45.0 8.00 9.00 8 0.6-1.66
5942389GEL 52.1 13.10 10.40 0.864 Pass
5942390 64.0 5.00 5.00 3
5942390GEL 18.2 10.80 18.20 3.516
5942391 178 23.00 23.00 17 0.75-1.33
5942391GEL 201 23.10 17.90 0.886 Pass
5942392 255 18.00 8.00 4 0.5-2.0
5942392GEL 43.4 23.90 43.40 5.876 Fail
5942228 510 33.00 9.00 33 0.8-1.25
5942228GEL 790 47.20 28.10 0.646 Fail
5942275 4,710 655.00 30.00 97 0.8-1.25
5942275GEL 4,770 96.20 200.00 0.987 Pass
5942276 4,320 373.00 20.00 106 0.80-1.25
5942276GEL 5,350 99.30 46.70 0.807 Pass
5942277 2,180 243.00 16.00 81 0.80-1.25
5942277GEL 2,570 61.90 135.00 0.848 Pass
5942278 2,160 249.00 28.00 72 0.80-1.25
5942278GEL 2,500 67.80 32.70 0.864 Pass
5942291 15,300 1,340.00 56.00 205 0.85-1.18
5942291GEL 18,100 173.00 84.40 0.845 Fail
Table 8-8. Ra-226 Split Liquid Sample Comparison Results
Sample ID
Ra-226
Result
(pCi/L)
Ra-226 Error
(pCi/L)
Ra-226 MDC
(pCi/L)
Ra-226
Resolution /
Ratio
Ra-226
Criteria /
Pass-Fail
5942389 104 60.00 95.00 2
5942389GEL 119 127.00 119.00 0.874
5942390 117 40.00 63.00 2
5942390GEL 135 117.00 135.00 0.867
5942391 445 190.00 300.00 3
5942391GEL 218 137.00 218.00 2.041
5942392 453 70.00 98.00 2
5942392GEL 221 190.00 221.00 2.050
5942228 2,000 158.00 118.00 7 0.5-2.0
5942228GEL 1,200 324.00 312.00 1.667 Pass
5942275 8,360 1,490.00 533.00 20 0.75-1.33
5942275GEL 5,690 559.00 564.00 1.469 Pass
5942276 7,950 835.00 257.00 24 0.75-1.33
5942276GEL 6,740 560.00 511.00 1.180 Pass
5942277 3,910 698.00 220.00 18 0.75-1.33
5942277GEL 3,120 338.00 336.00 1.253 Pass
5942278 4,300 801.00 362.00 15 0.6-1.66
5942278GEL 3,100 410.00 374.00 1.387 Pass
5942291 25,500 3,270.00 713.00 59 0.8-1.18
5942291GEL 22,000 731.00 924.00 1.159 Pass
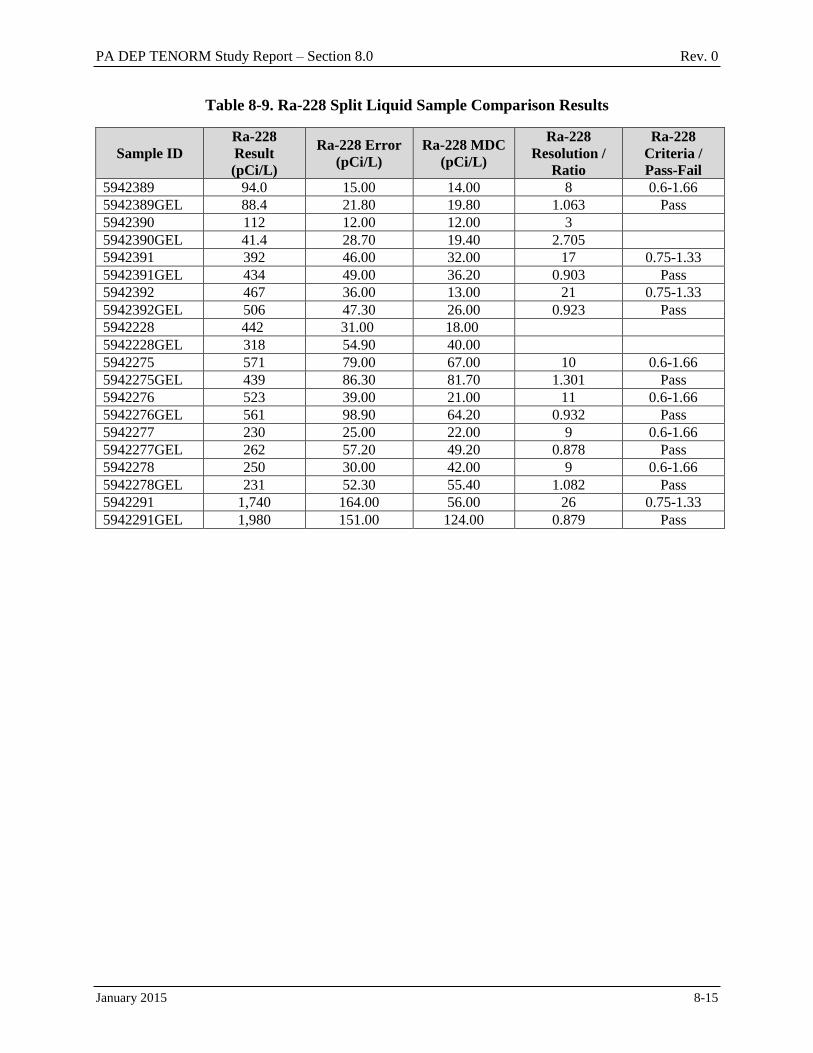
PA DEP TENORM Study Report – Section 8.0 Rev. 0
January 2015 8-15
Table 8-9. Ra-228 Split Liquid Sample Comparison Results
Sample ID
Ra-228
Result
(pCi/L)
Ra-228 Error
(pCi/L)
Ra-228 MDC
(pCi/L)
Ra-228
Resolution /
Ratio
Ra-228
Criteria /
Pass-Fail
5942389 94.0 15.00 14.00 8 0.6-1.66
5942389GEL 88.4 21.80 19.80 1.063 Pass
5942390 112 12.00 12.00 3
5942390GEL 41.4 28.70 19.40 2.705
5942391 392 46.00 32.00 17 0.75-1.33
5942391GEL 434 49.00 36.20 0.903 Pass
5942392 467 36.00 13.00 21 0.75-1.33
5942392GEL 506 47.30 26.00 0.923 Pass
5942228 442 31.00 18.00
5942228GEL 318 54.90 40.00
5942275 571 79.00 67.00 10 0.6-1.66
5942275GEL 439 86.30 81.70 1.301 Pass
5942276 523 39.00 21.00 11 0.6-1.66
5942276GEL 561 98.90 64.20 0.932 Pass
5942277 230 25.00 22.00 9 0.6-1.66
5942277GEL 262 57.20 49.20 0.878 Pass
5942278 250 30.00 42.00 9 0.6-1.66
5942278GEL 231 52.30 55.40 1.082 Pass
5942291 1,740 164.00 56.00 26 0.75-1.33
5942291GEL 1,980 151.00 124.00 0.879 Pass
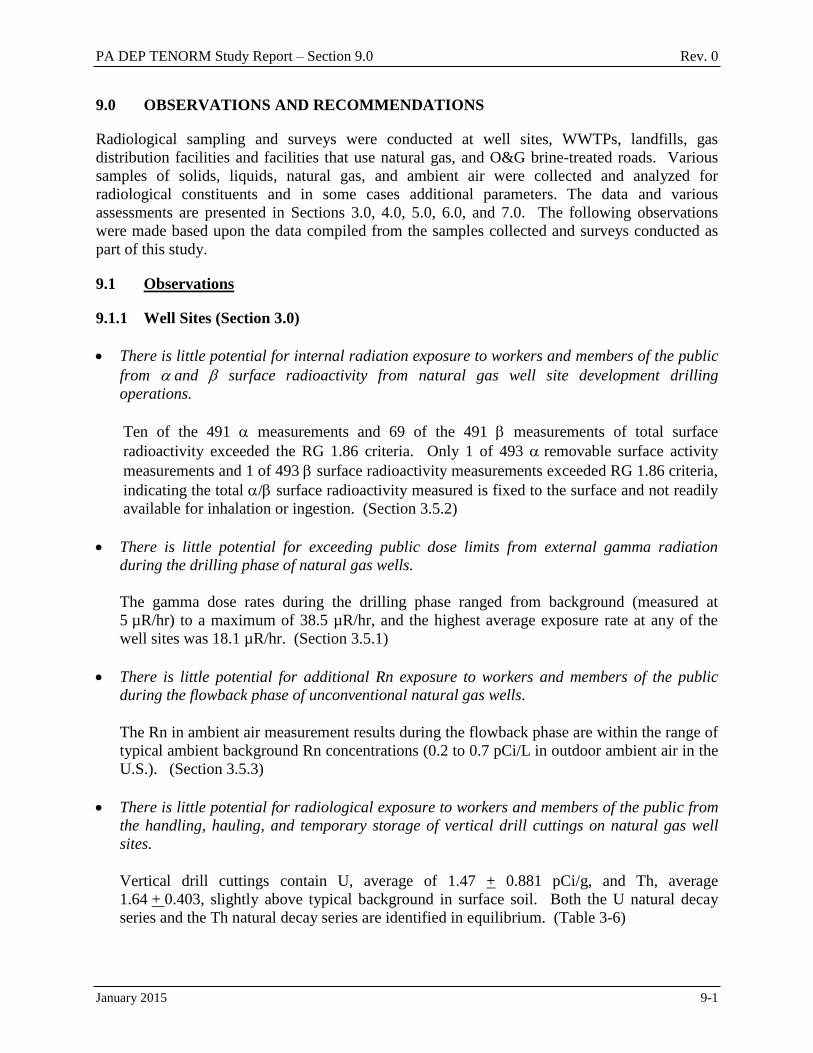
PA DEP TENORM Study Report – Section 9.0 Rev. 0
January 2015 9-1
9.0 OBSERVATIONS AND RECOMMENDATIONS
Radiological sampling and surveys were conducted at well sites, WWTPs, landfills, gas
distribution facilities and facilities that use natural gas, and O&G brine-treated roads. Various
samples of solids, liquids, natural gas, and ambient air were collected and analyzed for
radiological constituents and in some cases additional parameters. The data and various
assessments are presented in Sections 3.0, 4.0, 5.0, 6.0, and 7.0. The following observations
were made based upon the data compiled from the samples collected and surveys conducted as
part of this study.
9.1 Observations
9.1.1 Well Sites (Section 3.0)
There is little potential for internal radiation exposure to workers and members of the public
from and surface radioactivity from natural gas well site development drilling
operations.
Ten of the 491 measurements and 69 of the 491 measurements of total surface
radioactivity exceeded the RG 1.86 criteria. Only 1 of 493 removable surface activity
measurements and 1 of 493 surface radioactivity measurements exceeded RG 1.86 criteria,
indicating the total / surface radioactivity measured is fixed to the surface and not readily
available for inhalation or ingestion. (Section 3.5.2)
There is little potential for exceeding public dose limits from external gamma radiation
during the drilling phase of natural gas wells.
The gamma dose rates during the drilling phase ranged from background (measured at
5 µR/hr) to a maximum of 38.5 µR/hr, and the highest average exposure rate at any of the
well sites was 18.1 µR/hr. (Section 3.5.1)
There is little potential for additional Rn exposure to workers and members of the public
during the flowback phase of unconventional natural gas wells. The Rn in ambient air measurement results during the flowback phase are within the range of
typical ambient background Rn concentrations (0.2 to 0.7 pCi/L in outdoor ambient air in the
U.S.). (Section 3.5.3)
There is little potential for radiological exposure to workers and members of the public from
the handling, hauling, and temporary storage of vertical drill cuttings on natural gas well
sites. Vertical drill cuttings contain U, average of 1.47 + 0.881 pCi/g, and Th, average
1.64 + 0.403, slightly above typical background in surface soil. Both the U natural decay
series and the Th natural decay series are identified in equilibrium. (Table 3-6)
PA DEP TENORM Study Report – Section 9.0 Rev. 0
January 2015 9-2
There is little potential for radiological exposure to workers and members of the public from
handling, hauling, and temporary storage of horizontal drill cuttings on natural gas well
sites.
Horizontal drill cuttings contain U, average 8.40 + 6.70 pCi/g, and Th, average 1.42 + 0.331.
The Th is slightly above typical background in surface soil. The U activity is higher than
typical surface soil background U activity and statistically higher than vertical drill cuttings
U activity. Both the U natural decay series and the Th natural decay series are identified in
equilibrium. (Table 3-8)
There is little potential for radiological exposure to workers and members of the public from
hydraulic fracturing proppant sand. Nominal U and Th activity was identified in hydraulic fracturing proppant sand samples.
The U and Th activity was less than typical background for surface soil. (Section 3.2.4)
There is little potential for radiological exposure to workers and members of the public from
drilling mud. Nominal U and Th activity was identified in liquid and solid drilling mud samples. The U
and Th activity was less than typical background for surface soil. (Section 3.2.3)
There is little potential for radiological exposure to workers and members of the public from
handling and temporary storage of hydraulic fracturing fluid on natural gas well sites.
However, there is a potential for radiological environmental impacts from spills of hydraulic
fracturing fluid on natural gas well sites and from spills that could occur from the
transportation and delivery of this fluid.
Radium-226 was detected within the hydraulic fracturing fluid ranging from 64.0 –
21,000 pCi/L. Radium-228 was also detected ranging from 4.5 – 1,640 pCi/L. The hydraulic
fracturing fluid was made up of a combination of fresh water, produced water, and reuse
flowback fluid. (Section 3.3.2)
There is little potential for radiological exposure to workers and members of the public from
handling and temporary storage of flowback fluid on natural gas well sites.
However, there is a potential for radiological environmental impacts from spills of flowback
fluid on natural gas well sites and from spills that could occur from the transportation and
delivery of this fluid.
Radium-226 concentrations were detected within flowback fluid samples ranging from 551 –
25,500 pCi/L. Radium-228 was also detected ranging from 248 – 1,740 pCi/L.
(Section 3.3.3)
There is little potential for radiological exposure to workers and members of the public from
handling and temporary storage of produced water on natural gas well sites.
PA DEP TENORM Study Report – Section 9.0 Rev. 0
January 2015 9-3
However, there is a potential for radiological environmental impacts from spills of produced
water from unconventional natural gas well sites and from spills that could occur from the
transportation and delivery of this fluid.
Radium-226 concentrations were detected in produced water samples ranging from 40.5 –
26,600 pCi/L. Radium-228 concentrations were also detected ranging from 26.0 –
1,900 pCi/L. The Ra-226 activity in unconventional well site produced water is
approximately 20 times greater than that observed in conventional well site produced water.
The ratio of Ra-226 to Ra-228 in unconventional well site produced water is approximately
eight times greater than that found in conventional well site produced water. (Sections 3.3.4
and 3.6.3)
There were no statistically significant differences observed between filtered and unfiltered
liquid sample analytical results.
Because the liquid samples were preserved by addition of acid prior to filtering, the
radioactive particulates may have entered solution and were therefore not removed by
filtering. (Section 3.6.2)
The Rn concentrations in natural gas sampled at Pennsylvania well sites during this study
are consistent with the Rn concentrations in natural gas reported by the U.S. Geological
Survey (USGS) for Pennsylvania, which range from 1 to 79 pCi/L with an overall median of
37 pCi/L.
The Rn in natural gas measured ranged from 3.0 to 147.5 pCi/L, with a median Rn
concentration of 40.8 pCi/L. (Section 3.4.2)
There is little potential for additional Rn exposure to workers and members of the public on
or near natural gas well sites. The Rn concentrations in ambient air sampled at well sites during this study are consistent
with the typical ambient background Rn concentrations of 0.2 to 0.7 pCi/L. (Section 3.4.1)
9.1.2 Wastewater Treatment Plants (Section 4.0)
9.1.2.1 Publicly Owned Treatment Works
There is little potential for internal radiation exposure to workers and members of the public
from and surface radioactivity at POTWs.
Nine of the 566 measurements and 68 of the 566 measurements of total surface
radioactivity exceeded the RG 1.86 criteria. One of the 286 removable measurements and
none of the 286 removable measurements exceeded the RG 1.86 criteria. Fixed or
removable and surface radioactivity may present a potential inhalation or ingestion
hazard if disturbed in the future. (Section 4.1.6.2)
PA DEP TENORM Study Report – Section 9.0 Rev. 0
January 2015 9-4
There is little potential for exceeding public dose limits from external gamma radiation for
workers and members of the public at POTWs.
The highest average gamma radiation exposure rate was 36.3 R/hr, and the maximum
gamma radiation exposure rate measured was 257 R/hr. Assuming the time period of
exposure is a full occupational year of 2,000 hours, the maximum average POTW annual
external gamma radiation exposure was estimated as 62.6 mrem/yr, which is less than the
maximum public dose limit of 100 mrem/yr. (Sections 4.1.2.1 and 4.1.6.1)
There is little potential for radiological exposure to workers and members of the public from
handling and temporary storage of filter cake at POTW-I’s.
However, there is a potential for radiological environmental impacts from spills and the
long-term disposal of POTW-I filter cake.
The filter cake analytical results for POTW-I plants show Ra-226 and Ra-228 are present
above typical background concentrations in soil. The average Ra-226 result was 20.1 pCi/g
with a large variance in the distribution. The maximum result was 55.6 pCi/g. The average
Ra-228 result was 8.32 pCi/g, and the maximum result was 32.0 pCi/g Ra-228.
(Section 4.1.2.1)
There is little potential for radiological exposure to workers and members of the public from
handling and temporary storage of filter cake at POTW-N’s.
There is little potential for radiological environmental impacts from spills and the long-term
disposal of POTW-N filter cake.
The radioactivity levels at POTW-N plants presented in Table 4-6 were above typical
background concentrations in soil with Ra-226 average and maximum results of 8.89 pCi/g
and 35.4 pCi/g. The average and maximum Ra-228 results were 2.13 pCi/g and 7.26 pCi/g.
(Section 4.1.2.1)
There is little potential for radiological exposure to workers and members of the public from
sediment-impacted soil at POTW-I’s.
However, there is a radiological environmental impact to soil from the sediments from
POTW-I’s.
The analytical results for POTW-I sediment-impacted soil samples indicate Ra-226 and
Ra-228 are present at concentrations above typical background in soil. The average Ra-226
result was 9.00 pCi/g, and the maximum result was 18.2 pCi/g. The average Ra-228 result
was 3.52 pCi/g, and the maximum result was 6.25 pCi/g. (Section 4.1.2.2)
There is little potential for additional Rn exposure to workers and the members of the public
inside POTW-I’s.
PA DEP TENORM Study Report – Section 9.0 Rev. 0
January 2015 9-5
Indoor Rn results from POTW-I results ranges from 0.2 to 8.7 pCi/L. One result exceeds the
EPA action level of 4.0 pCi/L. The Rn measured in indoor air averaged 1.7 pCi/L. The
average is above the average indoor level of 1.3 pCi/L in the U.S. as reported by EPA.
(Section 4.1.4)
9.1.2.2 Centralized Wastewater Treatment Plants
There is potential for internal radiation exposure to workers and members of the public from
and surface radioactivity at CWTs that treat O&G wastewater. Fixed and surface
radioactivity may present a potential inhalation and ingestion hazard if disturbed during
routine system maintenance.
One hundred eighty-six of the 777 measurements and 461 of the 777 measurements of
total surface radioactivity exceeded the RG 1.86 criteria. Seven of the 805 removable
measurements and 6 of the 805 removable measurements exceeded the RG 1.86 criteria.
The average of the total surface radioactivity measurements exceeded the RG 1.86 criteria
in 10 of the 11 CWT facilities surveyed. The average of the total surface radioactivity
measurements exceeded the RG 1.86 criteria in four of the 11 CWT facilities surveyed. The
corresponding removable radioactivity measurements are mostly less than the RG 1.86
criteria, indicating the total radioactive contamination measured is fixed to the surface and
not immediately available for inhalation or ingestion. (Section 4.2.6.2)
There is little potential for exceeding public dose limits from external gamma radiation for
workers and members of the public at CWTs that treat O&G wastewater.
Assuming the time period of exposure is a full occupational year of 2,000 hours, and the
average maximum exposure rate of 19.1 R/hr, the maximum average CWT annual external
gamma radiation exposure was estimated as 38 mrem/yr. The maximum gamma radiation
exposure rate measured was 502 R/hr on contact with the outside of a wastewater tank.
(Section 4.2.6.1)
There is little potential for radiological exposure to workers and members of the public from
handling and temporary storage of filter cake at CWTs that treat O&G wastewater.
However, there is a potential for radiological environmental impacts from spills and the
long-term disposal of CWT filter cake from CWTs that treat O&G wastewater.
The analytical results indicate all the CWT filter cake samples contain elevated Ra-226 and
Ra-228 above typical background levels for soil. The maximum results were 307 pCi/g of
Ra-226 and 177 pCi/g of Ra-228. Five of 27 filter cake samples exceeded the DOT Ra
threshold for labeling as radioactive material. (Section 4.2.2.1) There is little potential for radiological exposure to workers and members of the public from
sediment-impacted surface soil at CWTs that treat O&G wastewater.
However, there is a radiological environmental impact to soil from the sediments from CWTs
that treat O&G wastewater.

PA DEP TENORM Study Report – Section 9.0 Rev. 0
January 2015 9-6
Sediment-impacted soil was collected at the accessible effluent discharge points at the
CWTs. Radium above typical soil background levels to a maximum of 508 pCi/g of total Ra
was identified in the sediment-impacted soil samples. (Section 4.2.7)
There is little potential for radiological exposure to workers and members of the public from
impacted soil at CWTs that treat O&G wastewater.
However, there is a radiological environmental impact to surface soil at CWTs that treat
O&G wastewater.
Gamma radiation walkover surveys identified areas with radioactivity above local
background. At three of these locations, a biased soil sample was collected to determine the
amount of activity at or near the surface. Radium above soil typical background levels to a
maximum of 117 pCi/g Ra-226 and 83.1 pCi/g Ra-228 was identified in biased soil samples.
(Section 4.2.2.3)
There is little potential for additional Rn exposure to workers and the members of the public
inside CWTs that treat O&G wastewater. Indoor air was sampled and analyzed for Rn concentration at various CWT indoor locations
such as break rooms, laboratories, offices, etc. The results ranged from 0.9 to 5.0 pCi/L.
One result exceeded the EPA action level. The Rn measured in indoor air averaged
2.0 pCi/L. The average is above the average indoor level of 1.3 pCi/L in the U.S. as reported
by EPA. (Sections 4.2.4 and 4.2.6.3)
9.1.2.3 Zero Liquid Discharge Plants
There is potential for internal and surface radioactivity exposure to workers and
members of the public at ZLDs that treat O&G wastewater. Fixed and surface
radioactivity may present a potential inhalation and ingestion hazard if disturbed during
future routine system maintenance. One hundred fifty-nine of the 566 measurements and 175 of the 566 measurements of
total surface radioactivity exceeded the RG 1.86 criteria. Fourteen of the 589 removable
measurements and 2 of the 589 removable measurements exceeded the RG 1.86 criteria.
The highest average total and surface radioactivity levels were 239 dpm/100 cm2 and
4,740 dpm/100 cm2. The maximum total and surface radioactivity levels were
1,410 dpm/100 cm2 and 49,700 dpm/100 cm
2. The corresponding removable surface
radioactivity measurements are mostly less than the RG 1.86 criteria, only 14 of 589
measurements exceeded the applicable criteria, indicating the total surface radioactivity
measured is fixed to the surface and not immediately available for inhalation or ingestion.
Fixed and surface radioactivity may present a potential inhalation or ingestion hazard if
disturbed during routine system maintenance. (Section 4.3.6.2)
There is little potential for exceeding public dose limits from external gamma radiation for
workers and members of the public at ZLDs that treat O&G wastewater.
PA DEP TENORM Study Report – Section 9.0 Rev. 0
January 2015 9-7
The maximum average gamma radiation exposure rate measured at any of the ZLD plants
was 43.1 R/hr. The lowest background gamma radiation exposure rate measured at any of
the sites was 5 R/hr. Assuming the time period of exposure is a full occupational year of
2,000 hours, the maximum average ZLD annual external gamma radiation exposure was
estimated as 76 mrem/yr. The maximum gamma radiation exposure rate measured was
445 R/hr. (Sections 4.3.1.4 and 4.3.6.1)
There is little potential for radiological exposure to workers and members of the public from
handling and temporary storage of filter cake at ZLDs that treat O&G wastewater.
However, there is a potential for radiological environmental impacts from spills and the
long-term disposal of filter cake from ZLDs that treat O&G wastewater.
Radium-226 and Ra-228 were measured in ZLD filter cake samples at concentrations above
typical background levels for surface soils. Radium-226 concentrations ranged from 3.08 to
480 pCi/g and Ra-228 concentrations ranged from 0.58 to 67.3 pCi/g. (Section 4.3.2.1)
There is little potential for radiological exposure to workers and members of the public from
influent and effluent water at ZLDs that treat O&G wastewater.
However, there is a potential for radiological environmental impacts from spills of influent
and effluent water at ZLDs that treat O&G wastewater.
Radium (Ra-226 and Ra-228) was routinely detected in all liquid influent and effluent
sample types with an approximate 50 percent difference between influent and effluent, but
little difference between filtered and unfiltered results. Results ranged from 29.0 to
20,900 pCi/L. (Section 4.3.5)
There is little potential for additional Rn exposure to workers and the members of the public
at ZLDs that treat O&G wastewater.
Indoor air was sampled and analyzed for Rn concentration at various indoor locations such as
break rooms, laboratories, offices, etc. The results ranged from 0.5 to 4.9 pCi/L. Two results
exceeded the EPA action level. The Rn measured in indoor air averaged 2.3 pCi/L. The
average is above the average indoor level of 1.3 pCi/L in the U.S. as reported by EPA.
(Sections 4.3.4 and 4.3.6.3)
There is little potential for exceeding public dose limits from external gamma radiation for
truck drivers from hauling O&G wastewater or sludge/filter cake from facilities that treated
O&G wastewater.
It was assumed a truck driver hauled full containers with either wastewater or sludge/filter
cake for four hours per day and made return trips with empty containers for four hours per
day. The driver was assumed to work 40 hours per week for 10 weeks per year hauling O&G
wastewater or sludge. The total estimated dose to the wastewater truck driver was
0.35 mrem/yr. The total estimated dose to the sludge truck driver was 52 mrem/yr.
(Section 4.3.6.4)
PA DEP TENORM Study Report – Section 9.0 Rev. 0
January 2015 9-8
9.1.3 Landfills (Section 5.0)
There is little potential for radiological exposure to workers and members of the public from
leachate at landfills.
There is little difference in the radium detected in the leachate from the nine landfills
selected based on the volume of O&G industry waste accepted and from the 42 other
landfills.
Samples of leachate were collected from the nine landfills selected based on the volume of
O&G industry waste received and from the 42 other landfills not selected based on the
volume of O&G industry waste received and analyzed using gamma spectroscopy for Ra-226
and Ra-228. Radium was detected above the MDC value in 34 of 51 samples. Radium-226
results ranged from 26.5 to 416 pCi/L with an average of 112 pCi/L in the 42 unselected
landfills and 106 pCi/L in the nine selected landfills. Radium-228 results ranged from 2.50
to 84.0 pCi/L with an average of 12.6 pCi/L in the 42 unselected landfills and 16.5 pCi/L in
the nine selected landfills. (Section 5.1)
There is limited potential for radiological environmental impacts from spills or discharges of
effluent or influent leachate at landfills that accept O&G waste for disposal.
Nine influent and seven effluent leachate samples were collected at the nine selected
landfills. Radium was detected in all of the leachate samples. Radium-226 results ranged
from 26.5 to 378 pCi/L with an average of 127 pCi/L for effluent samples and 64.7 pCi/L for
influent samples. Radium-228 results ranged from 3.00 to 84.0 pCi/L with an average of
19.9 pCi/L for effluent samples and 6.17 pCi/L for influent samples. The influent and
effluent samples from the same facility do not represent the same leachate at different times
in treatment. (Section 5.2.1)
There is little potential for radiological exposure to workers and members of the public from
handling and temporary storage of filter cake at landfills that accept O&G waste for
disposal.
However, there is a potential for radiological environmental impacts from spills and the
long-term disposal of landfill filter cake from landfills that accept O&G waste for disposal.
Filter cake from three of the nine selected landfills was sampled and analyzed using gamma
spectroscopy. Radium was detected in all of the filter cake samples. Radium-226 results
ranged from 8.73 to 53.0 pCi/g, with an average of 24.3 pCi/g. Radium-228 results ranged
from 1.50 to 4.93 pCi/g, with an average of 3.77 pCi/g. (Section 5.2.2)
There is little potential for radiological exposure to workers and members of the public from
sediment-impacted soil at landfills that accepted O&G waste for disposal.
However, there may be a radiological environmental impact to soil from the sediments from
landfill leachate treatment facilities that treat leachate from landfills that accept O&G waste
for disposal.
PA DEP TENORM Study Report – Section 9.0 Rev. 0
January 2015 9-9
The three landfills that had filter cake sampled also discharged effluent water to the
environment. At each of the three effluent outfalls, a sediment-impacted soil sample was
collected. Radium was detected in all of the samples. Radium-226 results ranged from 2.82
to 4.46 pCi/g with an average of 3.57 pCi/g. Radium-228 results ranged from 0.979 to
2.53 pCi/g with an average of 1.65 pCi/g. (Section 5.2.3)
There is little potential for additional Rn exposure to workers and the members of the public
at or from landfills that accept O&G waste for disposal.
Ambient air was sampled at the fence line of each of the nine selected landfills and analyzed
for Rn concentration. The Rn in ambient air at the fence line of the landfills ranged from
0.2 to 0.9 pCi/L consistent with U.S. background levels of 0.2 to 0.7 pCi/L in outdoor
ambient air. (Section 5.2.4)
There is little potential for internal and surface radioactivity exposure to workers and
members of the public at landfills that accept O&G waste for disposal.
None of the 195 measurements and 17 of the 195 measurements of total surface
radioactivity exceeded the RG 1.86 criteria. All average total and surface radioactivity
levels were below the RG 1.86 criteria. The maximum total and concentrations were
84.6 dpm/100 cm2 and 3,630 dpm/100 cm
2. The average removable and levels at each
landfill were below the RG 1.86 criteria. The maximum removable and levels were also
below the RG 1.86 criteria. None of the 205 removable or surface radioactivity
measurements exceeded the RG 1.86 criteria. (Section 5.4.1.1)
There is little potential for exceeding public dose limits from external gamma radiation for
workers and members of the public at landfills that accept O&G waste for disposal.
The highest average exposure rate was 13.5 R/hr, and the maximum gamma exposure rate
measured was 93.7 R/hr. The minimum, limiting local background measured was 5 R/hr.
Assuming the duration of exposure is a full occupational year of 2,000 hours, the external
gamma radiation exposure at the landfill was estimated as 17 mrem/yr, which is much less
than the 100 mrem/yr dose equivalent limit for a member of the public. (Sections 5.3 and
5.4.1)
9.1.4 Gas Distribution and End Use (Section 6.0)
9.1.4.1 Natural Gas in Underground Storage
Radon concentrations in natural gas are lower after underground storage.
Natural gas samples were collected at four underground storage sites in Pennsylvania.
Duplicate samples were collected at each site during injection into the storage formation, and
also during withdrawal from the storage formation. (Section 6.1)
PA DEP TENORM Study Report – Section 9.0 Rev. 0
January 2015 9-10
9.1.4.2 Natural Gas-Fired Power Plants
Radon concentrations in the natural gas sampled entering power plants are consistent with
the Rn in natural gas concentrations in samples collected at well sites.
The two natural gas sample results from natural gas-fired power plants were 33.7 ± 1.8 pCi/L
and 35.7 ± 11.0 pCi/L. (Section 6.2 and Table 6.3)
There is little potential for exceeding public dose limits from external gamma radiation for
workers and members of the public at natural gas-fired power plants.
The gamma radiation exposure rate survey results at the PP-02 power plant were within the
range of natural background of gamma radiation for PA. The exception occurred on the
external surface of a pipe elbow where the range of measurement results observed was 15 to
17 µR/hr. (Section 6.2)
There is little potential for additional Rn exposure to workers and the members of the public
at or from natural gas-fired power plants. Ambient air was sampled at the PP-02 power plant site fence line. The fence line Rn monitor
results were all at or below the MDC value for the analysis. (Section 6.2)
9.1.4.3 Compressor Stations
Radon concentrations in the natural gas sampled at compressor stations are consistent with
the Rn in natural gas concentrations in samples collected at well sites.
All compressor stations were receiving predominately Marcellus Shale unconventional
natural gas at the time of sample collection. The range of compressor station natural gas Rn
results is 28.8 ± 1.4 to 58.1 ± 1.1 pCi/L, which is consistent with the production site Rn
sample results. (Section 6.3 and Table 6.5)
There is little potential for additional Rn exposure to workers and the members of the public
at or from natural gas compressor stations. Ambient air was sampled at the CS-01 compressor station fence line for the measurement of
Rn concentrations. The fence line Rn monitors results ranged from 0.1 to 0.8 pCi/L. The
average concentration at each fence line location was within the range of typical ambient
background Rn concentrations in outdoor ambient air in the U.S. (Section 6.3)
9.1.4.4 Natural Gas Processing Plant
Radon concentrations in natural gas entering the natural gas processing plant are consistent
with levels measured at well sites.
Radon in natural gas sampled entering the plant measured 67.7 pCi/L. The Rn in natural gas
sampled at the processing plant outflow measured 9.3 pCi/L. (Section 6.4 and Table 6.7)
PA DEP TENORM Study Report – Section 9.0 Rev. 0
January 2015 9-11
There is potential for exceeding public dose limits from external gamma radiation for
workers at the natural gas processing plant. Contact readings measured with filter housings ranged from background to 75 R/hr, with
two exceptions; one measured 350 R/hr and the other measured 900 R/hr. Radiation
exposure rates with values ranging from 20 to 400 R/hr were measured on additional
system components. (Section 6.4)
There is potential for internal and surface radioactivity exposure to workers at the
natural gas processing plant when a filter housing is opened.
The filter housing on the facility propenizer equipment was opened during a filter change-out
and a sample of the cardboard filter media was collected. The filter media sample was
smeared for removable and surface radioactivity. The average and surface
radioactivity levels are below the RG 1.86 and removable surface radioactivity criterion.
The results of samples collected from the facility propenizer equipment filter had a Pb-210
activity result of 3,580 pCi/g, but no other gamma-emitting NORM radionuclide results were
above 1 pCi/g. The gross and removable surface radioactivity results for the filter media
sample are elevated relative to the RG 1.86 gross and removable surface radioactivity
criterion. (Section 6.5)
9.1.4.5 Radon Dosimetry
There is little potential for additional Rn exposure to members of the public in homes using
natural gas from Marcellus Shale wells. The potential radiation dose received by home residents is a small fraction of the allowable
general public dose limit of 100 mrem/yr. Radon is transported with natural gas into structures (homes, apartments, and buildings) that
use natural gas for purposes such as heating and cooking. The incremental increase of
potential dose from Rn-222 to occupants of a typical home from use of natural gas was
conservatively estimated as 5.2 mrem/yr for the median dose and 17.8 mrem/yr for the
maximum dose. Based on the Rn and natural gas data collected as part of this study and the
conservative assumptions made, the incremental Rn increase in a home using natural gas
appliances is estimated to be very small, and would not be detectable by commercially
available Rn testing devices. The average and maximum calculated Rn concentration in
homes were 0.04 and 0.13 pCi/L, consistent with the EPA estimated indoor average of
0.13 pCi/L. (Section 6.6)
9.1.5 Oil and Gas Brine-Treated Roads (Section 7.0)
Radium activity measured in O&G brine-treated road samples is greater than typical surface
soil concentrations.
Biased surface soil samples were collected based on the audio response of the gamma scan
survey instrument ratemeter on 31 of the 32 O&G brine-treated roads. When an area with
PA DEP TENORM Study Report – Section 9.0 Rev. 0
January 2015 9-12
elevated radioactivity was detected, surface soil samples were collected at that area. After
correcting the reported Ra-226 activity by 0.992 pCi/g of natural background activity and
0.741 pCi/g of U-235 bias, 18 of 31 samples have excess Ra ranging from 0.020 to
5.23 pCi/g above natural background. (Sections 7.0 and 7.2.1)
Radium activity measured in reference background road samples is greater than typical
surface soil concentrations. The reference background roads were selected by geographical
location to O&G brine-treated roads selected for the study. As a point of reference and for comparison, 18 roads in the geographic vicinity of the subject
roads that have not been identified as O&G brine-treated were selected for surveying, and 14
biased soil samples were collected. After correcting the reported Ra-226 activity by
0.819 pCi/g of natural background activity and 0.71 pCi/g of U-235 bias, 11 of 14 samples
have excess Ra ranging from 0.021 to 61.5 pCi/g above natural background. Three of the
Ra-228 results are greater than 2.98 pCi/g, which is approximately three times natural
background for the Th series. (Section 7.2.2)
The excess Ra measured in reference background samples is higher than for the identified
O&G brine-treated roads. The average excess Ra-226 for roads identified as having been brine-treated is 1.13 pCi/g
compared to an average of 8.23 pCi/g on the background reference roads. One possible
explanation is that all of the roads have been treated with brine. After the 32 roads had been
identified as brine-treated, the reference background roads were selected by proximity to the
32 roads. (Section 7.2.2)
There is little potential for members of the public exceeding the public dose limit from
exposure to Ra in O&G brine-treated roads.
To evaluate potential exposure to the public from the brine-treated roads, a source term of
1 pCi/g of Ra-226 and 0.5 pCi/g of Ra-228 was assumed within a 6-inch layer of surface
material (treated road surface). The estimated total dose from 1 pCi/g of Ra-226 and
0.5 pCi/g of Ra-228 above natural background in surface soil, to a recreationist, in the year of
maximum exposure (year 1) is 0.441 mrem/yr, which is below the 100 mrem/yr public
exposure criteria based on assumed activity concentrations. The actual dose received is
dependent upon both the excess Ra radioactivity in surface soil and the time spent exposed to
the soil surface. (Section 7.3)
9.2 Recommendations for Future Actions
9.2.1 Well Sites
Conduct research and investigation of vertical and horizontal drill cuttings for beneficial use,
onsite disposal, and future landfill disposal protocols.
Add sampling and analyses for Ra-226, Ra-228, and additional man-made radionuclides such
as tracers used in the O&G industry to Pennsylvania spill response protocol for spills of
PA DEP TENORM Study Report – Section 9.0 Rev. 0
January 2015 9-13
flowback fluid, hydraulic fracturing fluid, or produced water. Field survey instrumentation
should also be available for surveys of areas impacted by the spill.
9.2.2 Wastewater Treatment Plants
Perform routine survey and assessment of areas impacted with surface radioactivity to
determine personnel protective equipment (PPE) use and monitoring during future activity
that may cause surface and radioactivity to become airborne.
Conduct additional radiological sampling and analyses and radiological surveys at all
WWTPs accepting wastewater from O&G operations to determine if there are areas of
contamination that require remediation; if it is necessary to establish radiological effluent
discharge limitations; and if the development and implementation of a spill policy is
necessary.
9.2.3 Landfills
• Evaluate and, if necessary, modify the landfill disposal protocol for sludges/filter cakes and
other solid waste-containing TENORM.
Conduct additional radiological sampling and analyses and radiological surveys at all
facilities that treat leachate from landfills that accept waste from O&G operations to
determine if there are areas of contamination that require remediation; if it is necessary to
establish radiological effluent discharge limitations; and if the development and
implementation of a spill policy is necessary.
Add total Ra (Ra-226 and Ra-228) to the annual suite of contaminants of concern in leachate
sample analyses.
9.2.4 Gas Distribution and End Use
Survey and sample internal surfaces of natural gas plant piping and filter housings for
radiological contamination. This effort should include evaluation of worker exposure and
buildup of radioactivity in systems from natural gas processing and transmission. Evaluate
monitoring and recommendation of PPE and other controls to be used during pipe clean-out
and other activities when internal surfaces are exposed.
9.2.5 Oil and Gas Brine-Treated Roads
Perform further study of O&G brine-treated roads. This study should evaluate produced
water radionuclide concentrations prior to treatment, resultant surface activity and
radionuclide concentration of road surfaces and future Ra migration.
PA DEP TENORM Study Report – Section 10.0 Rev. 0
January 2015 10-1
10.0 REFERENCES
Section 1.0:
1. PSU Marcellus Center for Outreach and Research (MCOR) 2014. www.marcellus.psu.edu,
August.
2. U.S. EPA 2014. > Climate Change > Natural Gas Star Program > Basic Info,
www.epa.gov/methane/gasstar/basi-information/index.html, August.
3. U.S. EPA 2003. “EPA Assessment of Risks from Radon in Homes,” June.
Section 2.0:
1. ANSI/HPS 2009. N13.53-2009, Control and Release of Technologically Enhanced NORM
(TENORM).
2. DOE 1990. DOE Procedure Gamma 4.5.2.3, EML Procedures Manual, 27th Edition, Vol. I,
DOE Report HASL-300-ED. 27-VOL. 1.
3. DOT, 49 CFR 173.436, Radioactive Material.
4. EPA 2012. U.S. EPA/OAR/IED (6609J), EPA 402-K-12-002, A Citizen’s Guide to Radon,
May. Also: http://www.epa.gov/radon/pubs/citguide.html
5. EPA 2000. Directive No. 9200.4-35, Remediation Goals for Radioactively Contaminated
CERCLA Sites.
6. EPA 1980. EPA 900.0, “Prescribed Procedures for Measurement of Radioactivity in
Drinking Water,” U.S. EPA-6000/4-80-032, August.
7. EPA, Drinking Water Standard, 40 CFR 141.66.
8. Jenkins, P.H., Burkhart, J.F., and Camley, R.E. 2014. “Errors in Measurement of Radon-222
in Methane and Carbon Dioxide using Scintillation Cells Calibrated for Radon-222 in Air.”
Health Physics, Vol. 106, No. 3, March.
9. NRC, 10 CFR 20 Appendix B, Table 1, Col 3.
10. NRC, 10 CFR 20 Appendix B, Table 2, Liquid Effluent.
11. NRC, 10 CFR 20.1201, Occupational Dose Limits for Adults.
12. NRC, 10 CFR 20.1301, Radiation Dose Limits for Members of the Public.
13. NRC, 10 CFR 20.1402-20.1403, Radiological Criteria for Unrestricted Use.
14. NRC 1974a. Regulatory Guide 1.86, Termination of Operating Licenses for Nuclear
Reactors (1974)—Criteria for Natural Thorium Including Ra-228.
15. NRC 1974b. Regulatory Guide 1.86, Termination of Operating Licenses for Nuclear
Reactors (1974)—Criteria for Ra-226.
16. OSHA, 29 CFR 1910.1096.
17. United Nations Scientific Committee on the Effects of Atomic Radiation (UNSCEAR) 2000.
Sources and Effects of Ionizing Radiation.
PA DEP TENORM Study Report – Section 10.0 Rev. 0
January 2015 10-2
Section 3.0:
1. Jenkins et al., 2014. Health Physics, Vol. 106, No. 3, March.
2. NRC 1998a. Table 6.4, NaI Scintillation Detector Scan MDCs for Common Radiological
Contaminants, NUREG-1507, Minimum Detectable Concentrations With Typical Radiation
Survey Instruments for Various Contaminants and Field Conditions, June.
3. NRC 1998b. Table 6.3, NaI Scintillation Detector Count Rate Versus Exposure Rate
(cpm/µR/hr), NUREG-1507, Minimum Detectable Concentrations With Typical Radiation
Survey Instruments for Various Contaminants and Field Conditions, June.
4. NRC 1974. Regulatory Guide 1.86, Termination of Operating Licenses for Nuclear Reactors
(1974)—Criteria.
Section 4.0:
1. EPA 2012. U.S. EPA/OAR/IED (6609J), EPA 402-K-12-002, A Citizen’s Guide to Radon,
May. Also: http://www.epa.gov/radon/pubs/citguide.html
2. NRC 1998a. Table 6.4, NaI Scintillation Detector Scan MDCs for Common Radiological
Contaminants, NUREG-1507, Minimum Detectable Concentrations With Typical Radiation
Survey Instruments for Various Contaminants and Field Conditions, June.
3. NRC 1974. Regulatory Guide 1.86, Termination of Operating Licenses for Nuclear Reactors
(1974)—Criteria.
Section 5.0:
1. NRC 1998a. Table 6.4, NaI Scintillation Detector Scan MDCs for Common Radiological
Contaminants, NUREG-1507, Minimum Detectable Concentrations With Typical Radiation
Survey Instruments for Various Contaminants and Field Conditions, June.
2. NRC 1974. Regulatory Guide 1.86, Termination of Operating Licenses for Nuclear Reactors
(1974)—Criteria.
Section 6.0:
1. American Gas Association, Washington, D.C.
2. DOT 2011. National Pipeline Mapping System, User Guide.
3. EPA 2003. Pawal, D.J. and Puskin, J.S. EPA Assessment of Risks from Radon in Homes,
June.
4. Jenkins et al., 2014. Health Physics, Vol. 106, No. 3, March.
5. Nazaroff, W.W. and Nero, A.V., 1988. Radon and its Decay Products in Indoor Air. John
Wiley & Sons.
6. NRC 1974. Regulatory Guide 1.86, Termination of Operating Licenses for Nuclear Reactors
(1974)—Criteria.
7. Rowan, E.L. and Kraemer, T. F. U.S. Geological Survey. Radon-222 Content of Natural
Gas Samples from Upper and Middle Devonian Sandstone and Shale Reservoirs in
Pennsylvania: Preliminary Data, Open-file Report Series 2012-1159.
8. Spectra Energy Transmission 2014, Personal Communication, May.
PA DEP TENORM Study Report – Section 10.0 Rev. 0
January 2015 10-3
9. UNSCEAR 2006. Annex E.
10. U.S. Census, American Housing Survey, 2011, Table C-02-AH.
Section 7.0:
1. Pennsylvania Department of Environmental Protection (DEP) 2013. Fact sheet,
Roadspreading of Brine for Dust Control and Road Stabilization, developed under the
authority of the Clean Streams Law, the Solid Waste Management Act, and Chapters 78 and
101 of DEP’s Rules and Regulations.
2. NRC 1998a. Table 6.4, NaI Scintillation Detector Scan MDCs for Common Radiological
Contaminants, NUREG-1507, Minimum Detectable Concentrations With Typical Radiation
Survey Instruments for Various Contaminants and Field Conditions, June.
Section 8.0:
1. DEP 2013. Sample and Analysis Plan Part I, Field Sampling Plan (FSP), April.
2. DEP 2013. Sample and Analysis Plan Part II, Quality Assurance Project Plan (QAPP), April.
3. DEP. Laboratory QAM.
4. NRC 1994. NRC Inspection Manual Procedure 84750, March.
Section 9.0:
1. EPA 2012. U.S. EPA/OAR/IED (6609J), EPA 402-K-12-002, A Citizen’s Guide to Radon,
May. Also: http://www.epa.gov/radon/pubs/citguide.html
2. NRC 1974. Regulatory Guide 1.86, Termination of Operating Licenses for Nuclear Reactors
(1974)—Criteria.