pacific earthquake engineering research center assessment of columns with short lap splices...
TRANSCRIPT
Experimental Assessment of Columns with ShortLap Splices Subjected to Cyclic Loads
Murat MelekJohn W. Wallace
University of California, Los Angeles
and
Joel P. ConteUniversity of California, San Diego
Pacific Earthquake EngineeringResearch Center
PEER 2003/04APRIL 2003

Experimental Assessment of Columns with Short Lap Splices Subjected to Cyclic Loads
Murat Melek Department of Civil and Environmental Engineering
University of California, Los Angeles
John W. Wallace Department of Civil and Environmental Engineering
University of California, Los Angeles
Joel P. Conte Department of Structural Engineering
University of California, San Diego
PEER Report 2003/04 Pacific Earthquake Engineering Research Center
College of Engineering University of California, Berkeley
April 2003
iii
ABSTRACT
Splices in reinforced concrete columns in older buildings, or within the nonparticipating frames
in some newer buildings, were typically designed as compression lap splices. Compression lap
lengths are typically short (20 to 24db), and only light transverse reinforcement is provided over
the lap length. Observations of column damage following earthquakes have revealed that these
splices perform poorly; however, relatively sparse information exists to assess the expected
performance for typical conditions. To address these needs, a PEER Center research program
was undertaken at UCLA to conduct testing of full-scale columns under a variety of conditions.
The test specimens consisted of cantilever columns with a point load applied at the top. The 450
mm square column sections were tested under reversed cyclic lateral load with constant axial
load. The primary variables include the level of axial load, the ratio of moment to shear, and the
load history. Information on the test program, experimental observations, results, and
conclusions are presented in this report.
Specimens with 20db lap-splice length and poorly confined cross section behaved
unsatisfactorily under cyclic lateral loading. The lateral strength of specimens started degrading
at lateral drift levels of 1.0%–1.5%. The lateral strength degradation was due to the deterioration
of the bond between the reinforcement bars and the surrounding concrete. Although higher levels
of the applied axial load slightly increased the lateral strength of the specimens, changes in shear
demand did not appear to influence the lateral load at which bond deterioration initiated.
The degradation rate of the lateral strength was affected by the lateral displacement
history and shear demand. The specimen subjected to a near-fault displacement history
maintained more than half of its lateral strength up to a drift ratio of 5%, whereas the specimens
with standard displacement history lost more than 75% of their lateral strength at that drift level.
A comparison of specimens with moderate to high shear demand revealed that lateral strength
degradation also increased with higher shear demand.
The rotational response of the specimen was predominantly influenced by the slippage of
reinforcement bars. At 1.5% lateral drift ratio, 80%–85% of the measured rotation was due to
slip.
The measured average bond strength gave an average of '95.0 cf MPa ( '5.11 cf psi),
whereas bond strength implied by ACI 318-02 Equation 12-3 provided a lower bound.

iv
ACKNOWLEDGMENTS
This work made use of Pacific Earthquake Engineering Research Center Shared Facilities
supported by the Earthquake Engineering Research Centers Program of the National Science
Foundation under award number EEC-9701568.
The authors would like to thank former undergraduate students Matt Brunnings, Nick
Bucci, Timothy Chen, Jim Norum, Matt Pollard, Chris Petteys, and Bryan Waters for their
contributions to the construction, instrumentation, and testing of the column specimens. The
assistance of UCLA Senior Development Engineer Harold Kasper in the laboratory and for
materials testing was greatly appreciated. Special appreciation is extended to UCLA graduate
students Kutay Orakcal, Thomas Hyun-Koo Kang, Paul Ko, Leonardo Massone, Brian Sayre,
and Eunjong Yu, who helped at various stages of the experimental program.
The authors would also like to acknowledge Dr. Thomas Sabol, of Englekirk and Sabol
Consulting Engineers, for his assistance in the review of reinforcement and gravity load levels in
older buildings; Ms. Brenda Guyader, a former UCLA graduate student, for her contributions
during the early stages of the project; Assistant Professor Dawn E. Lehman, of the University of
Washington, and Assistant Professor Halil Sezen, of Ohio State University, for their valuable
advice.
v
CONTENTS
ABSTRACT................................................................................................................................... iii
ACKNOWLEDGMENTS ............................................................................................................. iv
TABLE OF CONTENTS................................................................................................................ v
LIST OF FIGURES ...................................................................................................................... vii
LIST OF TABLES....................................................................................................................... xiii
NOMENCLATURE ..................................................................................................................... xv
1 INTRODUCTION .................................................................................................................. 1
1.1 General............................................................................................................................ 1
1.2 Observations from Earthquake Damage ......................................................................... 3
1.3 Objectives and Scope...................................................................................................... 4
1.4 Related Research............................................................................................................. 5
2 DESCRIPTION OF EXPERIMENTAL PROGRAM............................................................ 9
2.1 Specimens ....................................................................................................................... 9
2.2 Materials ....................................................................................................................... 10
2.3 Construction of Specimens ........................................................................................... 11
2.4 Testing Apparatus ......................................................................................................... 12
2.5 Instrumentation and Data Acquisition .......................................................................... 13
2.6 Testing Procedure ......................................................................................................... 15
3 EXPERIMENTAL RESULTS.............................................................................................. 17
3.1 Experimentally Observed Damage and Behavior......................................................... 17
3.2 Lateral Load versus Top Displacement Relations ........................................................ 23
3.3 Moment versus Rotation Relations............................................................................... 27
3.4 Steel Strain Profiles....................................................................................................... 28
3.5 Shear Distortion ............................................................................................................ 31
4 SUMMARY AND CONCLUSIONS ................................................................................... 33
4.1 Summary ....................................................................................................................... 33
4.2 Conclusions................................................................................................................... 33
REFERENCES ............................................................................................................................. 37
APPENDIX: Strain Histories...................................................................................................... 129
vii
LIST OF FIGURES
Figure 1.1 Splice Damage: Northridge Earthquake...................................................................39
Figure 1.2 Anchorage and Splice Damage ................................................................................39
Figure 1.3 Comparison of Test Results (Aboutaha et al., 1996) ...............................................40
Figure 1.4 Lateral Load-Top Displacement Relations (Chai et al., 1991).................................40
Figure 1.5 Reinforcement Details..............................................................................................41
Figure 1.6 Comparison of Test Results (Valluvan et al., 1993) ................................................41
Figure 1.7 Comparison of Test Results (Coffman et al., 1996).................................................42
Figure 1.8 Test Setup (Lynn et al., 1996) ..................................................................................43
Figure 1.9 Lateral Load-Top Displacement Relations (Lynn et al., 1996)................................44
Figure 2.1 Reinforcing Details ..................................................................................................45
Figure 2.2 Standard Concrete Compressive Test ......................................................................47
Figure 2.3 Stress-Strain Diagram for Specimens: S10MI, S20MI, and S30MI ........................48
Figure 2.4 Stress-Strain Diagram for Specimens: S20HI, S20HIN, and S30XI .......................48
Figure 2.5 Pedestal Reinforcement Details ...............................................................................49
Figure 2.6 Reinforcement Cage.................................................................................................50
Figure 2.7 Reinforcement Cages before Placing Concrete........................................................50
Figure 2.8 Column Cross Section..............................................................................................51
Figure 2.9 Splice Region ...........................................................................................................51
Figure 2.10 Specimen ..................................................................................................................52
Figure 2.11 Joint Close-up...........................................................................................................52
Figure 2.12 Test Setup ................................................................................................................53
Figure 2.13 Test Setup with Reaction Frame ..............................................................................54
Figure 2.14 Test Setup during Experiment .................................................................................54
Figure 2.15 Actuator Control Schematic .....................................................................................55
Figure 2.16 Strain Gauge Layout.................................................................................................56
Figure 2.17 Strain Gauge Labeling Scheme ................................................................................57
Figure 2.18 External Instrumentation Grid (S10MI, S20MI, S30MI).........................................58
Figure 2.19 Transducers Used to Measure Total and Slip Rotation at Column Base (S10MI,
S20MI, S30MI)........................................................................................................58

viii
Figure 2.20 External Instrumentation (S20HI, S20HIN, S30XI) ................................................59
Figure 2.21 Shear Instrumentation (S20HI, S20HIN, S30XI).....................................................59
Figure 2.22 External Instrumentation Layout (S10MI, S20MI, S30MI).....................................60
Figure 2.23 External Instrumentation Layout (S20HI, S20HIN, S30XI)....................................60
Figure 2.24 Test Specimen with Cable-Extension Position Transducers....................................62
Figure 2.25 Data Acquisition Device and MTS 407 Controller ................................................62
Figure 2.26 Data Acquisition Schematic .....................................................................................63
Figure 2.27 Strain Gauge Amplifier ............................................................................................64
Figure 2.28 Data Logger Program Window ................................................................................64
Figure 2.29 Standard Displacement History................................................................................65
Figure 2.30 Near-Fault Displacement History.............................................................................65
Figure 3.1 Longitudinal Cracks Indicating Bond Deterioration (S20HI at 1.5% Drift)
(Left) ........................................................................................................................68
Figure 3.2 Longitudinal and Shear Cracking (S20HIN at 5.8% Drift) (Right) .........................68
Figure 3.3 Concrete Spalling (S30XI at 3% Drift) ....................................................................68
Figure 3.4 Specimen S20MI at 0.50% Lateral Drift..................................................................69
Figure 3.5 Specimen S20MI at 1.0% Drift (Left)....................................................................69
Figure 3.6 Specimen S20MI at 1.5% Drift (Right) ...................................................................69
Figure 3.7 Specimen S20MI at 2.0% Lateral Drift....................................................................70
Figure 3.8 Specimen S20MI at 3.0% Lateral Drift....................................................................70
Figure 3.9 Specimen S20MI at 5.0% Lateral Drift....................................................................71
Figure 3.10 Specimen S20MI at 7.0% Lateral Drift....................................................................71
Figure 3.11 Column Free-Body Diagram....................................................................................72
Figure 3.12 Lateral Drift-Top Rotation ......................................................................................73
Figure 3.13 Lateral Drift-Axial Load ..........................................................................................74
Figure 3.14 Specimen S10MI at 10% Lateral Drift—Axial Load Capacity Maintained ............75
Figure 3.15 Specimen S20MI at 7% Lateral Drift after Axial Load Capacity Lost ....................75
Figure 3.16 Specimen S30MI at 5% Lateral Drift after Axial Load Capacity Lost ....................76
Figure 3.17 Specimen S20HI at 7% Lateral Drift after Axial Load Capacity Lost ....................76
Figure 3.18 Specimen S20HIN at 12% Lateral Drift—Axial Load Capacity Maintained ..........77
Figure 3.19 Specimen S30XI at 5% Lateral Drift after Axial Load Capacity Lost ....................77
ix
Figure 3.20 Top Displacement due to Pedestal Rotation ...........................................................78
Figure 3.21 Top Displacement due to Pedestal Rotation ............................................................79
Figure 3.22 Top Displacement due to Pedestal Movement ........................................................80
Figure 3.23 Top Displacement due to Pedestal Movement .........................................................81
Figure 3.24 Modified Lateral Displacement Histories ...............................................................82
Figure 3.25 Modified Lateral Displacement Histories ................................................................83
Figure 3.26 Specimen S10MI Lateral Load-Top Displacement..................................................84
Figure 3.27 Specimen S20MI Lateral Load-Top Displacement .................................................84
Figure 3.28 Specimen S30MI Lateral Load-Top Displacement..................................................85
Figure 3.29 Specimen S20HI Lateral Load-Top Displacement .................................................85
Figure 3.30 Specimen S20HIN Lateral Load-Top Displacement ...............................................86
Figure 3.31 Specimen S30XI Lateral Load-Top Displacement ..................................................86
Figure 3.32 Base Moment/Yield Moment Comparison of S10MI, S20MI, and S30MI ............87
Figure 3.33 Base Moment/Yield Moment Comparison of S20MI, S20HI, and S20HIN ...........88
Figure 3.34 Base Moment/Yield Moment Comparison of S30MI and S30XI............................88
Figure 3.35 Measured Secant Stiffness— S10MI........................................................................89
Figure 3.36 Measured Secant Stiffness—S20MI ........................................................................89
Figure 3.37 Measured Secant Stiffness— S30MI .......................................................................90
Figure 3.38 Measured Secant Stiffness— S20HI .......................................................................90
Figure 3.39 Measured Secant Stiffness— S20HIN .....................................................................91
Figure 3.40 Measured Secant Stiffness— S30XI ........................................................................91
Figure 3.41 Actual and Elastic-Perfectly-Plastic Load-Displacement Responses ......................92
Figure 3.42 Total Energy Dissipated by Actual and EPP Columns ............................................93
Figure 3.43 Normalized Energy Dissipation ..............................................................................94
Figure 3.44 S10MI Base Moment-Total Rotation along Lap-Splice Length .............................95
Figure 3.45 S20MI Base Moment-Total Rotation along Lap-Splice Length ..............................95
Figure 3.46 S30MI Base Moment-Total Rotation along Lap-Splice Length ..............................96
Figure 3.47 S20HI Base Moment-Total Rotation along Lap-Splice Length ..............................96
Figure 3.48 S20HIN Base Moment-Total Rotation along Lap-Splice Length ............................97
Figure 3.49 S30XI Base Moment-Total Rotation along Lap-Splice Length ................................97
Figure 3.50 S10MI Base Moment-Slip Rotation along Lap-Splice Length ...............................98
x
Figure 3.51 S20MI Base Moment-Slip Rotation along Lap-Splice Length ................................98
Figure 3.52 S30MI Base Moment-Slip Rotation along Lap-Splice Length ...............................99
Figure 3.53 S20HI Base Moment-Slip Rotation along Lap-Splice Length.................................99
Figure 3.54 S20HIN Base Moment-Slip Rotation along Lap-Splice Length ...........................100
Figure 3.55 S30XI Base Moment-Slip Rotation along Lap-Splice Length...............................100
Figure 3.56 S10MI Moment-Rotation Envelopes ....................................................................101
Figure 3.57 S20MI Moment-Rotation Envelopes .....................................................................101
Figure 3.58 S30MI Moment-Rotation Envelopes .....................................................................102
Figure 3.59 S20HI Moment-Rotation Envelopes ......................................................................102
Figure 3.60 S20HIN Moment-Rotation Envelopes ...................................................................103
Figure 3.61 S30XI Moment-Rotation Envelopes ......................................................................103
Figure 3.62 Expected Strain Distribution along Splice Length.................................................104
Figure 3.63 S10MI Strain Distribution along Splice Length—Exterior (NW) Bar ..................105
Figure 3.64 S10MI Strain Distribution along Splice Length—Interior (W) Bar .....................105
Figure 3.65 S20MI Strain Distribution along Splice Length—Exterior (NW) Bar ..................106
Figure 3.66 S20MI Strain Distribution along Splice Length—Interior (W) Bar .....................106
Figure 3.67 S30MI Strain Distribution along Splice Length—Exterior (NW) Bar ..................107
Figure 3.68 S30MI Strain Distribution along Splice Length—Interior (W) Bar .....................107
Figure 3.69 S20HI Strain Bar Distribution along Splice Length—Exterior (NE) Bar..............108
Figure 3.70 S20HI Strain Distribution along Splice Length—Interior (W) Bar .......................108
Figure 3.71 S20HIN Strain Distribution along Splice Length—Exterior (NW) Bar ................109
Figure 3.72 S20HIN Strain Distribution along Splice Length—Interior (W) Bar ...................109
Figure 3.73 S30XI Strain Distribution along Splice Length—Exterior (NW) Bar ..................110
Figure 3.74 S30XI Strain Distribution along Splice Length—Interior (W) Bar .....................110
Figure 3.75 Bilinear Steel Stress-Strain Model .........................................................................111
Figure 3.76 S10MI Bond Stress-Lateral Drift (Bar NW) ..........................................................112
Figure 3.77 S10MI Bond Stress-Lateral Drift (Bar W) .............................................................112
Figure 3.78 S20MI Bond Stress-Lateral Drift (Bar NW) ..........................................................113
Figure 3.79 S20MI Bond Stress-Lateral Drift (Bar W) .............................................................113
Figure 3.80 S30MI Bond Stress-Lateral Drift (Bar NW) ..........................................................114
Figure 3.81 S30MI Bond Stress-Lateral Drift (Bar W) ............................................................114
xi
Figure 3.82 S20HI Bond Stress-Lateral Drift (Bar NE) ............................................................115
Figure 3.83 S20HI Bond Stress-Lateral Drift (Bar W)..............................................................115
Figure 3.84 S20HIN Bond Stress-Lateral Drift (Bar NW)........................................................116
Figure 3.85 S20HIN Bond Stress-Lateral Drift (Bar W)...........................................................116
Figure 3.86 S30XI Bond Stress-Lateral Drift (Bar NW)...........................................................117
Figure 3.87 S30XI Bond Stress-Lateral Drift (Bar W)..............................................................117
Figure 3.88 S10MI Normalized Average Bond Stress-Lateral Drift.........................................118
Figure 3.89 S20MI Normalized Average Bond Stress-Lateral Drift.........................................118
Figure 3.90 S30MI Normalized Average Bond Stress-Lateral Drift.........................................119
Figure 3.91 S20HI Normalized Average Bond Stress-Lateral Drift ........................................119
Figure 3.92 S20HIN Normalized Average Bond Stress-Lateral Drift.......................................120
Figure 3.93 S30XI Normalized Average Bond Stress-Lateral Drift .........................................120
Figure 3.94 'cfu Comparison of Cyclic Column and Monotonic Beam Tests ....................122
Figure 3.95 Normalized Bond Stress vs. cmin/db ........................................................................122
Figure 3.96 Shear Deformation Measurement (S10MI, S20MI, and S30MI)...........................123
Figure 3.97 S10MI Shear Deformation along Splice Length (20db) .........................................123
Figure 3.98 S20MI Shear Deformation along Splice Length (20db) .........................................124
Figure 3.99 S30MI Shear Deformation along Splice Length (20db) .........................................124
Figure 3.100 Shear Deformation Measurement (S20HI, S20HIN, and S30XI) .........................125
Figure 3.101 S20HI Shear Deformation along Splice Length (20db) .........................................126
Figure 3.102 S20HIN Shear Deformation along Splice Length (20db) ......................................127
Figure 3.103 S30XI Shear Deformation along Splice Length (20db) .........................................128
xiii
LIST OF TABLES
Table 1.1 Test Matrix (Lynn et al., 1996)...................................................................................43
Table 2.1 Test Matrix..................................................................................................................46
Table 2.2 Calculated Shear Strengths .........................................................................................46
Table 2.3 Concrete Mix Design..................................................................................................46
Table 2.4 Aggregate Gradation (with Vulcan Materials, San Gabriel Valley (Reliance)
Aggregates).................................................................................................................47
Table 2.5 Concrete Properties.....................................................................................................47
Table 2.6 Reinforcement Bar Properties.....................................................................................47
Table 2.7 Potentiometer Coordinates..........................................................................................61
Table 2.8 Data Point Numbers (S10MI, S20MI, S30MI, S20HI, S30XI)..................................66
Table 2.9 Data Point Numbers (S20HIN)...................................................................................66
Table 3.1 Test Results Summary ................................................................................................67
Table 3.2 Observed Damage.......................................................................................................67
Table 3.3 Axial Load Capacity Loss ..........................................................................................67
Table 3.4 Moment Capacities .....................................................................................................87
Table 3.5 Beam Tests Results...................................................................................................121

xv
NOMENCLATURE (Partial list: Additional variables used locally in text)
α = Reinforcement Location Factor γ = Reinforcement Size Factor β = Coating Factor λ = Lightweight Aggregate Concrete Factor ∆y = Yield displacement Ag = Gross Cross-Sectional Area As = Area of Nonprestressed Tension Reinforcement bw = Column Width c = Spacing or Cover Dimension d = Effective Depth of The Column db = Nominal Diameter of Reinforcing Bar f`c = Concrete Compressive Strength fct = Concrete Split-Tension Strength fr = Concrete Rupture Strength fy = Steel Yield Stress h = Column Height Ktr = Transverse Reinforcement Index ls = Splice Length My = Yield Moment Mn = Nominal Moment Strength Vc = Concrete Shear-Strength Vn = Nominal Shear-Strength Vs = Steel Shear-Strength Vu = Ultimate Shear
1 Introduction
1.1 GENERAL
Splices of column longitudinal reinforcement in older buildings (e.g., pre-1973) were commonly
designed for compression only with relatively light transverse reinforcement enclosing the lap.
For example, compression lap lengths of 20 longitudinal bar diameters are commonly found in
older buildings, such as those designed with the 1956 and 1963 ACI codes. Under earthquake
actions, a column may develop significant moments subjecting the longitudinal reinforcement to
tensile stresses, particularly if the splice is located just above the floor slab, which is common in
older construction. Given that required lap lengths for tension substantially exceed those required
for compression, slip may occur along the splice length at load levels less than required to reach
the nominal moment capacity of the column. The load-deformation responses of columns with
splices that are representative of those found in older buildings are not well understood, and in
particular, the degradation of strength and stiffness and the ability of the column to resist axial
load after loss of lateral load capacity are of interest.
Splices of column longitudinal reinforcement for moment frames in new buildings (e.g.,
designed according to ACI 318-02 provisions) are required to be located within the middle third
of the column, encased within closely spaced transverse reinforcement, and to develop the yield
stress of the bar in tension. Deformation compatibility requirements often govern the design of
splices for columns not designed to be part of the lateral-force-resisting system (UBC-94,
Section 1631.2.4, and UBC-97, Section 1633.2.4). More stringent requirements for transverse
reinforcement for these nonparticipating columns were incorporated within ACI 318-95, and
subsequently into UBC-97, following damage observed in the 1994 Northridge earthquake. The
need for these new provisions indicates that substandard lap-splice (and shear reinforcement)
details exist even in relatively recent building construction (e.g., pre-1995).

2
Relatively little research has been conducted on the behavior of columns with deficient
lap splices. Early work focused primarily on developing rehabilitation options for splices.
Testing was conducted on columns subjected to pure tension (Valluvan et al., 1993) and columns
subjected to uniaxial bending with no superimposed axial load (Aboutaha et al., 1996).
Rehabilitation measures studied included the addition of external and internal ties, as well as the
use of jackets (e.g., steel angles with straps or steel-plate jackets with and without through-bolts).
For most rehabilitation options, brittle splice failures were suppressed and substantial inelastic
(flexural) deformations were observed prior to the loss of lateral load capacity. Improving splice
behavior is sometimes referred to as a “local” rehabilitation strategy, as the local capacities
(strength, stiffness, ductility) of the element are improved.
For many older buildings, deficient column splices are likely to exist in a majority of
building columns at many locations over the height of a building. Although rehabilitation of
these columns is possible, as noted above, the rehabilitation methods typically result in
substantial disruption to building functions and possibly even displacement of the occupants;
therefore, it may not be economical or practical to rehabilitate column splices in buildings. To
address these issues, rehabilitation options that minimize the impact on the occupants and
building operations are desirable. A common strategy employed is to limit the drift imposed on
the deficient columns by adding braces, shear walls, or a protective system (e.g., isolators,
dampers) to the building such that the lateral deformations of the building are reduced to an
acceptable level. By limiting the lateral building deformations, the forces imposed on the column
splices are limited such that the spliced reinforcement is not subjected to significant tension.
Rehabilitation guidelines (“Guidelines,” 1997) have been developed in recent years that are used
by the engineering profession to accomplish this task (albeit, with unknown reliability). This
rehabilitation strategy is sometimes referred to as a “global” rehabilitation strategy, as the goal is
commonly to limit roof drift (a global response parameter) such that local responses (e.g.,
column moments, shears, and plastic rotations) meet specified acceptance criteria.
Although the “global” rehabilitation strategy is well accepted and the guidelines exist to
assist in implementing the selected strategy, very sparse data exist on the performance of
columns with “deficient” lap splices. This lack of knowledge on how the lateral-load behavior of
column splices is influenced by important parameters such as axial load, shear, and load history
leads to considerable uncertainty, and conservative and costly rehabilitation measures.
3
1.2 OBSERVATIONS FROM EARTHQUAKE DAMAGE
Brief summaries of splice damage observed in the 1994 Northridge, 1999 Izmit, and 1999 Chi-
Chi, earthquakes are provided to identify common damage patterns associated with splices as
well as to establish important performance issues.
Following the Northridge earthquake, shear and splice failures in reinforced concrete
columns were commonly observed in older buildings and in building columns designed as
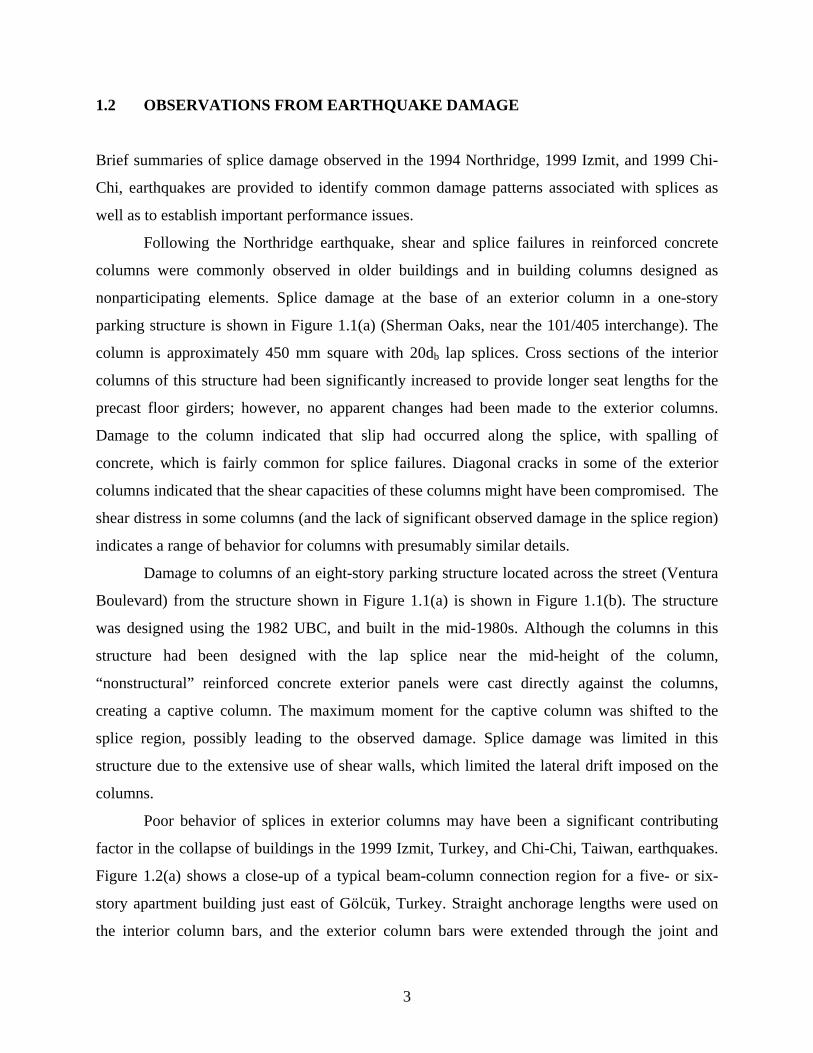
nonparticipating elements. Splice damage at the base of an exterior column in a one-story
parking structure is shown in Figure 1.1(a) (Sherman Oaks, near the 101/405 interchange). The
column is approximately 450 mm square with 20db lap splices. Cross sections of the interior
columns of this structure had been significantly increased to provide longer seat lengths for the
precast floor girders; however, no apparent changes had been made to the exterior columns.
Damage to the column indicated that slip had occurred along the splice, with spalling of
concrete, which is fairly common for splice failures. Diagonal cracks in some of the exterior
columns indicated that the shear capacities of these columns might have been compromised. The
shear distress in some columns (and the lack of significant observed damage in the splice region)
indicates a range of behavior for columns with presumably similar details.
Damage to columns of an eight-story parking structure located across the street (Ventura
Boulevard) from the structure shown in Figure 1.1(a) is shown in Figure 1.1(b). The structure
was designed using the 1982 UBC, and built in the mid-1980s. Although the columns in this
structure had been designed with the lap splice near the mid-height of the column,
“nonstructural” reinforced concrete exterior panels were cast directly against the columns,
creating a captive column. The maximum moment for the captive column was shifted to the
splice region, possibly leading to the observed damage. Splice damage was limited in this
structure due to the extensive use of shear walls, which limited the lateral drift imposed on the
columns.
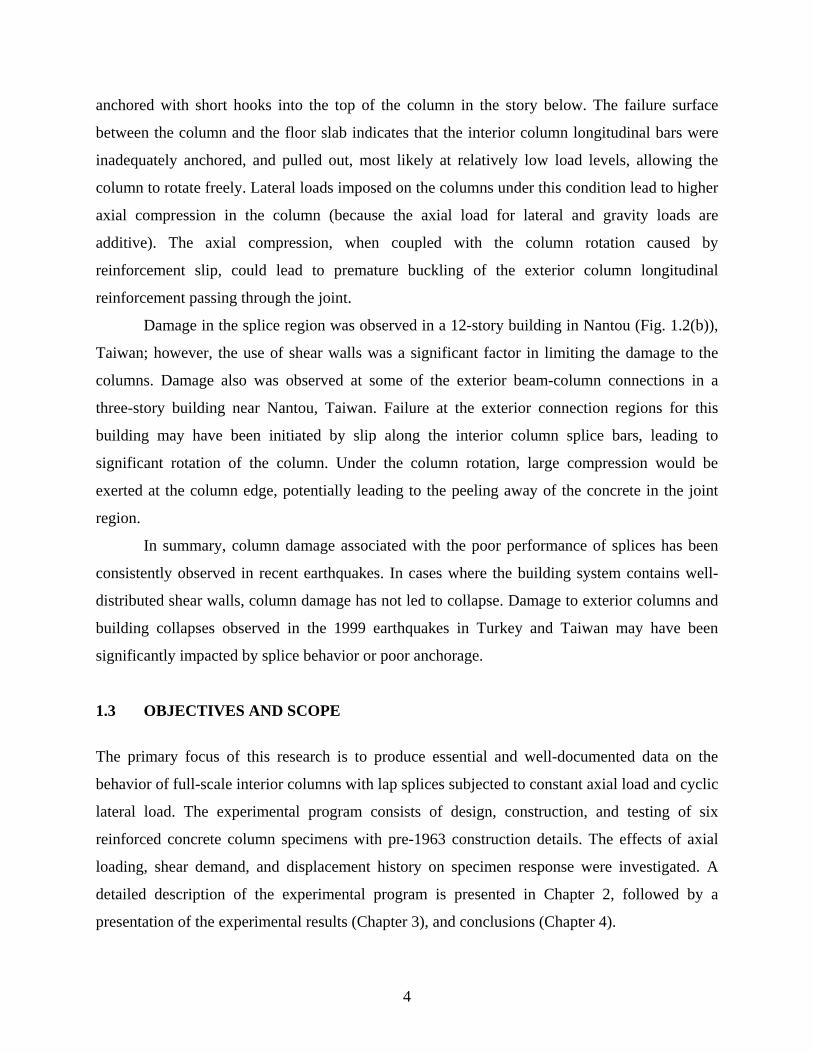
Poor behavior of splices in exterior columns may have been a significant contributing
factor in the collapse of buildings in the 1999 Izmit, Turkey, and Chi-Chi, Taiwan, earthquakes.
Figure 1.2(a) shows a close-up of a typical beam-column connection region for a five- or six-
story apartment building just east of Gölcük, Turkey. Straight anchorage lengths were used on
the interior column bars, and the exterior column bars were extended through the joint and
4
anchored with short hooks into the top of the column in the story below. The failure surface
between the column and the floor slab indicates that the interior column longitudinal bars were
inadequately anchored, and pulled out, most likely at relatively low load levels, allowing the
column to rotate freely. Lateral loads imposed on the columns under this condition lead to higher
axial compression in the column (because the axial load for lateral and gravity loads are
additive). The axial compression, when coupled with the column rotation caused by
reinforcement slip, could lead to premature buckling of the exterior column longitudinal
reinforcement passing through the joint.
Damage in the splice region was observed in a 12-story building in Nantou (Fig. 1.2(b)),
Taiwan; however, the use of shear walls was a significant factor in limiting the damage to the
columns. Damage also was observed at some of the exterior beam-column connections in a
three-story building near Nantou, Taiwan. Failure at the exterior connection regions for this
building may have been initiated by slip along the interior column splice bars, leading to
significant rotation of the column. Under the column rotation, large compression would be
exerted at the column edge, potentially leading to the peeling away of the concrete in the joint
region.
In summary, column damage associated with the poor performance of splices has been
consistently observed in recent earthquakes. In cases where the building system contains well-
distributed shear walls, column damage has not led to collapse. Damage to exterior columns and
building collapses observed in the 1999 earthquakes in Turkey and Taiwan may have been
significantly impacted by splice behavior or poor anchorage.
1.3 OBJECTIVES AND SCOPE
The primary focus of this research is to produce essential and well-documented data on the
behavior of full-scale interior columns with lap splices subjected to constant axial load and cyclic
lateral load. The experimental program consists of design, construction, and testing of six
reinforced concrete column specimens with pre-1963 construction details. The effects of axial
loading, shear demand, and displacement history on specimen response were investigated. A
detailed description of the experimental program is presented in Chapter 2, followed by a
presentation of the experimental results (Chapter 3), and conclusions (Chapter 4).
5
1.4 RELATED RESEARCH
Studies of the behavior of lap splices subjected to cyclic loads date from the 1970s, with initial
efforts focused on determining development length requirements for code provisions.
Studies by Orangun et al. (1977) and Sozen and Moehle (1990) summarized experimental
results from beams with lap splices and formulated equations to improve existing code
provisions for development and recommended splice lengths for deformed bars in tension. These
studies revealed that development length and splice length could be evaluated in terms of steel
stress, concrete strength, bar diameter, concrete cover, and transverse reinforcement
(confinement). Based on these studies, new code provisions were introduced into the 1989 and
1995 ACI Building Codes (“Building,” 1989; 1995).
Additional work has been conducted to evaluate the response of lap splices in members
subjected to earthquake induced cyclic loads, as well as techniques to improve the performance
of inadequate lap splices. Several of these studies are summarized in the paragraphs that follow.
Research by Paulay et al. (1981) revealed the importance of confinement on the
performance of members with lap splices. Twelve specimens with either 406.4 mm x 304.8 mm
(16 in. x 12 in.) or 406.4 mm (16 in.) square cross sections with inadequate lap splice length (ls
provided/ls required = 0.82 to 0.95) were tested. Although inadequate splice lengths were provided,
well-confined splices were able to develop the tensile yield stress of the reinforcement and
maintain their lateral load capacity up to a displacement ductility of four. It was concluded that
increasing the splice length did not have a significant effect on the lateral strength; however,
closely spaced transverse reinforcement substantially improved the cyclic response of the lap
splice by preventing splitting of concrete and maintaining the shear transfer along the splice. The
beneficial effect of confinement on the behavior of members with lap splices directed researchers
to investigate increasing confinement as a rehabilitation measure to improve splice performance.
Several different methods of providing improved confinement to deficient splices were
evaluated.
Two studies were conducted that focused on confining the splice region by using steel
jackets. Chai et al. (1991) investigated the performance of circular bridge columns with pre-1971
construction details under constant axial and cyclic lateral loading, whereas Aboutaha et al.
(1996) investigated the use of steel jackets on building columns with square and rectangular
6
cross sections. No axial load was applied to the columns in both of these test programs. Both sets
of experiments revealed that reference specimens, with 20 bar diameter lap-splice lengths,
experienced bond deterioration prior to reaching the nominal moment capacity at the critical
section. An evaluation of the test results produced by Aboutaha (Fig. 1.3) and Chai (Fig. 1.4)
indicates that using a steel jacket is an effective method for improving the cyclic response of the
columns with compression lap splices. Even damaged specimens, once repaired with steel
jackets, showed ductile behavior (Chai, 1991). Aboutaha concluded that rehabilitation of splices
in members with rectangular cross sections required the steel jacket to be longer than the splice
length and adhesive anchor bolts on each face of the column.
Valluvan et al. (1993) constructed and tested twelve, approximately two-thirds scale
column specimens to investigate various rehabilitation measures. The test columns were 482.6
mm (19 in.) square and reinforced with 28.7 mm (#9) longitudinal bars and 9.5 mm (#3) hoops
spaced 457.2 mm (18 in.) on center (Fig. 1.5). The specimens were subjected to reversed, cyclic
axial loads (no bending). A reference specimen (no rehabilitation) was tested, and several
approaches for providing confinement along the spice length were investigated, including the use
of (1) steel angles and straps, (2) internal or external ties, or (3) welds along the spliced bars.
The reference (no rehabilitation) specimen exhibited poor behavior under cyclic loading, with a
sudden loss in the lateral load capacity at approximately two thirds the nominal moment capacity
of the critical section (Fig. 1.6). The use of external steel angles and straps or ties were effective
in improving splice performance, provided grout was used to achieve good contact between the
existing concrete and the added confinement steel. Welding splices worked well provided
additional ties were used to resist outward thrust produced by the eccentricity between the
spliced bars. The use of internal ties was less effective, apparently because the removal of
concrete cover to place the ties resulted in concrete micro-cracking that reduced the bond
strength.
Coffman et al. (1993) also investigated the effectiveness of using external ties as a
rehabilitation measure on bridge columns with 35db lap-splice lengths. Four, one-half scale,
circular reinforced concrete columns with construction details representative of those used in the
1950s through the mid-1970s were tested. The splice regions of the specimens were confined
with prestressed external hoops along the lower 1219.2 mm (4 ft) of the column. The size and
spacing of the external hoops were varied to establish the effectiveness of adding prestressed
7
hoops. Columns were subjected to cyclic lateral and constant axial load (0.10Agf’c). The control
specimen, with a 35db lap-splice length, was able to maintain the lateral load capacity up to a
displacement ductility of four (Fig. 1.7) and reinforcing strains of five times the yield strain. The
response of specimens rehabilitated with prestressed hoops indicated that the external hoops did
not increase the lateral strength of specimens appreciably; however, the energy-dissipation
capacity at each cycle was improved and the displacement ductility capacity increased (i.e., the
lateral load capacity was maintained for an increased number of cycles to higher drift ratios).
Lynn (1996) investigated columns with pre-1970s construction details (Fig. 1.8). Eight,
457.2 mm (18 in.) square columns with eight longitudinal reinforcing bars and 9.525 mm (#3)
hoops/ties at either 304.8 mm (12 in.) or 457.2 mm (18 in.) spacing on center were constructed.
Longitudinal reinforcement consisted of either 25.4 mm (#8) or 32.3 mm (#10) diameter bars.
Five specimens had continuous longitudinal reinforcement, whereas three specimens were
provided with splices (20db and 25db) at the bases of the columns. Table 1.1 presents a summary
of the test variables.
The specimens were subjected to reversed cyclic lateral displacements while the axial
stress was held constant for the duration of the test at either 0.12f’c or 0.35f’c. The applied lateral
displacement history was a function of calculated yield displacement (∆y), with three cycles with
peak displacement of 0.25∆y and 0.5∆y, followed by cycles with peak displacement levels of ∆y,
2∆y, and 3∆y, until the lateral load capacity of the specimens degraded substantially.
Lateral load, top displacement response of specimens tested by Lynn are shown in Figure
1.9. All specimens exhibited lateral strength degradation due to shear failure. Specimens with
low axial load and steel ratio (2CLH18 and 2SLH18) showed fairly ductile response
(displacement ductility of 4.2 and 3.5, respectively) compared with other specimens. Although
the yield stress was reached in the spliced bars, cracks along the lap splice led to strength
degradation and eventually shear failure (just above the splice) in the specimens with low axial
stress (2SLH18 and 3SLH18). For the specimens with high axial stress, abrupt shear failures
were observed for columns with and without the lap splices, shortly after reaching the bar yield
stress in tension; therefore, the splice did not substantially influence the observed behavior.
Specimens with abrupt shear failure lost axial load-carrying capacity just after the
degradation of lateral strength. Specimens that displayed moderately ductile behavior after
flexural yielding were able to maintain axial loads for larger displacement levels.
8
The experimental studies briefly summarized herein mainly focus on rehabilitation
measures used for columns with inadequate lap-splice lengths. These tests were beneficial for the
evaluation of local retrofitting methods. Among the rehabilitation options explored, adding
external ties/hoops or using steel jackets were the most effective in improving the behavior of
columns with deficient lap splices.
However, for “global” rehabilitation strategies, it is important to understand the force
versus deformation behavior of columns with short splice lengths to allow for design of reliable
and economical rehabilitation measures. Available information is limited, with the tests
conducted by Lynn et al. (1996) providing the bulk of the information. In general, columns with
inadequate splice lengths display little energy-dissipation capacity, and in some cases, do not
reach the nominal flexural strength at the critical section.
The research presented in the following chapters focused on addressing this gap in
information by conducting experimental studies on columns with short tension splice lengths
subjected to reverse cyclic lateral loads. This report focuses on describing the experimental
program (Chapter 2) and the experimental results (Chapter 3). Findings from the experimental
study are presented in Chapter 4.
2 Description of Experimental Program
2.1 SPECIMENS
Six reinforced concrete column specimens with pre-1960s construction details are tested. The
test specimens consist of a cantilever column with a foundation block attached to a strong floor
(Fig. 2.1). The specimens represent a building column from column mid-height between floors to
the column-joint interface for an interior column. The column cross section is 18 in. (457 mm)
square with 8 - #8 (db = 1.0 in.; 25.4 mm) longitudinal reinforcing bars and #3 (db = 0.375 in.;
9.53 mm) ties @ 12 in. (304.8 mm) spacing with 90° hooks. The column cross-section and
reinforcement details are the same as in the UC Berkeley test program (Lynn et al., 1996). The
column height is selected to ensure that the shear strength of the columns (using ACI 318-99 Eq.
11-4 and 11-15) are sufficient to develop the lateral load required to reach the nominal moment
capacity at the base of each column, where a lap splice is located. A lap splice length of 20db is
used based on the requirements for compression splices in older buildings.
Table 2.1 provides an overview of the primary variables of the test program, which
include (1) axial load (0.1, 0.2 and 0.3Agf’c), shear (low, moderate, and high levels), and lateral
load history. The required development lengths according to ACI 318-99 (12-1) for the actual
material properties are calculated as 793.5 mm (31.2 in.), or 31db for the splice length used
(20db); the splice was expected to deteriorate when the column moment reached approximately
60% to 70% of the nominal moment capacity.
⎟⎟⎠
⎞⎜⎜⎝
⎛ +′=
b
trc
y
b
d
dKcf
fdl αβγλ
403 ACI 318-99 (12-1) (2-1)
The first three specimens (S10MI, S20MI, and S30MI) were tested using a standard
cyclic lateral load history with the axial load held constant for the duration of the tests at 0.1, 0.2,

10
and 0.3Agf’c, respectively. The objective of this test series is to assess the influence of axial load
on lap splices with low shear stress and light transverse reinforcement.
The second series of three specimens are companions to the first three, and are tested to
assess the importance of shear and load history on splice behavior. Two specimens (S20HI and
S20HIN) are tested with a moderate shear stress level and axial load (0.20Agf’c). A near-fault
displacement history is applied to specimen S20HIN to evaluate the effect of loading history on
splice performance. The last specimen (S30XI) is subjected to a standard displacement history
with high shear stress level and axial load. The shear stress level at the initiation of splice
deterioration was increased by decreasing the column height from 1828.9 mm (6 ft.) to 1676.6
mm (5 ft. 6 in.) for specimens S20HI and S20HIN, and 1524 mm (5 ft.) for S30XI.
The specimen identification (ID) labels define the level of the applied axial load, the
shear demand level at the lateral load expected to result in splice deterioration, and the applied
lateral displacement history. For example, label S20HIN corresponds to S = Spliced; 20 =
0.20Agf’c; H = High Shear Demand; I = Interior Column; N = Near-Fault Lateral Displacement
History.
As mentioned, column heights are selected to ensure that specific levels of shear demand
would be present when bond deterioration was expected to initiate. The fifth column of Table 2.1
shows the ratio of shear demand when lateral strength degradation was expected to initiate,
divided by the calculated nominal shear strength. Nominal shear strength of specimens is
calculated using equations 2.2 and 2.3 for actual material properties.
dbfA
NV wcg
uc ⋅⋅⋅⎟
⎟⎠
⎞⎜⎜⎝
⎛
⋅+⋅= '
200012 ACI 318-99 (11-4) (2-2)
sdfA
V yvs
⋅⋅= ACI 318-99 (11-15) (2-3)
2.2 MATERIALS
Normal weight, 24.1 MPa (3500 psi) concrete, with maximum aggregate size of 25.4 mm (1.0
in.) was used to construct the columns. The mix design and aggregate gradation are given in
Tables 2.3 and 2.4, respectively. A retardant was added to the mix to allow more time for
placement and finishing. After placement, the concrete was covered with burlap and kept moist
11
for 10 days. Test cylinders (152.4 mm x 304.8 mm; 6 in. x 12 in.) were made following ASTM
Specification C31/C31M-00e1.
Standard compressive strength tests (ASTM C31-39) on 152.4 mm x 304.8 mm (6 in. x
12 in.) cylinders were done 7 and 28 days after concrete placement. In addition, stress-strain
relations were also obtained at the test dates (Fig. 2.2). Concrete stress-strain diagrams are given
in Figures 2.3 and 2.4. Split cylinder tests (ASTM C496) were also conducted. The concrete
mechanical properties are presented in Table 2.5 where concrete rupture strength is calculated
using equation 2.4.
'5.7 cr ff ⋅= ACI 318-99 (9-9) (2-4)
Longitudinal and transverse reinforcement are deformed ASTM A 615 Grade 60. Three
different batches of longitudinal reinforcement bars are used. ASTM A307 tensile strength tests
were performed on reinforcement bar samples to obtain the mechanical properties (yield and
fracture strength, Table 2.6).
2.3 CONSTRUCTION OF SPECIMENS
Two sets of three column specimens were fabricated in the UCLA Structural Engineering
Laboratory. Three forms were constructed for the first set of specimens using 2x4’s and ½ in.
thick plywood. These forms were dismantled after concrete placement and used for the second
set of specimens. For convenience, all specimens were constructed in a horizontal position.
Reinforcement cages for the foundation blocks (or pedestals) were fabricated first.
Column pedestals are reinforced with 6 - #8 (db = 1.0 in.; 25.4 mm) top and bottom longitudinal
reinforcing bars. Shear reinforcement consists of a #3 hoop and two #3 ties (db = 0.375 in.; 9.53
mm) spaced at 203.2 mm (8 in.) on center. Pedestal reinforcement details are shown in Figure
2.5. Reinforcement used was provided by C&M Steel, located in Fontana, California. Finished
pedestal cages were placed in the forms using a crane.
Reinforcement for the column was cut and bent, and then strain gauges were affixed to
the column longitudinal bars and column hoops. A diagram of a completed reinforcing cage is
shown in Figure 2.6. The complete cages were lifted using a crane and placed in the formwork,
which was oiled to ease stripping of the formwork. Before placing concrete, PVC pipes were
12
arranged within the forms (Fig. 2.7) to allow for affixing the specimen to the strong floor, as well
as to provide a duct for running strain gauge wires. Details of the splice and the strain gauge
wires are shown in Figures 2.8 and 2.9. Figures 2.10 and 2.11 show the starter bars extending out
of the pedestal that are spliced with the column longitudinal bars.
Concrete was provided by a local supplier, Catalina Pacific. Concrete for all three
specimens was placed from one truck within approximately 30 minutes. After final finishing, the
concrete was covered with burlap and plastic sheets and kept moist. The forms were removed
after 2 weeks. The 152.4 x 304.8 mm (6 in. x 12 in.) test cylinders were cured adjacent to the
specimens under the same conditions.
The specimens were lifted and moved into position for testing using a crane. Tie-down
rods were placed through the PVC pipes and threaded into the strong floor to anchor the base of
the specimen. A thin layer of grout was placed between the pedestal and strong floor to ensure
that the specimens were level for testing. The axial load assembly at the top of the column
(described below) and the 12.7 mm (½ in.) plates under the tie-down nuts were also grouted.
2.4 TESTING APPARATUS
The test setup is shown in Figures 2.12 through 2.14. The lateral load is applied with a 556 kN
(125 kip) ATLAS hydraulic actuator with 609.6 mm (24 in.) stroke. The actuator is bolted to the
column specimen at one end and to a steel reaction frame at the other end using rod eye-clevis
bracket connections that allow free rotation in the vertical plane of the actuator (Fig. 2.11). An
MTS 407 controller connected to a hydraulic power supply is used to control the actuator load
and displacement. A schematic of the control system is given in Figure 2.15.
The axial load on each specimen is held constant for the duration of the applied lateral
displacement history. The axial load assembly consists of two, 889.6 kN (200 kip) Enerpac
RCH-1003 hollow plunge cylinders, two 46 mm (1 ¾ in.) diameter Dywidag Threadbar®
Prestressing steel rods (Grade 150), two MC 18x51.9 A 572 (Grade 50) steel channels, and two
76.2 mm (3 in.) thick steel plate assemblies. The connection at the top of the column to the axial
load assembly was established using 15.9 mm (5/8 in.) diameter J-bolts that were anchored in the
concrete at the top of the column. The specimens are subjected to axial load by placing the 46
mm (1.75 in.) diameter Dywidag rods in tension. The Dywidag rod is anchored to a 76.2 mm (3

13
in.) plate which is anchored to the strong floor with four 31.8 mm (1.25 in.) diameter, threaded,
high-strength steel tie-down rods. A hand pump with a reservoir was used to pressure the
Enerpac cylinders. The applied axial load was monitored from pressure dial gauges connected to
the Enerpac hydraulic cylinders. Pressure-force calibration of the dial gauges was done prior to
testing. During testing, the hydraulic pressure was continuously monitored and adjusted to
maintain the desired level of constant axial load.
2.5 INSTRUMENTATION AND DATA ACQUISITION
Different types of instrumentation were used to monitor the applied lateral load and
displacement, strain of longitudinal and transverse reinforcement, flexural and shear
deformations of the column, and pedestal translation and rotation.
For each specimen, reinforcing bar strains were measured using 27 longitudinal and 6
transverse reinforcement strain gauges, as shown in Figure 2.16. Two types of Vishay
Measurements Group, Inc., strain gauges (EP-08-250BG-120 and EA-06-125BT-120) were used,
both with a 5% strain limit. These strain gauges are commonly used for post-yield static testing.
In order to place strain gauges, reinforcement bars were filed and then the steel surface was
prepared with chemicals. Strain gauges were attached to the prepared steel surface with M-Bond
200 adhesive which allows up to 3% elongation. Finally, M-Coat W1 and M-Coat J were applied
on the strain gauges for water and abrasion protection, respectively. Belden 8451c U1000 black
cable was used to connect strain gauges to the data acquisition system.
The strain gauge-labeling scheme is given in Figure 2.17. Strain gauges are named
according to the type of the reinforcement bar: L= Longitudinal, S=Starter, T=Transverse; height
with respect to the column-pedestal interface in inches; and cross-sectional position. For
example: L12-NW stands for the strain gauge placed on a longitudinal (L) bar 12 inches above
pedestal level (12) at the north-west corner of the cross section (NW).
Column deformations (flexure, shear and lateral displacement) were measured with linear
voltage transducers (+/- 1.5 in.; 38.1 mm). The instrumentation layout was modified slightly
between the first set of three specimens and the second set of three specimens. External
instrumentation for the first set of three specimens (S10MI, S20MI, and S30MI) consisted of 31
linear transducers, 25 on one side of the specimen to form a grid as shown in Figure 2.18. Four
14
transducers were placed on the opposite face of the column to obtain rotational response at the
column base due to flexure and slip (Fig. 2.19). The instrumentation layout was changed for the
second set of specimens, where the number of linear potentiometers used was reduced from 31 to
18. Of the 18 linear potentiometers, six pairs were utilized to measure the flexural response
(average curvature) of the specimen over the column height (Fig. 2.20). The measurement of
shear distortions was made possible by using four wire potentiometers (Fig. 2.21) that were
placed diagonally on the opposite face of the column. Two additional transducers were placed on
two ends of the pedestal base to monitor any rotation of the foundation system. The external
instrumentation layout and the labeling scheme are given in Figures 2.22 and 2.23, respectively.
Potentiometers are connected to the reinforced concrete column with 6.35 mm (¼”) diameter
fine threaded rods which were placed prior to concrete placement. Locations of the threaded rods
are given in Table 2.7. All transducers were calibrated prior to testing.
The lateral load was measured using a 667 kN (150 kip) Lebow load cell. The column top
lateral displacement was monitored using a MTS Temposonic transducer (+/- 12 in.; +/- 304.8
mm) mounted on the cylinder. In addition, a Celesco wire potentiometer (+/- 20 in.; +/- 508 mm)
was mounted between the specimen and a rigid external reference frame to measure the lateral
displacement at the point of lateral load application (top displacement). Besides top
displacement, mid-height and pedestal lateral displacements were measured relative to the rigid
reference frame using wire potentiometers (Fig. 2.24).
A National Instruments PCI 6052E card connected to a NI SCXI 1001 chassis was used
for data acquisition (Fig. 2.25). The SCXI 1001 chassis has ten slots for analog or digital input
modules. Eight of these slots were filled with SCXI 1121 four-channel isolated universal
transducer modules, and the remaining two were occupied by SCXI 1100 32-channel differential
multiplexer/amplifiers. A schematic of the data acquisition system is given in Figure 2.26.
Strain gauges were excited with an input voltage and the obtained output was amplified
using strain gauge amplifiers manufactured at UCLA (Fig, 2.27). Each amplifier card can excite
and amplify one strain gauge channel. For each channel, proper gain was selected depending on
the strain limit expected, and the bridge voltage was set to 4 Volts. Each strain gauge channel
was adjusted to zero before the application of the axial load.
The output voltage was transmitted from the amplifiers to the SCXI 1100 analog input
module, and then to the PCI 6052E data acquisition card where the voltage was recorded.
15
Amplified voltage outputs from the strain gauges are in the range of 0 to 10 volts. Data
acquisition software scales the voltage to strain before it is recorded. The relation between
voltage and strain is given as:
AkVV
bridge
out
⋅⋅⋅
=4
ε (2-5)
where Vbridge is set to 4 Volts, k is the strain gauge factor provided by the gauge manufacturer,
and A is the gain provided by the amplifier.
Linear voltage transducers (potentiometers) do not require amplifiers; however, they need
to be excited with an input voltage. For a given input voltage of Vin, the transducer produces an
output of zero Volts for the closed position and Vin volts for full stroke (3 in.; 76.2 mm for the
transducers used in this experiment). Four potentiometers were connected to each SCXI 1121
modules. The voltage is scaled to inches and recorded. The relationship between displacement
and voltage is given as:
cVout ⋅=δ (2-6)
where c is the calibration factor (in./V).
In order to process the test data more effectively, readings were taken only at specified
load steps. Each cycle consisted of 32 load steps, with eight readings obtained between zero and
the peak displacement (the actuator was stopped and held in position to obtain readings). This
was accomplished by developing a data-logging program in LABVIEW shown in Figure 2.28.
Besides recording the logged data as a spreadsheet, the program also allowed real-time data
visualization for several transducers/gauges and provided a load displacement plot during the
test. Each recording point is labeled as a data point number (DPN). Data point numbers
corresponding to target peak lateral drift levels are given in Tables 2.8 and 2.9.
2.6 TESTING PROCEDURE
The specimens are subjected to constant axial load and cyclic uniaxial bending by the application
of a cyclic displacement at the top of the column. Two different lateral displacement histories are
applied to specimens, a standard history and a near-fault history. The standard displacement
history is fairly typical (Fig. 2.29), and consists of three cycles at each displacement level with
monotonically increasing drift levels (0.1, 0.25, 0.5, 0.75, 1.0, 1.5, 2.0, 3, 5, 7, and 10%).
16
The specimen subjected to the near-fault displacement history is cycled three times at 0.1,
0.25, 0.5 and 1.0% drift levels, followed by one half cycle to 1.5% lateral drift level in one
direction, followed by monotonically increasing drift in the opposite direction until failure is
reached (Fig. 2.30).
One objective of the tests is to apply large displacement amplitudes to assess both the
loss of lateral load capacity and the loss of axial load-carrying capacity. The latter is important in
evaluating life-safety and collapse prevention performance levels. Due to this consideration,
lateral drift cycles were continued after the loss of lateral strength until axial load-carrying
capacity was lost.

3 Experimental Results
Six specimens (Table 2.1) with the same construction details were tested with different levels of
axial load, shear demand, and displacement history. Lateral load versus top displacement,
moment versus base rotation, reinforcement steel strains, and shear distortion responses of the
specimens, either measured directly or derived from the measured data, are presented in this
chapter.
3.1 EXPERIMENTALLY OBSERVED DAMAGE AND BEHAVIOR
Column specimens were subjected to cyclic lateral displacements and constant axial load at three
levels (0.10, 0.20, 0.30Agf’c). Specimen performance was generally poor, with little to no
ductility, for all levels of axial load and shear demand (moderate to high), for both standard and
near-field displacement histories. Lateral strength degradation was observed in all specimens due
to bond deterioration along the splice prior to reaching the calculated yield displacement. Table
3.1 summarizes the test results.
Application of the standard displacement history involved subjected each specimen to
three lateral displacement cycles at each prescribed drift level. As mentioned in Chapter 2,
instead of continuous readings, readings were taken at prescribed points such that 32 readings
were taken during each cycle. The progression of damage for each specimen is documented with
photos and figures, with legends provided to indicate the displacement level and data point. For
ease of reference, Table 2.8 presents the applied peak lateral drift levels and the corresponding
data point numbers.
Although tested under different conditions, the response of the specimens to cyclic

18
loading was similar. Observations of the response of specimens during experiments are presented
in this report.
During testing of specimen S10MI, initial flexural cracks were observed at the column-
pedestal interface right after lateral loading has started. Flexural cracking on the column face
started at a drift ratio of 0.25% (Data point numbers (DPN) 157 and 172 on the west and east
column faces, respectively.) The number of observed flexural cracks increased with the
increasing lateral drift ratios. Flexural cracks observed along the splice length were 114, 229 and
406 mm above the pedestal level. Longitudinal cracking along the splice length began at the third
cycle of 0.75% lateral drift ratio (DPN 361). This first crack was observed at a corner bar as a
vertical hairline crack between the column-pedestal interface and the flexural crack 114 mm
above the pedestal. This initial vertical crack did not appear to propagate during subsequent
cycles at 1.0% and 1.5% drift ratios until a sudden crack extension occurred that coincided with
the peak lateral strength at 1.5% drift. For 1.5% and higher drift ratios, the lateral load strength
diminished, indicating that bond along the spliced bars was deteriorating. The length and width
of the hairline longitudinal cracks along the spliced bars increased for higher drift levels.
Cracking at the column-pedestal interface became more significant as the experiment progressed.
Concrete crushing at 2.0% drift ratio was later followed by the spalling of concrete cover
along the splice length on the east and west sides of the column. Concrete spalling started at the
corners of the column as a sign of bond deterioration between the concrete and the reinforcement
bars. The amount of spalled concrete increased as the lateral drift ratios were increased. At 7%
lateral drift ratio, the spliced longitudinal reinforcement bars were clearly visible, and the end of
the longitudinal columns bars was observed to extend as much as 19 mm upwards from the
pedestal level (DPN 873).
S20MI was the second specimen tested. Flexural cracking on the column face started as
early as the first cycle of 0.25% lateral drift ratio (DPN 105). When the lateral drift ratio reached
to 0.75%, cracks were observed from the pedestal-column interface to a height of 864 mm above
the pedestal (47% of the column height). Similar to specimen S10MI, longitudinal cracks
observed during the first cycles to a peak drift level of 0.75% (DPN 297 pushing east, DPN 313
pulling west) occurred between the column-pedestal interface at the NW and NE corners of the
column and the first flexural crack above the pedestal (approximately 100 mm). During the first
cycle of 1.0% drift level, sudden and substantial crack propagation along the splice length (to a
19
total length of 508 mm) was observed at NE corner of the column (DPN 409). Lateral strength
degradation initiated during the first cycle to 1.0% drift ratio (DPN 409) for the negative (east)
direction and during the first cycle of 1.5% drift ratio (DPN 489) on the positive (west) direction.
At 1.0% lateral drift, when lateral strength degradation initiated, longitudinal cracks were
observed only at the south-west and north-east corners of the specimen. Cracks were narrow and
had lengths of 114 mm on the east face and 514 mm on the west face. After completion of three
cycles of 1.5% lateral drift, longitudinal cracks were present on west and east column faces along
the lap-splice length. Bond deterioration was evident for all the longitudinal bars located on these
two faces of the column. Initial hairline shear (diagonal) cracks were observed during the first
cycle of 0.75% drift level (DPN 313). Additional shear cracks formed during the first cycle to
1.5% lateral drift ratio (DPN 487); however, after lateral strength degradation initiated, no new
diagonal cracks were observed. Concrete crushing and spalling also were observed adjacent to
the column-pedestal interface during the cycle to 1.5% lateral drift ratio (DPN 489). After the
first cycle of 3.0% lateral drift was completed, all concrete cover on the east and west faces had
spalled off over the bottom 127 mm of the column, and the longitudinal bars located at the south-
west corner of the column were clearly visible. Pictures of Specimen S20MI from 0.5% to 7%
drift ratio are presented in Figures 3.4 through 3.10. These pictures efficiently summarize the
damage progress during testing.
Specimen S30MI was subjected to 0.30Agf’c constant axial and cyclic lateral loading.
Flexural cracking initiated during the first cycle to 0.50% drift level (DPN 217). The response of
the specimen to cyclic loading was similar to specimens S10MI and S20MI with low and
moderate axial loading, respectively, except that longitudinal cracks were observed to form
suddenly at 1.5% lateral drift ratio (DPN 489) where lateral strength degradation has observed to
begin (concrete crushing also was observed just above the pedestal). Prior to this, no longitudinal
cracks were observed. Concrete spalling became more significant during the cycle to 2.0%
lateral drift as fairly large sections of concrete cover spalled. During the cycle to 3.0% lateral
drift (DPN 697), concrete cover on the east and west faces was severely damaged along the
splice length. At 5.0% lateral drift, just before the end of the test, all concrete cover was
completely lost along the splice length. Shear cracking was observed at 0.75% lateral drift (DPN
297) but these cracks were not significant throughout the duration of the test.
S20HI was the first specimen tested in the second set of three column specimens.

20
Specimen S20HI is a companion to specimen S20MI, but with higher shear demand (with
decreased column height from 1823 mm to 1676 mm). At the sixth step of the first cycle to
0.25% lateral drift ratio (DPN 103), the first flexural cracks were observed. This coincided with a
change in initial stiffness of the lateral force-displacement plot, which was monitored on a
computer screen during the experiment. At 0.50% lateral drift ratio, flexural cracks became
abundant on the tension column face up to a height of 685 mm above the pedestal (41% of the
column height). Crack widths were very small (<1.5 mm). Longitudinal cracking along the splice
length was first observed during the cycle to 0.75% lateral drift (DPN 313). After three cycles of
1.5% lateral drift were completed, longitudinal cracks propagated along the column to as much
as 660 mm above the pedestal level. Crack widths were limited, generally less than 1.5 mm.
Concrete crushing also was observed at this drift level (DPN 537), and concrete cover spalling
occurred as drift levels were increased. At 3.0% lateral drift, the corner reinforcement bars were
visible. At 7.0% lateral drift, all concrete cover over the bottom 400 mm of the column had
spalled off. Shear cracks were observed on the north and south faces of the column starting at a
drift level of 0.5% (DPN 201). Some minor cracking also was observed on the north side of the
pedestal at this drift level. At 0.75% lateral drift, additional shear cracks were observed (DPN
297), generally located between one-quarter and one-half column depths away from the column
base (114 mm to 229 mm). Although observed shear cracking was more significant than that
observed for the first three specimens (S10MI, S20MI, and S30MI), longitudinal cracking was
dominant indicating that bond deterioration caused lateral strength degradation.
S20HIN was the only specimen tested with the near-fault displacement history (Fig.
2.30). Initial lateral displacement cycles were identical with the standard displacement history
(Fig. 2.29), except for the absence of the cycles to 0.75% lateral drift. Response of the specimen
was similar to that for the other specimens. Initial flexural cracks were observed during the first
cycle of 0.50% lateral drift (DPN 105 and 121 on the east and west faces of the specimen,
respectively). Longitudinal cracking started during the first cycle to 1.0% lateral drift (DPN 297
and 312). At 1.0% lateral drift, 53% of the column height (890 mm) displayed flexural cracks.
Longitudinal cracks along the splice length first appeared over a length of 100 mm at the bottom
of the column. After completion of the second cycle to 1.0% lateral drift, longitudinal cracks had
propagated along the entire splice length (20db). When 4.0% lateral drift was reached,
longitudinal crack propagation had ceased and crack widths were as wide as 4 mm. For higher
21
drift ratios, the crack at the column-pedestal interface increased substantially due to the slip of
longitudinal bars relative to the starter bars anchored within the pedestal. Concrete spalling
started around 4.0% lateral drift, but it was not significant compared to the other specimens,
mainly due to the lack of a cyclic displacement history.
The test program concluded with testing of specimen S30XI. Initial flexural cracks were
observed on the west and east face of the column during the second cycle to 0.25% lateral drift
(DPN 137) and during the first cycle to 0.50% lateral drift (DPN 216), respectively. Flexural
cracking propagated along the column height as the applied lateral drift level was increased.
After the application of three cycles of 0.50% lateral drift (DPN 289), flexural cracks were
observed over the bottom 0.7 meters of the column (45% of the column height). Longitudinal
cracking initiated during the first cycle of 0.75% lateral drift at data point numbers 297 and 313
on the west and east faces of the column, respectively. Observed longitudinal cracks were less
prominent than for other specimens, and occurred only over the bottom 100 mm of the column
on the north-west and north-east corners of the specimen. These cracks propagated up the
column to a height of 686 mm (45% of the column height) when the lateral drift reached 2.0%
(DPN 585). Concrete crushing was first observed at 1.5% lateral drift, and followed by spalling
of concrete during the first cycle to 2.0% drift. Specimen S30XI was subjected to the highest
shear demand of the columns tested; consequently wider shear cracks were observed. However,
the extent of longitudinal cracking along the splice suggests that lateral strength loss was due to
bond deterioration.
Cracks were observed on the foundation pedestals during the experiments. As mentioned
in Chapter 2, pedestals were designed to be strong enough to prevent cracking. Since columns
were constructed and cast horizontally, one side of the pedestal was not covered with formwork.
Although this large surface was kept moist with burlap covered with plastic during curing, some
minor cracks formed due to shrinkage. In addition to these minor cracks, some longitudinal
hairline cracks were also observed during testing; however, these cracks were not significant.
Pedestal cracks were observed during the second cycle to 1.0% lateral drift (DPN 445) at the
south-west starter bar of S10MI, during the first cycle to 1.5% lateral drift (DPN 489) at the
south-west starter bar of S20MI, and during the first cycle to 0.75% lateral drift (DPN 313) at the
south-east starter bar, and during the first cycle to 1.0% lateral drift (DPN 393) at the south
starter bar of S30XI. These cracks indicate some bond distress along starter bars; however, since
22
strain readings along starter bars within the pedestal are not available, it is not possible to
quantify this distress.
The ability of the specimens to maintain the axial load-carrying capacity during the
experiment was an important consideration during testing. The applied axial load was
continuously monitored and held constant throughout the duration of each experiment. Although
pressure on the hydraulic cylinders was constant during the test, the design of experimental setup
led to variations. Since the axial load was applied at the top of the column and the mechanism
used to apply the axial load displaced with the column, the displacements imposed on the column
caused an inclination of the applied axial load (Fig. 3.11). As a result, the corrected applied axial
load at the column base is equal to:
( )αcos⋅= PN (3-1)
where α is the measured top rotation and P is the applied axial load. Top rotation versus lateral
drift is given on Fig. 3.12.
The change in the axial load due to top rotation is less than 1% for all specimens (Fig.
3.13). Since the axial load variation was negligibly small, effectively, the axial was constant
throughout each experiment.
Two of the five specimens: S10MI (low axial load, standard displacement history) and
S20HIN (intermediate axial load, near-fault displacement history) were able to carry the applied
axial load to the maximum lateral drift that could be applied by the actuator (10% for S10MI,
Fig. 3.14; and 12% for S20HIN, Fig. 3.18). After completion of the lateral displacement history,
the lateral drift applied to specimen S10MI was retuned to zero, and the axial load was
monotonically increased until failure, which occurred when an axial load of 0.20Agf’c was
reached. Unlike specimens S10MI and S20HIN, specimens S20MI, S30MI, S20HI, and S30XI
lost axial load-carrying capacity during the test. Specimens with moderate and high axial load
reached 7% and 5% lateral drift, respectively. Table 3.3 shows the data point and corresponding
lateral displacement at the loss of the axial load-carrying capacity. The axial load-carrying
capacity generally began to degrade when hoops at the 101.6 mm and 406.4 mm levels above the
pedestal opened allowing the vertical bars to buckle. The hoops were fabricated with only 90°
hooks, as is common with older construction, and these hooks provided little lateral support to
suppress buckling once the concrete cover was lost. Figures 3.15 to 3.17 and 3.19 show column
specimens after loss of the axial load-carrying capacity. Buckled longitudinal bars can be clearly
23
seen on these figures, as well as the opening of the 90° hoops.
Although specimen S20HIN was subjected to moderate axial load and pushed beyond
12% drift, the axial load-carrying capacity did not degrade. After reaching 12% lateral drift,
specimen S20HIN was brought back to zero applied drift (original position prior to testing) and
then two cycles of 2% and 4% lateral drift were applied, followed by pushing the specimen back
to 12% lateral drift. No degradation in the axial load capacity was observed. The additional
cycles did produce additional damage, such as concrete spalling and slight buckling of
compression reinforcement; however, significant cover concrete was intact to keep the hoops
with 90° hooks from opening. Consequently the longitudinal bars did not buckle, so the axial
stability of S20HIN was maintained. Specimen S20HIN at 12% lateral drift is shown in Figure
3.18.
3.2 LATERAL LOAD VERSUS TOP DISPLACEMENT RELATIONS
Lateral load versus top displacement plots were prepared to evaluate the overall response of the
specimens. By investigating the plots, it is possible to comment on lateral strength, rate of
strength degradation, energy-dissipation capacity, and ductility of the specimens.
Lateral load versus top displacement graphs of the specimens are given in Figures 3.26
through 3.31. In the graphs, positive (+) load and displacement correspond to pulling of the
specimen toward the reaction frame, and negative (-) values correspond to pushing the specimen
away from the reaction frame. The plots are modified to eliminate the external factors, such as
the displacement of the reaction frame and the pedestal, such that the relation plotted reflects the
applied lateral load and displacement of the top of the column relative to the base of the column.
The applied lateral load is measured with a 667 kip load cell. However, due to the
inclination of the top of the column during testing, base moments and applied shears are
influenced by the horizontal component of applied axial load. Although the effect of the axial
load is not reflected in the plotted lateral load, top displacement relations, it should be considered
when calculating base moment and applied shear.
At the undeformed position, the base moment is equal to the applied lateral load (F)
multiplied by the column height (h). However, due to the applied displacement history at the top
of the column, the axial load acts through an eccentricity (e) such that the moment at the base of
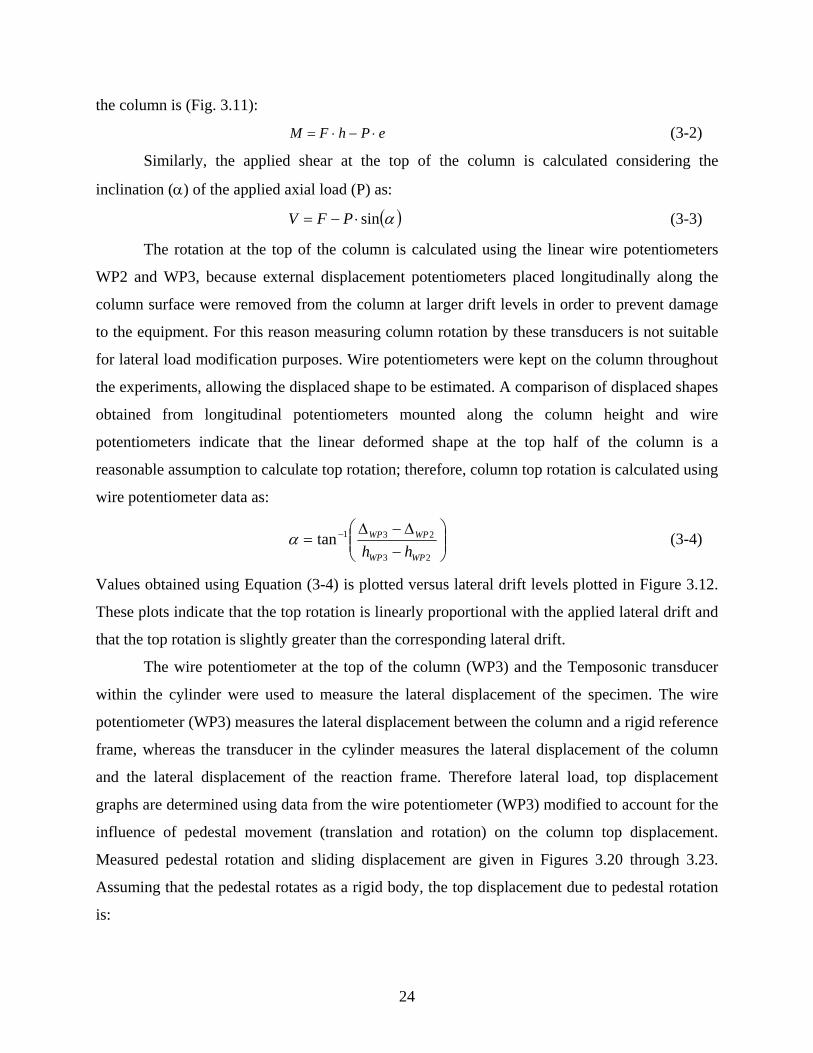
24
the column is (Fig. 3.11):
ePhFM ⋅−⋅= (3-2)
Similarly, the applied shear at the top of the column is calculated considering the
inclination (α) of the applied axial load (P) as:
( )αsin⋅−= PFV (3-3)
The rotation at the top of the column is calculated using the linear wire potentiometers
WP2 and WP3, because external displacement potentiometers placed longitudinally along the
column surface were removed from the column at larger drift levels in order to prevent damage
to the equipment. For this reason measuring column rotation by these transducers is not suitable
for lateral load modification purposes. Wire potentiometers were kept on the column throughout
the experiments, allowing the displaced shape to be estimated. A comparison of displaced shapes
obtained from longitudinal potentiometers mounted along the column height and wire
potentiometers indicate that the linear deformed shape at the top half of the column is a
reasonable assumption to calculate top rotation; therefore, column top rotation is calculated using
wire potentiometer data as:
⎟⎟⎠
⎞⎜⎜⎝
⎛−
∆−∆= −
23
231tanWPWP
WPWP
hhα (3-4)
Values obtained using Equation (3-4) is plotted versus lateral drift levels plotted in Figure 3.12.
These plots indicate that the top rotation is linearly proportional with the applied lateral drift and
that the top rotation is slightly greater than the corresponding lateral drift.
The wire potentiometer at the top of the column (WP3) and the Temposonic transducer
within the cylinder were used to measure the lateral displacement of the specimen. The wire
potentiometer (WP3) measures the lateral displacement between the column and a rigid reference
frame, whereas the transducer in the cylinder measures the lateral displacement of the column
and the lateral displacement of the reaction frame. Therefore lateral load, top displacement
graphs are determined using data from the wire potentiometer (WP3) modified to account for the
influence of pedestal movement (translation and rotation) on the column top displacement.
Measured pedestal rotation and sliding displacement are given in Figures 3.20 through 3.23.
Assuming that the pedestal rotates as a rigid body, the top displacement due to pedestal rotation
is:
25
( ) ( ) ( )mmLhh pedestalpedestalcolumnPRPRrotationpedestal 4.2512_ ++⋅∆−∆=∆ (3-5)
where ∆PR1 and ∆PR2 are the measurements from the two linear potentiometers placed on the east
and west sides of the pedestal, respectively. The distance between the two transducers is the sum
of the length of the pedestal and the thickness of the plastic brackets used to mount the
potentiometers on the pedestal (25.4 mm). Top displacement due to pedestal translation is
directly obtained from the wire potentiometer WP1 which measures the relative lateral
displacement between the reference frame and pedestal (Eq. 3-6).
1_ WPntranslatiopedestal ∆=∆ (3-6)
As shown in Figures 3.20 through 3.23, the top displacement due to pedestal rotation and
translation are very small relative to the values recorded at the top of the column. Despite this
small contribution, the applied lateral displacement histories were corrected to remove the
influence of pedestal rotation and translation by subtracting the sum of lateral displacements due
to pedestal translation and rotation from the measured top displacement. Modified lateral
displacement histories are presented in Figures 3.24 and 3.25.
The corrected lateral load, top displacement plots are given in Figures 3.26 through 3.31.
All specimens exhibit similar responses, with sudden lateral strength degradation at drift levels
between 1% and 1.5%. Lateral strength degradation started just prior to, or just after reaching,
yielding of the starter reinforcement bars. The responses were nonductile, that is, no
displacement ductility was observed and the specimens displayed limited ability to dissipate
energy. The peak lateral strength reached for each specimen was influenced by the level of the
applied axial load, with increased lateral load capacity with increased axial load.
An elastic-perfectly-plastic (EPP) model was used to normalize and compare the energy-
dissipation capacities of the specimens, as shown in Figure 3.41. Using lateral load versus top
displacement responses, the amount of energy dissipated by the specimen and the EPP model are
calculated by finding the area bounded by the load-displacement relations. Figure 3.42 plots the
energy dissipated by both the EPP model and the test specimens. At the end of the applied
displacement history, the total energy dissipated by each specimen was similar (~2x10⁵ kN-mm),
except for specimen S20HIN. At the end of the 2% and 5% lateral drift cycles, energy dissipated
by the specimens with standard displacement history were 47% to 61% and 31% to 43% of the
energy dissipated by an EPP model respectively (Fig. 3.43). Among the specimens with the same
displacement history, S30MI and S10MI gave the largest and smallest normalized energy-

26
dissipation capacity, respectively. Specimen S20HIN dissipated 74% of the energy dissipated by
the EPP model at the end of lateral drift cycles of 2% and 5%.
Lateral drift cycles exceeding 1.5% drift led to significant reduction of lateral strength for
all specimens, with the rate of degradation influenced greatly by the applied lateral displacement
history (standard versus near fault), and somewhat by the level of the applied axial load.
Specimen S20HIN, with near-fault displacement history, was able to maintain more than 50% of
its peak lateral strength at drift levels up to 10%. However, specimens subjected to the standard
cyclic lateral displacement history exhibited more significant lateral strength degradation, with
residual lateral strength of not more than 30% of the peak value. These trends are evident in
Figure 3.33, where the normalized moment, lateral drift response histories of specimens
subjected to standard (S20HI, S20MI) and near-fault (S20HIN) displacement histories are
compared. The rate of strength degradation of the specimens with the same lateral displacement
history (i.e., standard) is similar. A normalized moment, lateral drift comparison of specimens
S10MI, S20MI, and S30MI (Fig. 3.32), as well as the measured secant stiffness (Figs. 3.35, 3.36,
and 3.37), indicate similar lateral strength degradation for all specimens. Measured secant
stiffness values given in Figures 3.35 through 3.40 are calculated at peak lateral drift levels.
The effect of shear demand on specimen response was investigated for specimens with
moderate and high levels of axial load. Since lateral strength degradation was dominated by bond
deterioration along the splice length, the influence of increased shear demand on the behavior of
the specimens was insignificant. A comparison of responses of the specimens with moderate
axial load (S20MI, S20HI and S20HIN) is shown in Figure 3.33. In this plot, the ratio of
measured base moment to yield moment determined by section analysis of specimens S20MI,
S20H, and S20HIN are plotted. Although shear demand at onset of splice deterioration was
increased substantially by reducing the column height, specimens with low [(Vu@Mn)/Vn=0.70]
and moderate [(Vu@Mn)/Vn=0.81] shear demand displayed similar behavior. The increased shear
demand did not significantly impact the lateral strength nor the rate of strength degradation of
specimens with moderate axial load. Comparisons of specimens with high axial load (S30MI and
S30XI) reveal similar results. Normalized base moment versus lateral drift relations (Fig. 3.34)
of these specimens indicated that although shear demand on the section is increased substantially
(0.67 to 0.93), the normalized moment strengths reached in the two columns are very close
(Mu/My ≈ 1.03 for both columns); however, S30XI displayed more lateral strength degradation
27
than S30MI after the peak lateral strength was achieved. Specimens S30MI and S30XI had
normalized moment ratios of 0.33 and 0.23, respectively, at 5% lateral drift just prior to axial
strength degradation occurred.
3.3 MOMENT VERSUS ROTATION RELATIONS
The moment-rotation response of the specimens is used to assess the contribution of slip to the
overall rotation and displacement response of the specimens. The moment versus total rotation
response of the specimens is plotted in Figures 3.44 through 3.49. These responses represent the
rotation at the top of the column caused by flexural deformations over the column height and
rotations caused by slippage of reinforcement bars over the splice length (20db). Total moment at
the base of the column is calculated by summing the moments caused by lateral load and vertical
load, as given by Equation 3.2, rewritten as:
( ) ( ) hPPhFM lateral ⋅⋅−∆⋅⋅+⋅= αα sincos (3-7)
It is desirable to separate slip rotation from total rotation to assess the impact of slip
rotation, as well as to provide a means to calibrate moment versus slip-rotation springs that are
used to model splice behavior (e.g., Reyes and Pincheira, 1999). Rotation due to slip of the
reinforcement bars along the splice is calculated by using the measured potentiometer and strain
gauge data. Linear displacement transducers measured the total rotation over the splice length at
the base of the column, whereas several strain gauges attached to the longitudinal bars monitored
the strain at several locations along the splice length. Average reinforcement strains were
calculated using the strain gauge data. Slip rotation was taken as the difference between the total
rotation and the rotation calculated using the average reinforcement strain along the splice
length. Figures 3.50 through 3.55 show the moment-slip rotation plots over the splice length.
Since measurement of slip rotation is based on strain gauge data, presented data are limited up to
the point where strain gauge data are collected.
Moment-rotation envelopes are also presented in Figures 3.56 through 3.61. Slip rotation
constitutes a significant portion of the total rotation such that at the first peak of 0.5% lateral
drift, the ratio of slip rotation to total rotation is in between 50% to 60% for all specimens. When
1.5% lateral drift ratio is reached, slip rotations for specimens S10MI, S20MI, S20HI, S20HIN,
and S30XI are measured as 85%, 82%, 83%, 81%, and 88% of the total rotation, respectively. As
28
lateral drift levels are increased, the contribution of slip to base rotation becomes dominant.
3.4 STEEL STRAIN PROFILES
Each specimen was instrumented with 33 reinforcing steel strain gauges. Of these, 27 gauges
were used to monitor the strain histories of the longitudinal (flexural) column reinforcement
(including the starter bars anchored into the pedestal) and 6 gauges were placed on the transverse
reinforcement. The strain profiles obtained from the strain gauges were valuable for monitoring
the stress transfer between column longitudinal and starter bars, as well as evaluating the impact
of test variables such as axial load and displacement history on bond strength between
reinforcement bars and the surrounding concrete.
The initial strain gauge readings (as well as other instruments) were taken before and
after the application of the axial load and prior to the application of the lateral displacement.
Strain measurements were continued through the experiment and recorded values were logged at
every data point.
Strain histories for longitudinal column reinforcement were used to plot the strain
distribution along the splice length at peak values for each cycle of lateral drift from 0.1% to 3%.
Steel strain distribution along the splice length is useful to evaluate the stress transfer between
column longitudinal bars and the starter bars embedded into the pedestal. Strain distribution
profiles can be used to determine the bond stress-slip relations needed for calibration of
analytical models. Damage to the specimens ultimately led to damage of the strain gauges placed
on longitudinal reinforcement; generally at about 3% lateral drift; therefore, readings for higher
drift ratios are generally not available.
Axial stress on the longitudinal (vertical) column reinforcing bars due to the combined
bending and axial load is transferred to the starter bars embedded into the pedestal through bond
between the reinforcing bar and the surrounding concrete. Prior to bond deterioration, a
triangular strain distribution is commonly assumed, as shown in Figure 3.62. Figures 3.63
through 3.74 show the longitudinal strain distribution for corner (NW) and middle (W) bars
along the splice length. As shown in Figure 2.16, there are three strain gauges on the column
longitudinal bar (blue) and two gauges on the starter bar (yellow). Also, it is known that the
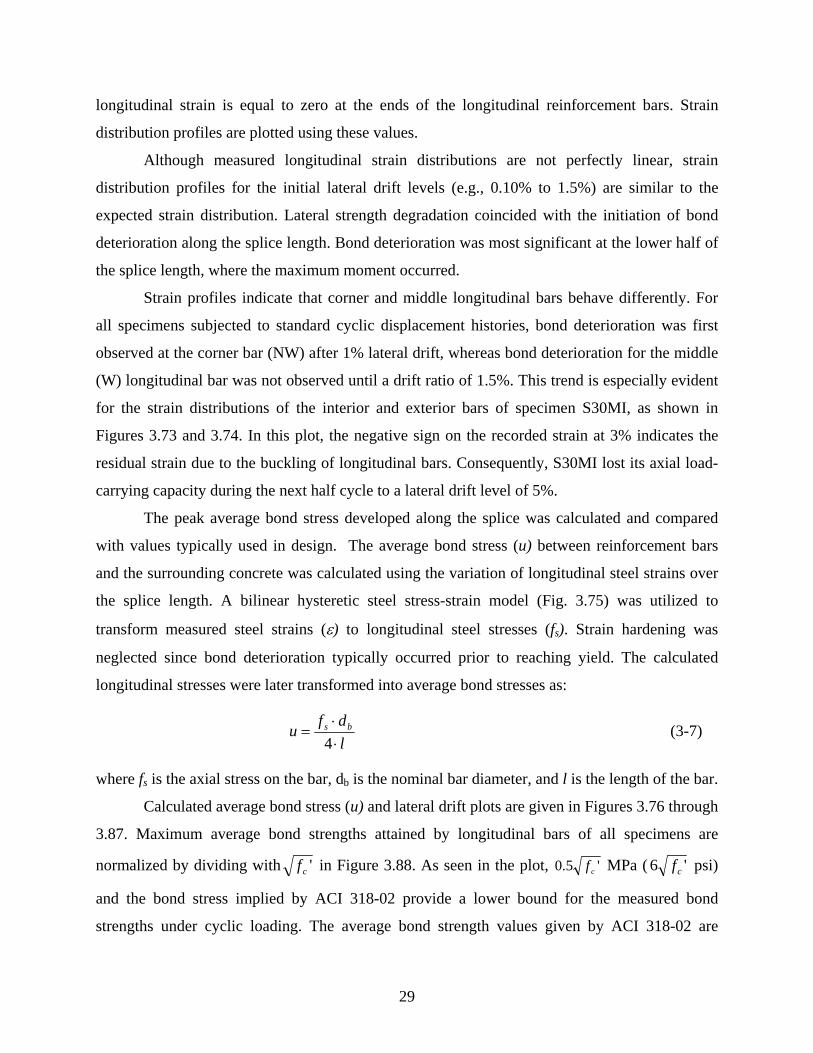
29
longitudinal strain is equal to zero at the ends of the longitudinal reinforcement bars. Strain
distribution profiles are plotted using these values.
Although measured longitudinal strain distributions are not perfectly linear, strain
distribution profiles for the initial lateral drift levels (e.g., 0.10% to 1.5%) are similar to the
expected strain distribution. Lateral strength degradation coincided with the initiation of bond
deterioration along the splice length. Bond deterioration was most significant at the lower half of
the splice length, where the maximum moment occurred.
Strain profiles indicate that corner and middle longitudinal bars behave differently. For
all specimens subjected to standard cyclic displacement histories, bond deterioration was first
observed at the corner bar (NW) after 1% lateral drift, whereas bond deterioration for the middle
(W) longitudinal bar was not observed until a drift ratio of 1.5%. This trend is especially evident
for the strain distributions of the interior and exterior bars of specimen S30MI, as shown in
Figures 3.73 and 3.74. In this plot, the negative sign on the recorded strain at 3% indicates the
residual strain due to the buckling of longitudinal bars. Consequently, S30MI lost its axial load-
carrying capacity during the next half cycle to a lateral drift level of 5%.
The peak average bond stress developed along the splice was calculated and compared
with values typically used in design. The average bond stress (u) between reinforcement bars
and the surrounding concrete was calculated using the variation of longitudinal steel strains over
the splice length. A bilinear hysteretic steel stress-strain model (Fig. 3.75) was utilized to
transform measured steel strains (ε) to longitudinal steel stresses (fs). Strain hardening was
neglected since bond deterioration typically occurred prior to reaching yield. The calculated
longitudinal stresses were later transformed into average bond stresses as:
ldfu bs
⋅⋅
=4
(3-7)
where fs is the axial stress on the bar, db is the nominal bar diameter, and l is the length of the bar.
Calculated average bond stress (u) and lateral drift plots are given in Figures 3.76 through
3.87. Maximum average bond strengths attained by longitudinal bars of all specimens are
normalized by dividing with 'cf in Figure 3.88. As seen in the plot, '5.0 cf MPa ( '6 cf psi)
and the bond stress implied by ACI 318-02 provide a lower bound for the measured bond
strengths under cyclic loading. The average bond strength values given by ACI 318-02 are
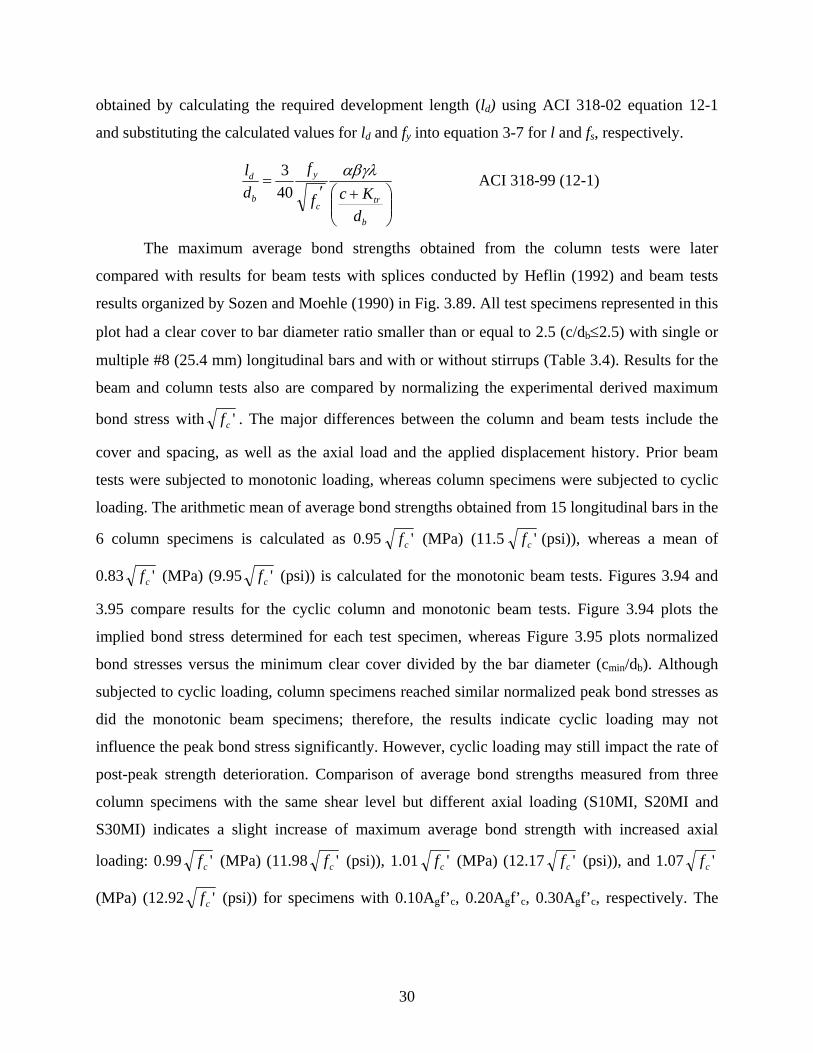
30
obtained by calculating the required development length (ld) using ACI 318-02 equation 12-1
and substituting the calculated values for ld and fy into equation 3-7 for l and fs, respectively.
⎟⎟⎠
⎞⎜⎜⎝
⎛ +′=
b
trc
y
b
d
dKcf
fdl αβγλ
403 ACI 318-99 (12-1)
The maximum average bond strengths obtained from the column tests were later
compared with results for beam tests with splices conducted by Heflin (1992) and beam tests
results organized by Sozen and Moehle (1990) in Fig. 3.89. All test specimens represented in this
plot had a clear cover to bar diameter ratio smaller than or equal to 2.5 (c/db≤2.5) with single or
multiple #8 (25.4 mm) longitudinal bars and with or without stirrups (Table 3.4). Results for the
beam and column tests also are compared by normalizing the experimental derived maximum
bond stress with 'cf . The major differences between the column and beam tests include the
cover and spacing, as well as the axial load and the applied displacement history. Prior beam
tests were subjected to monotonic loading, whereas column specimens were subjected to cyclic
loading. The arithmetic mean of average bond strengths obtained from 15 longitudinal bars in the
6 column specimens is calculated as 0.95 'cf (MPa) (11.5 'cf (psi)), whereas a mean of
0.83 'cf (MPa) (9.95 'cf (psi)) is calculated for the monotonic beam tests. Figures 3.94 and
3.95 compare results for the cyclic column and monotonic beam tests. Figure 3.94 plots the
implied bond stress determined for each test specimen, whereas Figure 3.95 plots normalized
bond stresses versus the minimum clear cover divided by the bar diameter (cmin/db). Although
subjected to cyclic loading, column specimens reached similar normalized peak bond stresses as
did the monotonic beam specimens; therefore, the results indicate cyclic loading may not
influence the peak bond stress significantly. However, cyclic loading may still impact the rate of
post-peak strength deterioration. Comparison of average bond strengths measured from three
column specimens with the same shear level but different axial loading (S10MI, S20MI and
S30MI) indicates a slight increase of maximum average bond strength with increased axial
loading: 0.99 'cf (MPa) (11.98 'cf (psi)), 1.01 'cf (MPa) (12.17 'cf (psi)), and 1.07 'cf
(MPa) (12.92 'cf (psi)) for specimens with 0.10Agf’c, 0.20Agf’c, 0.30Agf’c, respectively. The
31
rate of strength degradation after reaching peak load decreases moderately as the axial load
increases from 0.10Agf’c to 0.30Agf’c (see Figures 3.88 – 3.90).
3.5 SHEAR DISTORTION
Shear distortion over the column height was measured using linear voltage transducers. As
mentioned in Chapter 2, two different layouts of instrumentation were used to measure shear
deformations on the column face. The shear demand on the section was calculated by using
equation 3.3.
The transducer layout for the first set of specimens S10MI, S20MI, and S30MI (Fig.
2.22) consists of diagonal, longitudinal, and horizontal linear transducers. Shear distortion is
calculated using measured horizontal (∆H), longitudinal (∆L), and diagonal (∆D) deformations as:
( ) ( )L
HLD h
bhd∆+∆+
−∆+−∆+= 22γ (3-8)
where b, h and d stand for horizontal, longitudinal, and diagonal dimensions of the potentiometer
grid, respectively (Fig. 3.96). There are two levels of diagonal transducers placed along splice
length. Total shear distortion over the lap splice length was calculated by summing the shear
distortions measured by these two sets of transducers.
Two diagonal wire potentiometers were utilized for a second set of specimens. This
layout for measuring shear deformations reduced the number of potentiometers and increased the
magnitudes of the measured displacements due to the larger gauge lengths. For this case, the
shear distortion was calculated as:
lh
dd DD
⋅⋅⋅∆−⋅∆
=2
2211γ (3-9)
where ∆D1 and ∆D2 are the diagonal deformations measured by the diagonal wire potentiometers
(Fig. 3.100).
The measured shear distortions are presented in Figures 3.97 through 3.103. The nominal
shear strength (Vn) and the nominal shear strength provided by concrete (Vc) are calculated for
each specimen and are also presented with shear distortion plots. Measured shear force versus
shear strain relationship is linear until the lateral strength starts to degrade. The increase in shear
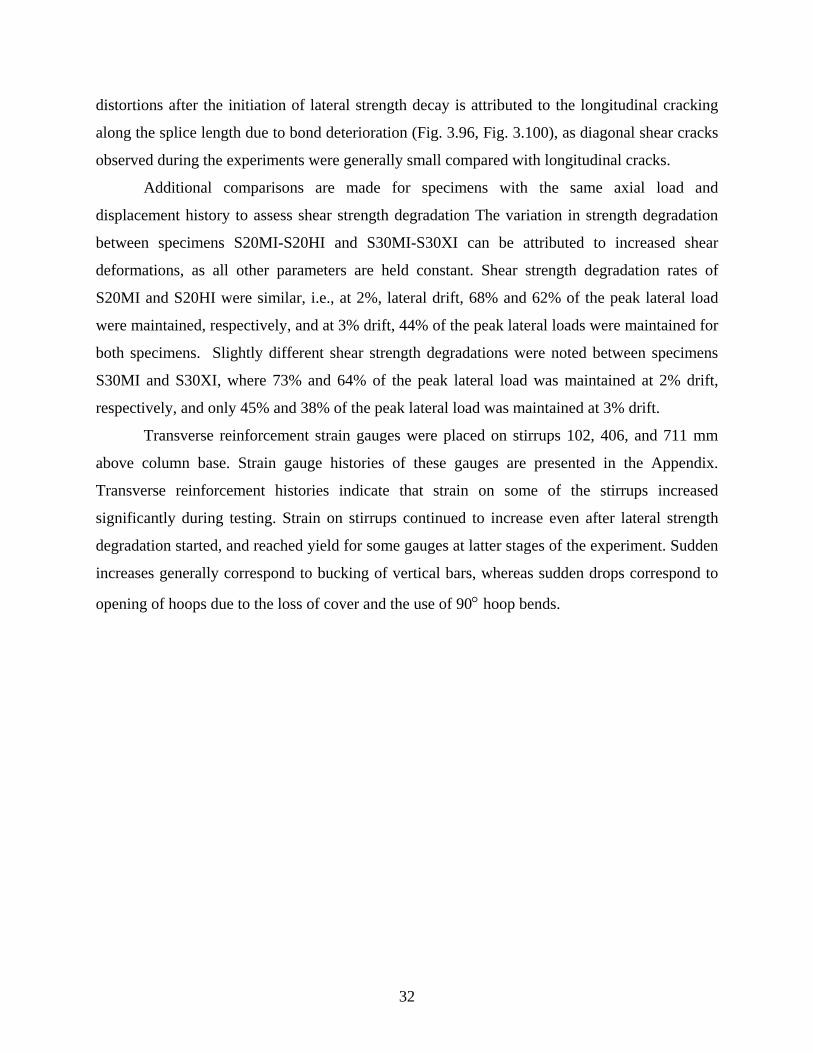
32
distortions after the initiation of lateral strength decay is attributed to the longitudinal cracking
along the splice length due to bond deterioration (Fig. 3.96, Fig. 3.100), as diagonal shear cracks
observed during the experiments were generally small compared with longitudinal cracks.
Additional comparisons are made for specimens with the same axial load and
displacement history to assess shear strength degradation The variation in strength degradation
between specimens S20MI-S20HI and S30MI-S30XI can be attributed to increased shear
deformations, as all other parameters are held constant. Shear strength degradation rates of
S20MI and S20HI were similar, i.e., at 2%, lateral drift, 68% and 62% of the peak lateral load
were maintained, respectively, and at 3% drift, 44% of the peak lateral loads were maintained for
both specimens. Slightly different shear strength degradations were noted between specimens
S30MI and S30XI, where 73% and 64% of the peak lateral load was maintained at 2% drift,
respectively, and only 45% and 38% of the peak lateral load was maintained at 3% drift.
Transverse reinforcement strain gauges were placed on stirrups 102, 406, and 711 mm
above column base. Strain gauge histories of these gauges are presented in the Appendix.
Transverse reinforcement histories indicate that strain on some of the stirrups increased
significantly during testing. Strain on stirrups continued to increase even after lateral strength
degradation started, and reached yield for some gauges at latter stages of the experiment. Sudden
increases generally correspond to bucking of vertical bars, whereas sudden drops correspond to
opening of hoops due to the loss of cover and the use of 90° hoop bends.
33
4 Summary and Conclusions
4.1 SUMMARY
Older reinforced concrete columns have design deficiencies such as short compression lap
splices and widely spaced ties. Knowledge of the behavior of these “nonductile” columns under
earthquake loads is necessary to develop efficient and reliable rehabilitation measures; however,
existing data for full-scale columns tested are very limited. A research program that included
conducting tests on six full-scale column specimens under a variety of conditions was designed
to address this shortcoming. The influence of variables such as the level of axial load, the ratio of
moment to shear, and the load history on column behavior are investigated.
The column test specimens were subjected to constant axial loading levels during testing
of either 0.10, 0.20, and 0.30Agf’c. A single lateral load was applied at the top of each specimen
to generate shear and bending moment within the cantilever column specimens. The height of the
applied lateral load was varied to produce various ratios of shear demand (shear at expected
failure divided by the shear capacity of 0.67 to 0.93) to moment strength. The influence of
loading history on specimen response was studied by using two applied displacement histories,
referred to as “standard” and “near-field.”
Results of the tests were compared to assess the influence of the test variables on column
behavior.
4.2 CONCLUSIONS
Specimens with 20db lap splice length and a poorly confined cross section behaved
unsatisfactorily under cyclic lateral loading. Degradation in lateral strength initiated prior to
reinforcement yield in all specimens, typically at lateral drift ratios of 1.0% to 1.5%. Lateral
strength degradation resulted from bond deterioration between reinforcement bars and the
34
surrounding concrete, and the rate of degradation was dependent on the level of axial loading,
the level of the applied shear, as well as the loading history.
Changes in shear strength ratios Vmax/Vn between 0.67 and 0.93 did not appear to
influence the lateral load at which bond deterioration initiated; however the lateral strength
degradation rate was increased slightly with increasing shear level.
Plots of normalized moment (M/My) for specimens tested with 0.10, 0.20, and 0.30Agf’c
and low shear level indicated that variation in the axial load had only a marginal impact on the
lateral load at which bond deterioration initiated. As well, degradation of the lateral strength was
similar. The axial load level did impact the normalized column energy-dissipation capacity,
which decreased as the axial load level increased.
Significantly less strength degradation was noted for the specimen subjected to the near-
fault displacement history. At 2% and 5% lateral drift, the specimen subjected to the near-fault
displacement history maintained 89% and 63% of peak lateral force applied, compared with
average values of 73% (73/89 = 82%) and 36% (36/63 = 57%) for specimens subjected to the
standard displacement history displayed.
Specimens with low axial load were able to maintain the axial load-carrying capacity to
very high drift ratios, typically about 10% of the column height. Columns with medium and high
axial load levels lost the axial load-carrying capacity during the cycles to 7% and 5% lateral
drift, respectively. Specimens with low axial load maintained a residual axial load capacity of
approximately 20% the peak axial load capacity. The lack of axial load failures until very high
interstory drift ratios indicates that splice failures at interior connections may not create a
collapse hazard.
Investigation of moment-rotation responses of the specimens indicated that rotation
caused by slippage of longitudinal bars accounted for a significant portion of the total rotation.
After bond deterioration initiated, rotational response was mainly controlled by slip.
Average bond strengths along the spliced bars were computed using data from strain
gauges. The implied bond strengths for Equation (12-3) in ACI 318-02 provided a lower-bound
estimate to the peak bond strengths derived from the test data; however, deterioration of bond
strength (slip) resulted in fairly rapid loss of column lateral load capacity.

35
Measured shear deformations were quite small for the specimens tested. Although shear
demand was increased up to 93% of the shear capacity for specimen S30XI, specimen responses
were dominated by the lateral strength loss due to bond deterioration.
37
REFERENCES
Aboutaha, R., M. D. Engelhardt., J. O. Jirsa, M. E. Kreger., (1996). “Retrofit of Concrete Columns with Inadequate Lap Splices by the Use of Rectangular Steel Jackets,” Earthquake Spectra, Vol. 12, No. 4, November 1996, pp. 693-714.
American Concrete Institute, “Building Code Requirements for Reinforced Concrete: ACI 318,” Farmington Hills, MI, 1956, 1963, 1989, 1995, 1999 and 2002.
Chai, Yuk; Priestley, M.; and Seible, Frieder; "Seismic Retrofit of Circular Bridge Columns for Enhanced Flexural Performance," ACI Structural Journal, V88., No.5, September-October 1991, pp. 572-584.
Coffman, Harvey L.; Marsh, M. Lee; Brown, Colin B., "Seismic Durability of Retrofitted Reinforced-Concrete Columns", Journal of Structural Engineering, Vol. 119, No. 5, pp.1643-1661.
DeVries, R., J. P. Moehle, W. Hester. (1990). “Lap Splice Strength of Plain and Epoxy-Coated Reinforcement,” Report to the Department of Civil Engineering, University of California at Berkeley, Feb. 1990.
Federal Emergency Management Agency, “Guidelines for the Seismic Rehabilitation of Buildings,” Report No. FEMA-273, October 1997.
Heflin, W. E. (1992). “A Study of the Effects of Cover and Spacing on Development Length Requirements for Reinforced Concrete Beams,” Master of Science Thesis, Clarkson University, Potsdam, NY, April 1992. International Conference of Building Officials, “Uniform Building Code,” Whittier, CA, 1994, 1997.
Lynn, A. C., J. P. Moehle, S. A. Mahin, W. T. Holmes. (1996). “Seismic Evaluation of Existing Reinforced Concrete Building Columns,” Earthquake Spectra, Vol. 12, No. 4, November 1996, pp. 715-739.
Orangun, C. O., J. O. Jirsa, J. E. Breen (1977). “A Reevaluation of Test Data on Development Length and Splices”, ACI Journal, March 1977
Paulay, T, T. M. Zanza, A. Scarpas. (1981). “Lapped Splices in Bridge Piers and in Columns of Earthquake Resisting Reinforced Concrete Frames”, Research Report 81-6, Dept. of Civil Engineering, Univ. of Canterbury, Christchurch, New Zealand, Aug. 1981
Reinforced Concrete Column Test Database, http://ce.washington.edu/~peera1/
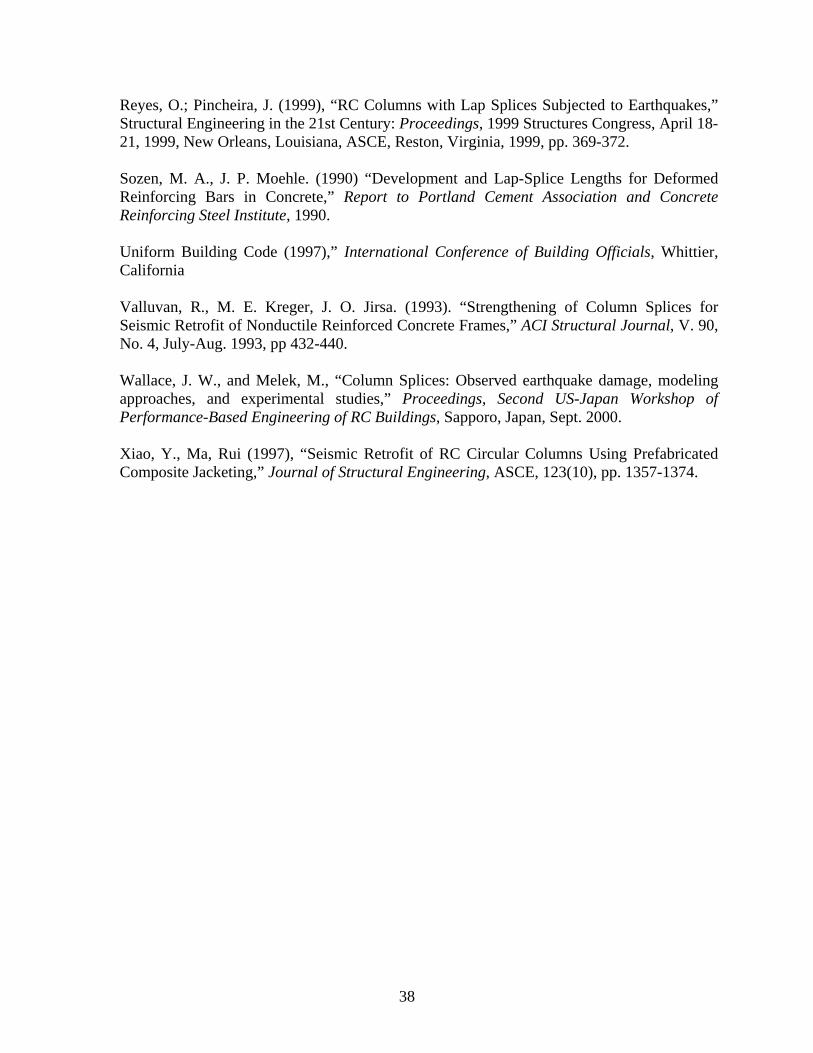
38
Reyes, O.; Pincheira, J. (1999), “RC Columns with Lap Splices Subjected to Earthquakes,” Structural Engineering in the 21st Century: Proceedings, 1999 Structures Congress, April 18-21, 1999, New Orleans, Louisiana, ASCE, Reston, Virginia, 1999, pp. 369-372.
Sozen, M. A., J. P. Moehle. (1990) “Development and Lap-Splice Lengths for Deformed Reinforcing Bars in Concrete,” Report to Portland Cement Association and Concrete Reinforcing Steel Institute, 1990.
Uniform Building Code (1997),” International Conference of Building Officials, Whittier, California
Valluvan, R., M. E. Kreger, J. O. Jirsa. (1993). “Strengthening of Column Splices for Seismic Retrofit of Nonductile Reinforced Concrete Frames,” ACI Structural Journal, V. 90, No. 4, July-Aug. 1993, pp 432-440.
Wallace, J. W., and Melek, M., “Column Splices: Observed earthquake damage, modeling approaches, and experimental studies,” Proceedings, Second US-Japan Workshop of Performance-Based Engineering of RC Buildings, Sapporo, Japan, Sept. 2000.
Xiao, Y., Ma, Rui (1997), “Seismic Retrofit of RC Circular Columns Using Prefabricated Composite Jacketing,” Journal of Structural Engineering, ASCE, 123(10), pp. 1357-1374.

39
Fig. 1.1 - Splice Damage: Northridge Earthquake
Figure 1.2 - Anchorage and Splice Damage
(a) One-Story Parking Structure (b) 8-Story Parking Structure
(a) Connection region— Gölcük, Turkey (b) 12-Story Building— Nantou
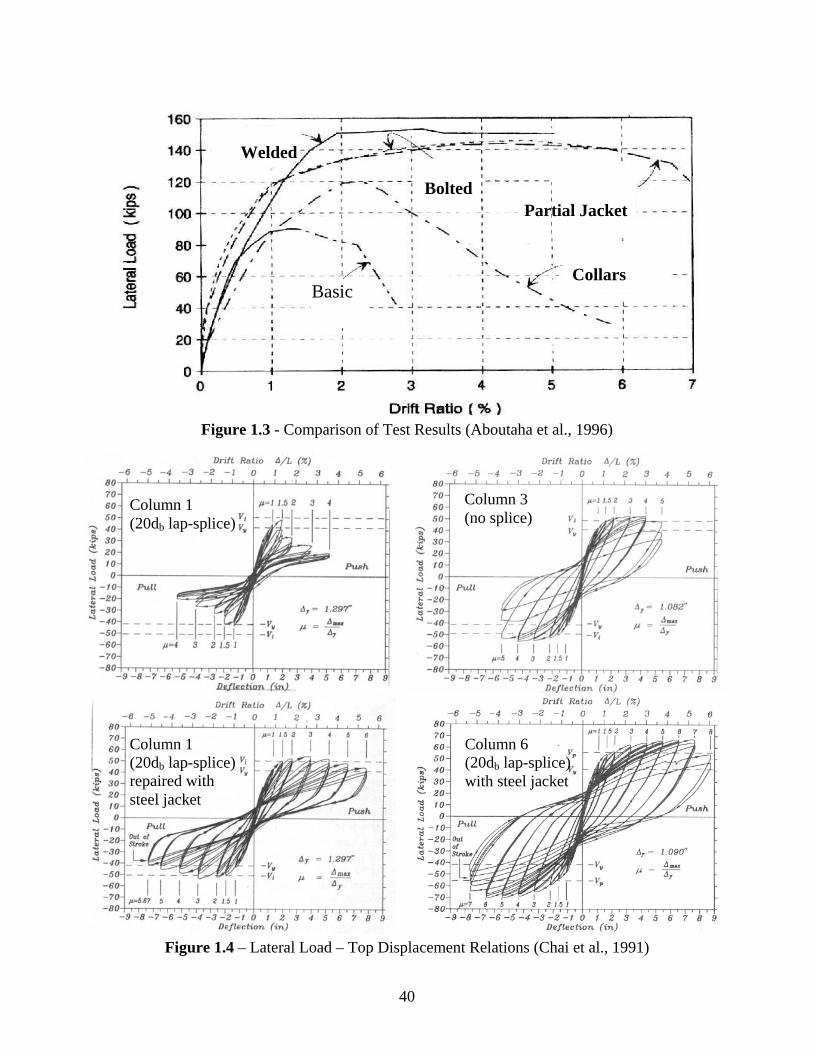
40
Figure 1.3 - Comparison of Test Results (Aboutaha et al., 1996)
Figure 1.4 – Lateral Load – Top Displacement Relations (Chai et al., 1991)
Welded
Collars
Partial Jacket Bolted
Basic
Column 1 (20db lap-splice)
Column 1 (20db lap-splice) repaired with steel jacket
Column 6 (20db lap-splice) with steel jacket
Column 3 (no splice)
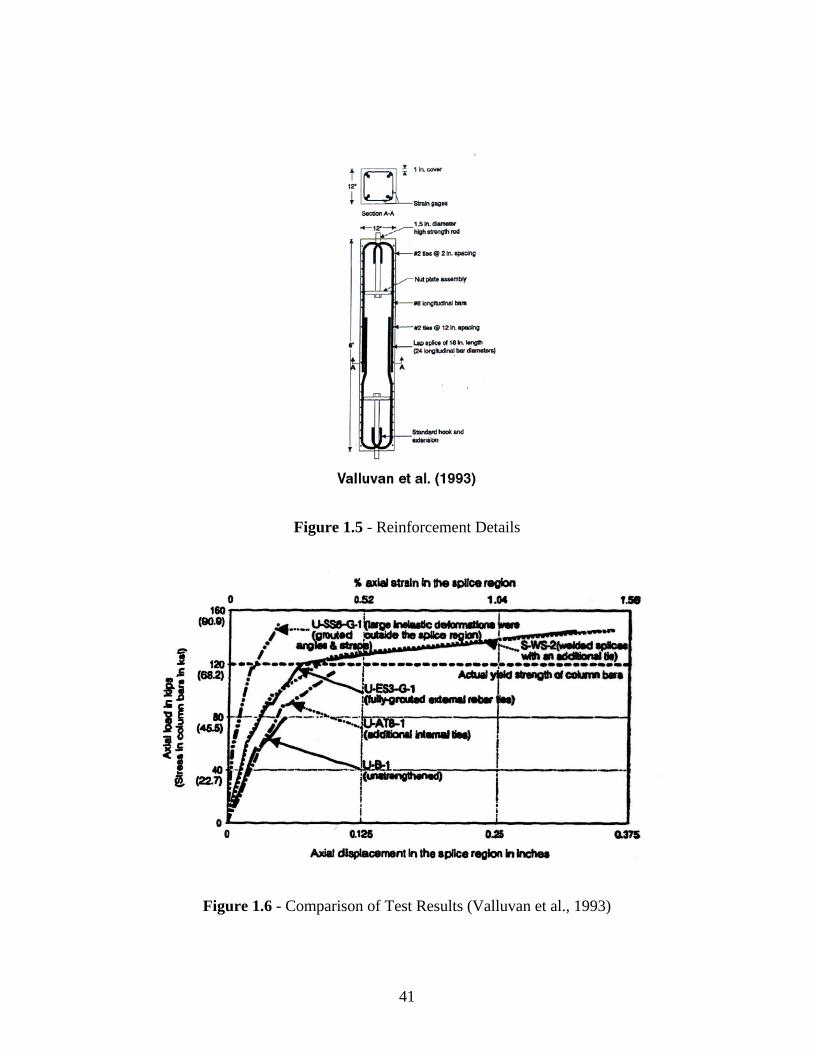
41
Figure 1.5 - Reinforcement Details
Figure 1.6 - Comparison of Test Results (Valluvan et al., 1993)
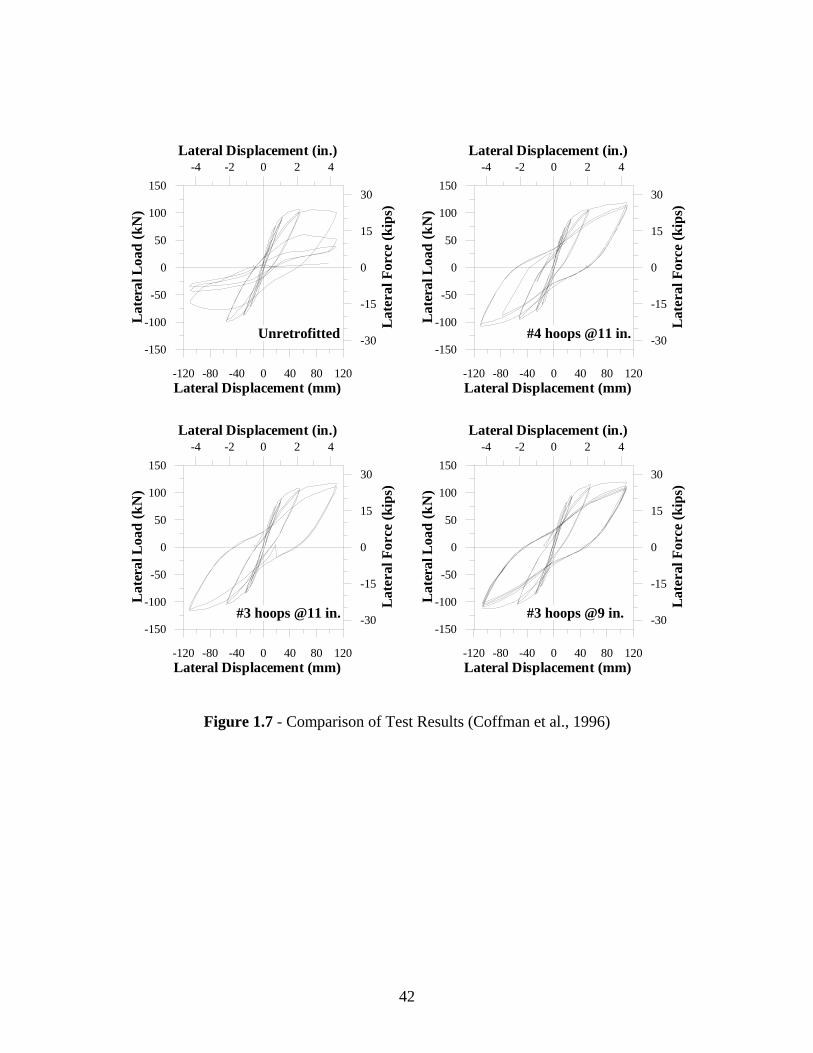
42
Figure 1.7 - Comparison of Test Results (Coffman et al., 1996)
-4 -2 0 2 4Lateral Displacement (in.)
-30
-15
0
15
30
Lat
eral
For
ce (k
ips)
-120 -80 -40 0 40 80 120Lateral Displacement (mm)
-150
-100
-50
0
50
100
150
Lat
eral
Loa
d (k
N)
-4 -2 0 2 4Lateral Displacement (in.)
-30
-15
0
15
30
Lat
eral
For
ce (k
ips)
-120 -80 -40 0 40 80 120Lateral Displacement (mm)
-150
-100
-50
0
50
100
150
Lat
eral
Loa
d (k
N)
-4 -2 0 2 4Lateral Displacement (in.)
-30
-15
0
15
30
Lat
eral
For
ce (k
ips)
-120 -80 -40 0 40 80 120Lateral Displacement (mm)
-150
-100
-50
0
50
100
150
Lat
eral
Loa
d (k
N)
-4 -2 0 2 4Lateral Displacement (in.)
-30
-15
0
15
30
Lat
eral
For
ce (k
ips)
-120 -80 -40 0 40 80 120Lateral Displacement (mm)
-150
-100
-50
0
50
100
150
Lat
eral
Loa
d (k
N)
Unretrofitted #4 hoops @11 in.
#3 hoops @9 in.#3 hoops @11 in.
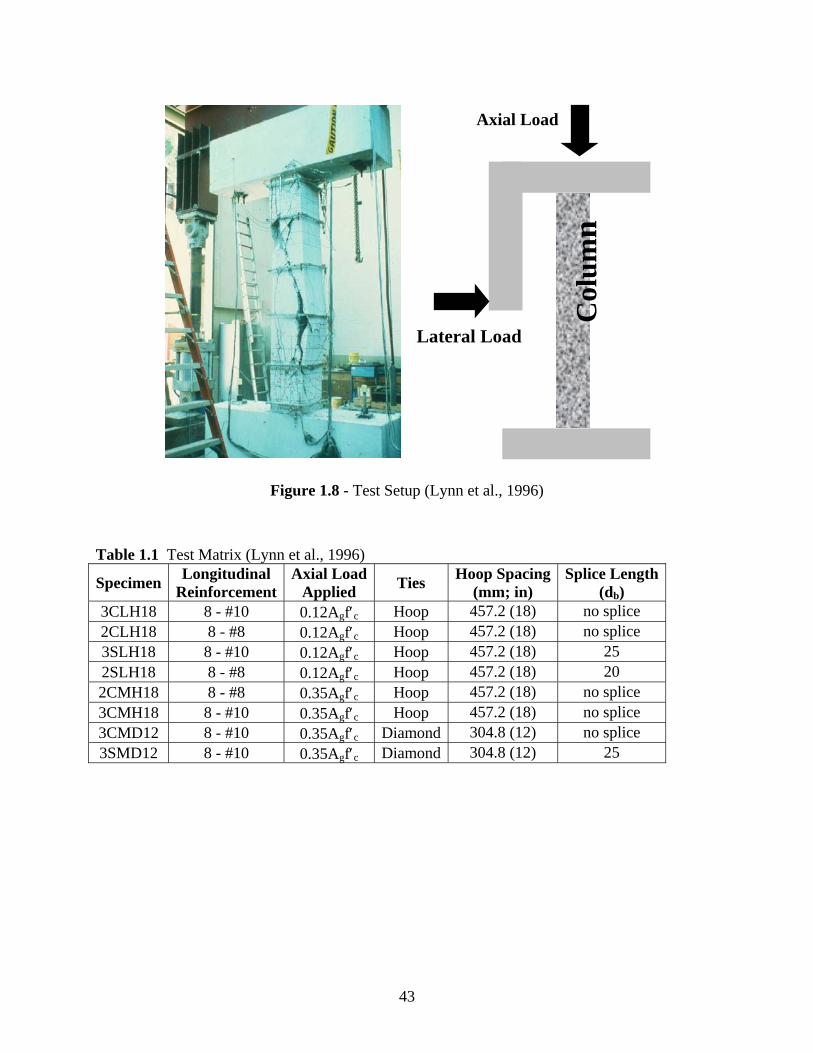
43
Figure 1.8 - Test Setup (Lynn et al., 1996)
Table 1.1 Test Matrix (Lynn et al., 1996)
Specimen Longitudinal Reinforcement
Axial LoadApplied Ties Hoop Spacing
(mm; in) Splice Length
(db) 3CLH18 8 - #10 0.12Agf′c Hoop 457.2 (18) no splice 2CLH18 8 - #8 0.12Agf′c Hoop 457.2 (18) no splice 3SLH18 8 - #10 0.12Agf′c Hoop 457.2 (18) 25 2SLH18 8 - #8 0.12Agf′c Hoop 457.2 (18) 20 2CMH18 8 - #8 0.35Agf′c Hoop 457.2 (18) no splice 3CMH18 8 - #10 0.35Agf′c Hoop 457.2 (18) no splice 3CMD12 8 - #10 0.35Agf′c Diamond 304.8 (12) no splice 3SMD12 8 - #10 0.35Agf′c Diamond 304.8 (12) 25
Axial Load
Col
umn
Lateral Load
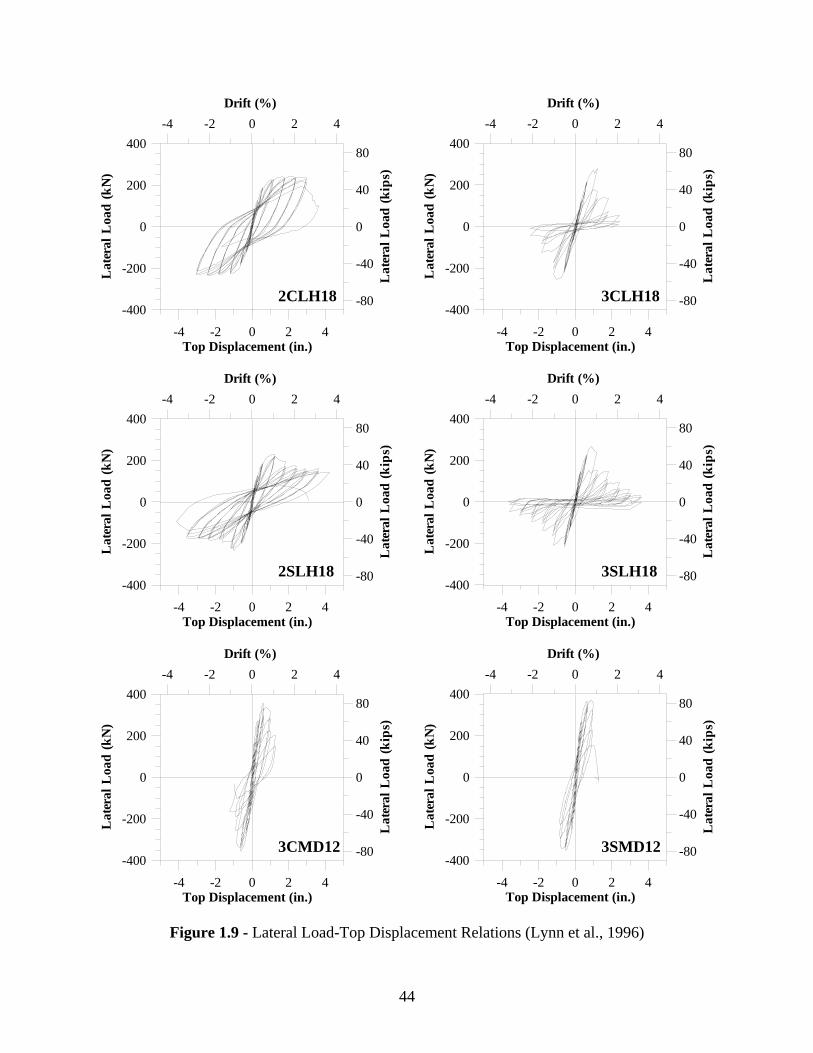
44
Figure 1.9 - Lateral Load-Top Displacement Relations (Lynn et al., 1996)
-4 -2 0 2 4Top Displacement (in.)
-80
-40
0
40
80
Lat
eral
Loa
d (k
ips)
-4 -2 0 2 4Drift (%)
-400
-200
0
200
400
Lat
eral
Loa
d (k
N)
2CLH18
-4 -2 0 2 4Top Displacement (in.)
-80
-40
0
40
80
Lat
eral
Loa
d (k
ips)
-4 -2 0 2 4Drift (%)
-400
-200
0
200
400
Lat
eral
Loa
d (k
N)
3CLH18
-4 -2 0 2 4Top Displacement (in.)
-80
-40
0
40
80
Lat
eral
Loa
d (k
ips)
-4 -2 0 2 4Drift (%)
-400
-200
0
200
400
Lat
eral
Loa
d (k
N)
2SLH18
-4 -2 0 2 4Top Displacement (in.)
-80
-40
0
40
80
Lat
eral
Loa
d (k
ips)
-4 -2 0 2 4Drift (%)
-400
-200
0
200
400L
ater
al L
oad
(kN
)
3SLH18
-4 -2 0 2 4Top Displacement (in.)
-80
-40
0
40
80
Lat
eral
Loa
d (k
ips)
-4 -2 0 2 4Drift (%)
-400
-200
0
200
400
Lat
eral
Loa
d (k
N)
3CMD12
-4 -2 0 2 4Top Displacement (in.)
-80
-40
0
40
80L
ater
al L
oad
(kip
s)
-4 -2 0 2 4Drift (%)
-400
-200
0
200
400
Lat
eral
Loa
d (k
N)
3SMD12

45
762 mm; 2' 6"
457.2 mm
457.2 mm; 18"
457.2 mm
457.2 mm; 18"
Section A-A
Section B-B
508 mm; 20"
2 006.6 mm; 6' 7"
B
A
B
A
304.8 mm; 12"
101.6 mm; 4"
Figure 2.1 - Reinforcing Details
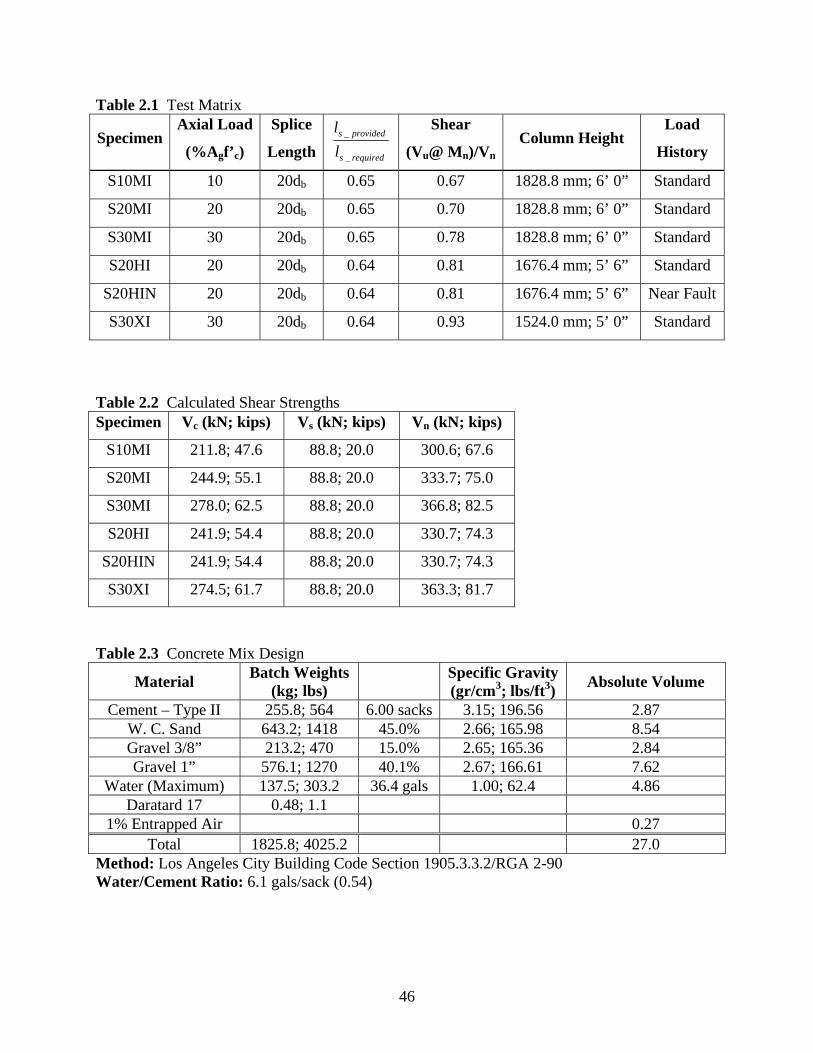
46
Table 2.1 Test Matrix
Specimen Axial Load
(%Agf’c)
Splice
Length requireds
provideds
ll
_
_
Shear
(Vu@ Mn)/VnColumn Height
Load
History
S10MI 10 20db 0.65 0.67 1828.8 mm; 6’ 0” Standard
S20MI 20 20db 0.65 0.70 1828.8 mm; 6’ 0” Standard
S30MI 30 20db 0.65 0.78 1828.8 mm; 6’ 0” Standard
S20HI 20 20db 0.64 0.81 1676.4 mm; 5’ 6” Standard
S20HIN 20 20db 0.64 0.81 1676.4 mm; 5’ 6” Near Fault
S30XI 30 20db 0.64 0.93 1524.0 mm; 5’ 0” Standard
Table 2.2 Calculated Shear Strengths Specimen Vc (kN; kips) Vs (kN; kips) Vn (kN; kips)
S10MI 211.8; 47.6 88.8; 20.0 300.6; 67.6
S20MI 244.9; 55.1 88.8; 20.0 333.7; 75.0
S30MI 278.0; 62.5 88.8; 20.0 366.8; 82.5
S20HI 241.9; 54.4 88.8; 20.0 330.7; 74.3
S20HIN 241.9; 54.4 88.8; 20.0 330.7; 74.3
S30XI 274.5; 61.7 88.8; 20.0 363.3; 81.7
Table 2.3 Concrete Mix Design
Material Batch Weights (kg; lbs)
Specific Gravity(gr/cm3; lbs/ft3) Absolute Volume
Cement – Type II 255.8; 564 6.00 sacks 3.15; 196.56 2.87 W. C. Sand 643.2; 1418 45.0% 2.66; 165.98 8.54 Gravel 3/8” 213.2; 470 15.0% 2.65; 165.36 2.84 Gravel 1” 576.1; 1270 40.1% 2.67; 166.61 7.62
Water (Maximum) 137.5; 303.2 36.4 gals 1.00; 62.4 4.86 Daratard 17 0.48; 1.1
1% Entrapped Air 0.27 Total 1825.8; 4025.2 27.0
Method: Los Angeles City Building Code Section 1905.3.3.2/RGA 2-90 Water/Cement Ratio: 6.1 gals/sack (0.54)
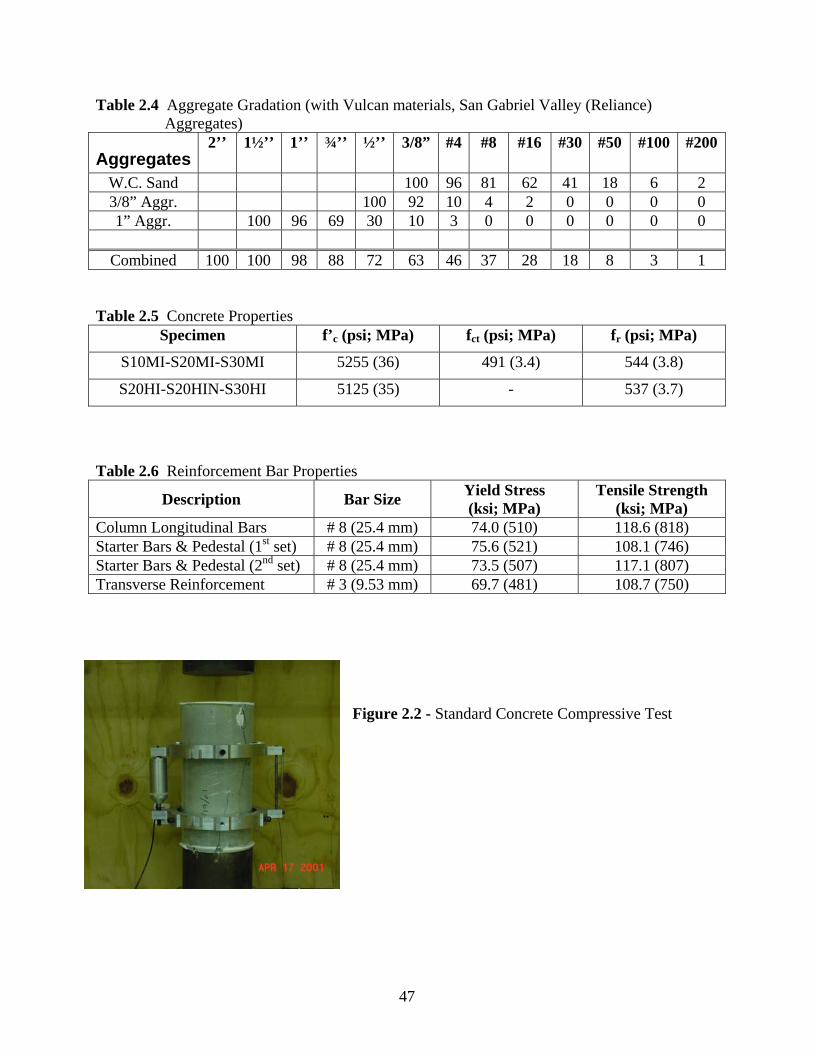
47
Table 2.4 Aggregate Gradation (with Vulcan materials, San Gabriel Valley (Reliance) Aggregates)
Aggregates 2’’ 1½’’ 1’’ ¾’’ ½’’ 3/8” #4 #8 #16 #30 #50 #100 #200
W.C. Sand 100 96 81 62 41 18 6 2 3/8” Aggr. 100 92 10 4 2 0 0 0 0 1” Aggr. 100 96 69 30 10 3 0 0 0 0 0 0
Combined 100 100 98 88 72 63 46 37 28 18 8 3 1
Table 2.5 Concrete Properties
Specimen f’c (psi; MPa) fct (psi; MPa) fr (psi; MPa)
S10MI-S20MI-S30MI 5255 (36) 491 (3.4) 544 (3.8)
S20HI-S20HIN-S30HI 5125 (35) - 537 (3.7)
Table 2.6 Reinforcement Bar Properties
Description Bar Size Yield Stress (ksi; MPa)
Tensile Strength (ksi; MPa)
Column Longitudinal Bars # 8 (25.4 mm) 74.0 (510) 118.6 (818) Starter Bars & Pedestal (1st set) # 8 (25.4 mm) 75.6 (521) 108.1 (746) Starter Bars & Pedestal (2nd set) # 8 (25.4 mm) 73.5 (507) 117.1 (807) Transverse Reinforcement # 3 (9.53 mm) 69.7 (481) 108.7 (750)
Figure 2.2 - Standard Concrete Compressive Test
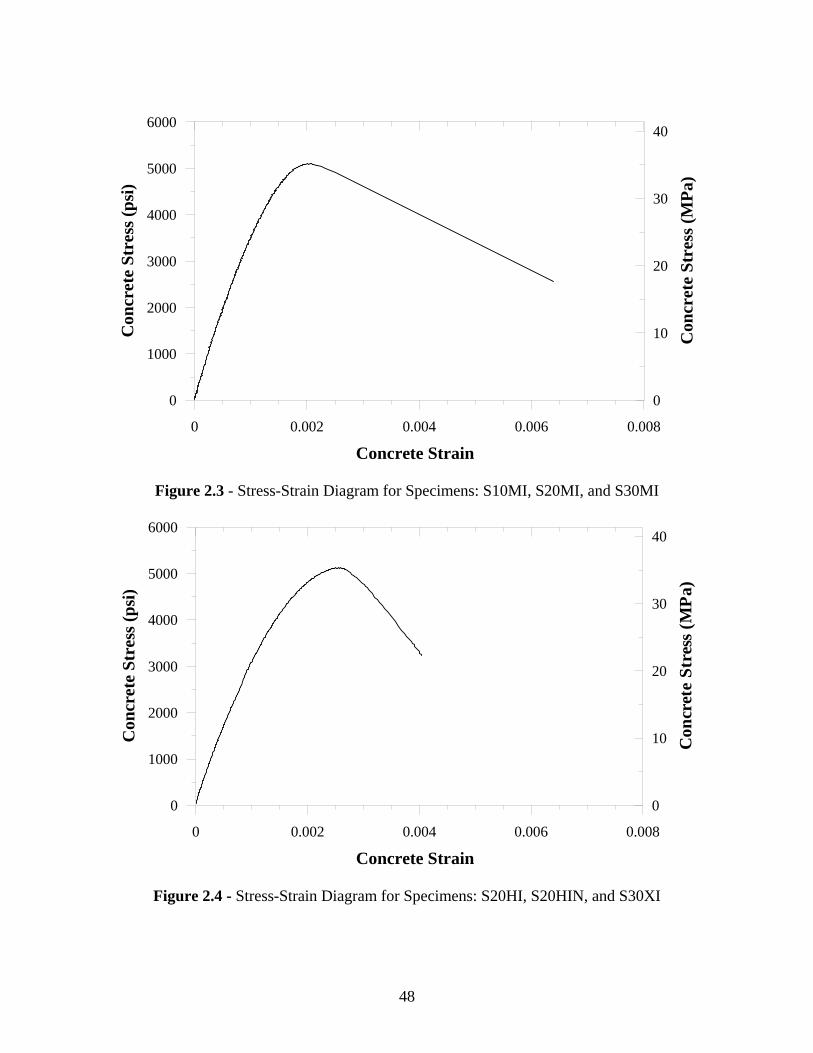
48
Figure 2.3 - Stress-Strain Diagram for Specimens: S10MI, S20MI, and S30MI
Figure 2.4 - Stress-Strain Diagram for Specimens: S20HI, S20HIN, and S30XI
0 0.002 0.004 0.006 0.008
Concrete Strain
0
1000
2000
3000
4000
5000
6000
Con
cret
e St
ress
(psi
)
0
10
20
30
40
Con
cret
e St
ress
(MPa
)
0 0.002 0.004 0.006 0.008
Concrete Strain
0
1000
2000
3000
4000
5000
6000C
oncr
ete
Stre
ss (p
si)
0
10
20
30
40
Con
cret
e St
ress
(MPa
)
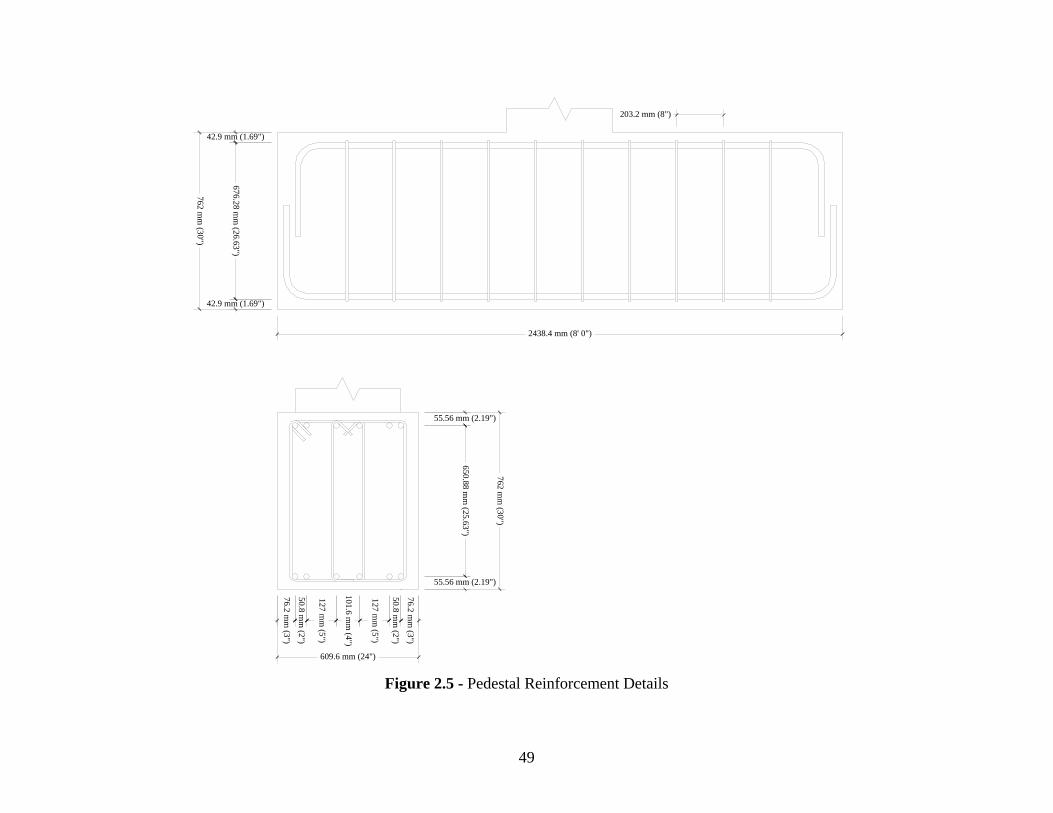
49
2438.4 mm (8' 0")
762 mm
(30")
55.56 mm (2.19")
55.56 mm (2.19")
650.88 mm
(25.63")
127 mm
(5")
609.6 mm (24")
127 mm
(5")
76.2 mm
(3")
50.8 mm
(2")
101.6 mm
(4")
50.8 mm
(2")
76.2 mm
(3")
762 mm
(30")
42.9 mm (1.69")
42.9 mm (1.69")
676.28 mm
(26.63")
203.2 mm (8")
Figure 2.5 - Pedestal Reinforcement Details
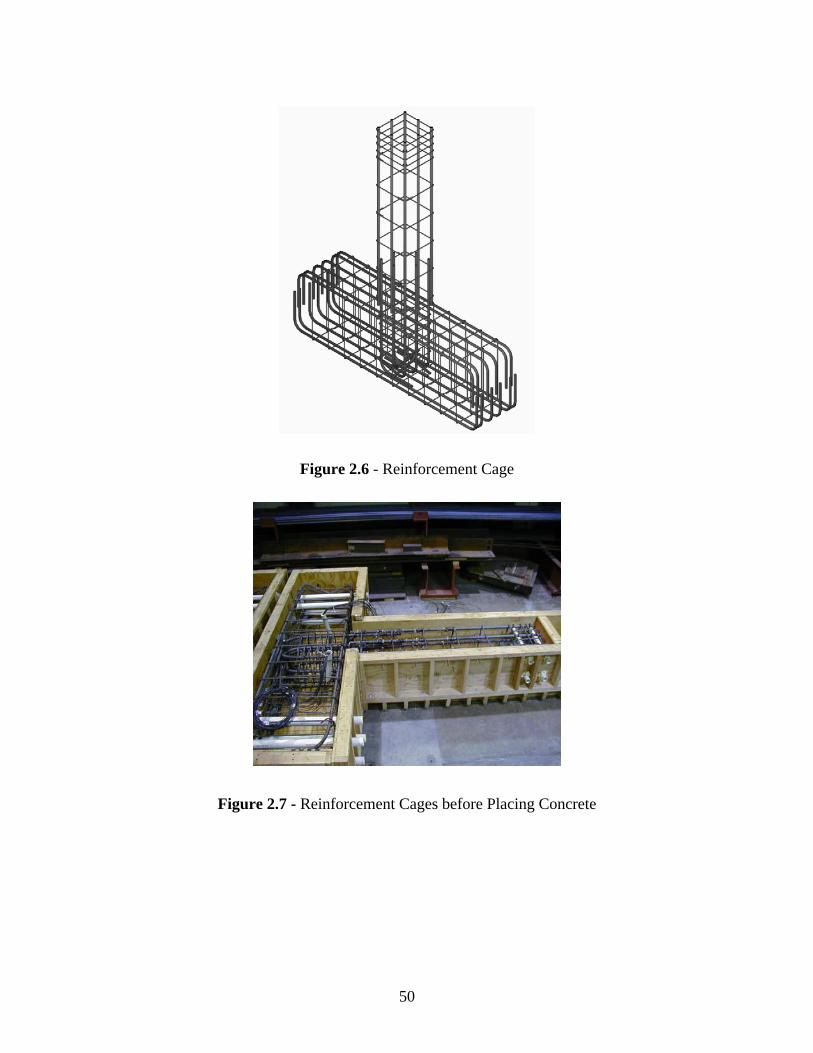
50
Figure 2.6 - Reinforcement Cage
Figure 2.7 - Reinforcement Cages before Placing Concrete
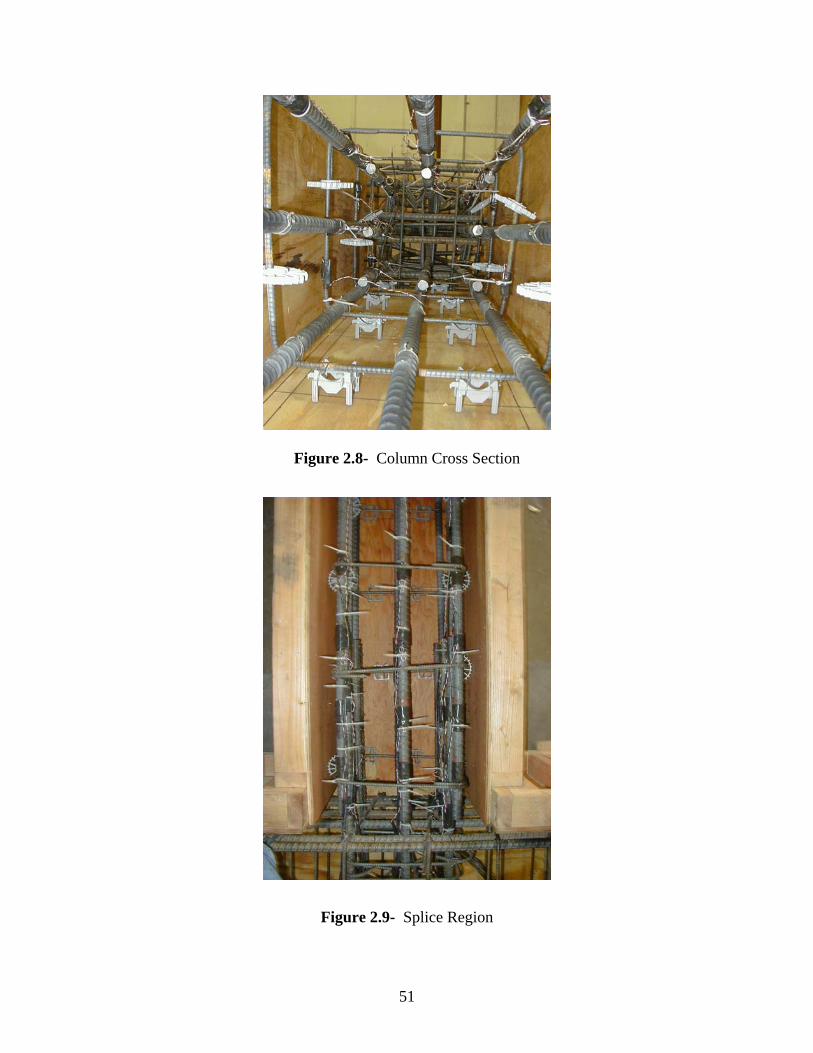
51
Figure 2.8- Column Cross Section
Figure 2.9- Splice Region
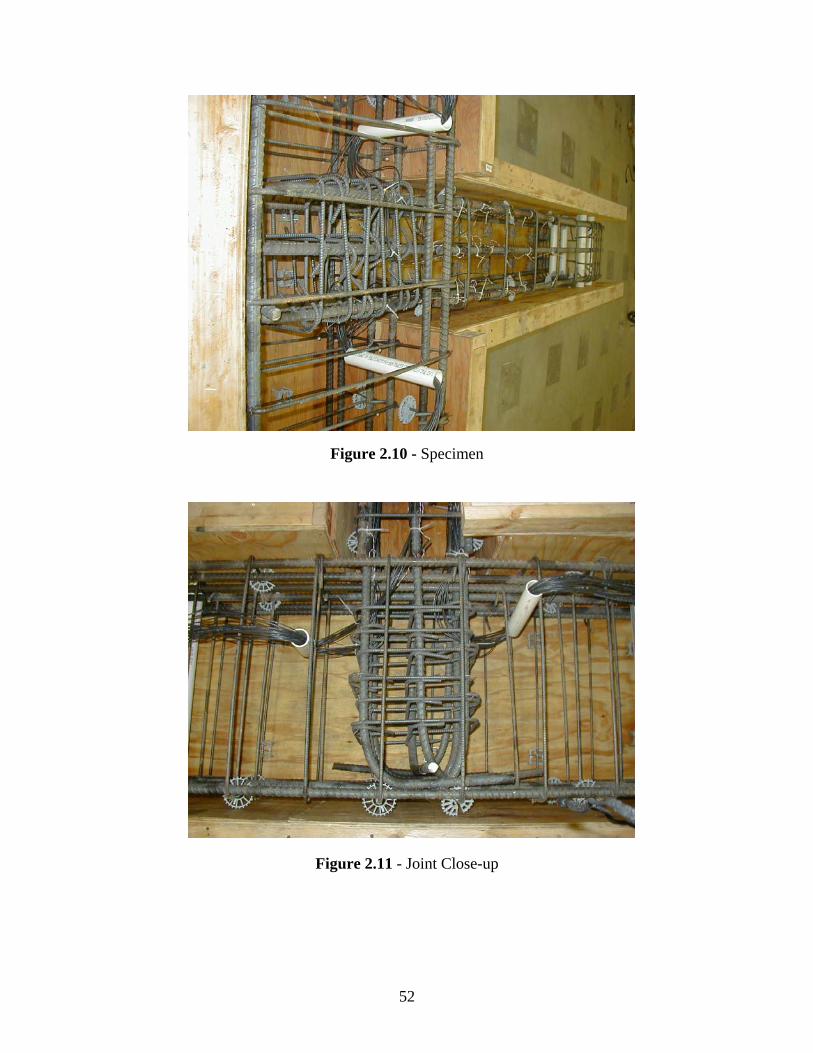
52
Figure 2.10 - Specimen
Figure 2.11 - Joint Close-up
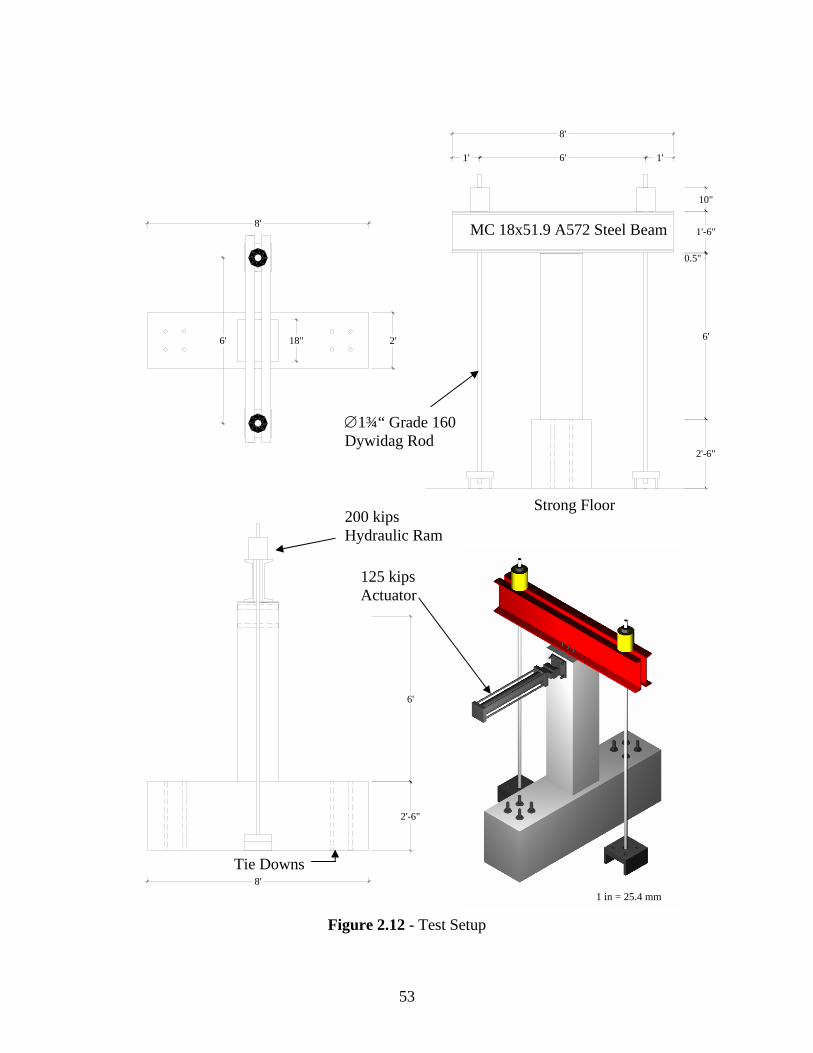
53
Figure 2.12 - Test Setup
6'
2'-6"
8'
2'
8'
6' 18"
2'-6"
6'
1'-6"
0.5"
10"
6'1' 1'
8'
∅1¾“ Grade 160 Dywidag Rod
MC 18x51.9 A572 Steel Beam
200 kips Hydraulic Ram
125 kips Actuator
Strong Floor
Tie Downs
1 in = 25.4 mm
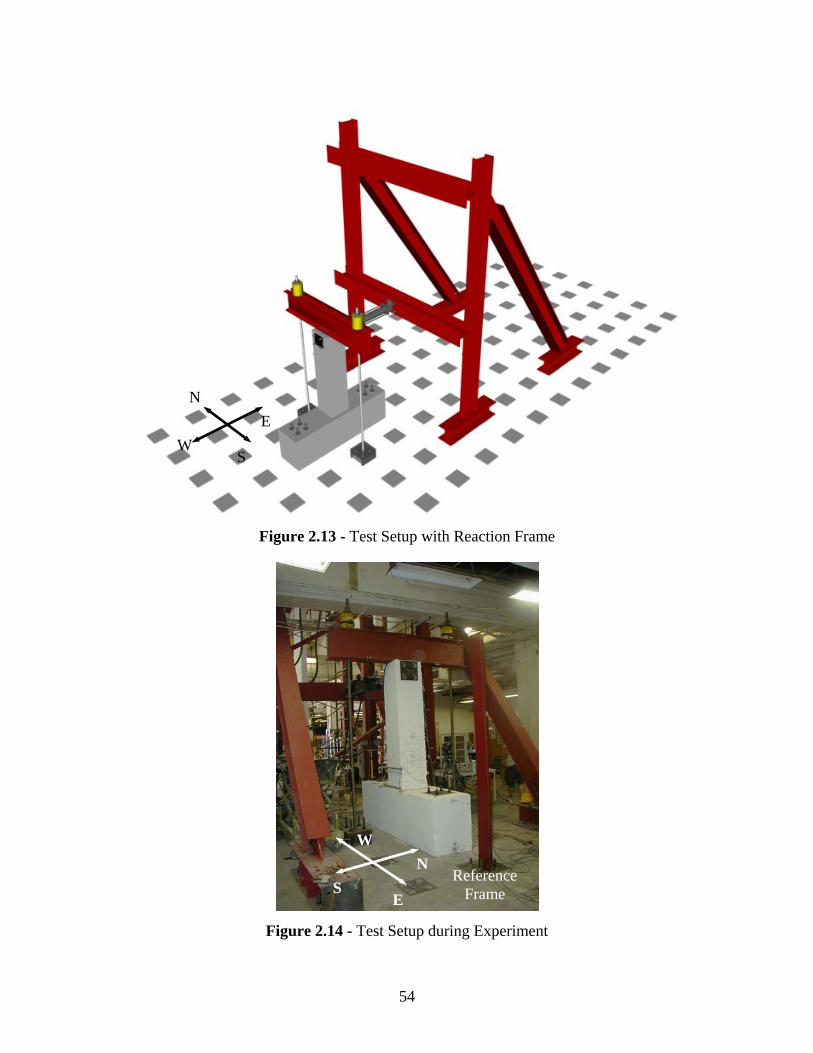
54
Figure 2.13 - Test Setup with Reaction Frame
Figure 2.14 - Test Setup during Experiment
W
N
S
E
W
S N
E Reference
Frame

55
Figure 2.15 - Actuator Control Schematic
LOAD CELL
MTS 407
Controller
MTS
Microprofiler
input signal
PUMP
Manifold
OUT
IN
ACTUATOR
SERVO
IN OUT DAQ
TEMPESONIC TRANSDUCER output signal
output signal
Input Signal (Voltage)
Output Signal (Voltage)
Hydraulic Pressure (IN)
Hydraulic Pressure (OUT)
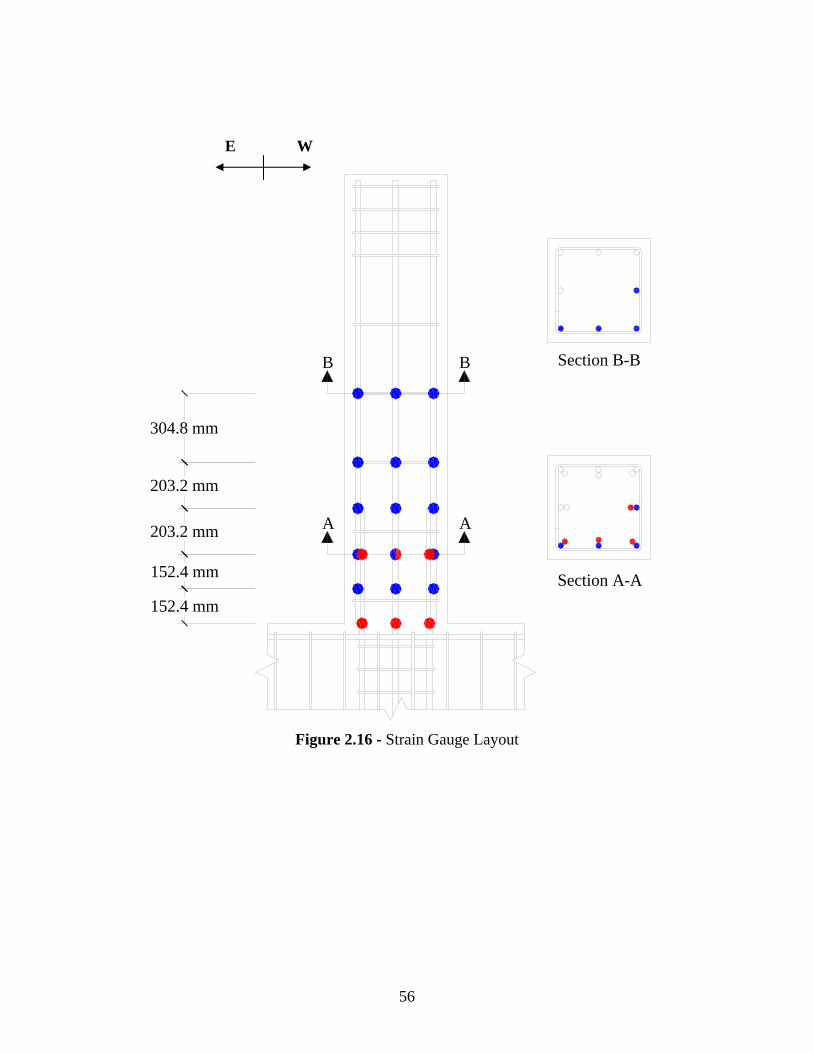
56
Figure 2.16 - Strain Gauge Layout
Section A-A
Section B-BB
A
B
A
152.4 mm
152.4 mm
203.2 mm
203.2 mm
304.8 mm
E W
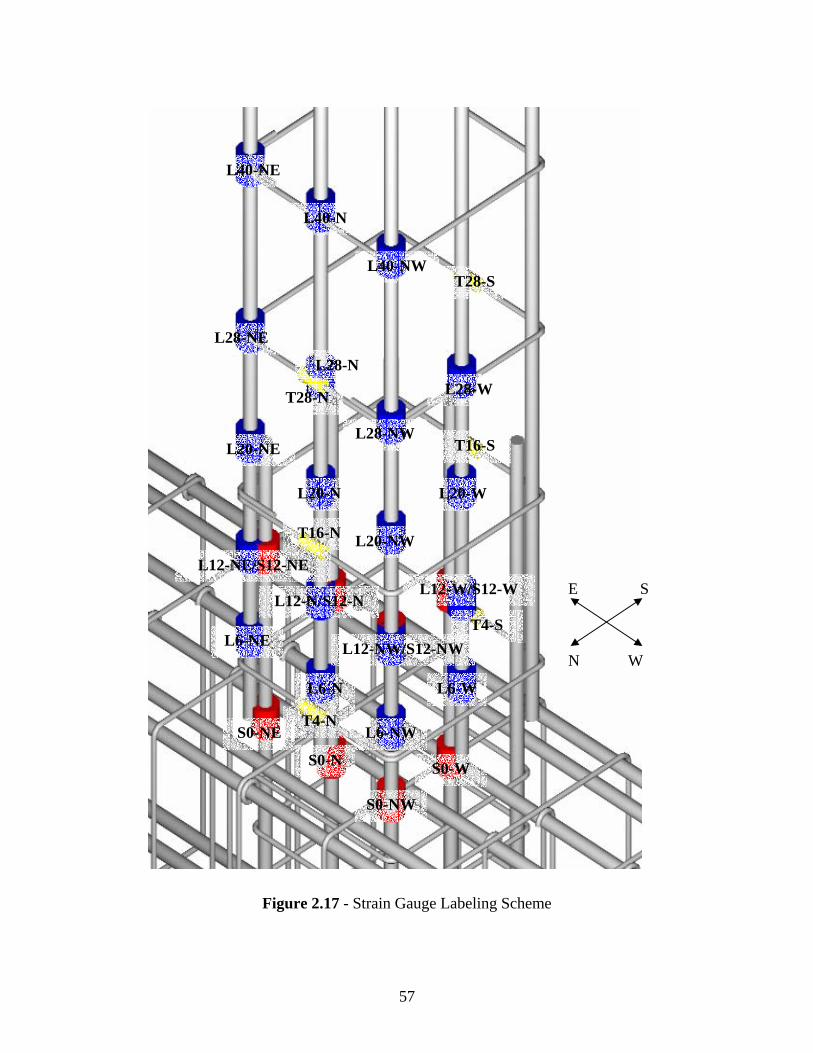
57
Figure 2.17 - Strain Gauge Labeling Scheme
S0-NE
L20-N
L28-NW
L6-W
L12-NE/S12-NE L20-NW
L20-W
L20-NE
L6-NW
L6-N
L6-NE
S0-N
S0-NW
S0-W
L12-N/S12-N
L12-NW/S12-NW
L12-W/S12-W
L28-NE
L28-W L28-N
L40-NW
L40-NE
L40-N
T28-S
T16-S
T16-N
T28-N
T4-S
T4-N
N
E
W
S
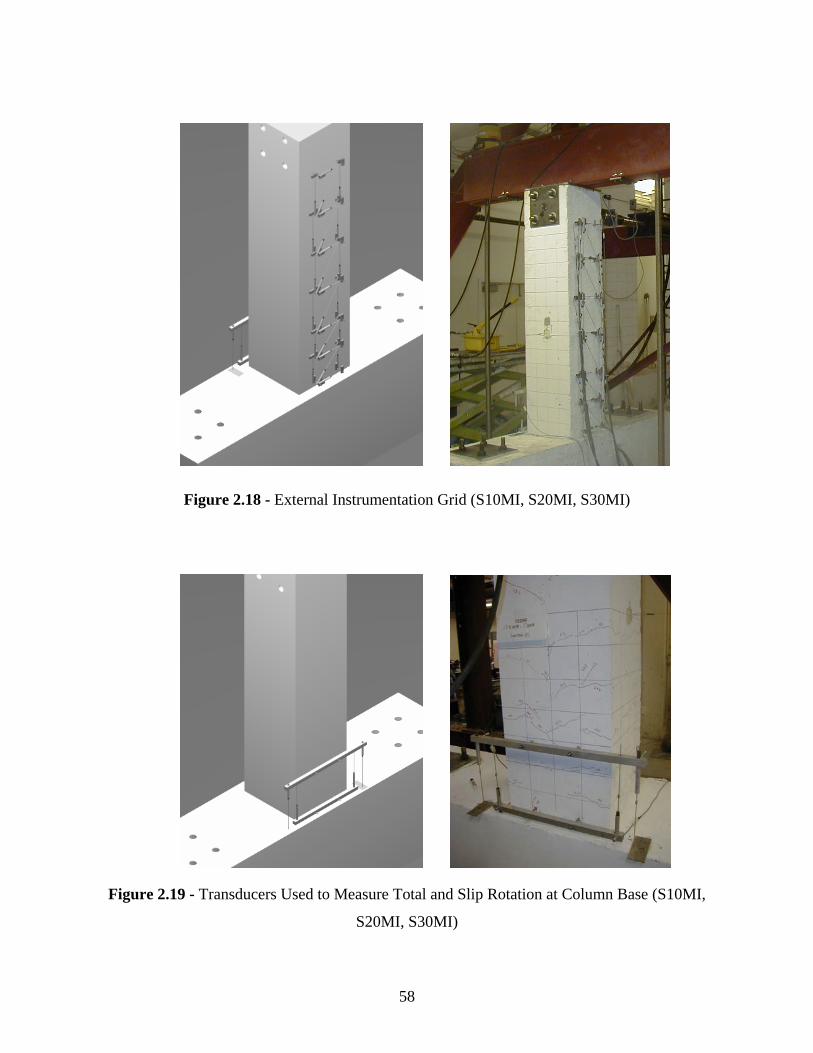
58
Figure 2.18 - External Instrumentation Grid (S10MI, S20MI, S30MI)
Figure 2.19 - Transducers Used to Measure Total and Slip Rotation at Column Base (S10MI,
S20MI, S30MI)
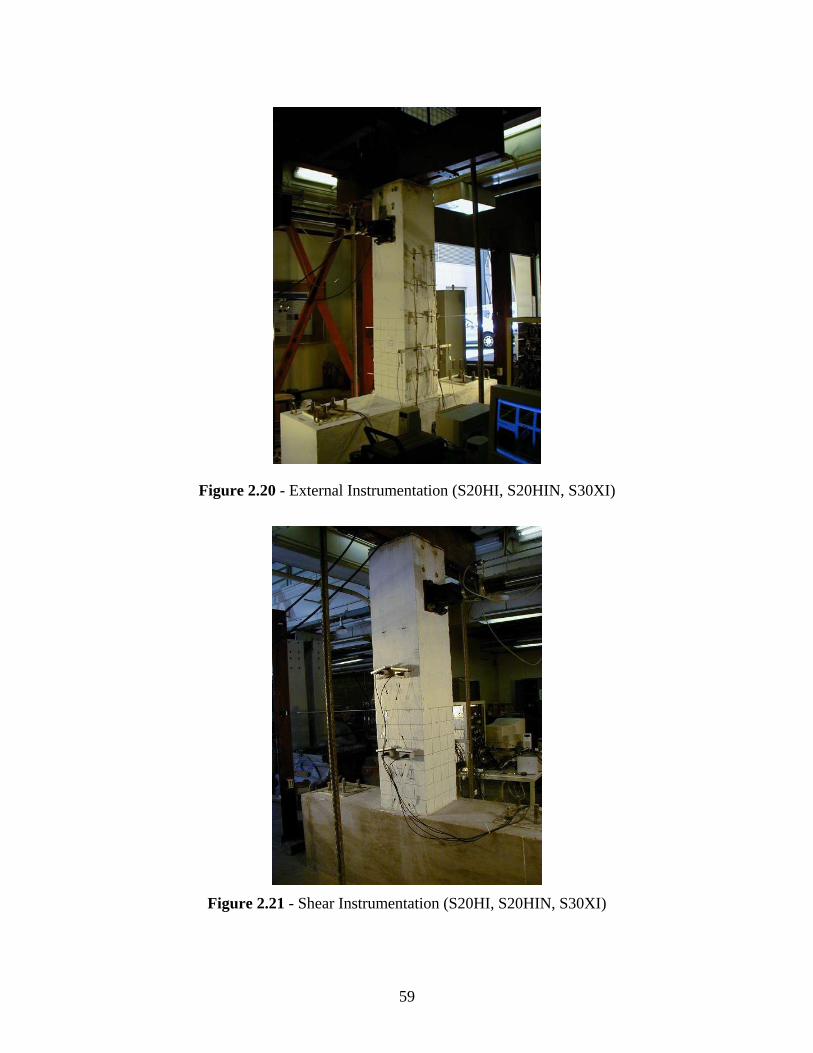
59
Figure 2.20 - External Instrumentation (S20HI, S20HIN, S30XI)
Figure 2.21 - Shear Instrumentation (S20HI, S20HIN, S30XI)

60
EH5
L9 D5F
H6
L11 D6
L10
L12
H7
L8L7 D4
SL1B H2
1PR1 A
H1L1 D1
2
PR2L2
L5 D3
CL3 D2
H3
DH4
L6
L4
SL3 SL4 SL2
G
yx
yx
Figure 2.22 - External Instrumentation Layout (S10MI, S20MI, S30MI)
D
L3
L5
L1
1PR1A
C
B
PR2
2
L4
L2SL1
L6
SL2
L9
L7E
F
L8
L10
D4
D2 D1
D3
3 4
yx
yx
Figure 2.23 - External Instrumentation Layout (S20HI, S20HIN, S30XI)
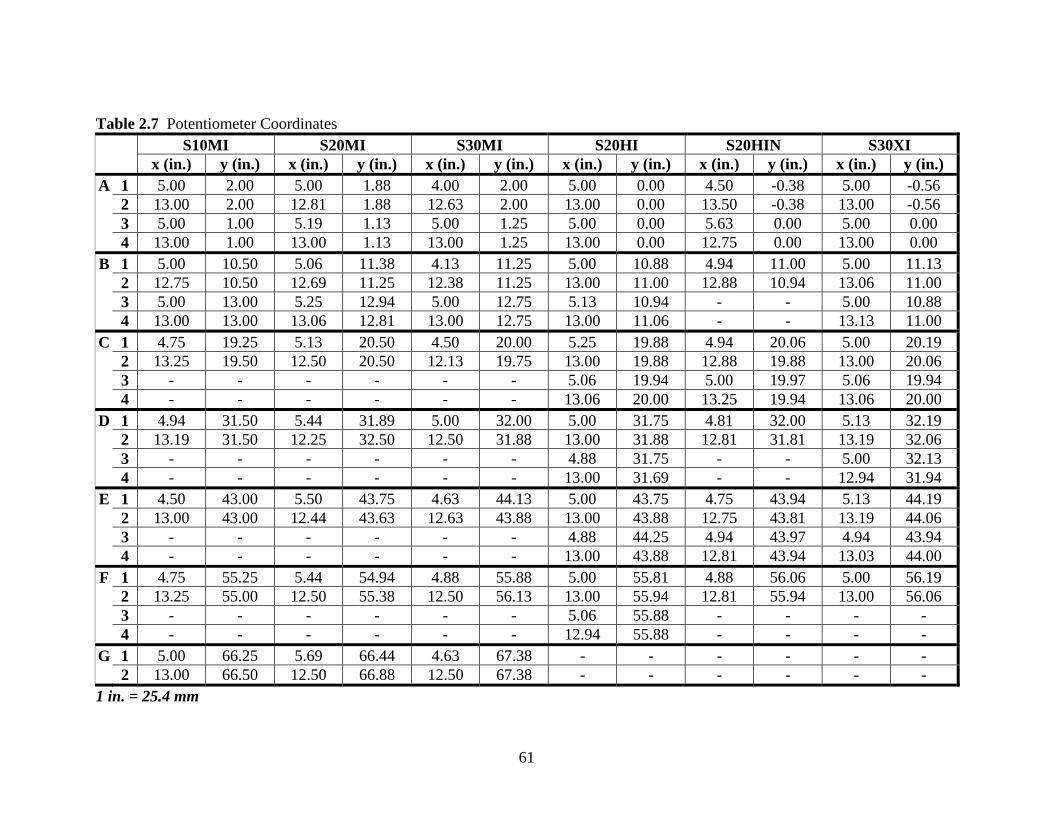
61
Table 2.7 Potentiometer Coordinates
S10MI S20MI S30MI S20HI S20HIN S30XI x (in.) y (in.) x (in.) y (in.) x (in.) y (in.) x (in.) y (in.) x (in.) y (in.) x (in.) y (in.)
A 1 5.00 2.00 5.00 1.88 4.00 2.00 5.00 0.00 4.50 -0.38 5.00 -0.56 2 13.00 2.00 12.81 1.88 12.63 2.00 13.00 0.00 13.50 -0.38 13.00 -0.56 3 5.00 1.00 5.19 1.13 5.00 1.25 5.00 0.00 5.63 0.00 5.00 0.00 4 13.00 1.00 13.00 1.13 13.00 1.25 13.00 0.00 12.75 0.00 13.00 0.00
B 1 5.00 10.50 5.06 11.38 4.13 11.25 5.00 10.88 4.94 11.00 5.00 11.13 2 12.75 10.50 12.69 11.25 12.38 11.25 13.00 11.00 12.88 10.94 13.06 11.00 3 5.00 13.00 5.25 12.94 5.00 12.75 5.13 10.94 - - 5.00 10.88 4 13.00 13.00 13.06 12.81 13.00 12.75 13.00 11.06 - - 13.13 11.00
C 1 4.75 19.25 5.13 20.50 4.50 20.00 5.25 19.88 4.94 20.06 5.00 20.19 2 13.25 19.50 12.50 20.50 12.13 19.75 13.00 19.88 12.88 19.88 13.00 20.06 3 - - - - - - 5.06 19.94 5.00 19.97 5.06 19.94 4 - - - - - - 13.06 20.00 13.25 19.94 13.06 20.00
D 1 4.94 31.50 5.44 31.89 5.00 32.00 5.00 31.75 4.81 32.00 5.13 32.19 2 13.19 31.50 12.25 32.50 12.50 31.88 13.00 31.88 12.81 31.81 13.19 32.06 3 - - - - - - 4.88 31.75 - - 5.00 32.13 4 - - - - - - 13.00 31.69 - - 12.94 31.94
E 1 4.50 43.00 5.50 43.75 4.63 44.13 5.00 43.75 4.75 43.94 5.13 44.19 2 13.00 43.00 12.44 43.63 12.63 43.88 13.00 43.88 12.75 43.81 13.19 44.06 3 - - - - - - 4.88 44.25 4.94 43.97 4.94 43.94 4 - - - - - - 13.00 43.88 12.81 43.94 13.03 44.00
F 1 4.75 55.25 5.44 54.94 4.88 55.88 5.00 55.81 4.88 56.06 5.00 56.19 2 13.25 55.00 12.50 55.38 12.50 56.13 13.00 55.94 12.81 55.94 13.00 56.06 3 - - - - - - 5.06 55.88 - - - - 4 - - - - - - 12.94 55.88 - - - -
G 1 5.00 66.25 5.69 66.44 4.63 67.38 - - - - - - 2 13.00 66.50 12.50 66.88 12.50 67.38 - - - - - -
1 in. = 25.4 mm
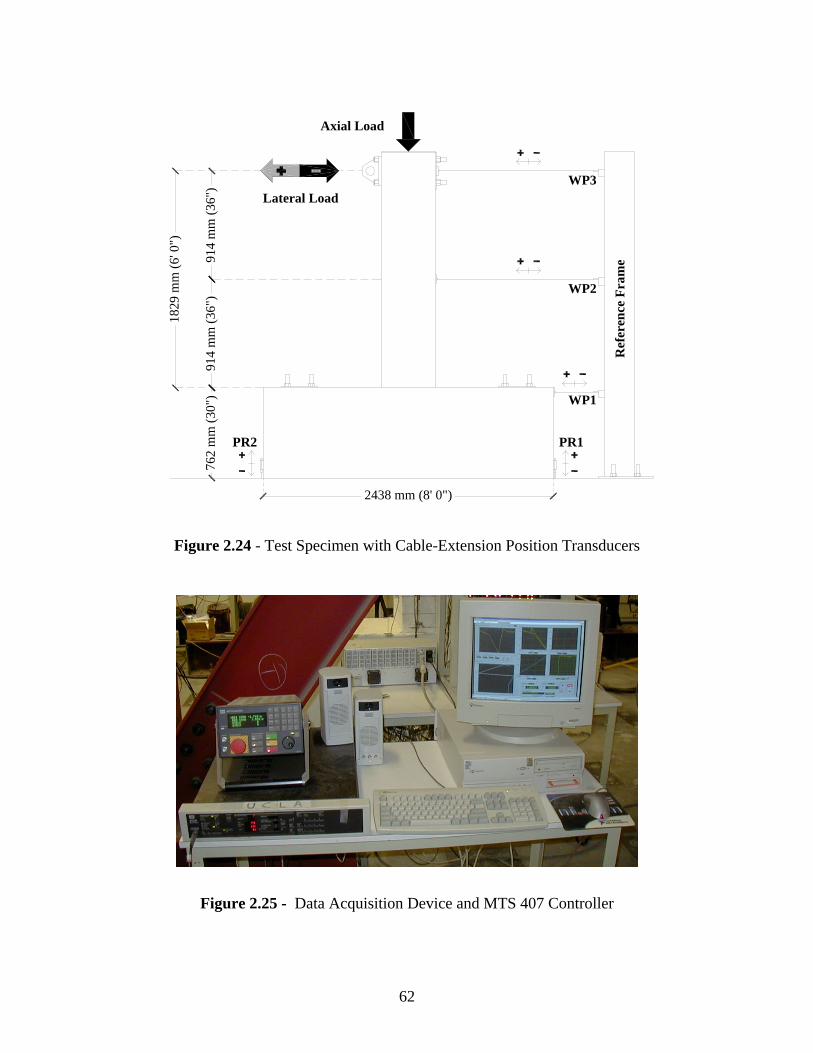
62
Figure 2.24 - Test Specimen with Cable-Extension Position Transducers
Figure 2.25 - Data Acquisition Device and MTS 407 Controller
914
mm
(36"
)91
4 m
m (3
6")
762
mm
(30"
)
1829
mm
(6' 0
")
2438 mm (8' 0")
Ref
eren
ce F
ram
e
WP3
WP2
WP1
PR1PR2
Lateral Load
Axial Load
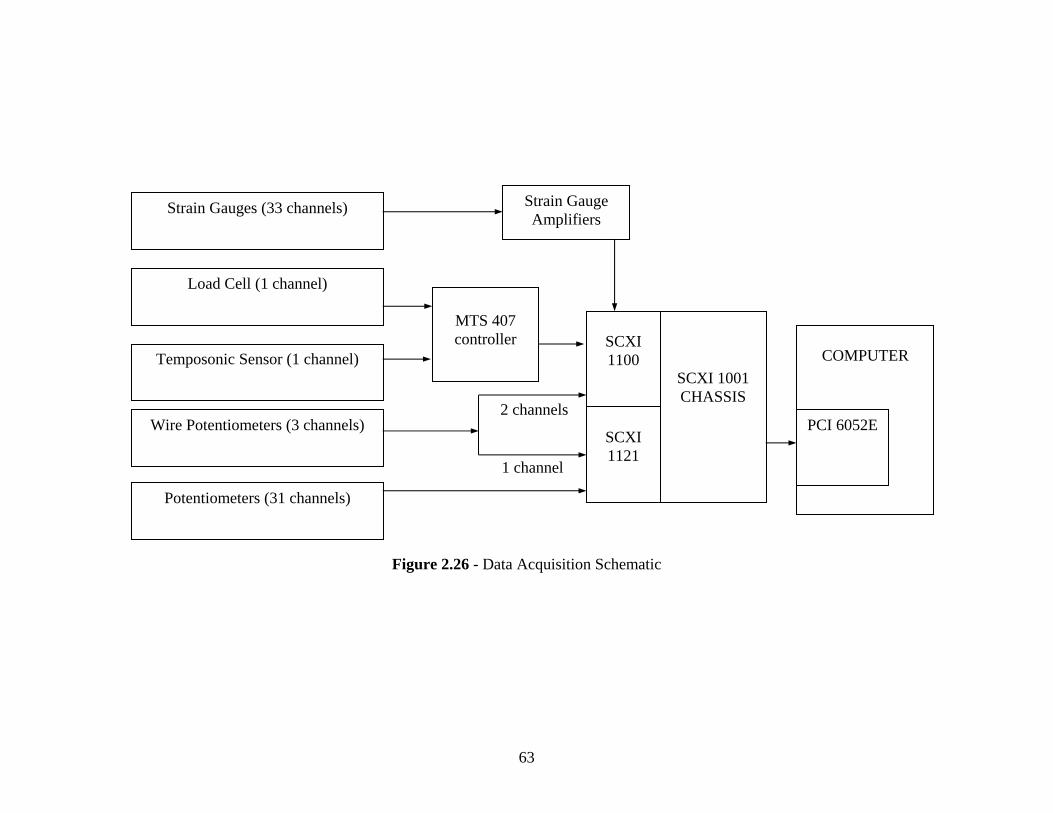
63
Figure 2.26 - Data Acquisition Schematic
COMPUTER
Strain Gauges (33 channels)
Potentiometers (31 channels)
Wire Potentiometers (3 channels)
Temposonic Sensor (1 channel)
Load Cell (1 channel)
Strain Gauge Amplifiers
SCXI 1001 CHASSIS
SCXI 1100
SCXI 1121
PCI 6052E
1 channel
2 channels
MTS 407 controller
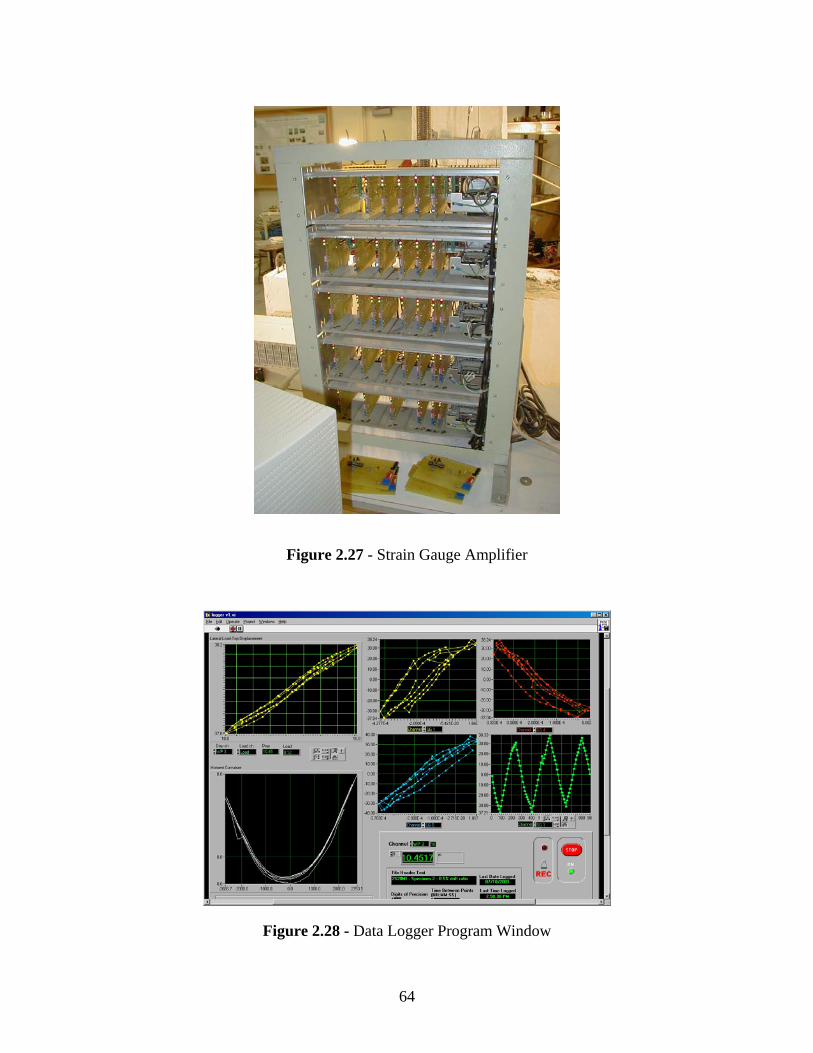
64
Figure 2.27 - Strain Gauge Amplifier
Figure 2.28 - Data Logger Program Window

65
Figure 2.29 - Standard Displacement History
Figure 2.30 - Near-Fault Displacement History
0 200 400 600 800 1000 1200
Data Point Number
-12
-8
-4
0
4
8
12
Late
ral D
rift (
%)
0 200 400 600 800 1000 1200
Data Point Number
-12
-8
-4
0
4
8
12
Late
ral D
rift (
%)

66
Table 2.8 Data Point Numbers (S10MI, S20MI, S30MI, S20HI, S30XI) Lateral Drift (%) 1st Cycle 2nd Cycle 3rd Cycle
-0.10 9 41 73 0.10 25 57 89 -0.25 105 137 169 0.25 121 153 185 -0.50 201 233 265 0.50 217 249 281 -0.75 297 329 361 0.75 313 345 377 -1.00 393 425 457 1.00 409 441 473 -1.50 489 521 553 1.50 505 537 569 -2.00 585 617 649 2.00 601 633 665 -3.00 681 713 745 3.00 697 729 761 -5.00 777 809 841 5.00 793 825 857 -7.00 873 905 937 7.00 889 921 953
-10.00 969 1001 1033 10.00 985 1017 1049
Table 2.9 Data Point Numbers (S20HIN) Lateral Drift (%) 1st Cycle 2nd Cycle 3rd Cycle
-0.10 9 41 73 0.10 25 57 89 -0.25 105 137 169 0.25 121 153 185 -0.50 201 233 265 0.50 217 249 281 -1.00 297 329 361 1.00 313 345 377 -1.50 393 - - 1.50 409 - - 2.00 412 - - 3.00 417 - - 4.50 425 - - 6.00 432 - - 7.50 440 - - 9.00 447 - - 12.00 460 - -
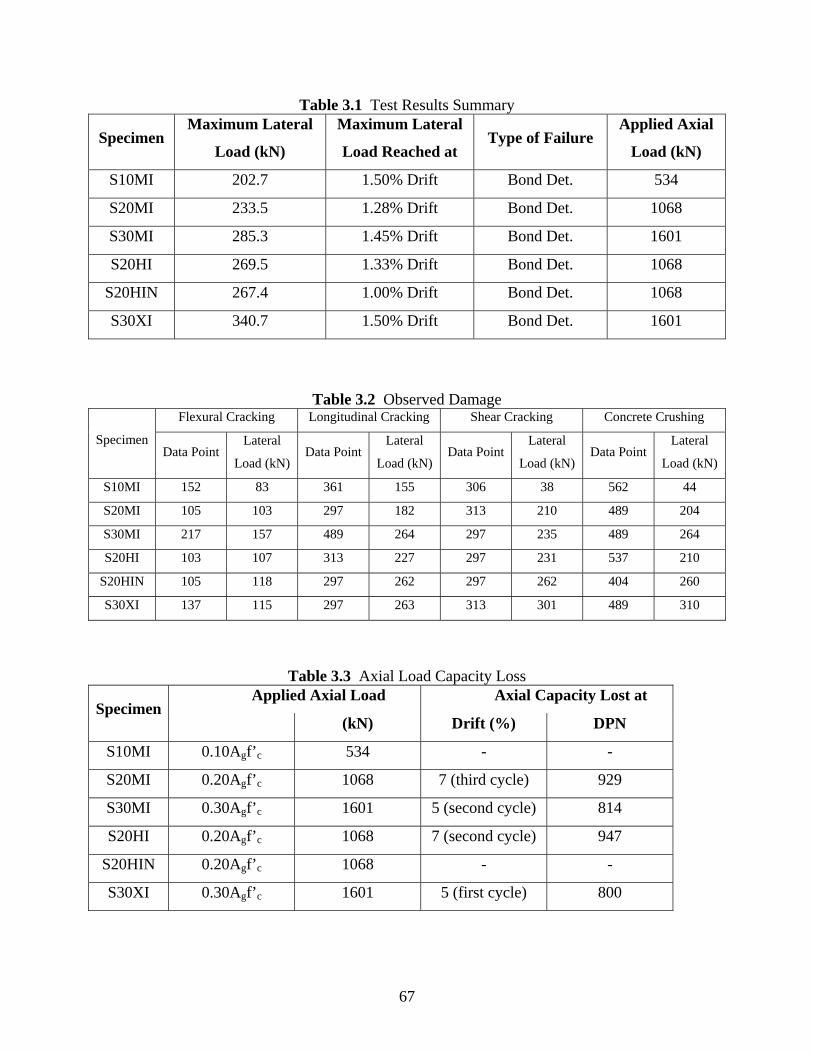
67
Table 3.1 Test Results Summary
Specimen Maximum Lateral
Load (kN)
Maximum Lateral
Load Reached at Type of Failure
Applied Axial
Load (kN)
S10MI 202.7 1.50% Drift Bond Det. 534
S20MI 233.5 1.28% Drift Bond Det. 1068
S30MI 285.3 1.45% Drift Bond Det. 1601
S20HI 269.5 1.33% Drift Bond Det. 1068
S20HIN 267.4 1.00% Drift Bond Det. 1068
S30XI 340.7 1.50% Drift Bond Det. 1601
Table 3.2 Observed Damage Flexural Cracking Longitudinal Cracking Shear Cracking Concrete Crushing
Specimen Data Point
Lateral
Load (kN) Data Point
Lateral
Load (kN) Data Point
Lateral
Load (kN) Data Point
Lateral
Load (kN)
S10MI 152 83 361 155 306 38 562 44
S20MI 105 103 297 182 313 210 489 204
S30MI 217 157 489 264 297 235 489 264
S20HI 103 107 313 227 297 231 537 210
S20HIN 105 118 297 262 297 262 404 260
S30XI 137 115 297 263 313 301 489 310
Table 3.3 Axial Load Capacity Loss Applied Axial Load Axial Capacity Lost at
Specimen (kN) Drift (%) DPN
S10MI 0.10Agf’c 534 - -
S20MI 0.20Agf’c 1068 7 (third cycle) 929
S30MI 0.30Agf’c 1601 5 (second cycle) 814
S20HI 0.20Agf’c 1068 7 (second cycle) 947
S20HIN 0.20Agf’c 1068 - -
S30XI 0.30Agf’c 1601 5 (first cycle) 800

68
Figure 3.1 - Longitudinal Cracks Indicating Bond Deterioration (S20HI at 1.5% Drift) (Left)
Figure 3.2 - Longitudinal and Shear Cracking (S20HIN at 5.8% Drift) (Right)
Figure 3.3 - Concrete Spalling (S30XI at 3% Drift)
20d b
splic
e le
ngth
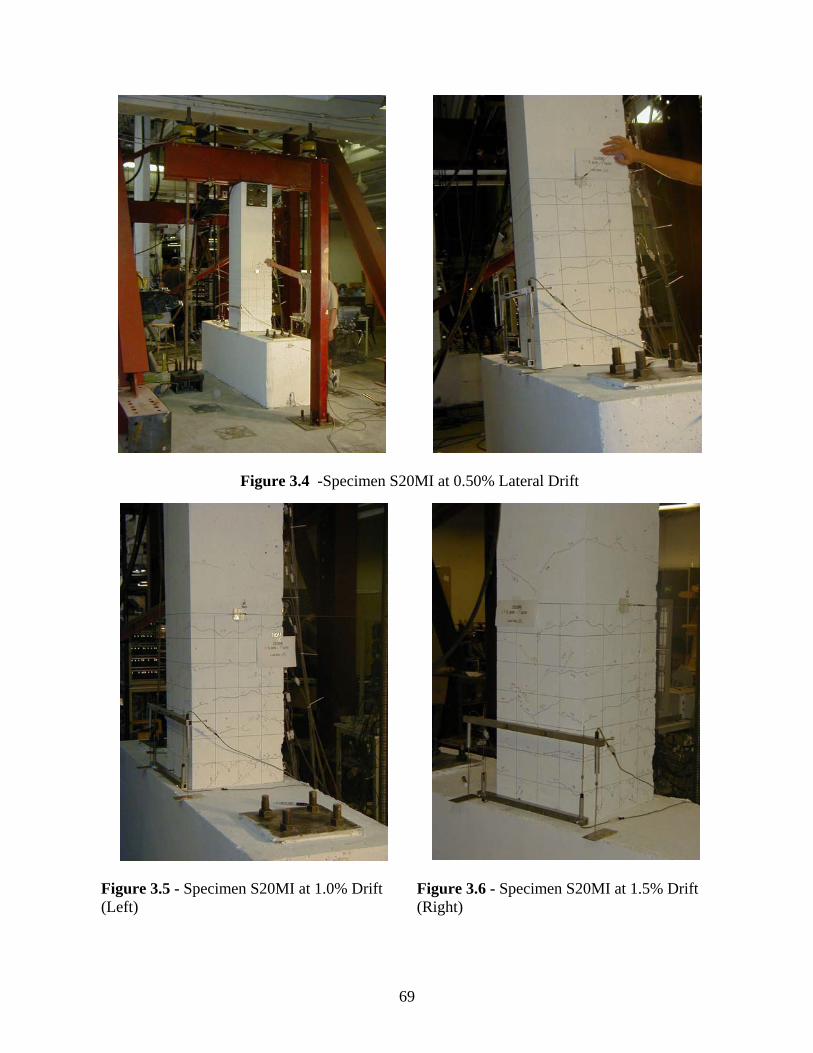
69
Figure 3.4 -Specimen S20MI at 0.50% Lateral Drift
Figure 3.5 - Specimen S20MI at 1.0% Drift (Left)
Figure 3.6 - Specimen S20MI at 1.5% Drift (Right)
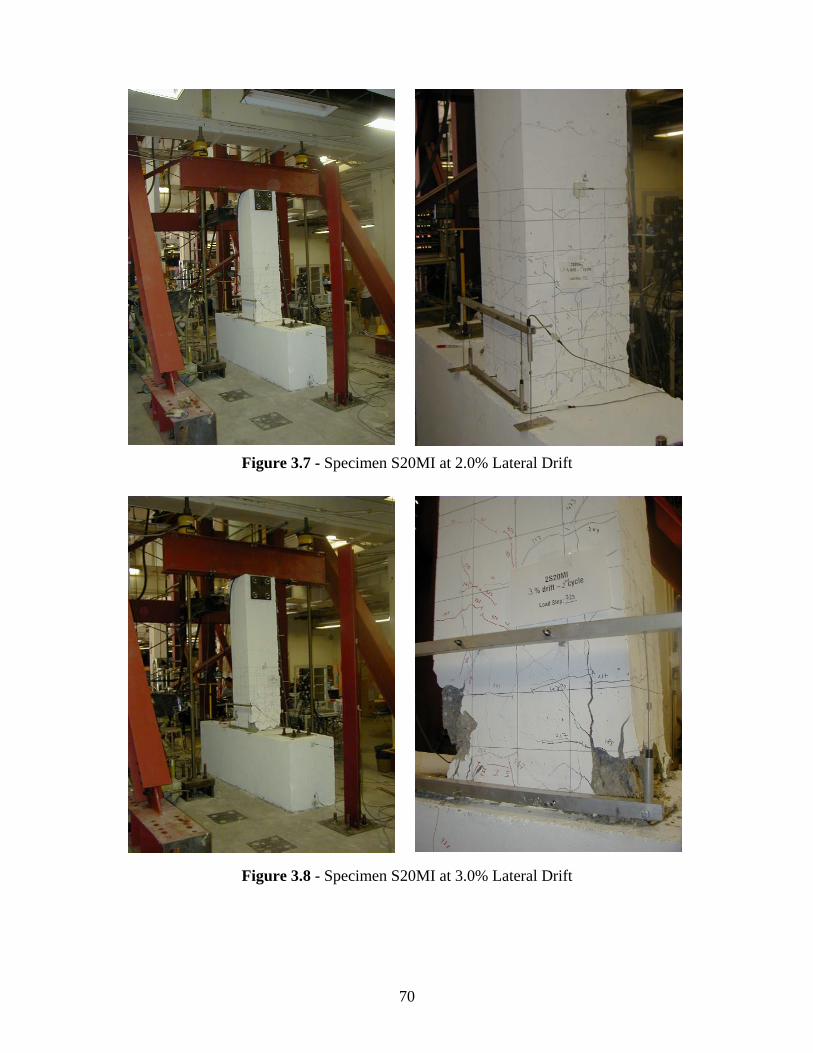
70
Figure 3.7 - Specimen S20MI at 2.0% Lateral Drift
Figure 3.8 - Specimen S20MI at 3.0% Lateral Drift
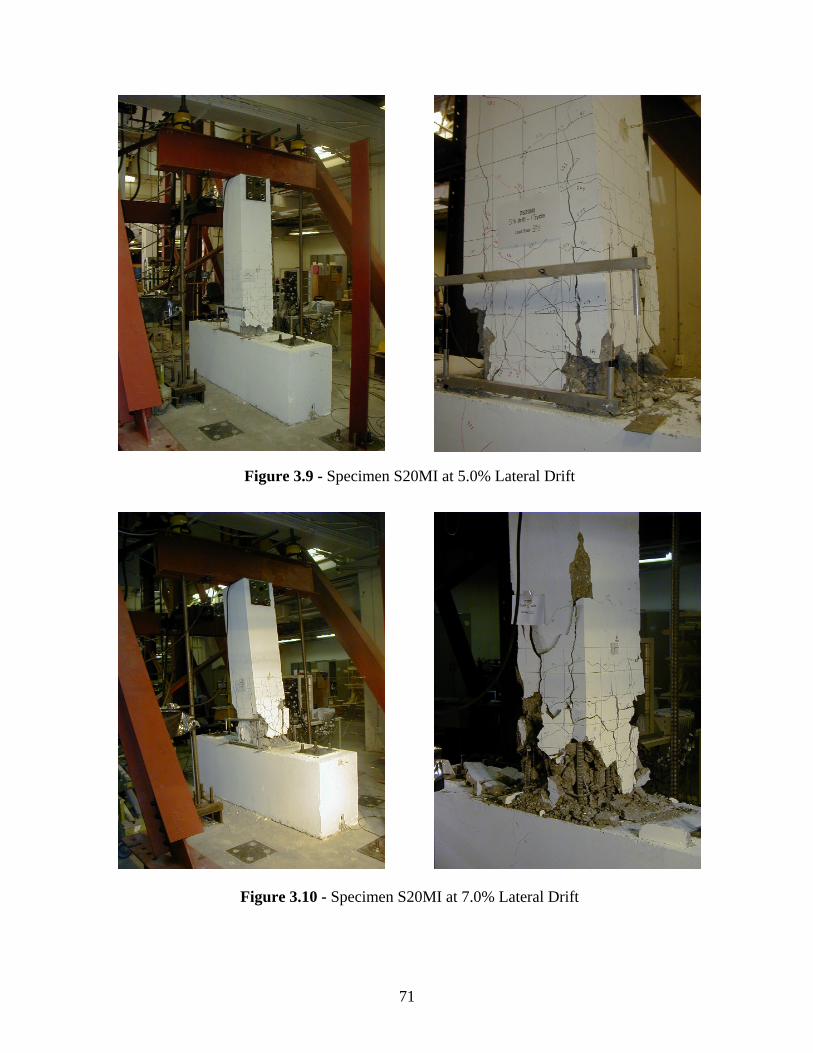
71
Figure 3.9 - Specimen S20MI at 5.0% Lateral Drift
Figure 3.10 - Specimen S20MI at 7.0% Lateral Drift
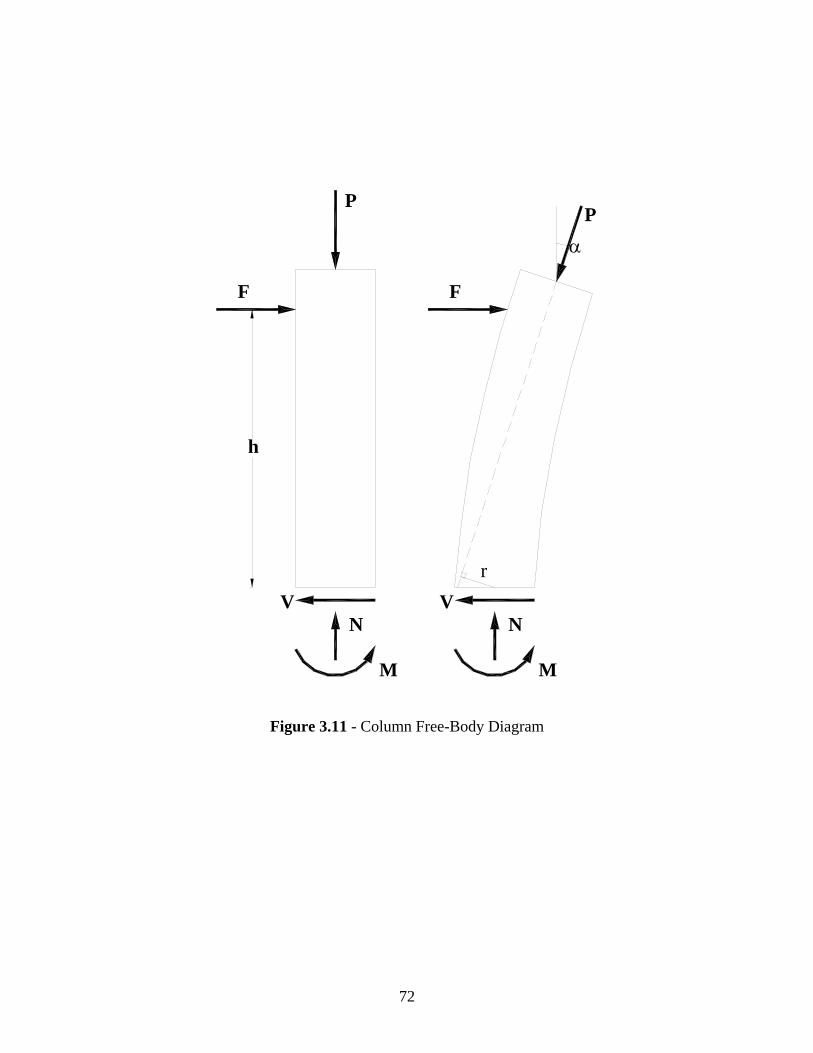
72
Figure 3.11 - Column Free-Body Diagram
h
V
M
N
F
P
VN
r
M
F
α
P
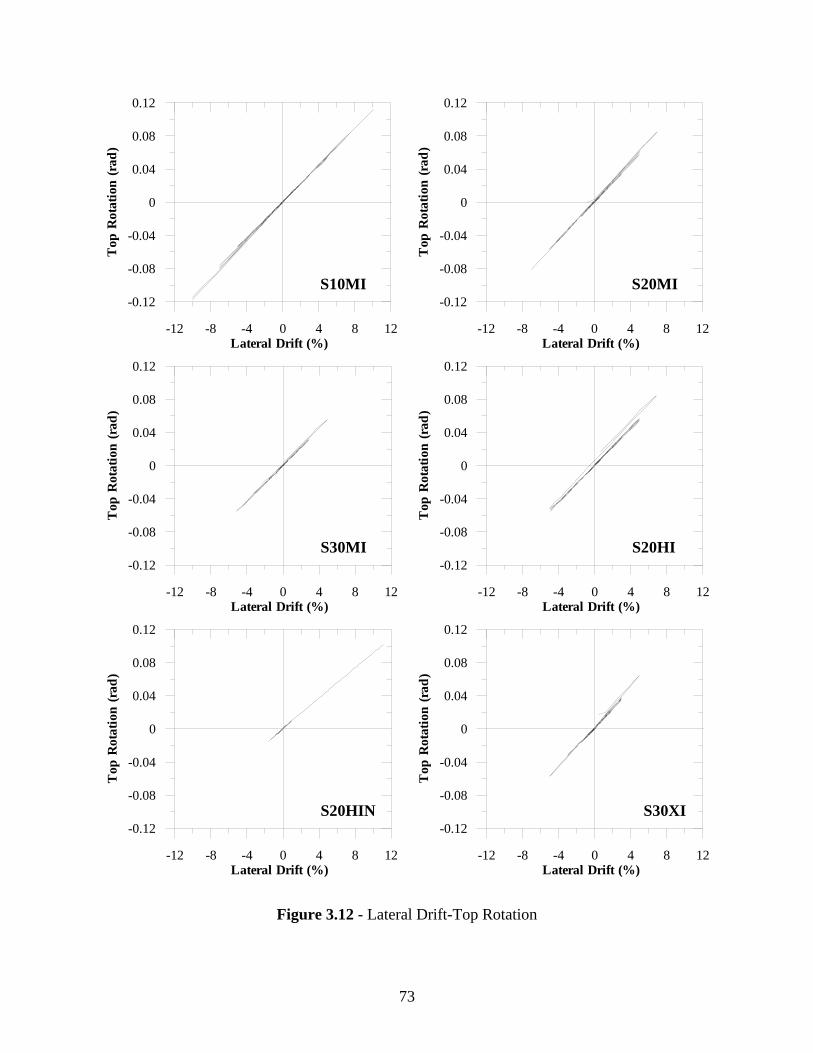
73
Figure 3.12 - Lateral Drift-Top Rotation
-12 -8 -4 0 4 8 12Lateral Drift (%)
-0.12
-0.08
-0.04
0
0.04
0.08
0.12T
op R
otat
ion
(rad
)
S10MI
-12 -8 -4 0 4 8 12Lateral Drift (%)
-0.12
-0.08
-0.04
0
0.04
0.08
0.12
Top
Rot
atio
n (r
ad)
S20MI
-12 -8 -4 0 4 8 12Lateral Drift (%)
-0.12
-0.08
-0.04
0
0.04
0.08
0.12
Top
Rot
atio
n (r
ad)
S30MI
-12 -8 -4 0 4 8 12Lateral Drift (%)
-0.12
-0.08
-0.04
0
0.04
0.08
0.12
Top
Rot
atio
n (r
ad)
S20HI
-12 -8 -4 0 4 8 12Lateral Drift (%)
-0.12
-0.08
-0.04
0
0.04
0.08
0.12
Top
Rot
atio
n (r
ad)
S20HIN
-12 -8 -4 0 4 8 12Lateral Drift (%)
-0.12
-0.08
-0.04
0
0.04
0.08
0.12
Top
Rot
atio
n (r
ad)
S30XI
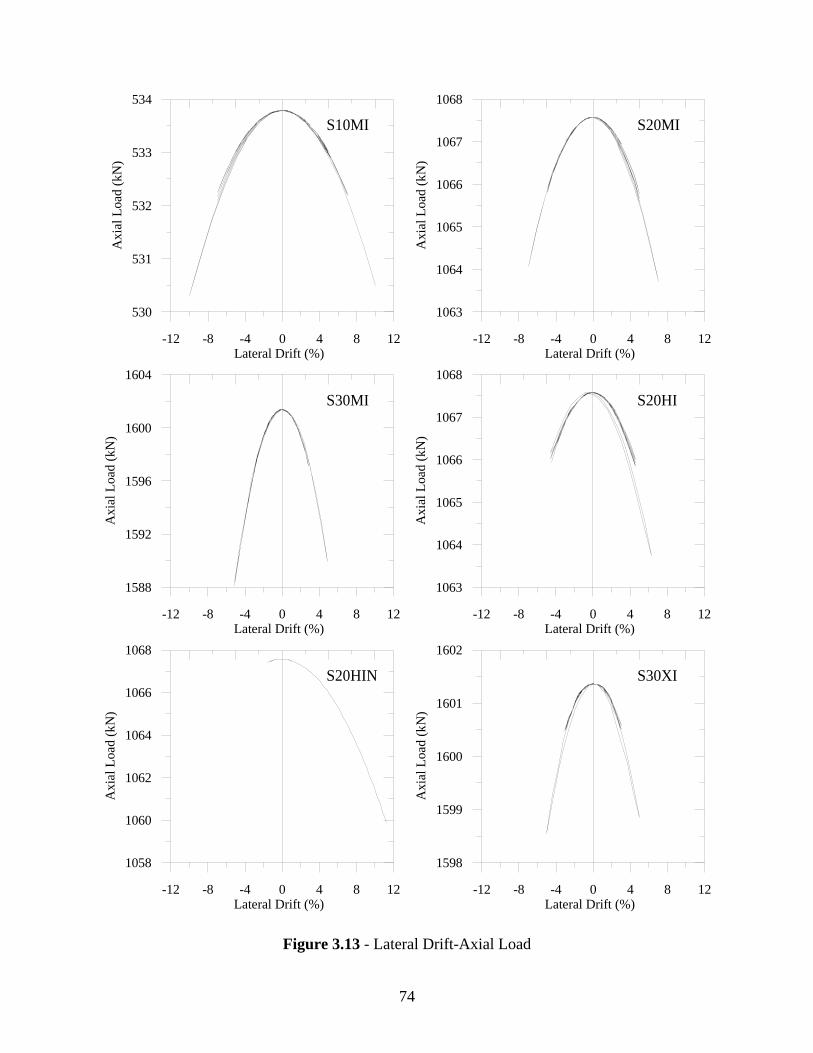
74
Figure 3.13 - Lateral Drift-Axial Load
-12 -8 -4 0 4 8 12Lateral Drift (%)
530
531
532
533
534A
xial
Loa
d (k
N)
-12 -8 -4 0 4 8 12Lateral Drift (%)
1063
1064
1065
1066
1067
1068
Axi
al L
oad
(kN
)
-12 -8 -4 0 4 8 12Lateral Drift (%)
1588
1592
1596
1600
1604
Axi
al L
oad
(kN
)
-12 -8 -4 0 4 8 12Lateral Drift (%)
1063
1064
1065
1066
1067
1068
Axi
al L
oad
(kN
)
-12 -8 -4 0 4 8 12Lateral Drift (%)
1058
1060
1062
1064
1066
1068
Axi
al L
oad
(kN
)S10MI S20MI
S30MI S20HI
S20HIN
-12 -8 -4 0 4 8 12Lateral Drift (%)
1598
1599
1600
1601
1602
Axi
al L
oad
(kN
)
S30XI
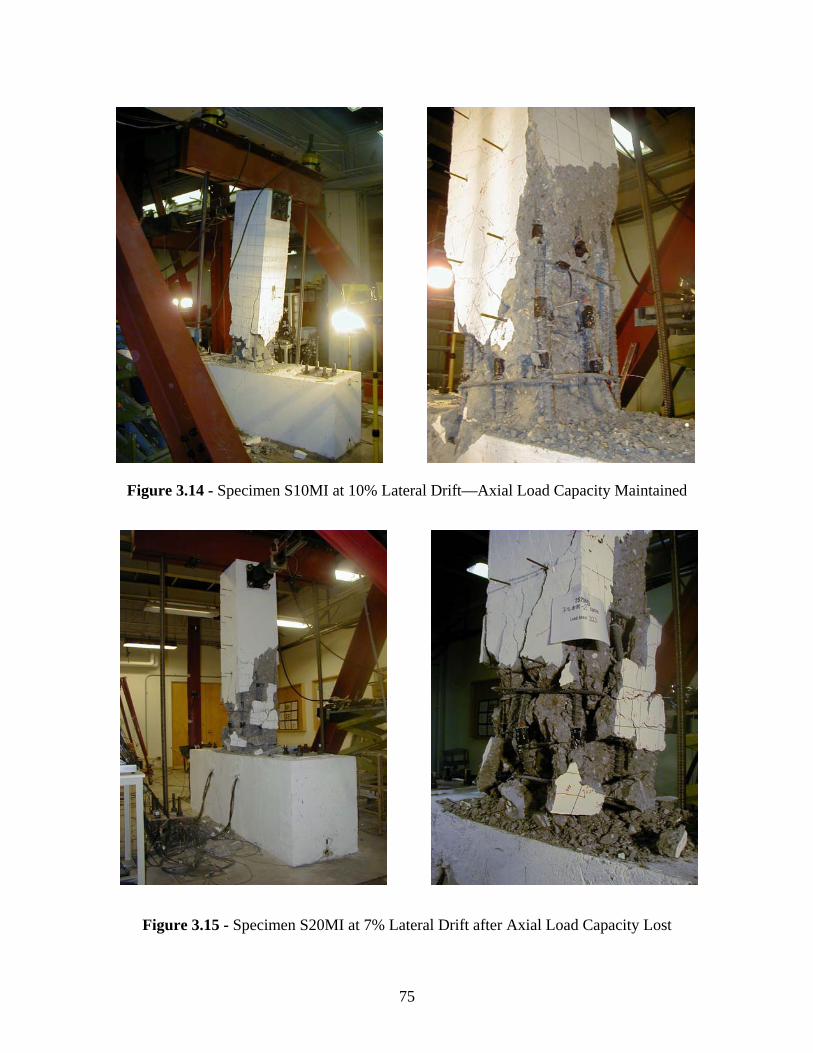
75
Figure 3.14 - Specimen S10MI at 10% Lateral Drift—Axial Load Capacity Maintained
Figure 3.15 - Specimen S20MI at 7% Lateral Drift after Axial Load Capacity Lost
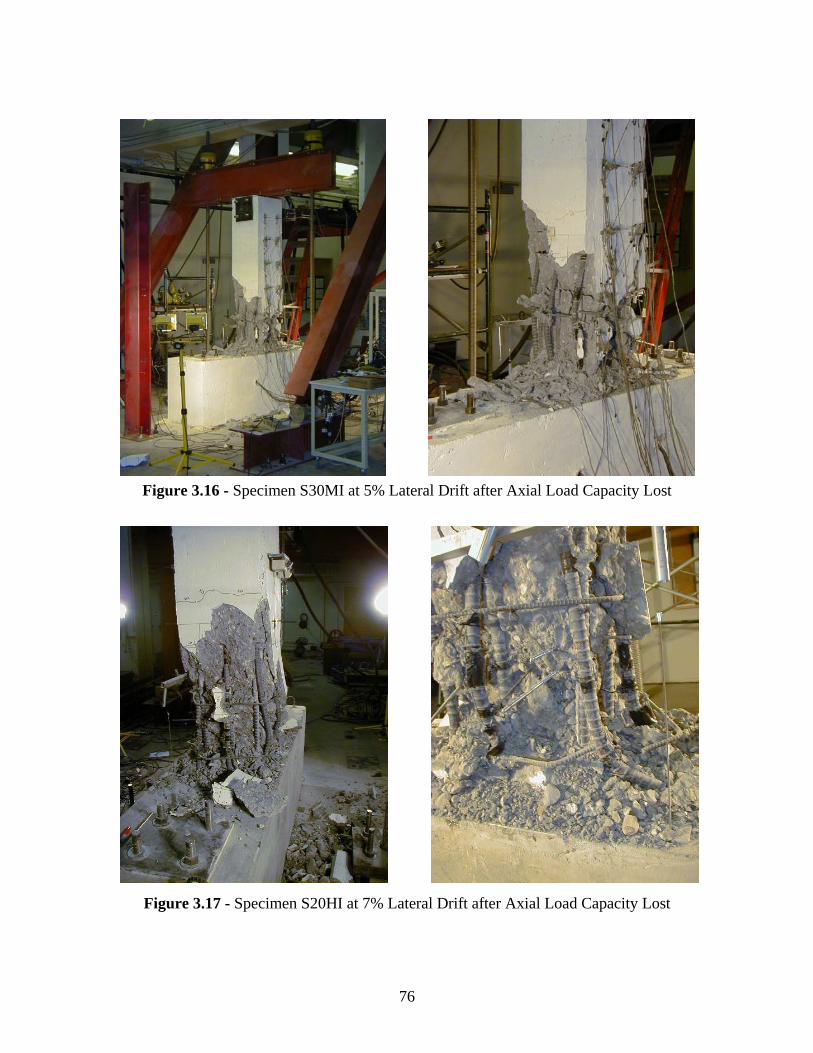
76
Figure 3.16 - Specimen S30MI at 5% Lateral Drift after Axial Load Capacity Lost
Figure 3.17 - Specimen S20HI at 7% Lateral Drift after Axial Load Capacity Lost

77
Figure 3.18 - Specimen S20HIN at 12% Lateral Drift—Axial Load Capacity Maintained
Figure 3.19 - Specimen S30XI at 5% Lateral Drift after Axial Load Capacity Lost

78
Figure 3.20- Top Displacement due to Pedestal Rotation
-0.15
-0.1
-0.05
0
0.05
0.1
0.15
-0.15
-0.1
-0.05
0
0.05
0.1
0.15
0 200 400 600 800 1000 1200Data Point Number
-0.15
-0.1
-0.05
0
0.05
0.1
0.15
Lat
eral
Top
Dis
plac
emen
t due
to P
edes
tal R
otat
ion(
mm
)S10MI
S20MI
S30MI
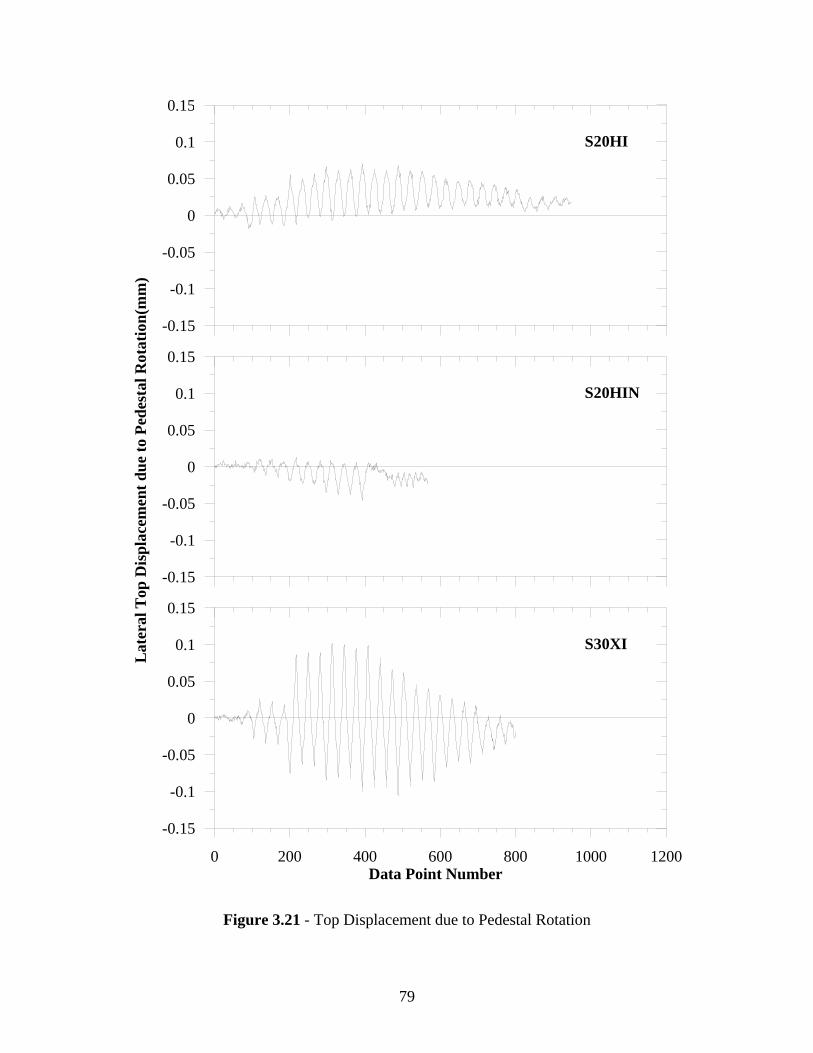
79
Figure 3.21 - Top Displacement due to Pedestal Rotation
-0.15
-0.1
-0.05
0
0.05
0.1
0.15
-0.15
-0.1
-0.05
0
0.05
0.1
0.15
0 200 400 600 800 1000 1200Data Point Number
-0.15
-0.1
-0.05
0
0.05
0.1
0.15
Lat
eral
Top
Dis
plac
emen
t due
to P
edes
tal R
otat
ion(
mm
)S20HI
S20HIN
S30XI
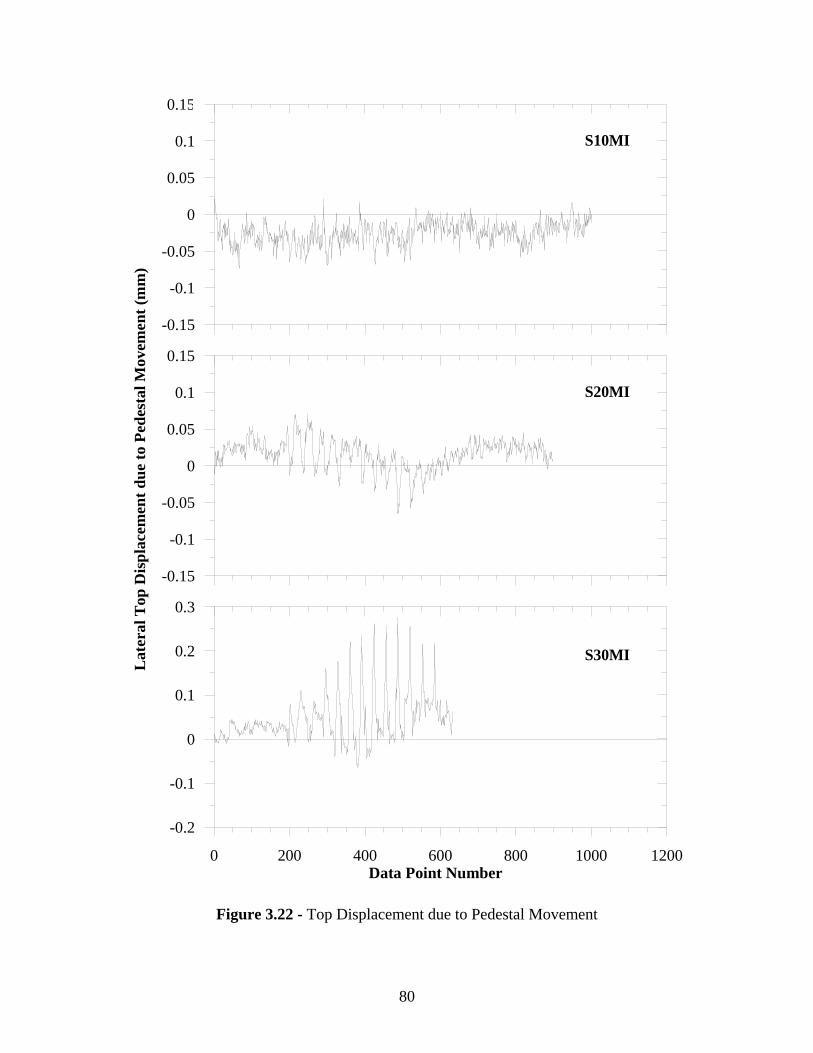
80
Figure 3.22 - Top Displacement due to Pedestal Movement
-0.15
-0.1
-0.05
0
0.05
0.1
0.15
-0.15
-0.1
-0.05
0
0.05
0.1
0.15
0 200 400 600 800 1000 1200Data Point Number
-0.2
-0.1
0
0.1
0.2
0.3
Lat
eral
Top
Dis
plac
emen
t due
to P
edes
tal M
ovem
ent (
mm
)S10MI
S20MI
S30MI

81
Figure 3.23 - Top Displacement due to Pedestal Movement
-0.15
-0.1
-0.05
0
0.05
0.1
0.15
-0.15
-0.1
-0.05
0
0.05
0.1
0.15
0 200 400 600 800 1000 1200Data Point Number
-0.15
-0.1
-0.05
0
0.05
0.1
0.15
Lat
eral
Top
Dis
plac
emen
t due
to P
edes
tal M
ovem
ent (
mm
)S20HI
S20HIN
S30XI
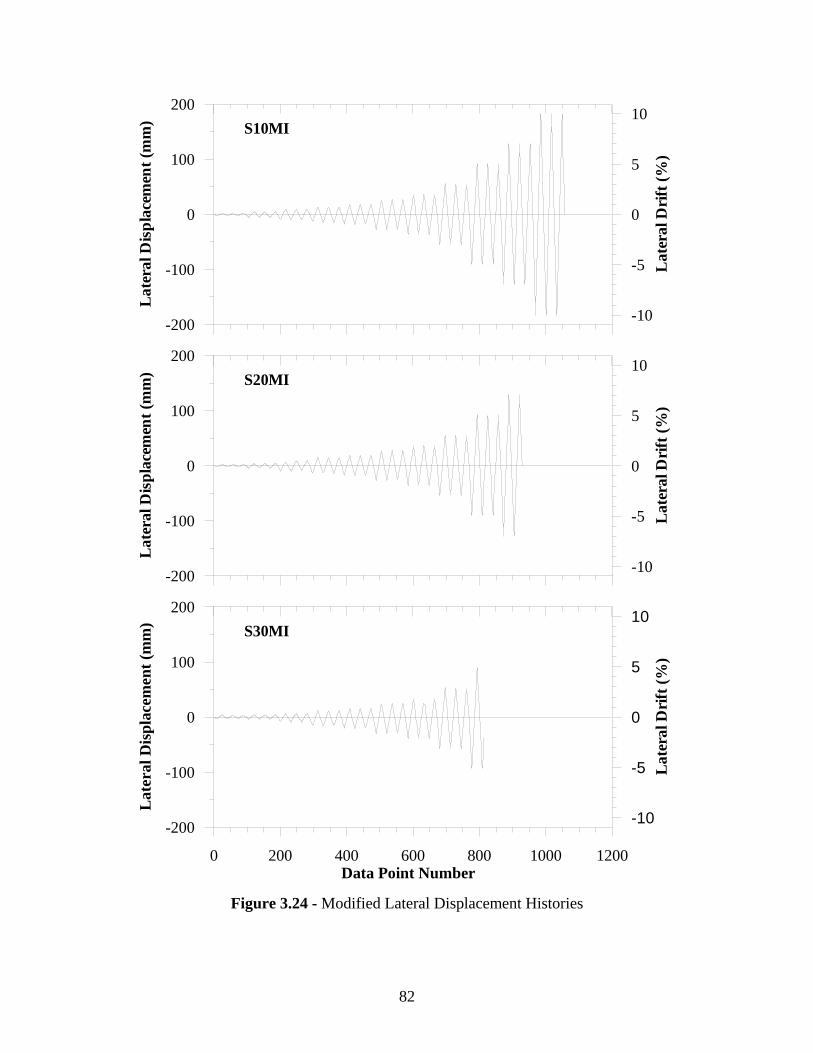
82
Figure 3.24 - Modified Lateral Displacement Histories
-200
-100
0
100
200
Lat
eral
Dis
plac
emen
t (m
m)
-10
-5
0
5
10
Lat
eral
Dri
ft (%
)
-200
-100
0
100
200
Lat
eral
Dis
plac
emen
t (m
m)
-10
-5
0
5
10
Lat
eral
Dri
ft (%
)
0 200 400 600 800 1000 1200Data Point Number
-200
-100
0
100
200
Lat
eral
Dis
plac
emen
t (m
m)
-10
-5
0
5
10
Lat
eral
Dri
ft (%
)
S10MI
S20MI
S30MI
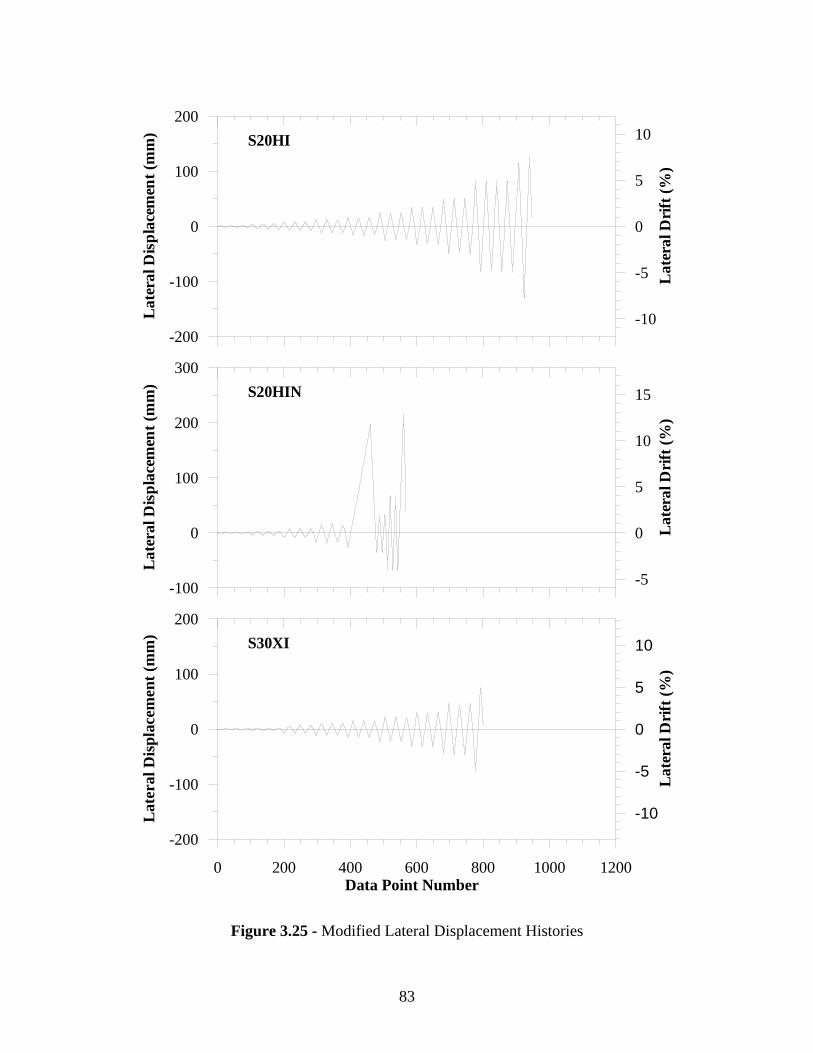
83
Figure 3.25 - Modified Lateral Displacement Histories
-200
-100
0
100
200
Lat
eral
Dis
plac
emen
t (m
m)
-10
-5
0
5
10
Lat
eral
Dri
ft (%
)
-100
0
100
200
300
Lat
eral
Dis
plac
emen
t (m
m)
-5
0
5
10
15
Lat
eral
Dri
ft (%
)
0 200 400 600 800 1000 1200Data Point Number
-200
-100
0
100
200
Lat
eral
Dis
plac
emen
t (m
m)
-10
-5
0
5
10L
ater
al D
rift
(%)
S20HI
S20HIN
S30XI

84
Figure 3.26 - Specimen S10MI Lateral Load-Top Displacement
Figure 3.27 - Specimen S20MI Lateral Load-Top Displacement
-200 -150 -100 -50 0 50 100 150 200Lateral Displacement (mm)
-400
-300
-200
-100
0
100
200
300
400
Lat
eral
Loa
d (k
N)
-12 -8 -4 0 4 8 12Lateral Drift (%)
-80
-60
-40
-20
0
20
40
60
80
Lat
eral
Loa
d (k
ips)
-200 -150 -100 -50 0 50 100 150 200Lateral Displacement (mm)
-400
-300
-200
-100
0
100
200
300
400
Lat
eral
Loa
d (k
N)
-12 -8 -4 0 4 8 12Lateral Drift (%)
-80
-60
-40
-20
0
20
40
60
80
Lat
eral
Loa
d (k
ips)

85
Figure 3.28 - Specimen S30MI Lateral Load-Top Displacement
Figure 3.29 - Specimen S20HI Lateral Load-Top Displacement
-200 -150 -100 -50 0 50 100 150 200Lateral Displacement (mm)
-400
-300
-200
-100
0
100
200
300
400L
ater
al L
oad
(kN
)
-12 -8 -4 0 4 8 12Lateral Drift (%)
-80
-60
-40
-20
0
20
40
60
80
Lat
eral
Loa
d (k
ips)
-200 -150 -100 -50 0 50 100 150 200Lateral Displacement (mm)
-400
-300
-200
-100
0
100
200
300
400
Lat
eral
Loa
d (k
N)
-12 -8 -4 0 4 8 12Lateral Drift (%)
-80
-60
-40
-20
0
20
40
60
80
Lat
eral
Loa
d (k
ips)
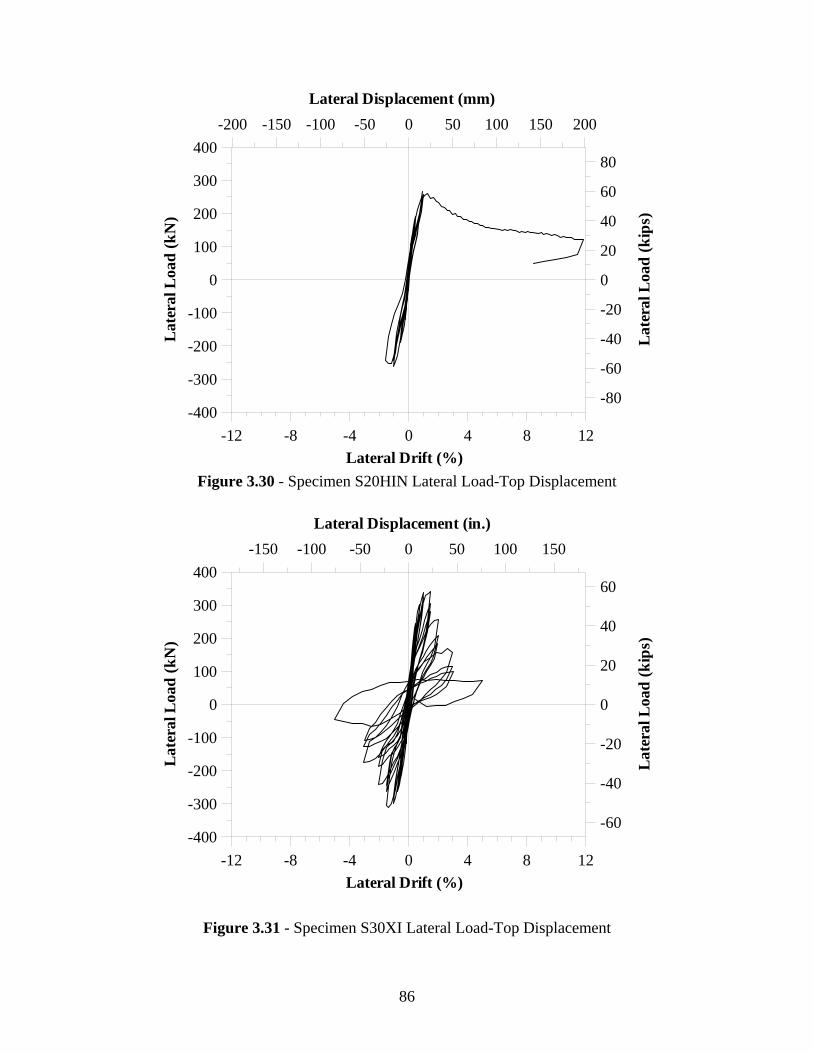
86
Figure 3.30 - Specimen S20HIN Lateral Load-Top Displacement
Figure 3.31 - Specimen S30XI Lateral Load-Top Displacement
-150 -100 -50 0 50 100 150Lateral Displacement (in.)
-400
-300
-200
-100
0
100
200
300
400
Lat
eral
Loa
d (k
N)
-12 -8 -4 0 4 8 12Lateral Drift (%)
-60
-40
-20
0
20
40
60
Lat
eral
Loa
d (k
ips)
-200 -150 -100 -50 0 50 100 150 200Lateral Displacement (mm)
-400
-300
-200
-100
0
100
200
300
400L
ater
al L
oad
(kN
)
-12 -8 -4 0 4 8 12Lateral Drift (%)
-80
-60
-40
-20
0
20
40
60
80
Lat
eral
Loa
d (k
ips)

87
Table 3.4 Moment Capacities
Specimen
Maximum
Lateral Load
(kN)
Normalized*
Lateral Load
(kN)
Analytical
Yield Moment
My (kN-m)
Max Base
Moment Mu
(kN-m)
Mu/My
S10MI 202.7 202.7 381.3 370.7 0.97
S20MI 233.5 233.5 450.4 427.0 0.95
S30MI 285.3 285.3 509.0 521.8 1.03
S20HI 269.5 247.0 441.5 451.8 1.02
S20HIN 267.4 245.1 441.5 448.3 1.02
S30XI 340.7 283.9 499.5 519.2 1.04
* Normalized ( MIScolumnmeasurednormalized hhFF 10⋅= )
Figure 3.32 - Base Moment/Yield Moment Comparison of S10MI, S20MI, and S30MI
-12 -8 -4 0 4 8 12Lateral Drift (%)
-1.2
-0.8
-0.4
0
0.4
0.8
1.2
Bas
e M
omen
t / Y
ield
Mom
ent
S10MIS20MIS30MI

88
Figure 3.33 - Base Moment/Yield Moment Comparison of S20MI, S20HI, and S20HIN
Figure 3.34 - Base Moment/Yield Moment Comparison of S30MI and S30XI
-6 -4 -2 0 2 4 6Lateral Drift (%)
-1.2
-0.8
-0.4
0
0.4
0.8
1.2
Bas
e M
omen
t / Y
ield
Mom
ent
S30MIS30XI
-12 -8 -4 0 4 8 12Lateral Drift (%)
-1.2
-0.8
-0.4
0
0.4
0.8
1.2B
ase
Mom
ent /
Yie
ld M
omen
t
S20MIS20HIS20HIN
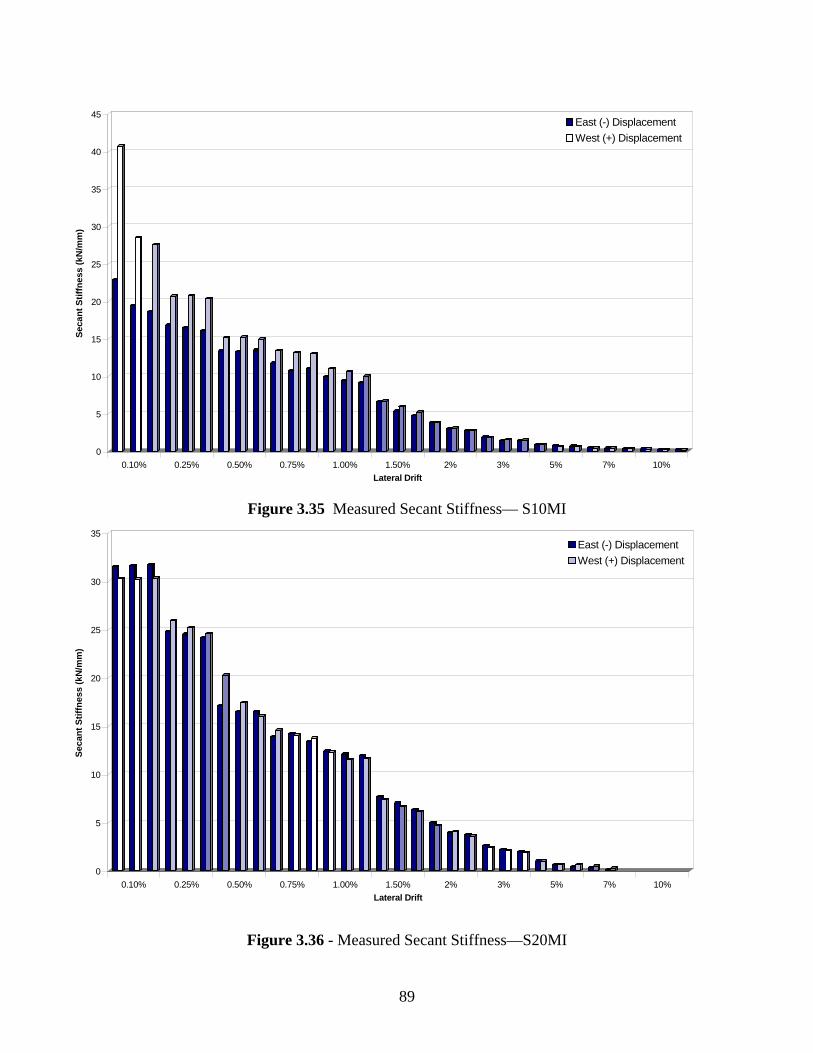
89
Figure 3.35 Measured Secant Stiffness— S10MI
Figure 3.36 - Measured Secant Stiffness—S20MI
0
5
10
15
20
25
30
35
40
45
Seca
nt S
tiffn
ess
(kN
/mm
)
0.10% 0.25% 0.50% 0.75% 1.00% 1.50% 2% 3% 5% 7% 10%Lateral Drift
East (-) DisplacementWest (+) Displacement
0
5
10
15
20
25
30
35
Seca
nt S
tiffn
ess
(kN
/mm
)
0.10% 0.25% 0.50% 0.75% 1.00% 1.50% 2% 3% 5% 7% 10%Lateral Drift
East (-) DisplacementWest (+) Displacement
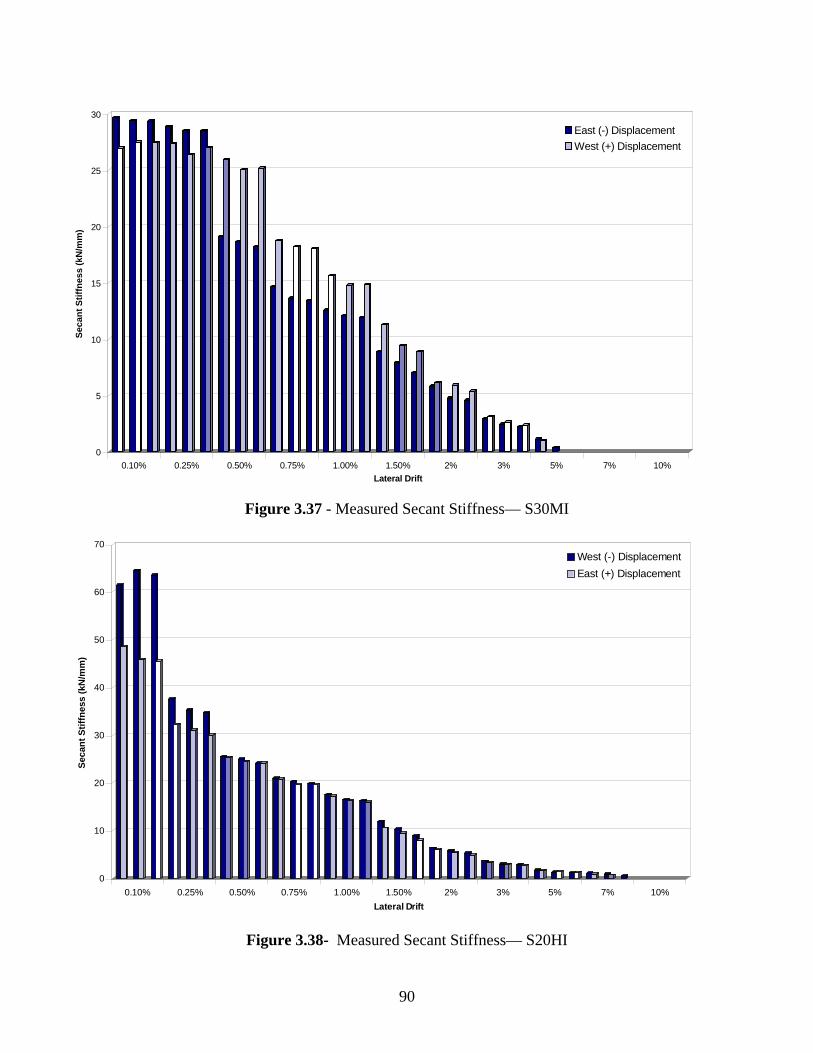
90
Figure 3.37 - Measured Secant Stiffness— S30MI
Figure 3.38- Measured Secant Stiffness— S20HI
0
10
20
30
40
50
60
70
Seca
nt S
tiffn
ess
(kN
/mm
)
0.10% 0.25% 0.50% 0.75% 1.00% 1.50% 2% 3% 5% 7% 10%Lateral Drift
West (-) DisplacementEast (+) Displacement
0
5
10
15
20
25
30
Seca
nt S
tiffn
ess
(kN
/mm
)
0.10% 0.25% 0.50% 0.75% 1.00% 1.50% 2% 3% 5% 7% 10%Lateral Drift
East (-) DisplacementWest (+) Displacement
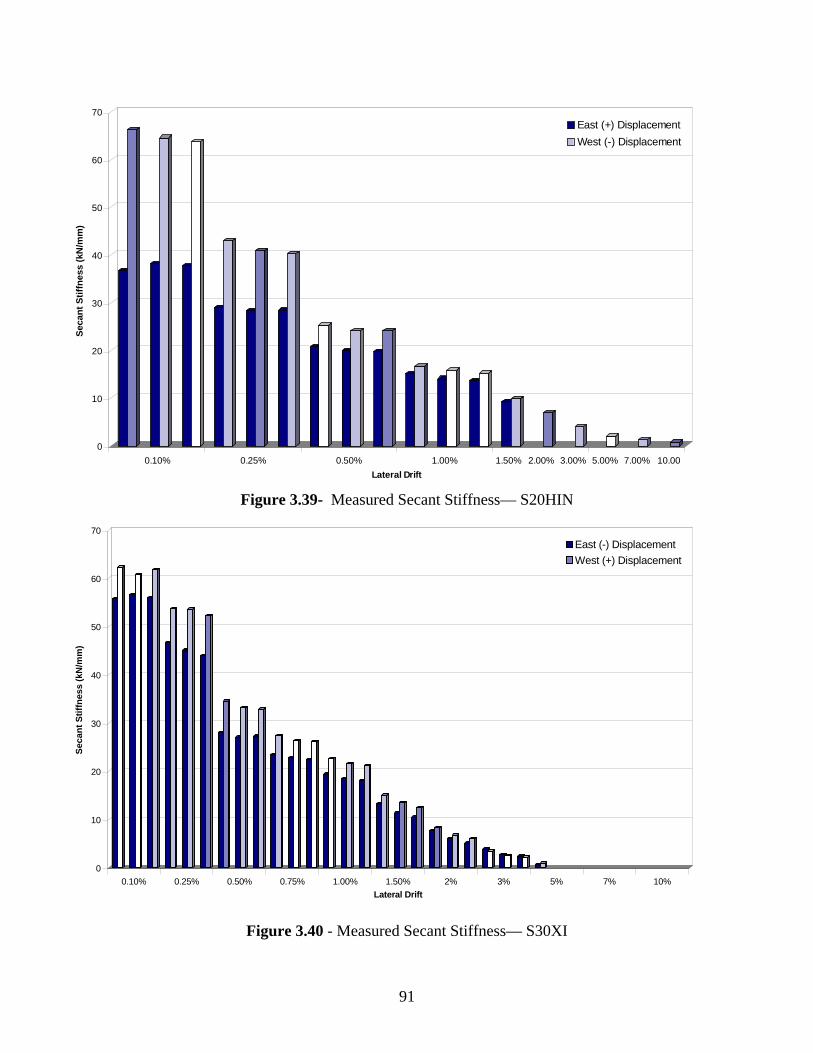
91
Figure 3.39- Measured Secant Stiffness— S20HIN
Figure 3.40 - Measured Secant Stiffness— S30XI
0
10
20
30
40
50
60
70
Seca
nt S
tiffn
ess
(kN
/mm
)
0.10% 0.25% 0.50% 1.00% 1.50% 2.00% 3.00% 5.00% 7.00% 10.00Lateral Drift
East (+) DisplacementWest (-) Displacement
0
10
20
30
40
50
60
70
Seca
nt S
tiffn
ess
(kN
/mm
)
0.10% 0.25% 0.50% 0.75% 1.00% 1.50% 2% 3% 5% 7% 10%Lateral Drift
East (-) DisplacementWest (+) Displacement

92
-200 -100 0 100 200Top Displacement (mm)
-400
-200
0
200
400L
ater
al L
oad
(kN
)
ExperimentalEPP
-200 -100 0 100 200Top Displacement (mm)
-400
-200
0
200
400
Lat
eral
Loa
d (k
N)
-200 -100 0 100 200Top Displacement (mm)
-400
-200
0
200
400
Lat
eral
Loa
d (k
N)
-200 -100 0 100 200Top Displacement (mm)
-400
-200
0
200
400
Lat
eral
Loa
d (k
N)
-200 -100 0 100 200Top Displacement (mm)
-400
-200
0
200
400
Lat
eral
Loa
d (k
N)
-200 -100 0 100 200Top Displacement (mm)
-400
-200
0
200
400
Lat
eral
Loa
d (k
N)
S10MI
S30MI S20HI
S30XIS20HIN
S20MI
Figure 3.41 - Actual and Elastic-Perfectly-Plastic Load-Displacement Responses

93
Figure 3.42- Total Energy Dissipated by Actual and EPP Columns
0 400 800 1200Data Point Number
0.0x100
4.0x10⁵
8.0x10⁵
1.2x10⁶
1.6x10⁶D
issi
pate
d E
nerg
y (k
N-m
m) S10MI
ExperimentalEPP
0 200 400 600 800 1000Data Point Number
0.0x100
2.0x10⁵
4.0x10⁵
6.0x10⁵
8.0x10⁵
1.0x10⁶
Dis
sipa
ted
Ene
rgy
(kN
-mm
) S20MIExperimentalEPP
0 200 400 600 800 1000Data Point Number
0.0x100
2.0x10⁵
4.0x10⁵
6.0x10⁵
Dis
sipa
ted
Ene
rgy
(kN
-mm
) S30MIExperimentalEPP
0 200 400 600 800 1000Data Point Number
0.0x100
2.0x10⁵
4.0x10⁵
6.0x10⁵
8.0x10⁵
1.0x10⁶
Dis
sipa
ted
Ene
rgy
(kN
-mm
) S20HIExperimentalEPP
0 100 200 300 400 500Data Point Number
0.0x100
4.0x10⁴
8.0x10⁴
1.2x10⁵
Dis
sipa
ted
Ene
rgy
(kN
-mm
) S20HINExperimentalEPP
0 200 400 600 800Data Point Number
0.0x100
2.0x10⁵
4.0x10⁵
6.0x10⁵
Dis
sipa
ted
Ene
rgy
(kN
-mm
) S30XIExperimentalEPP

94
Figure 3.43 - Normalized Energy Dissipation
0
0.2
0.4
0.6
0.8
1
1.2
1.4
1.6To
tal D
issi
pate
dl E
nerg
y A
ctua
l/EPP
0.10% 0.25% 0.50% 0.75% 1.00% 1.50% 2.00% 3.00% 5.00% 7.00% 10.00%Lateral Drift
S10MI S20MI S30MI S20HI S30XI
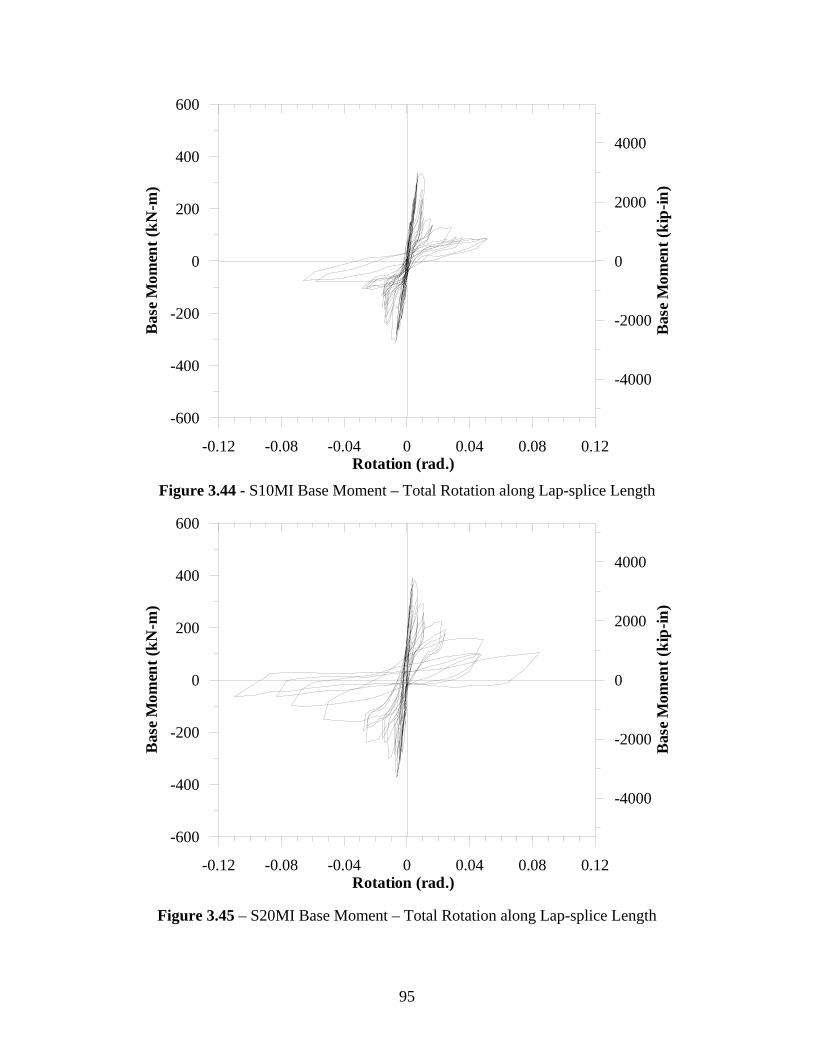
95
Figure 3.44 - S10MI Base Moment – Total Rotation along Lap-splice Length
Figure 3.45 – S20MI Base Moment – Total Rotation along Lap-splice Length
-0.12 -0.08 -0.04 0 0.04 0.08 0.12Rotation (rad.)
-600
-400
-200
0
200
400
600
Bas
e M
omen
t (kN
-m)
-4000
-2000
0
2000
4000
Bas
e M
omen
t (ki
p-in
)
-0.12 -0.08 -0.04 0 0.04 0.08 0.12Rotation (rad.)
-600
-400
-200
0
200
400
600
Bas
e M
omen
t (kN
-m)
-4000
-2000
0
2000
4000
Bas
e M
omen
t (ki
p-in
)
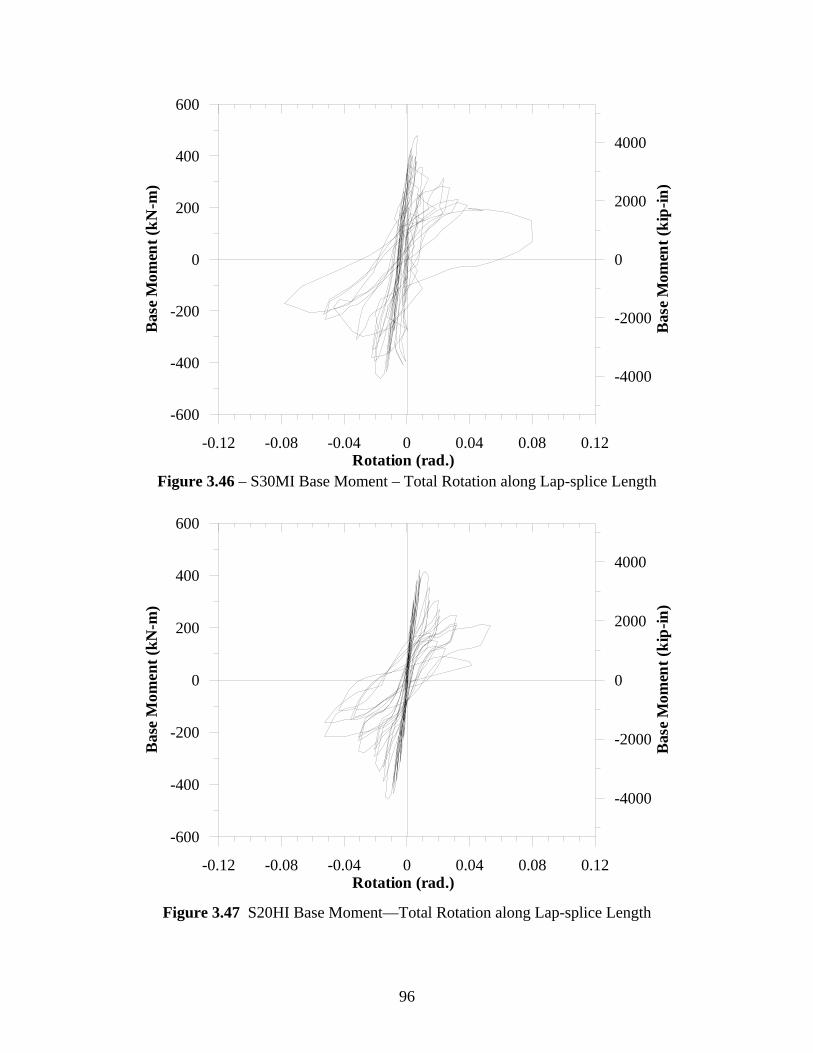
96
Figure 3.46 – S30MI Base Moment – Total Rotation along Lap-splice Length
Figure 3.47 S20HI Base Moment—Total Rotation along Lap-splice Length
-0.12 -0.08 -0.04 0 0.04 0.08 0.12Rotation (rad.)
-600
-400
-200
0
200
400
600
Bas
e M
omen
t (kN
-m)
-4000
-2000
0
2000
4000
Bas
e M
omen
t (ki
p-in
)
-0.12 -0.08 -0.04 0 0.04 0.08 0.12Rotation (rad.)
-600
-400
-200
0
200
400
600
Bas
e M
omen
t (kN
-m)
-4000
-2000
0
2000
4000
Bas
e M
omen
t (ki
p-in
)
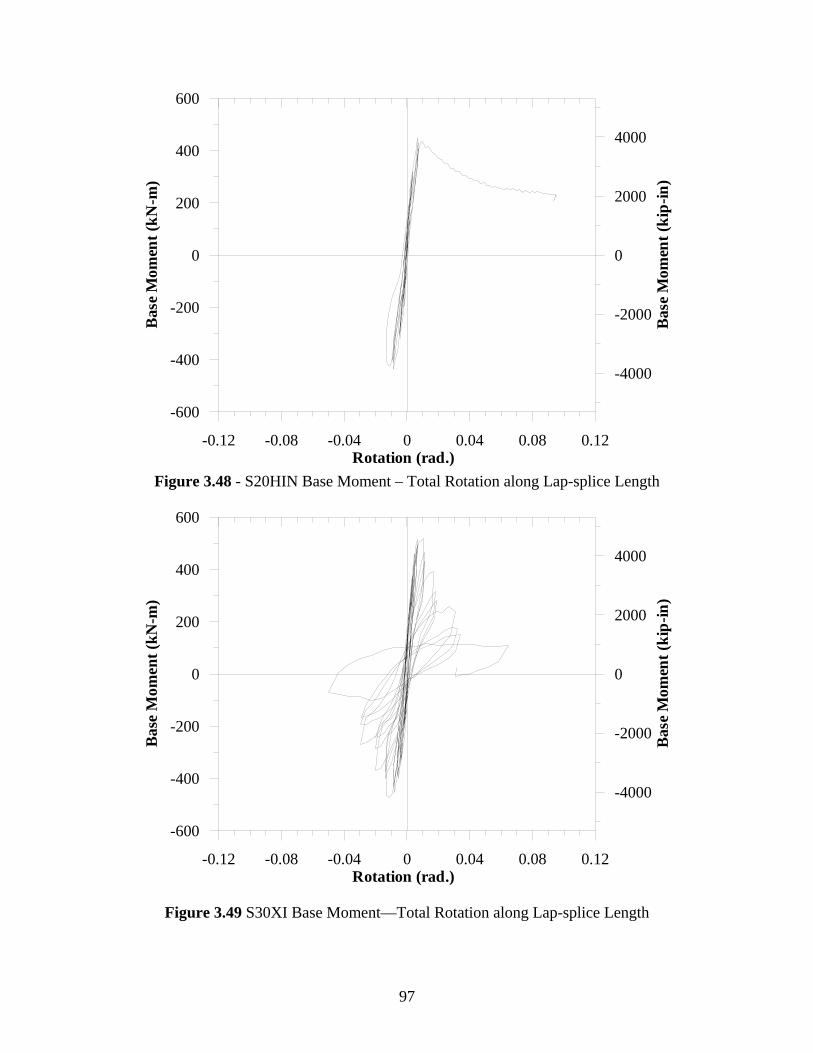
97
Figure 3.48 - S20HIN Base Moment – Total Rotation along Lap-splice Length
Figure 3.49 S30XI Base Moment—Total Rotation along Lap-splice Length
-0.12 -0.08 -0.04 0 0.04 0.08 0.12Rotation (rad.)
-600
-400
-200
0
200
400
600
Bas
e M
omen
t (kN
-m)
-4000
-2000
0
2000
4000
Bas
e M
omen
t (ki
p-in
)
-0.12 -0.08 -0.04 0 0.04 0.08 0.12Rotation (rad.)
-600
-400
-200
0
200
400
600
Bas
e M
omen
t (kN
-m)
-4000
-2000
0
2000
4000
Bas
e M
omen
t (ki
p-in
)
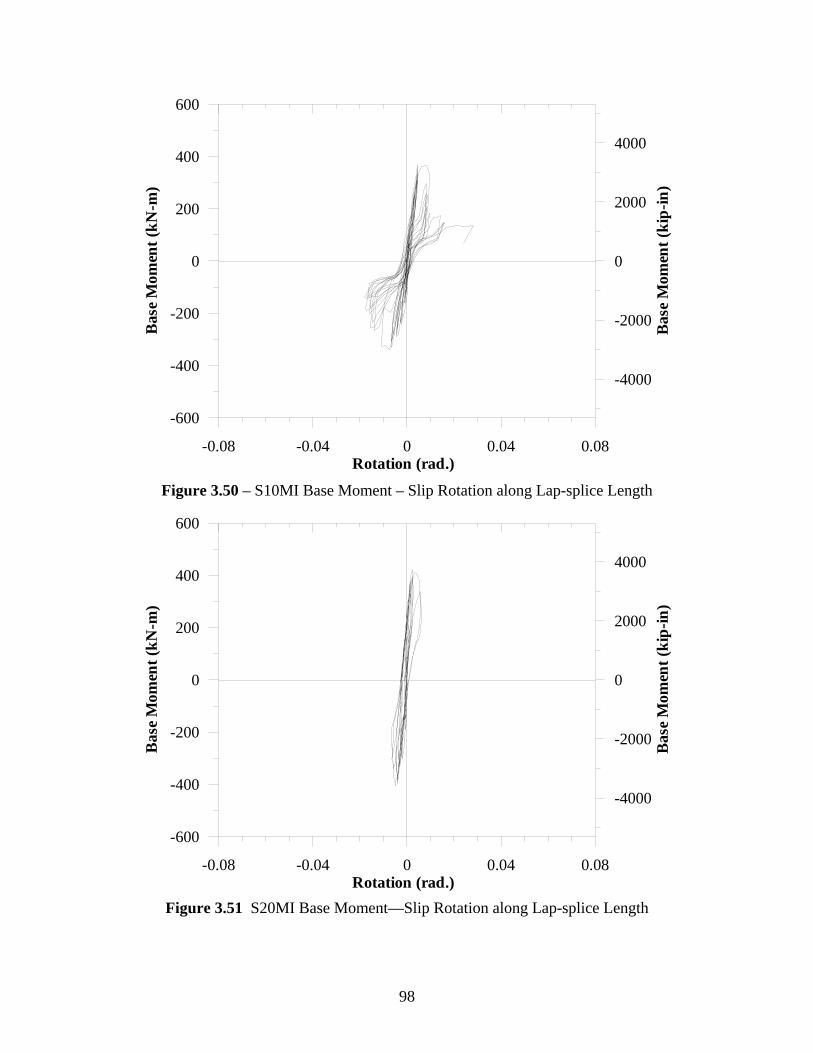
98
Figure 3.50 – S10MI Base Moment – Slip Rotation along Lap-splice Length
Figure 3.51 S20MI Base Moment—Slip Rotation along Lap-splice Length
-0.08 -0.04 0 0.04 0.08Rotation (rad.)
-600
-400
-200
0
200
400
600
Bas
e M
omen
t (kN
-m)
-4000
-2000
0
2000
4000
Bas
e M
omen
t (ki
p-in
)
-0.08 -0.04 0 0.04 0.08Rotation (rad.)
-600
-400
-200
0
200
400
600
Bas
e M
omen
t (kN
-m)
-4000
-2000
0
2000
4000
Bas
e M
omen
t (ki
p-in
)

99
Figure 3.52 – S30MI Base Moment – Slip Rotation along Lap-splice Length
Figure 3.53 S20HI Base Moment—Slip Rotation along Lap-splice Length
-0.08 -0.04 0 0.04 0.08Rotation (rad.)
-600
-400
-200
0
200
400
600
Bas
e M
omen
t (kN
-m)
-4000
-2000
0
2000
4000
Bas
e M
omen
t (ki
p-in
)
-0.08 -0.04 0 0.04 0.08Rotation (rad.)
-600
-400
-200
0
200
400
600
Bas
e M
omen
t (kN
-m)
-4000
-2000
0
2000
4000
Bas
e M
omen
t (ki
p-in
)
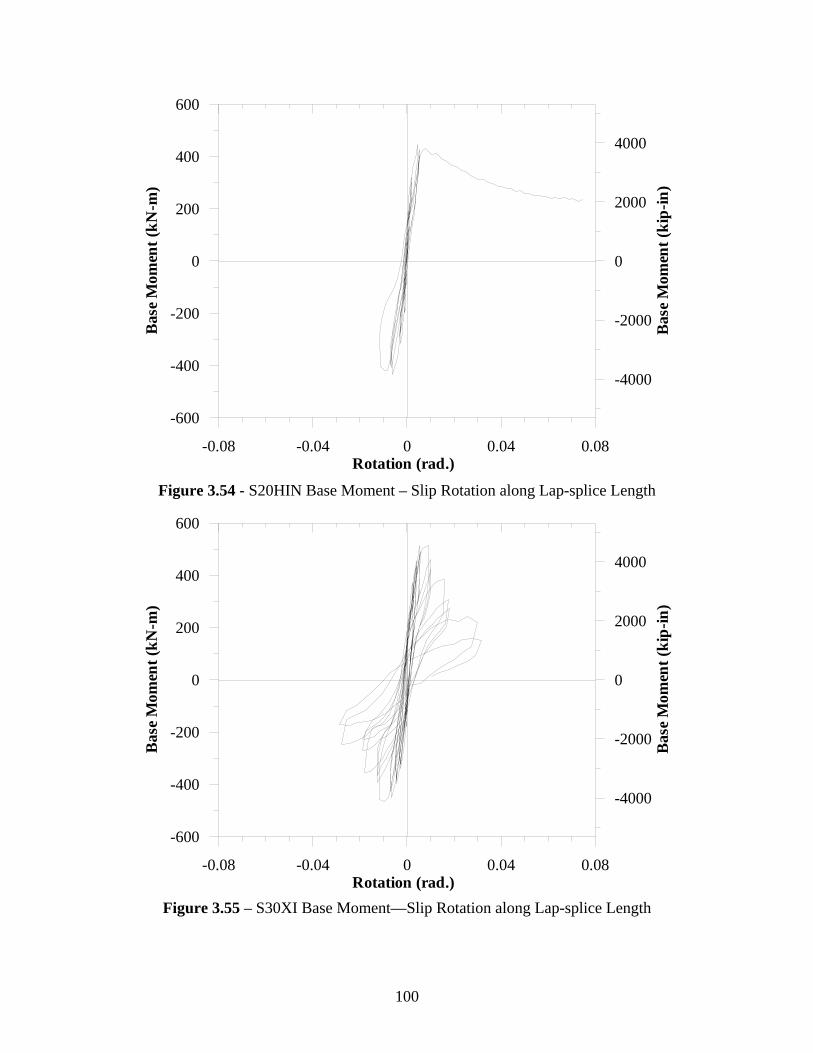
100
Figure 3.54 - S20HIN Base Moment – Slip Rotation along Lap-splice Length
Figure 3.55 – S30XI Base Moment—Slip Rotation along Lap-splice Length
-0.08 -0.04 0 0.04 0.08Rotation (rad.)
-600
-400
-200
0
200
400
600
Bas
e M
omen
t (kN
-m)
-4000
-2000
0
2000
4000
Bas
e M
omen
t (ki
p-in
)
-0.08 -0.04 0 0.04 0.08Rotation (rad.)
-600
-400
-200
0
200
400
600
Bas
e M
omen
t (kN
-m)
-4000
-2000
0
2000
4000
Bas
e M
omen
t (ki
p-in
)
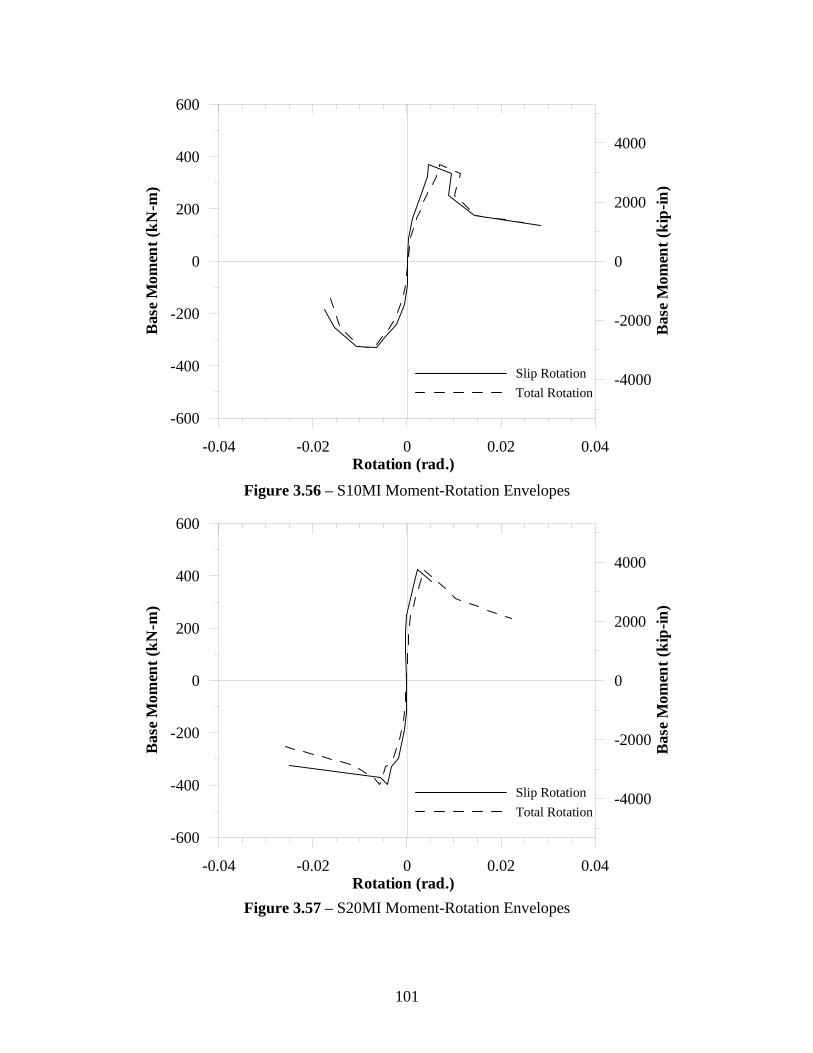
101
Figure 3.56 – S10MI Moment-Rotation Envelopes
Figure 3.57 – S20MI Moment-Rotation Envelopes
-0.04 -0.02 0 0.02 0.04Rotation (rad.)
-600
-400
-200
0
200
400
600
Bas
e M
omen
t (kN
-m)
-4000
-2000
0
2000
4000
Bas
e M
omen
t (ki
p-in
)
Slip RotationTotal Rotation
-0.04 -0.02 0 0.02 0.04Rotation (rad.)
-600
-400
-200
0
200
400
600
Bas
e M
omen
t (kN
-m)
-4000
-2000
0
2000
4000
Bas
e M
omen
t (ki
p-in
)
Slip RotationTotal Rotation
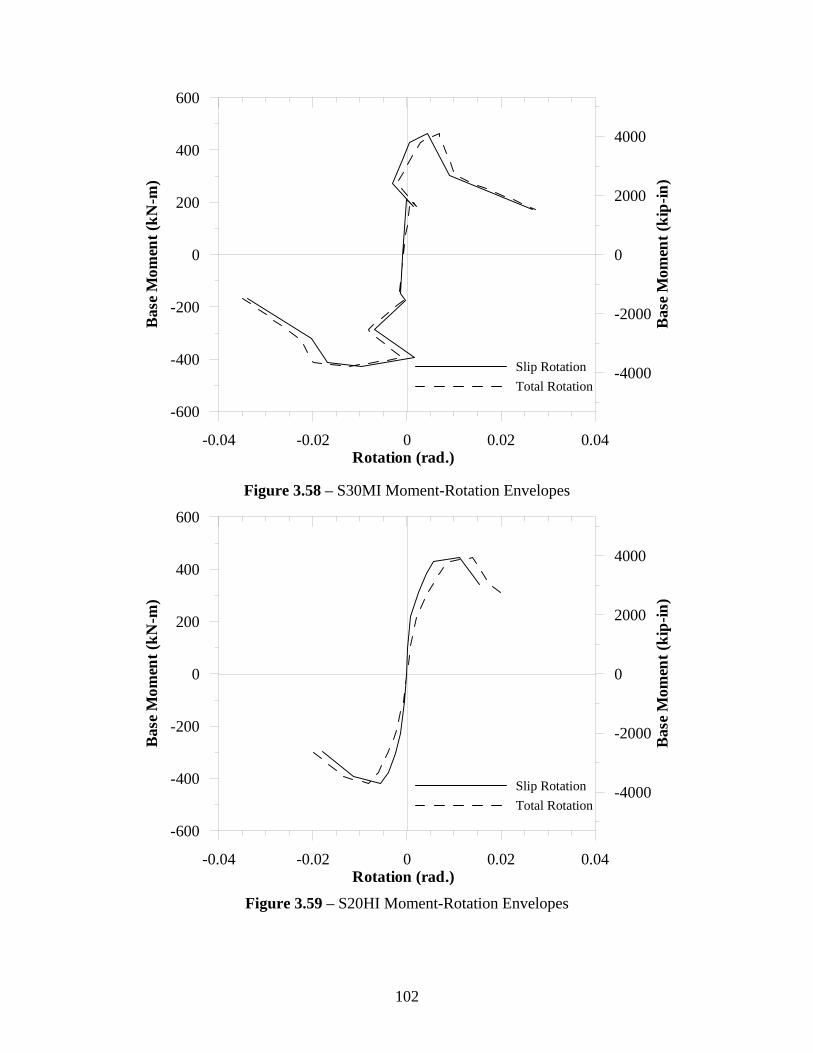
102
Figure 3.58 – S30MI Moment-Rotation Envelopes
Figure 3.59 – S20HI Moment-Rotation Envelopes
-0.04 -0.02 0 0.02 0.04Rotation (rad.)
-600
-400
-200
0
200
400
600
Bas
e M
omen
t (kN
-m)
-4000
-2000
0
2000
4000
Bas
e M
omen
t (ki
p-in
)
Slip RotationTotal Rotation
-0.04 -0.02 0 0.02 0.04Rotation (rad.)
-600
-400
-200
0
200
400
600
Bas
e M
omen
t (kN
-m)
-4000
-2000
0
2000
4000
Bas
e M
omen
t (ki
p-in
)
Slip RotationTotal Rotation
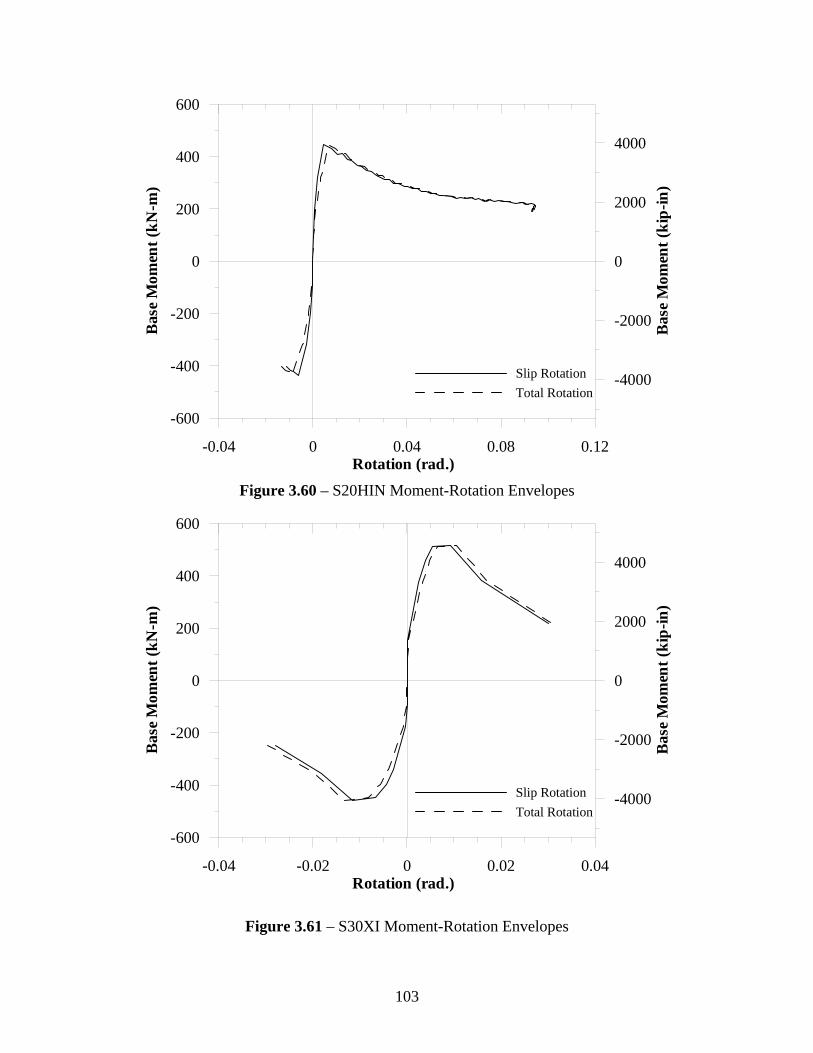
103
Figure 3.60 – S20HIN Moment-Rotation Envelopes
Figure 3.61 – S30XI Moment-Rotation Envelopes
-0.04 -0.02 0 0.02 0.04Rotation (rad.)
-600
-400
-200
0
200
400
600
Bas
e M
omen
t (kN
-m)
-4000
-2000
0
2000
4000
Bas
e M
omen
t (ki
p-in
)
Slip RotationTotal Rotation
-0.04 0 0.04 0.08 0.12Rotation (rad.)
-600
-400
-200
0
200
400
600
Bas
e M
omen
t (kN
-m)
-4000
-2000
0
2000
4000
Bas
e M
omen
t (ki
p-in
)
Slip RotationTotal Rotation
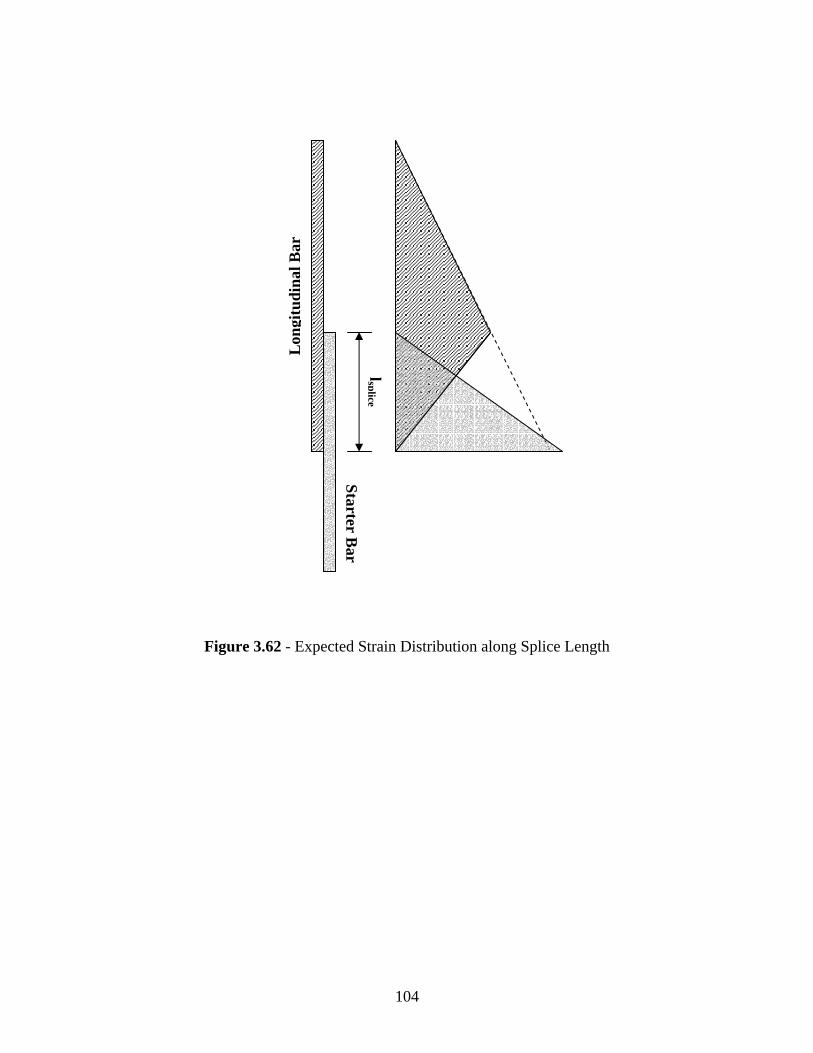
104
Figure 3.62 - Expected Strain Distribution along Splice Length
Starter Bar
Lon
gitu
dina
l Bar
lsplice
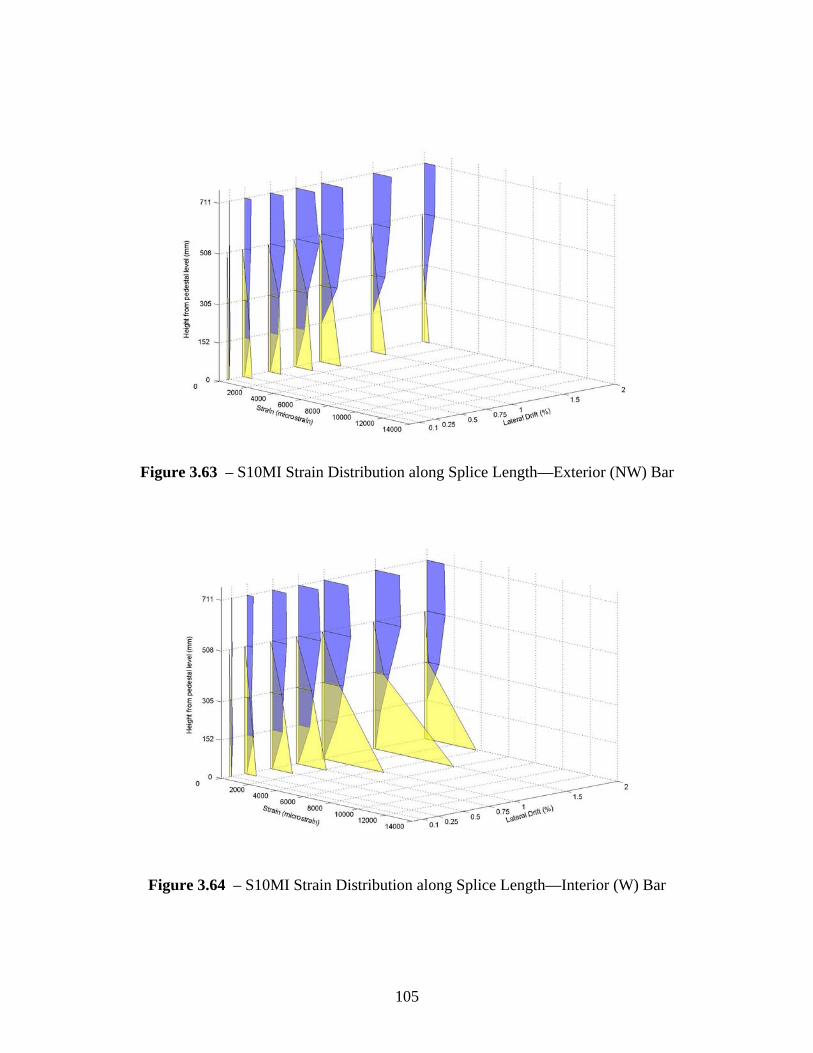
105
Figure 3.63 – S10MI Strain Distribution along Splice Length—Exterior (NW) Bar
Figure 3.64 – S10MI Strain Distribution along Splice Length—Interior (W) Bar
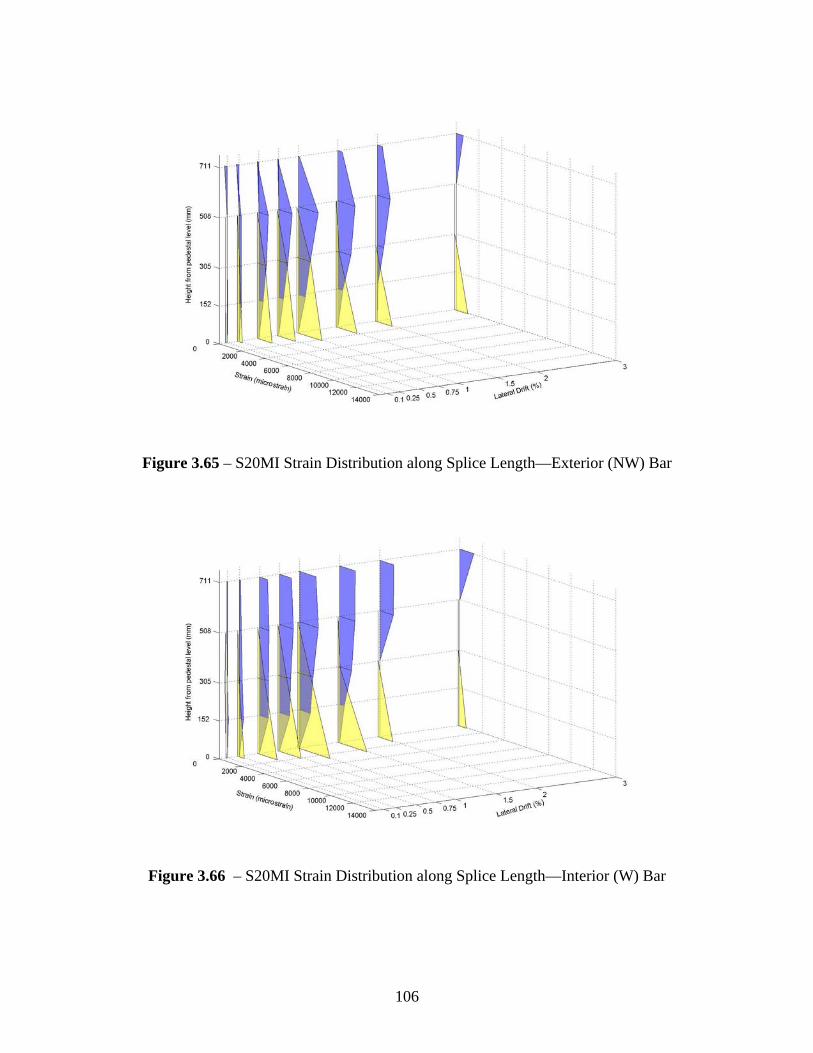
106
Figure 3.65 – S20MI Strain Distribution along Splice Length—Exterior (NW) Bar
Figure 3.66 – S20MI Strain Distribution along Splice Length—Interior (W) Bar
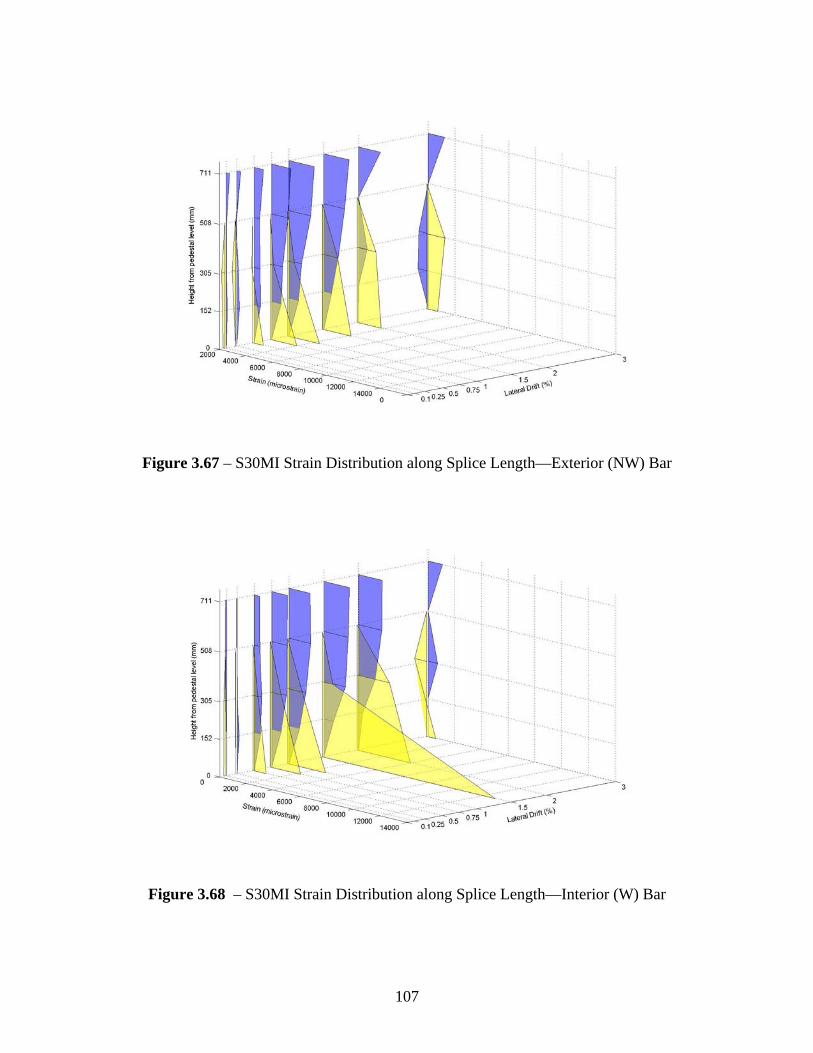
107
Figure 3.67 – S30MI Strain Distribution along Splice Length—Exterior (NW) Bar
Figure 3.68 – S30MI Strain Distribution along Splice Length—Interior (W) Bar
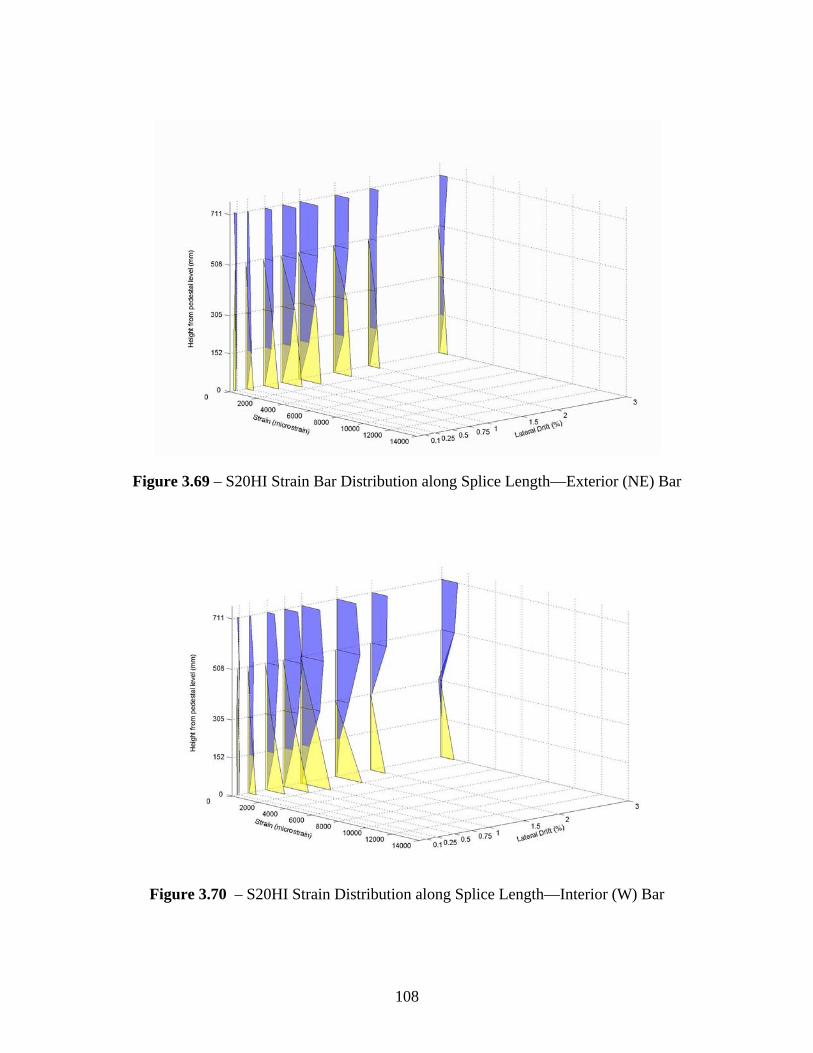
108
Figure 3.69 – S20HI Strain Bar Distribution along Splice Length—Exterior (NE) Bar
Figure 3.70 – S20HI Strain Distribution along Splice Length—Interior (W) Bar
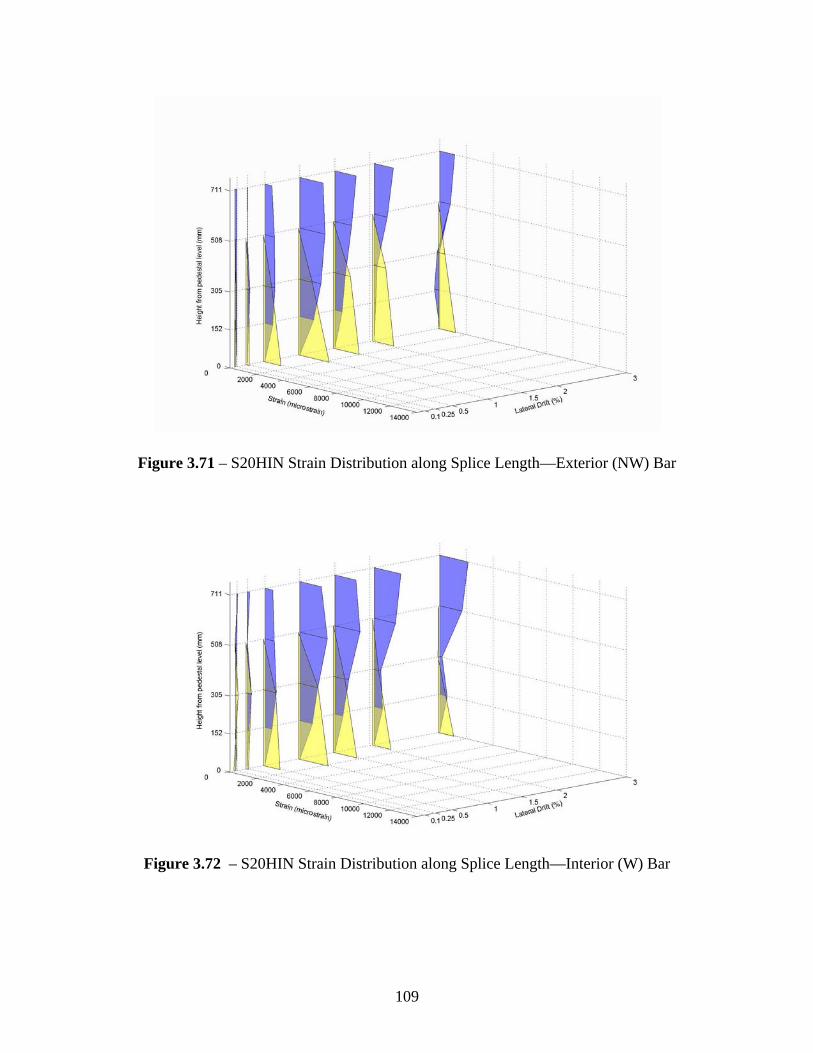
109
Figure 3.71 – S20HIN Strain Distribution along Splice Length—Exterior (NW) Bar
Figure 3.72 – S20HIN Strain Distribution along Splice Length—Interior (W) Bar

110
Figure 3.73 – S30XI Strain Distribution along Splice Length—Exterior (NW) Bar
Figure 3.74 – S30XI Strain Distribution along Splice Length—Interior (W) Bar
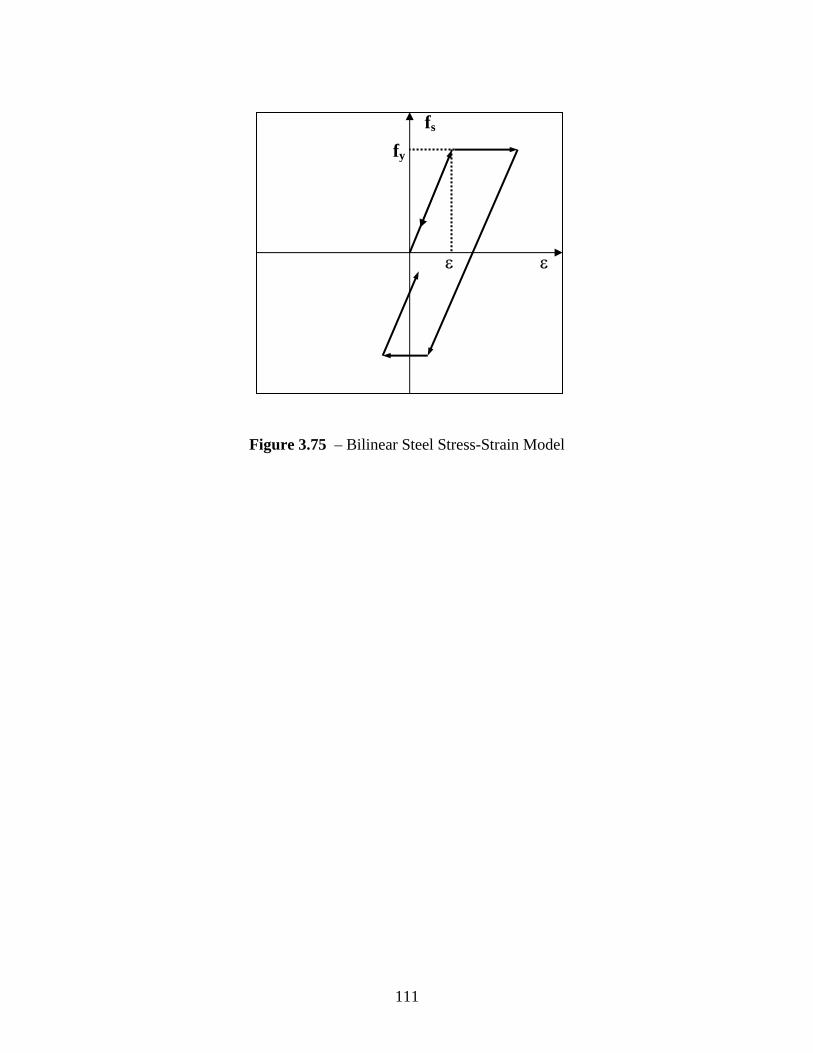
111
Figure 3.75 – Bilinear Steel Stress-Strain Model
εε
fy
fs
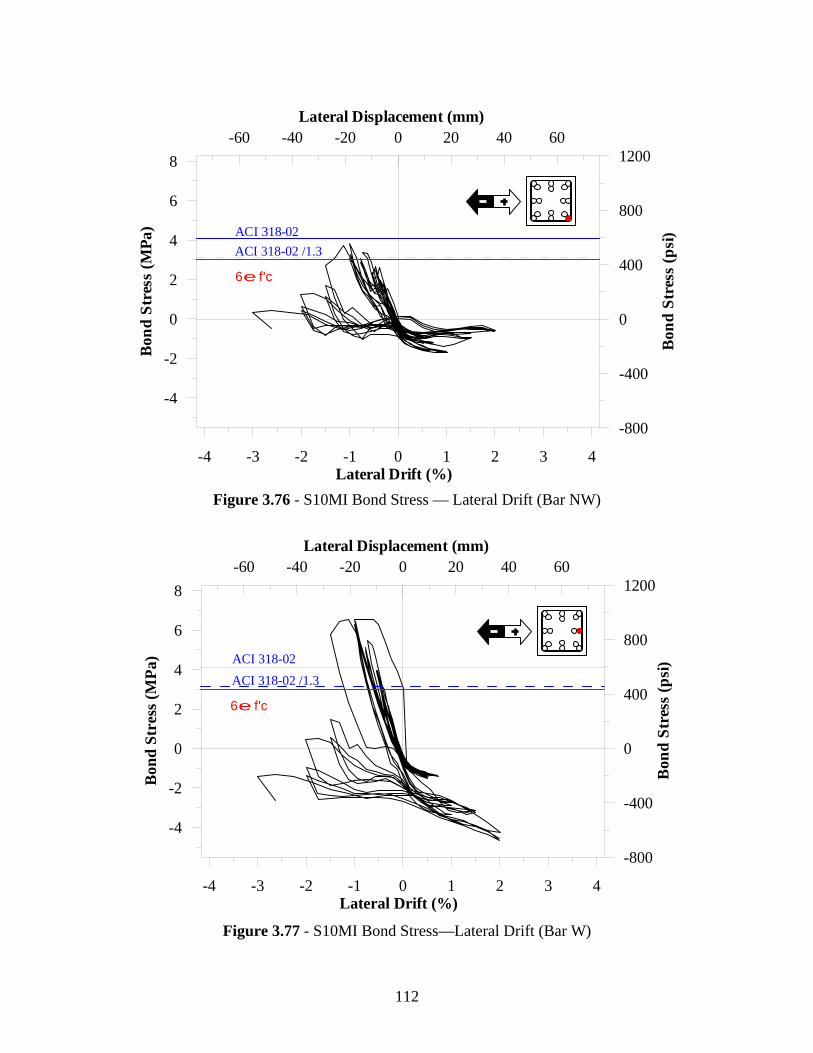
112
Figure 3.76 - S10MI Bond Stress — Lateral Drift (Bar NW)
Figure 3.77 - S10MI Bond Stress—Lateral Drift (Bar W)
-60 -40 -20 0 20 40 60Lateral Displacement (mm)
-800
-400
0
400
800
1200
Bon
d St
ress
(psi
)
-4 -3 -2 -1 0 1 2 3 4Lateral Drift (%)
-4
-2
0
2
4
6
8
Bon
d St
ress
(MPa
)
6e f'c
ACI 318-02 /1.3ACI 318-02
-60 -40 -20 0 20 40 60Lateral Displacement (mm)
-800
-400
0
400
800
1200
Bon
d St
ress
(psi
)
-4 -3 -2 -1 0 1 2 3 4Lateral Drift (%)
-4
-2
0
2
4
6
8B
ond
Stre
ss (M
Pa)
6e f'c
ACI 318-02ACI 318-02 /1.3
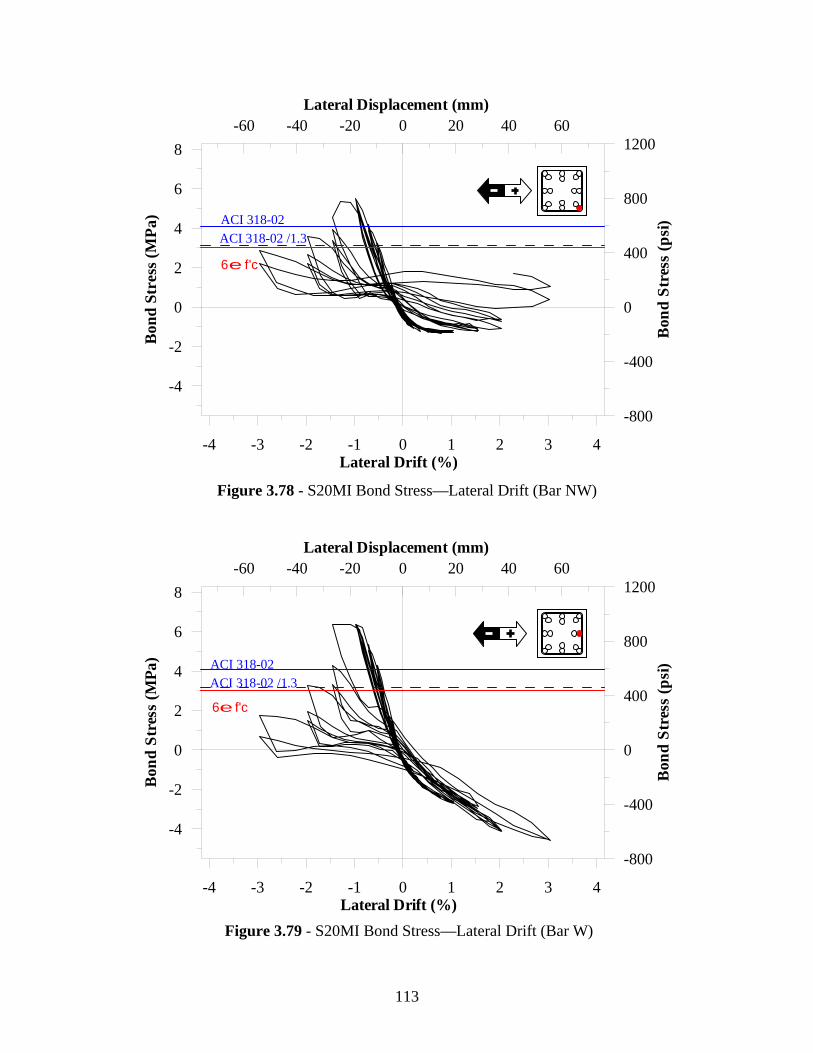
113
Figure 3.78 - S20MI Bond Stress—Lateral Drift (Bar NW)
Figure 3.79 - S20MI Bond Stress—Lateral Drift (Bar W)
-60 -40 -20 0 20 40 60Lateral Displacement (mm)
-800
-400
0
400
800
1200
Bon
d St
ress
(psi
)
-4 -3 -2 -1 0 1 2 3 4Lateral Drift (%)
-4
-2
0
2
4
6
8B
ond
Stre
ss (M
Pa)
6e f'c
ACI 318-02 /1.3ACI 318-02
-60 -40 -20 0 20 40 60Lateral Displacement (mm)
-800
-400
0
400
800
1200
Bon
d St
ress
(psi
)
-4 -3 -2 -1 0 1 2 3 4Lateral Drift (%)
-4
-2
0
2
4
6
8
Bon
d St
ress
(MPa
)
6ef'c
ACI 318-02 /1.3ACI 318-02
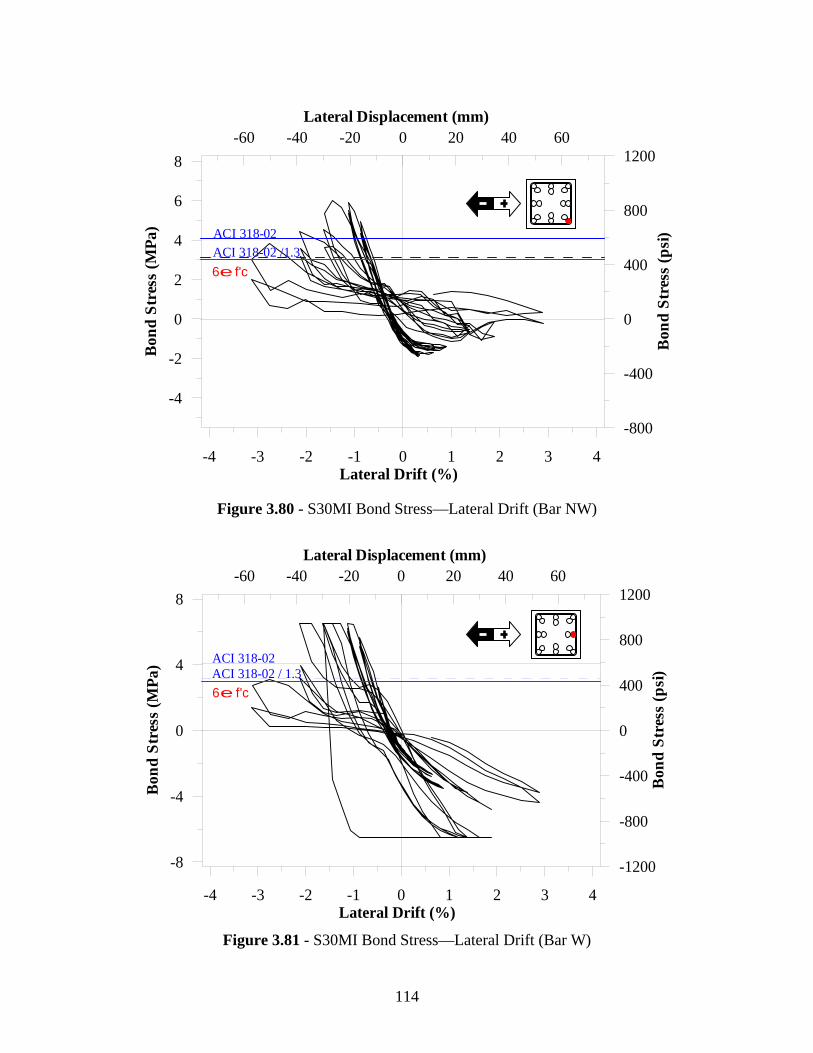
114
Figure 3.80 - S30MI Bond Stress—Lateral Drift (Bar NW)
Figure 3.81 - S30MI Bond Stress—Lateral Drift (Bar W)
-60 -40 -20 0 20 40 60Lateral Displacement (mm)
-1200
-800
-400
0
400
800
1200
Bon
d St
ress
(psi
)
-4 -3 -2 -1 0 1 2 3 4Lateral Drift (%)
-8
-4
0
4
8
Bon
d St
ress
(MPa
)
6e f'c
ACI 318-02ACI 318-02 / 1.3
-60 -40 -20 0 20 40 60Lateral Displacement (mm)
-800
-400
0
400
800
1200
Bon
d St
ress
(psi
)
-4 -3 -2 -1 0 1 2 3 4Lateral Drift (%)
-4
-2
0
2
4
6
8B
ond
Stre
ss (M
Pa)
6ef'cACI 318-02 /1.3ACI 318-02
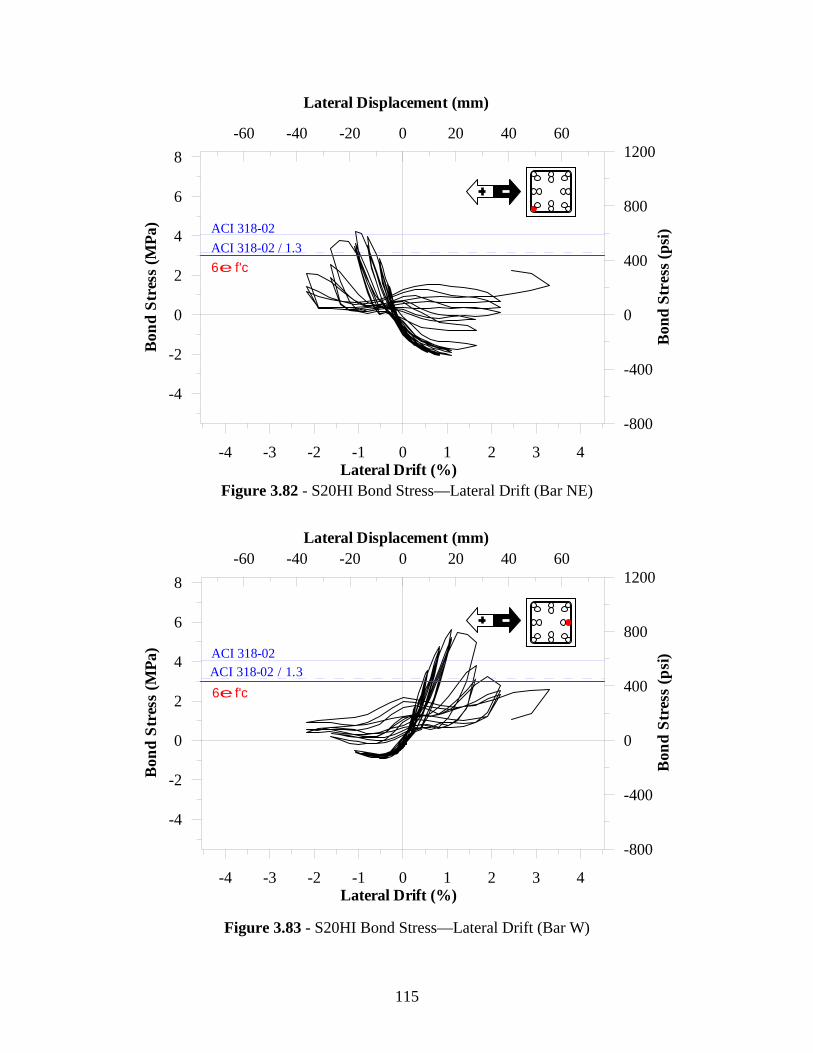
115
Figure 3.82 - S20HI Bond Stress—Lateral Drift (Bar NE)
Figure 3.83 - S20HI Bond Stress—Lateral Drift (Bar W)
-60 -40 -20 0 20 40 60
Lateral Displacement (mm)
-800
-400
0
400
800
1200
Bon
d St
ress
(psi
)
-4 -3 -2 -1 0 1 2 3 4Lateral Drift (%)
-4
-2
0
2
4
6
8B
ond
Stre
ss (M
Pa)
6e f'c
ACI 318-02ACI 318-02 / 1.3
-60 -40 -20 0 20 40 60Lateral Displacement (mm)
-800
-400
0
400
800
1200
Bon
d St
ress
(psi
)
-4 -3 -2 -1 0 1 2 3 4Lateral Drift (%)
-4
-2
0
2
4
6
8
Bon
d St
ress
(MPa
)
6ef'cACI 318-02 / 1.3ACI 318-02
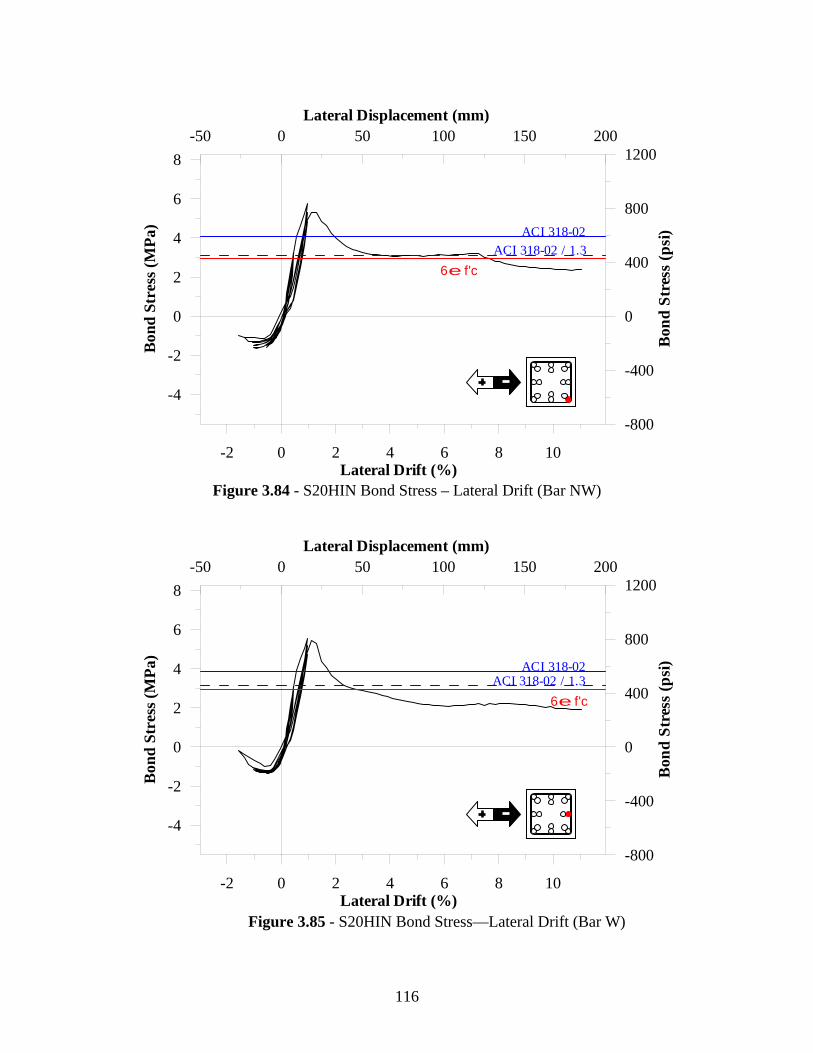
116
Figure 3.84 - S20HIN Bond Stress – Lateral Drift (Bar NW)
Figure 3.85 - S20HIN Bond Stress—Lateral Drift (Bar W)
-50 0 50 100 150 200Lateral Displacement (mm)
-800
-400
0
400
800
1200
Bon
d St
ress
(psi
)
-2 0 2 4 6 8 10Lateral Drift (%)
-4
-2
0
2
4
6
8B
ond
Stre
ss (M
Pa)
6e f'c
ACI 318-02ACI 318-02 / 1.3
-50 0 50 100 150 200Lateral Displacement (mm)
-800
-400
0
400
800
1200
Bon
d St
ress
(psi
)
-2 0 2 4 6 8 10Lateral Drift (%)
-4
-2
0
2
4
6
8
Bon
d St
ress
(MPa
)
6e f'c
ACI 318-02ACI 318-02 / 1.3
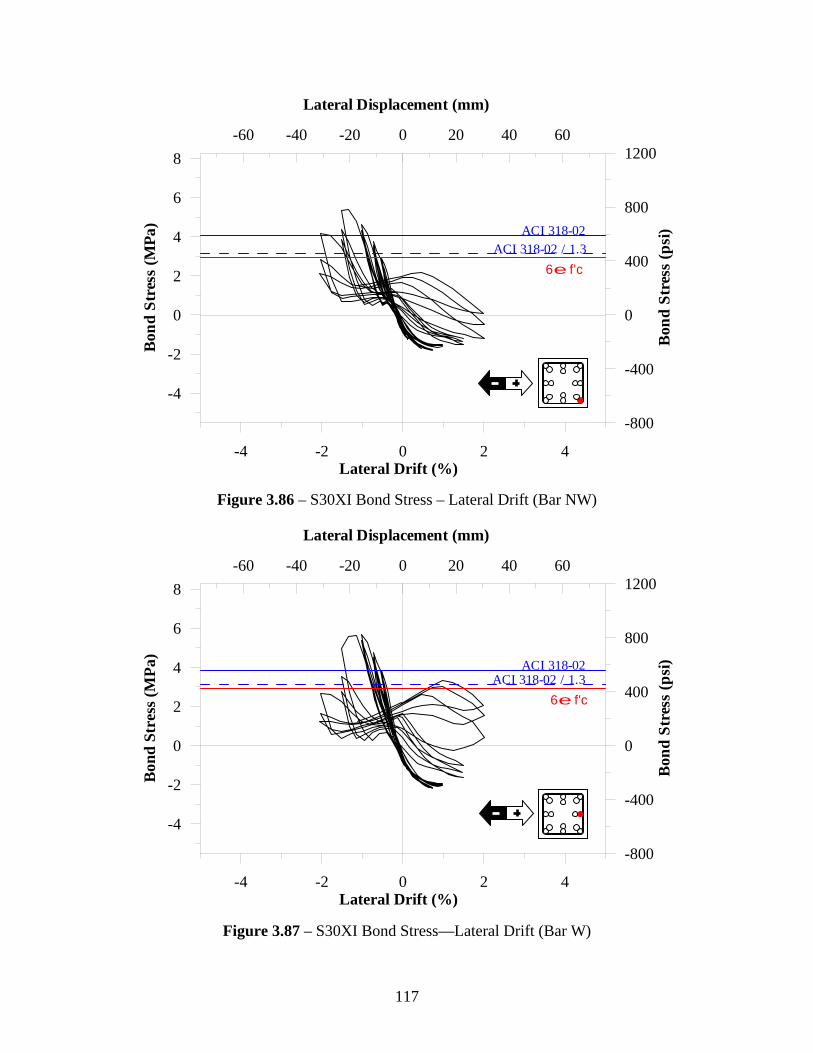
117
Figure 3.86 – S30XI Bond Stress – Lateral Drift (Bar NW)
Figure 3.87 – S30XI Bond Stress—Lateral Drift (Bar W)
-60 -40 -20 0 20 40 60
Lateral Displacement (mm)
-800
-400
0
400
800
1200
Bon
d St
ress
(psi
)
-4 -2 0 2 4Lateral Drift (%)
-4
-2
0
2
4
6
8B
ond
Stre
ss (M
Pa)
6e f'c
ACI 318-02ACI 318-02 / 1.3
-60 -40 -20 0 20 40 60
Lateral Displacement (mm)
-800
-400
0
400
800
1200
Bon
d St
ress
(psi
)
-4 -2 0 2 4Lateral Drift (%)
-4
-2
0
2
4
6
8
Bon
d St
ress
(MPa
)
6e f'c
ACI 318-02ACI 318-02 / 1.3
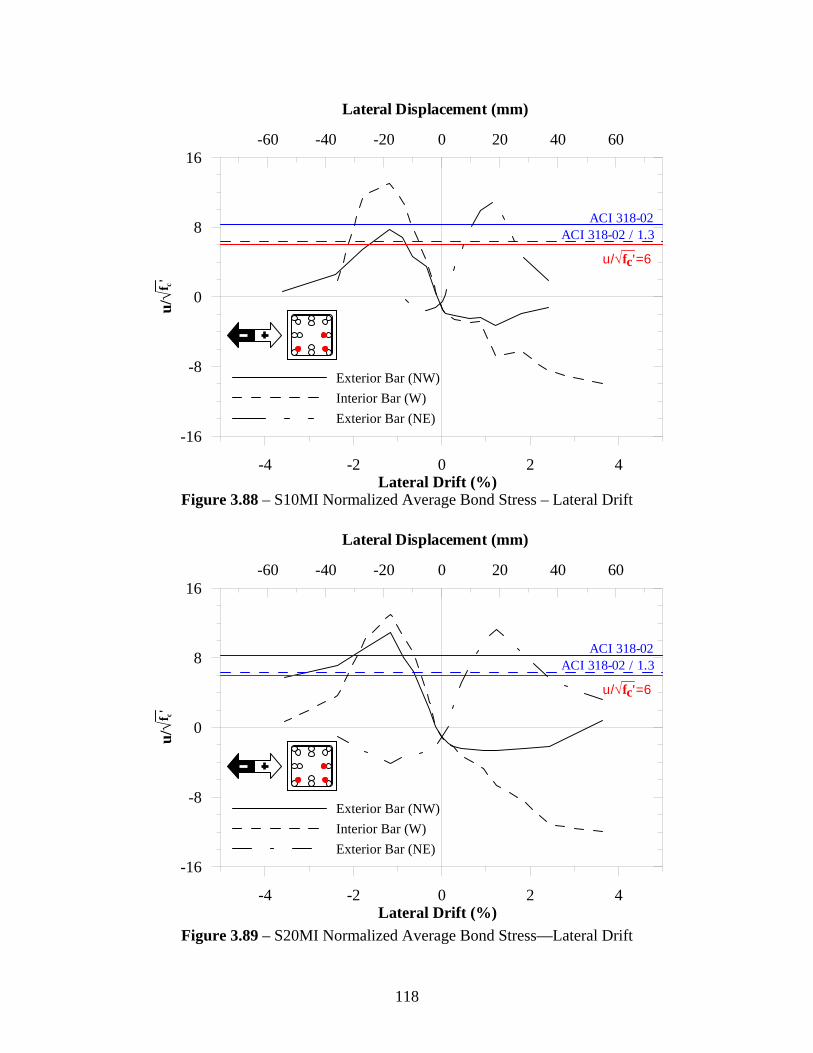
118
Figure 3.88 – S10MI Normalized Average Bond Stress – Lateral Drift
Figure 3.89 – S20MI Normalized Average Bond Stress—Lateral Drift
-60 -40 -20 0 20 40 60
Lateral Displacement (mm)
-16
-8
0
8
16u/
√fc'
-4 -2 0 2 4Lateral Drift (%)
u/√fc'=6
ACI 318-02ACI 318-02 / 1.3
Exterior Bar (NW)Interior Bar (W)Exterior Bar (NE)
-60 -40 -20 0 20 40 60
Lateral Displacement (mm)
-16
-8
0
8
16
u/√f
c'
-4 -2 0 2 4Lateral Drift (%)
u/√fc'=6
ACI 318-02ACI 318-02 / 1.3
Exterior Bar (NW)Interior Bar (W)Exterior Bar (NE)
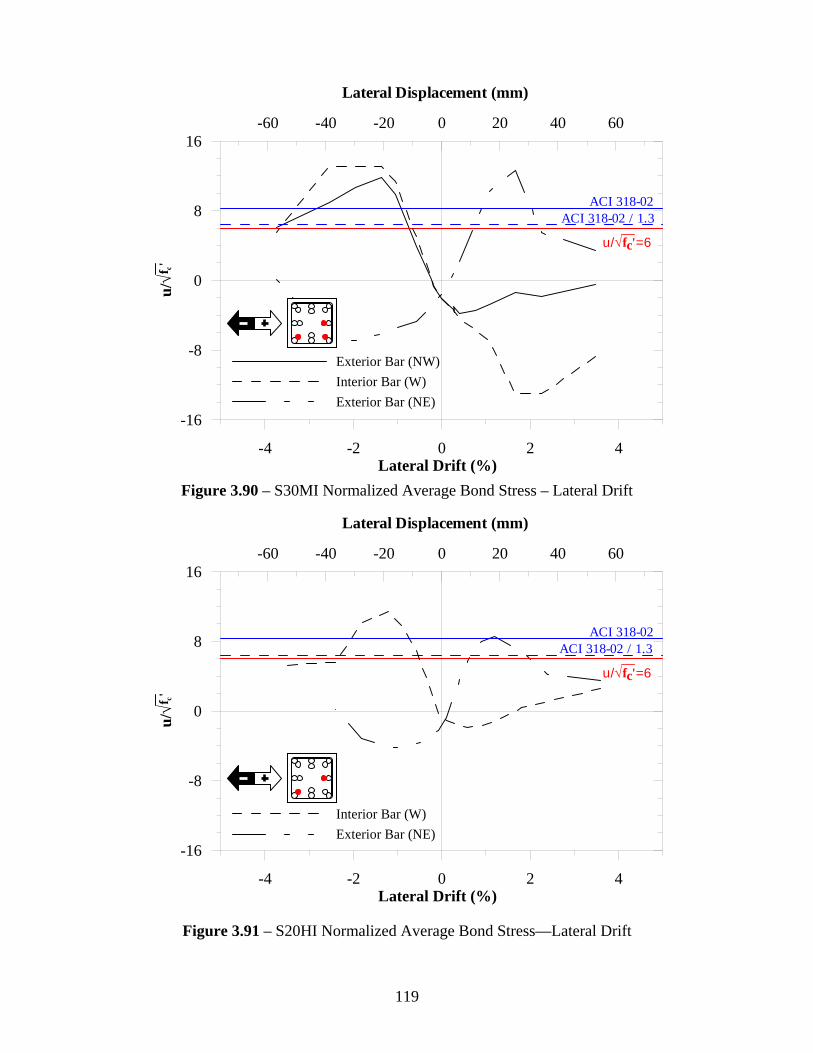
119
Figure 3.90 – S30MI Normalized Average Bond Stress – Lateral Drift
Figure 3.91 – S20HI Normalized Average Bond Stress—Lateral Drift
-60 -40 -20 0 20 40 60
Lateral Displacement (mm)
-16
-8
0
8
16u/
√fc'
-4 -2 0 2 4Lateral Drift (%)
u/√fc'=6
ACI 318-02ACI 318-02 / 1.3
Exterior Bar (NW)Interior Bar (W)Exterior Bar (NE)
-60 -40 -20 0 20 40 60
Lateral Displacement (mm)
-16
-8
0
8
16
u/√f
c'
-4 -2 0 2 4Lateral Drift (%)
u/√fc'=6
ACI 318-02ACI 318-02 / 1.3
Interior Bar (W)Exterior Bar (NE)
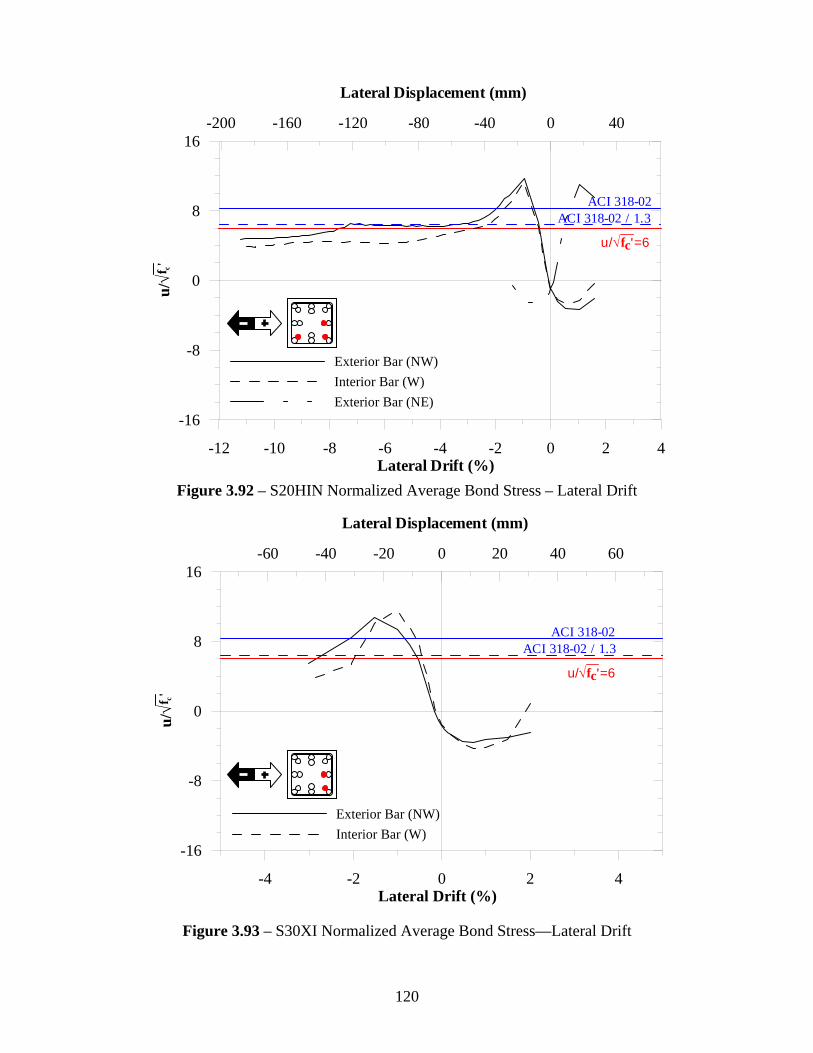
120
Figure 3.92 – S20HIN Normalized Average Bond Stress – Lateral Drift
Figure 3.93 – S30XI Normalized Average Bond Stress—Lateral Drift
-200 -160 -120 -80 -40 0 40
Lateral Displacement (mm)
-16
-8
0
8
16u/
√fc'
-12 -10 -8 -6 -4 -2 0 2 4Lateral Drift (%)
u/√fc'=6
ACI 318-02ACI 318-02 / 1.3
Exterior Bar (NW)Interior Bar (W)Exterior Bar (NE)
-60 -40 -20 0 20 40 60
Lateral Displacement (mm)
-16
-8
0
8
16
u/√f
c'
-4 -2 0 2 4Lateral Drift (%)
u/√fc'=6
ACI 318-02ACI 318-02 / 1.3
Exterior Bar (NW)Interior Bar (W)
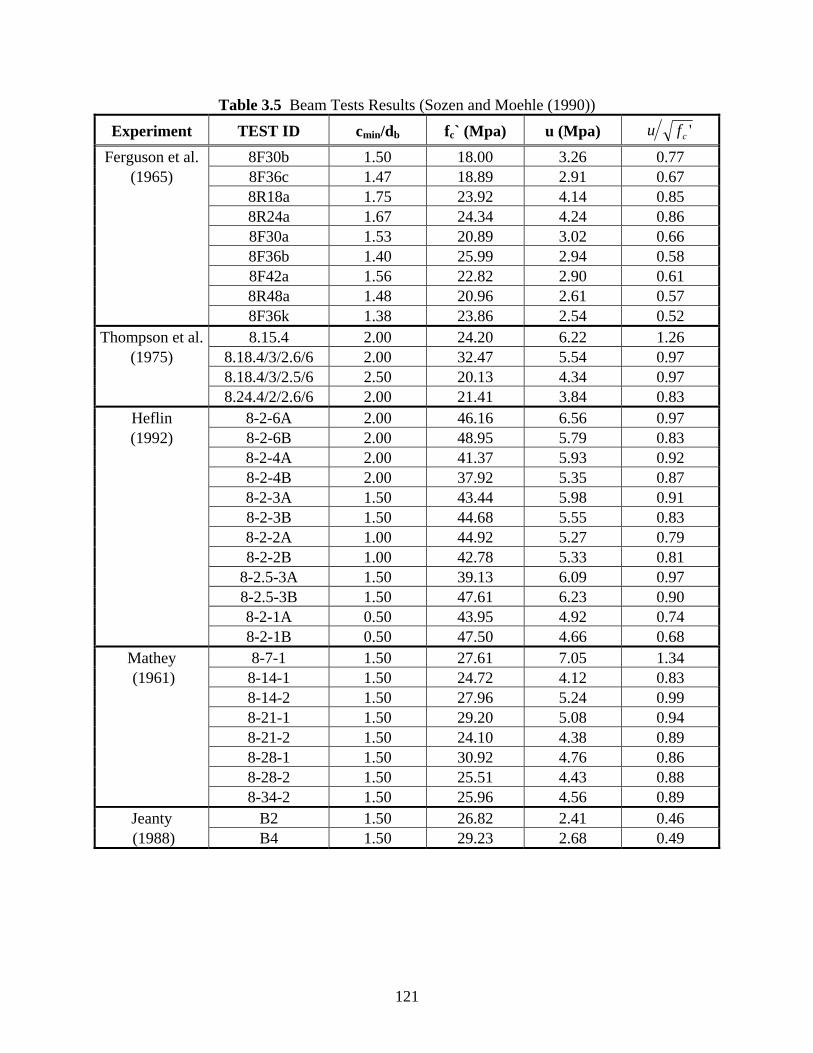
121
Table 3.5 Beam Tests Results (Sozen and Moehle (1990)) Experiment TEST ID cmin/db fc` (Mpa) u (Mpa) 'cfu
Ferguson et al. 8F30b 1.50 18.00 3.26 0.77 (1965) 8F36c 1.47 18.89 2.91 0.67
8R18a 1.75 23.92 4.14 0.85 8R24a 1.67 24.34 4.24 0.86 8F30a 1.53 20.89 3.02 0.66 8F36b 1.40 25.99 2.94 0.58 8F42a 1.56 22.82 2.90 0.61 8R48a 1.48 20.96 2.61 0.57 8F36k 1.38 23.86 2.54 0.52
Thompson et al. 8.15.4 2.00 24.20 6.22 1.26 (1975) 8.18.4/3/2.6/6 2.00 32.47 5.54 0.97
8.18.4/3/2.5/6 2.50 20.13 4.34 0.97 8.24.4/2/2.6/6 2.00 21.41 3.84 0.83
Heflin 8-2-6A 2.00 46.16 6.56 0.97 (1992) 8-2-6B 2.00 48.95 5.79 0.83
8-2-4A 2.00 41.37 5.93 0.92 8-2-4B 2.00 37.92 5.35 0.87 8-2-3A 1.50 43.44 5.98 0.91 8-2-3B 1.50 44.68 5.55 0.83 8-2-2A 1.00 44.92 5.27 0.79 8-2-2B 1.00 42.78 5.33 0.81 8-2.5-3A 1.50 39.13 6.09 0.97 8-2.5-3B 1.50 47.61 6.23 0.90 8-2-1A 0.50 43.95 4.92 0.74 8-2-1B 0.50 47.50 4.66 0.68
Mathey 8-7-1 1.50 27.61 7.05 1.34 (1961) 8-14-1 1.50 24.72 4.12 0.83
8-14-2 1.50 27.96 5.24 0.99 8-21-1 1.50 29.20 5.08 0.94 8-21-2 1.50 24.10 4.38 0.89 8-28-1 1.50 30.92 4.76 0.86 8-28-2 1.50 25.51 4.43 0.88 8-34-2 1.50 25.96 4.56 0.89
Jeanty B2 1.50 26.82 2.41 0.46 (1988) B4 1.50 29.23 2.68 0.49
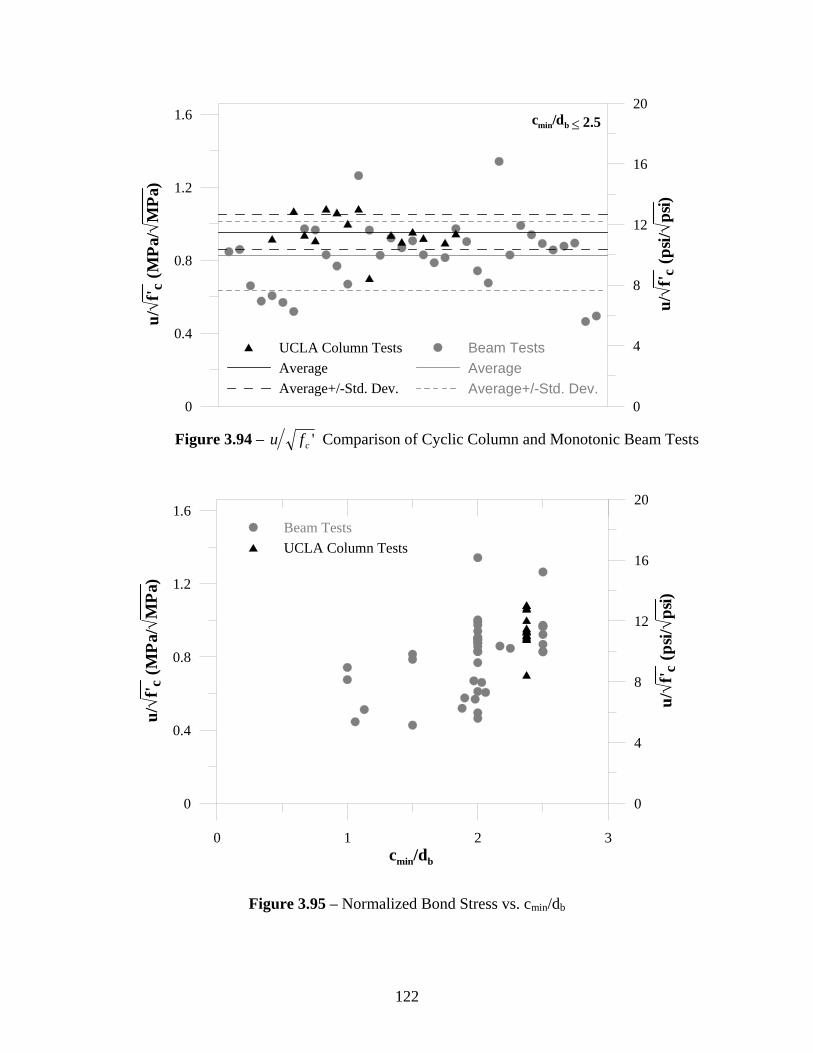
122
Figure 3.94 – 'cfu Comparison of Cyclic Column and Monotonic Beam Tests
Figure 3.95 – Normalized Bond Stress vs. cmin/db
0
4
8
12
16
20
u/√f
' c (p
si/√p
si )
0
0.4
0.8
1.2
1.6
u/√f
' c (M
Pa/√
MPa
)
UCLA Column TestsAverage Average+/-Std. Dev.
Beam TestsAverageAverage+/-Std. Dev.
≤cmin/db 2.5
0 1 2 3cmin/db
0
4
8
12
16
20
u/√f
' c (p
si/√p
si )
0
0.4
0.8
1.2
1.6
u/√f
' c (M
Pa/√
MPa
)
Beam TestsUCLA Column Tests

123
Figure 3.96 – Shear Deformation Measurement (S10MI, S20MI, and S30MI)
Figure 3.97 – S10MI Shear Deformation along Splice Length (20db)
-0.02 -0.01 0 0.01 0.02Shear Deformation (rad)
-400
-200
0
200
400
Shea
r Fo
rce
(kN
)
-80
-40
0
40
80
Shea
r Fo
rce
(kip
s)
VC
Vn
VC
Vn
d
b
h
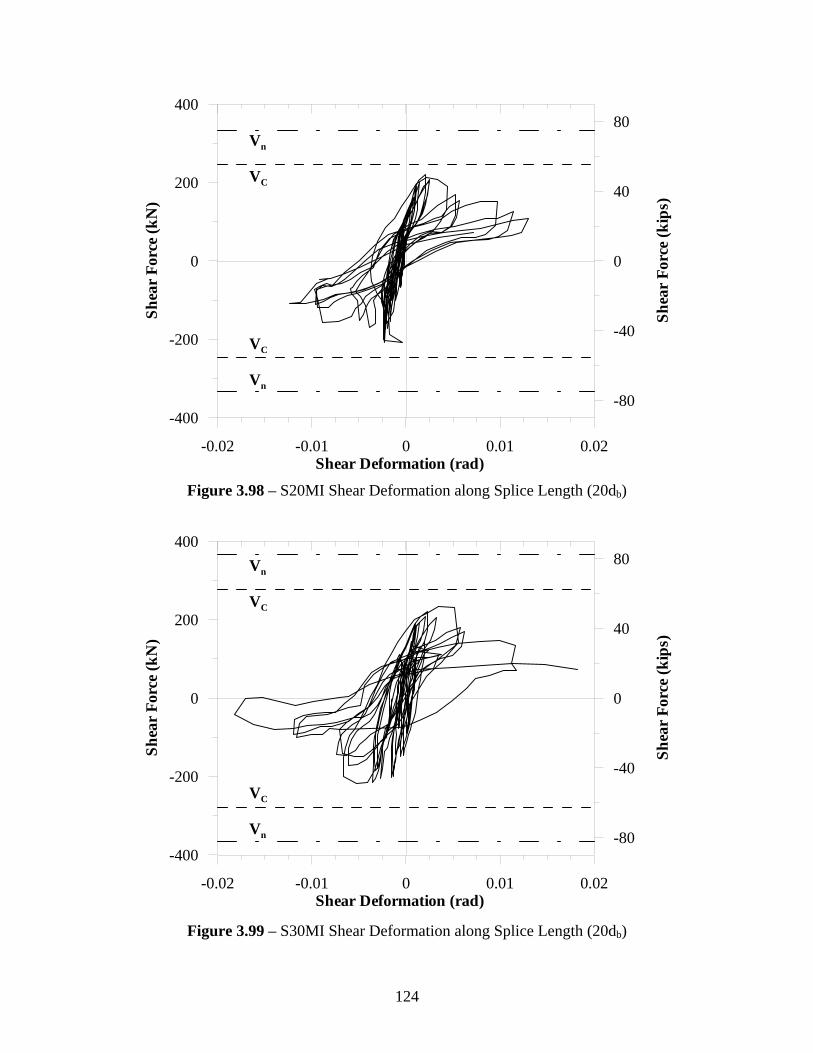
124
Figure 3.98 – S20MI Shear Deformation along Splice Length (20db)
Figure 3.99 – S30MI Shear Deformation along Splice Length (20db)
-0.02 -0.01 0 0.01 0.02Shear Deformation (rad)
-400
-200
0
200
400
Shea
r Fo
rce
(kN
)
-80
-40
0
40
80
Shea
r Fo
rce
(kip
s)
VC
Vn
VC
Vn
-0.02 -0.01 0 0.01 0.02Shear Deformation (rad)
-400
-200
0
200
400
Shea
r Fo
rce
(kN
)
-80
-40
0
40
80
Shea
r Fo
rce
(kip
s)
VC
Vn
VC
Vn

125
( ) ( )22
221 ulvhd ++−=′
( ) ( )21
212 ulvhd −++=′
lh
ddddddavg ⋅⋅
⋅⎟⎠⎞⎜
⎝⎛ −′−⋅⎟
⎠⎞⎜
⎝⎛ −′
=2
222111γ
d1, d2 = undeformed dimensions of two wire potentiometers
d1′, d2′ = deformed dimensions of two wire potentiometers
h = height of ‘X’ configuration
l = length of ‘X’ configuration
Figure 3.100 - Shear Deformation Measurement (S20HI, S20HIN, and S30XI)
h
l
d2
v1
d1
u2
u1
v2 d2′
d1′
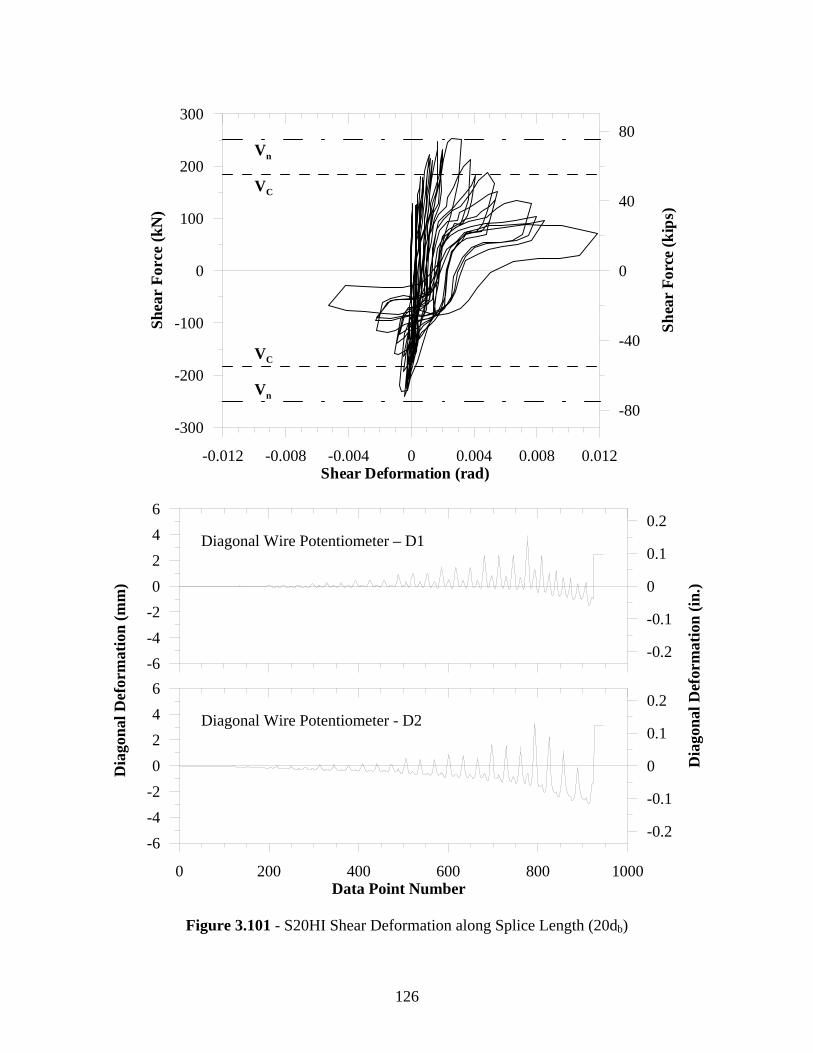
126
Figure 3.101 - S20HI Shear Deformation along Splice Length (20db)
-0.012 -0.008 -0.004 0 0.004 0.008 0.012Shear Deformation (rad)
-300
-200
-100
0
100
200
300
Shea
r Fo
rce
(kN
)
-80
-40
0
40
80
Shea
r Fo
rce
(kip
s)-0.2
-0.1
0
0.1
0.2
-6-4-20246
0 200 400 600 800 1000Data Point Number
-0.2
-0.1
0
0.1
0.2
-6-4-20246
Dia
gona
l Def
orm
atio
n (m
m)
Dia
gona
l Def
orm
atio
n (in
.)
VC
Vn
VC
Vn
Diagonal Wire Potentiometer - D2
Diagonal Wire Potentiometer – D1
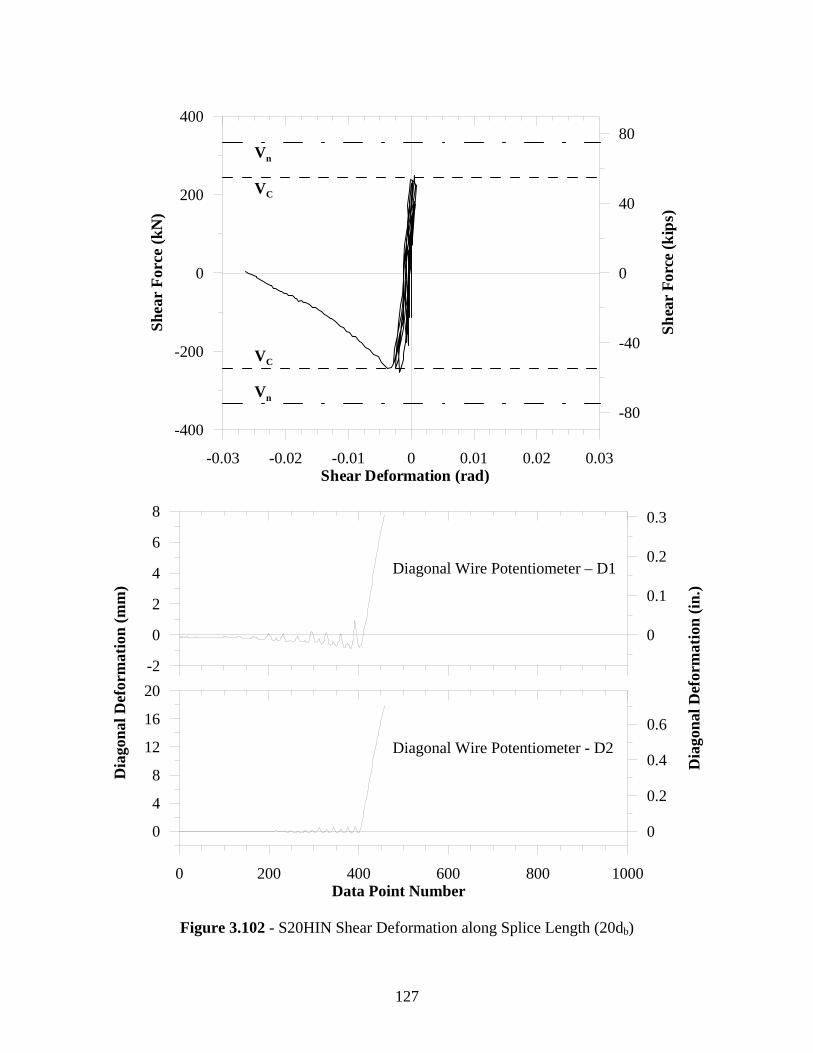
127
Figure 3.102 - S20HIN Shear Deformation along Splice Length (20db)
-0.03 -0.02 -0.01 0 0.01 0.02 0.03Shear Deformation (rad)
-400
-200
0
200
400
Shea
r Fo
rce
(kN
)
-80
-40
0
40
80
Shea
r Fo
rce
(kip
s)
0
0.1
0.2
0.3
-2
0
2
4
6
8
0 200 400 600 800 1000Data Point Number
0
0.2
0.4
0.6
0
4
8
12
16
20
Dia
gona
l Def
orm
atio
n (m
m)
Dia
gona
l Def
orm
atio
n (in
.)
VC
Vn
VC
Vn
Diagonal Wire Potentiometer - D2
Diagonal Wire Potentiometer – D1
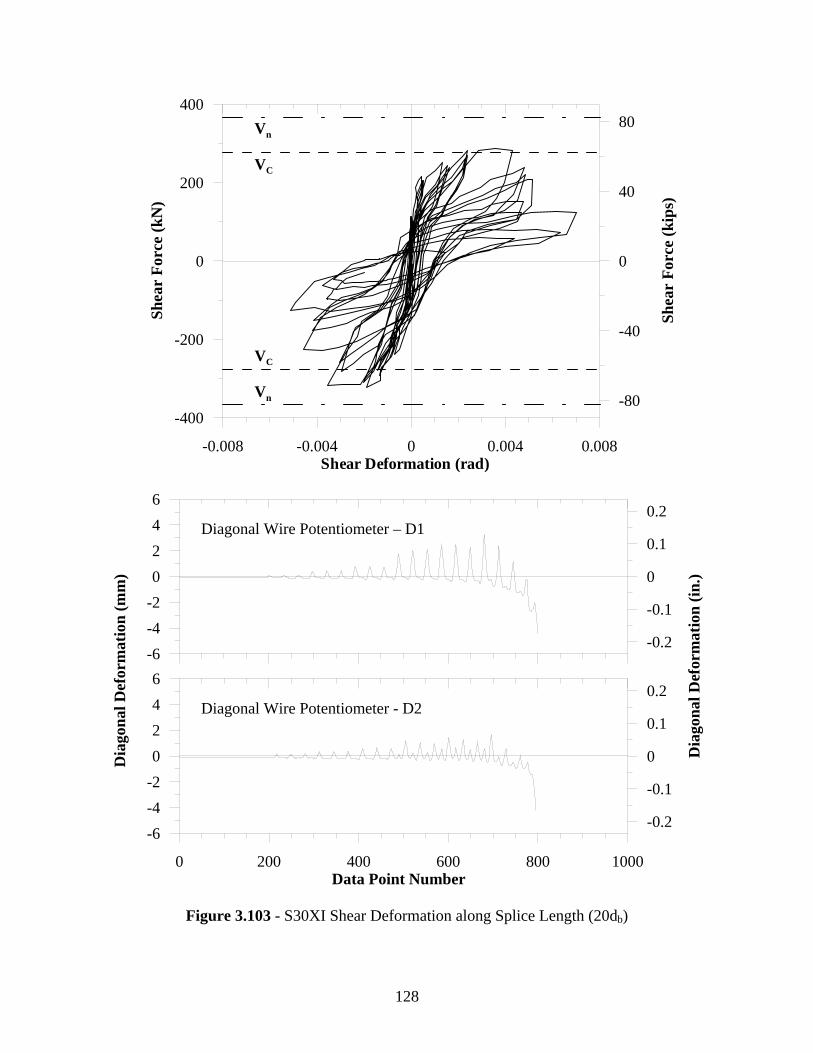
128
Figure 3.103 - S30XI Shear Deformation along Splice Length (20db)
-0.008 -0.004 0 0.004 0.008Shear Deformation (rad)
-400
-200
0
200
400
Shea
r Fo
rce
(kN
)
-80
-40
0
40
80
Shea
r Fo
rce
(kip
s)-0.2
-0.1
0
0.1
0.2
-6-4-20246
0 200 400 600 800 1000Data Point Number
-0.2
-0.1
0
0.1
0.2
-6-4-20246
Dia
gona
l Def
orm
atio
n (m
m)
Dia
gona
l Def
orm
atio
n (in
.)
VC
Vn
VC
Vn
Diagonal Wire Potentiometer - D2
Diagonal Wire Potentiometer – D1

Appendix: Strain Histories
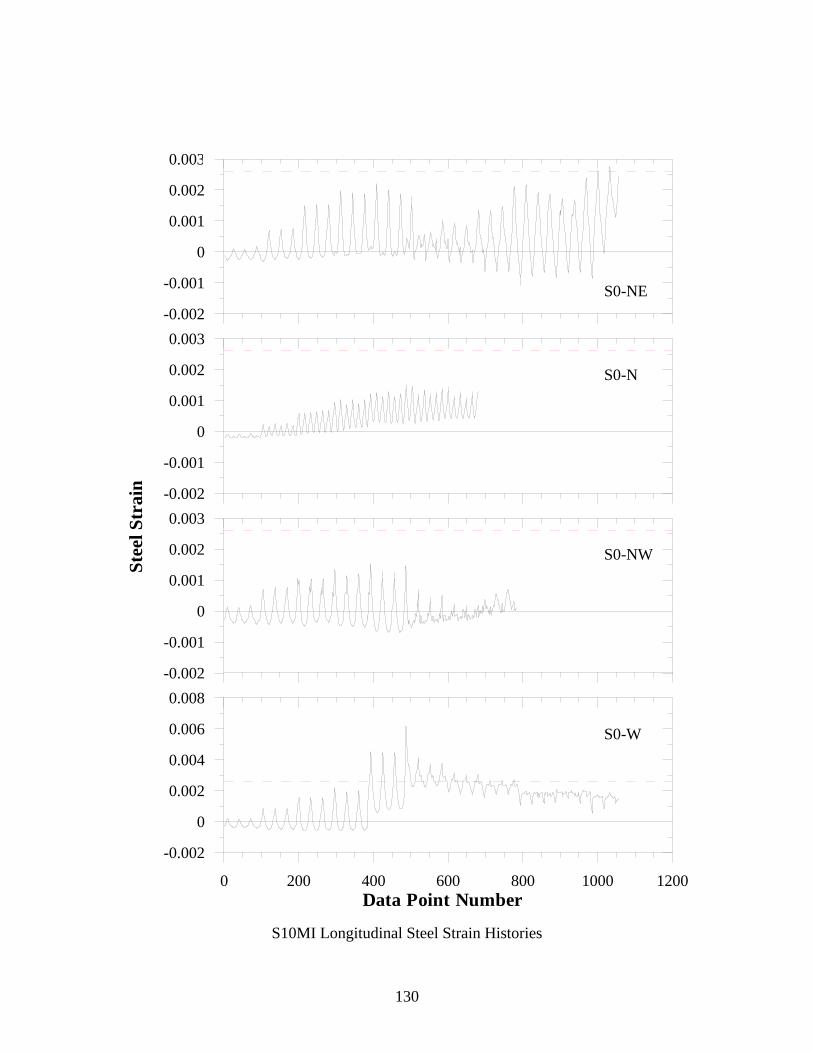
130
S10MI Longitudinal Steel Strain Histories
-0.002
-0.001
0
0.001
0.002
0.003St
eel S
trai
n -0.002
-0.001
0
0.001
0.002
0.003
-0.002
-0.001
0
0.001
0.002
0.003
0 200 400 600 800 1000 1200Data Point Number
-0.002
0
0.002
0.004
0.006
0.008
S0-NE
S0-W
S0-N
S0-NW
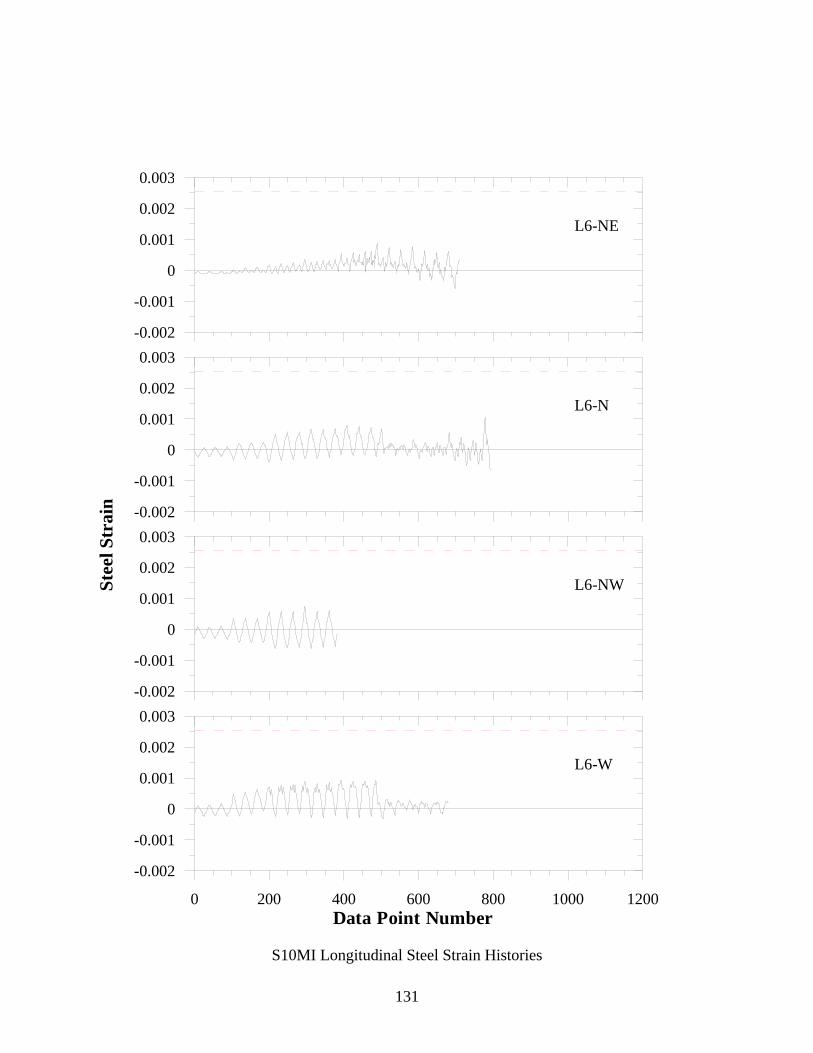
131
-0.002
-0.001
0
0.001
0.002
0.003
Stee
l Str
ain -0.002
-0.001
0
0.001
0.002
0.003
-0.002
-0.001
0
0.001
0.002
0.003
0 200 400 600 800 1000 1200Data Point Number
-0.002
-0.001
0
0.001
0.002
0.003
L6-NE
L6-N
L6-NW
L6-W
S10MI Longitudinal Steel Strain Histories
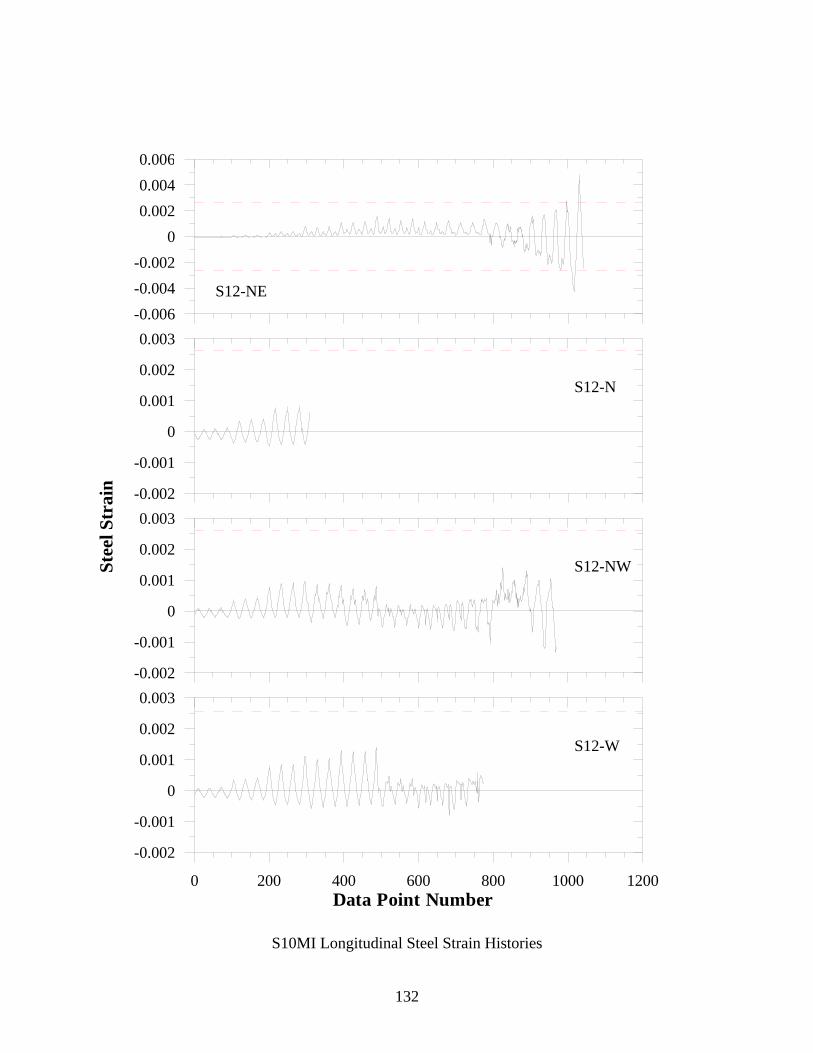
132
-0.006-0.004-0.002
00.0020.0040.006
Stee
l Str
ain -0.002
-0.001
0
0.001
0.002
0.003
-0.002
-0.001
0
0.001
0.002
0.003
0 200 400 600 800 1000 1200Data Point Number
-0.002
-0.001
0
0.001
0.002
0.003
S12-NE
S12-N
S12-NW
S12-W
S10MI Longitudinal Steel Strain Histories
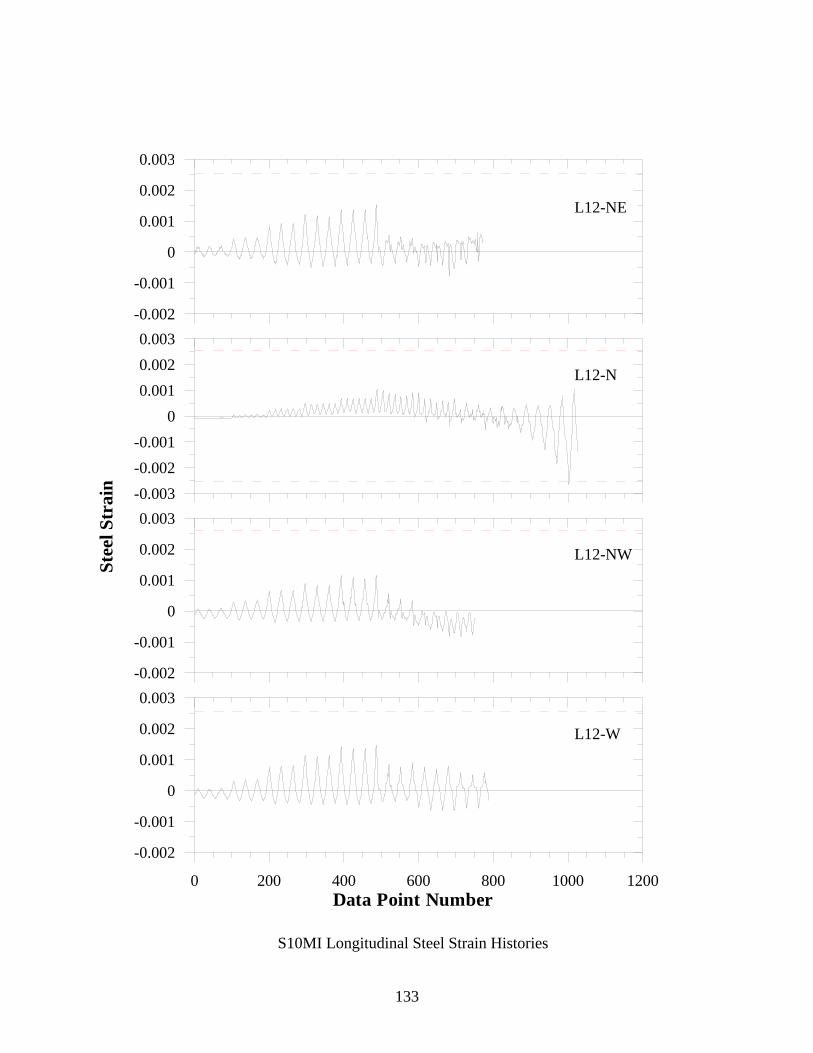
133
-0.002
-0.001
0
0.001
0.002
0.003
Stee
l Str
ain -0.003
-0.002-0.001
00.0010.0020.003
-0.002
-0.001
0
0.001
0.002
0.003
0 200 400 600 800 1000 1200Data Point Number
-0.002
-0.001
0
0.001
0.002
0.003
L12-NE
L12-NW
L12-N
L12-W
S10MI Longitudinal Steel Strain Histories
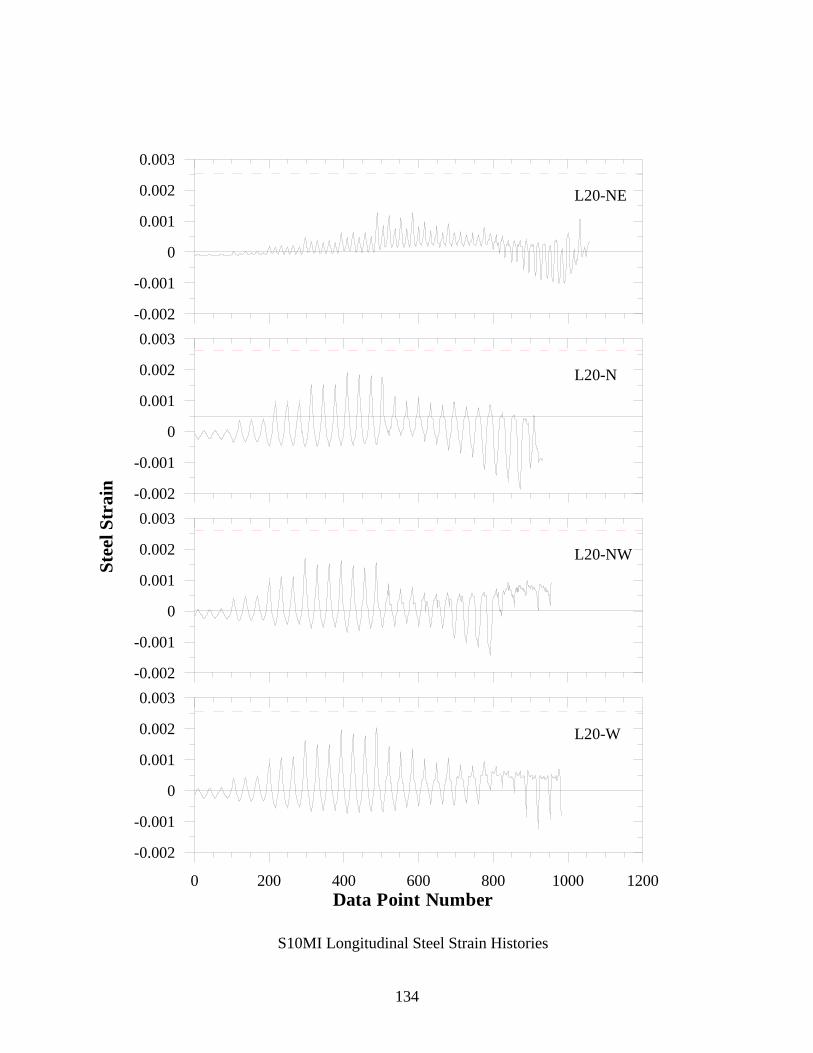
134
-0.002
-0.001
0
0.001
0.002
0.003
Stee
l Str
ain -0.002
-0.001
0
0.001
0.002
0.003
-0.002
-0.001
0
0.001
0.002
0.003
0 200 400 600 800 1000 1200Data Point Number
-0.002
-0.001
0
0.001
0.002
0.003
L20-NE
L20-W
L20-N
L20-NW
S10MI Longitudinal Steel Strain Histories

135
-0.002
-0.001
0
0.001
0.002
0.003
Stee
l Str
ain -0.002
-0.001
0
0.001
0.002
0.003
-0.002
-0.001
0
0.001
0.002
0.003
0 200 400 600 800 1000 1200Data Point Number
-0.002
-0.001
0
0.001
0.002
0.003
L28-NE
L28-W
L28-N
L28-NW
S10MI Longitudinal Steel Strain Histories
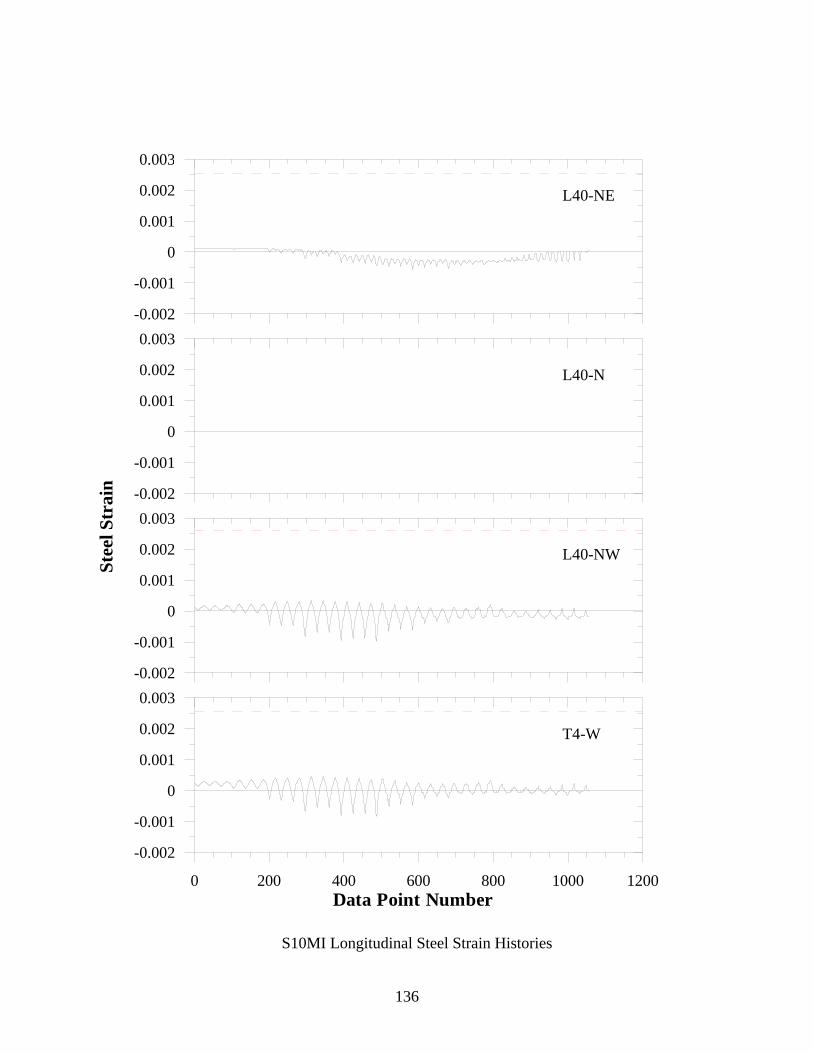
136
-0.002
-0.001
0
0.001
0.002
0.003
Stee
l Str
ain -0.002
-0.001
0
0.001
0.002
0.003
-0.002
-0.001
0
0.001
0.002
0.003
0 200 400 600 800 1000 1200Data Point Number
-0.002
-0.001
0
0.001
0.002
0.003
L40-NE
L40-N
L40-NW
T4-W
S10MI Longitudinal Steel Strain Histories

137
-0.002
-0.001
0
0.001
0.002
0.003
Stee
l Str
ain -0.002
-0.001
0
0.001
0.002
0.003
-0.002
-0.001
0
0.001
0.002
0.003
0 200 400 600 800 1000 1200Data Point Number
-0.002
-0.001
0
0.001
0.002
0.003
T4-E
T16-W
T16-E
T28-W
S10MI Longitudinal Steel Strain Histories
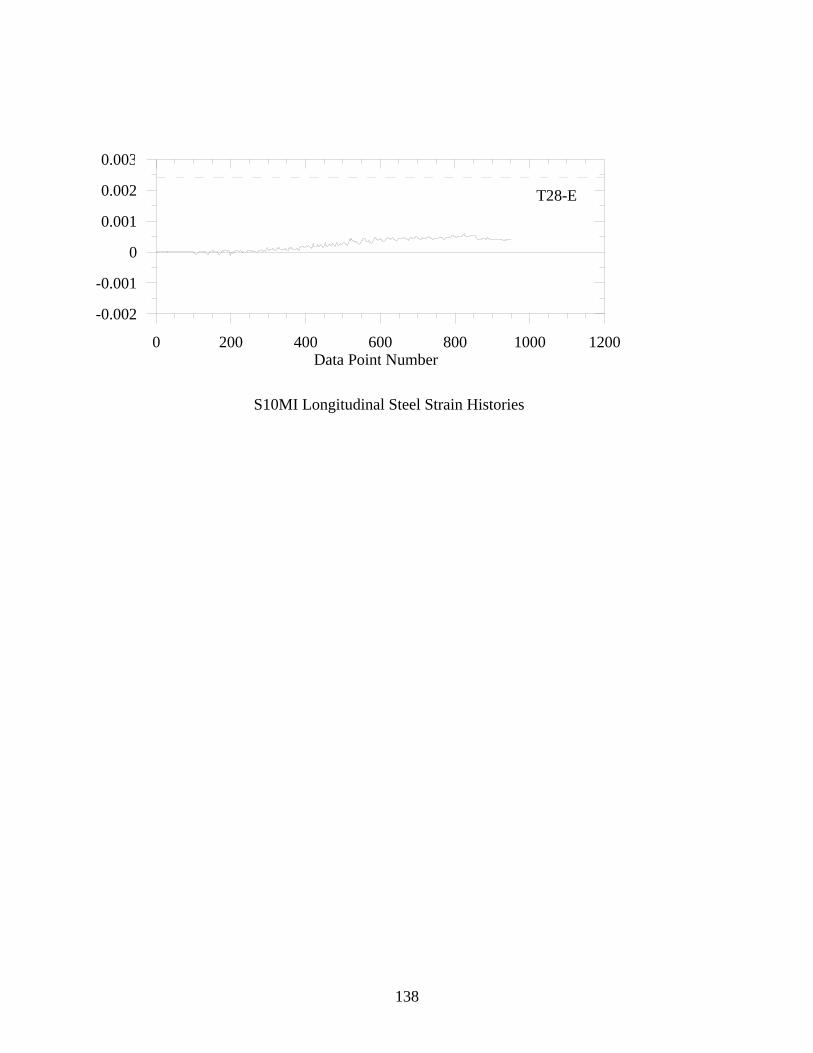
138
0 200 400 600 800 1000 1200Data Point Number
-0.002
-0.001
0
0.001
0.002
0.003
T28-E
S10MI Longitudinal Steel Strain Histories
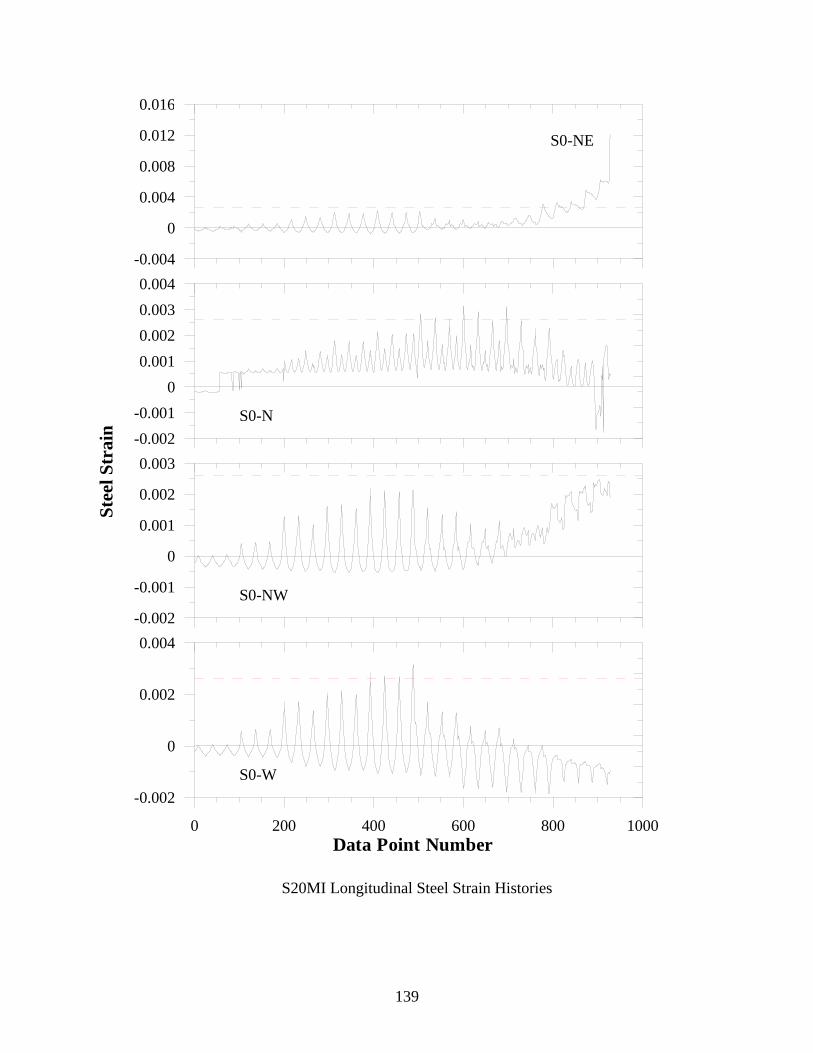
139
-0.004
0
0.004
0.008
0.012
0.016St
eel S
trai
n -0.002-0.001
00.0010.0020.0030.004
-0.002
-0.001
0
0.001
0.002
0.003
0 200 400 600 800 1000Data Point Number
-0.002
0
0.002
0.004
S0-NE
S0-N
S0-NW
S0-W
S20MI Longitudinal Steel Strain Histories

140
-0.002
-0.001
0
0.001
0.002
0.003St
eel S
trai
n -0.002
-0.001
0
0.001
0.002
0.003
-0.002
-0.001
0
0.001
0.002
0.003
0 200 400 600 800 1000Data Point Number
-0.002
-0.001
0
0.001
0.002
0.003
L6-NE
L6-N
L6-NW
L6-W
S20MI Longitudinal Steel Strain Histories
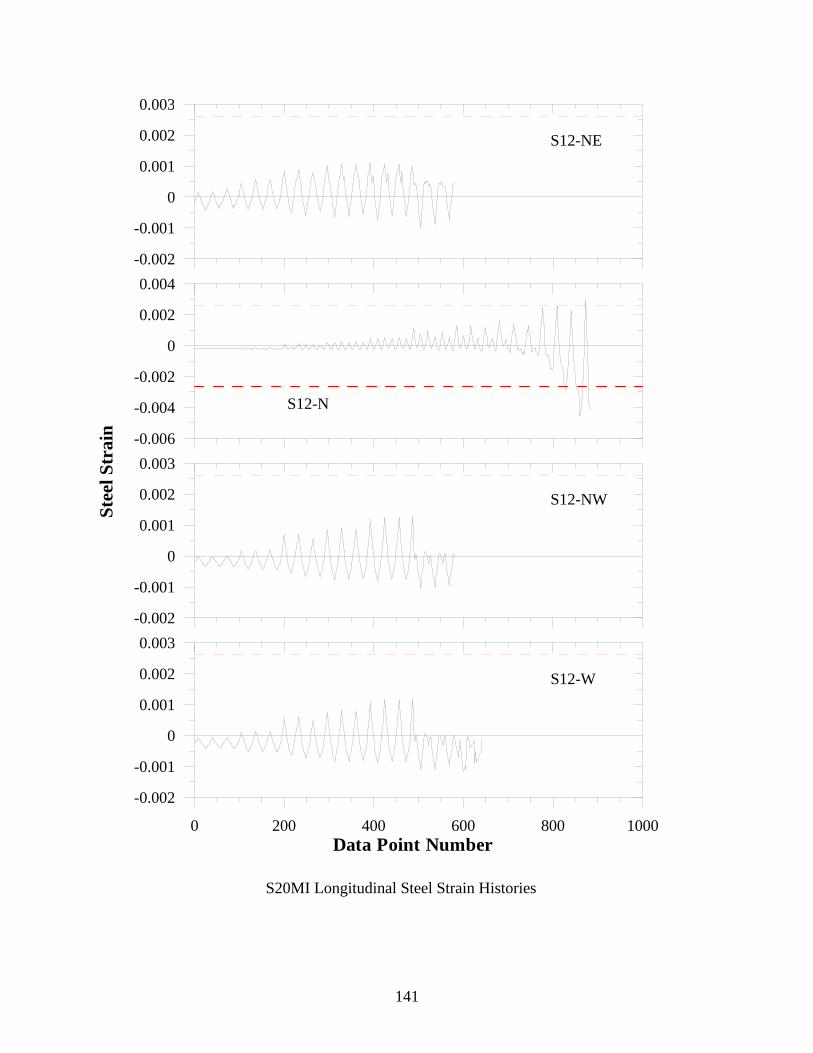
141
-0.002
-0.001
0
0.001
0.002
0.003St
eel S
trai
n -0.006
-0.004
-0.002
0
0.002
0.004
-0.002
-0.001
0
0.001
0.002
0.003
0 200 400 600 800 1000Data Point Number
-0.002
-0.001
0
0.001
0.002
0.003
S12-NE
S12-N
S12-NW
S12-W
S20MI Longitudinal Steel Strain Histories
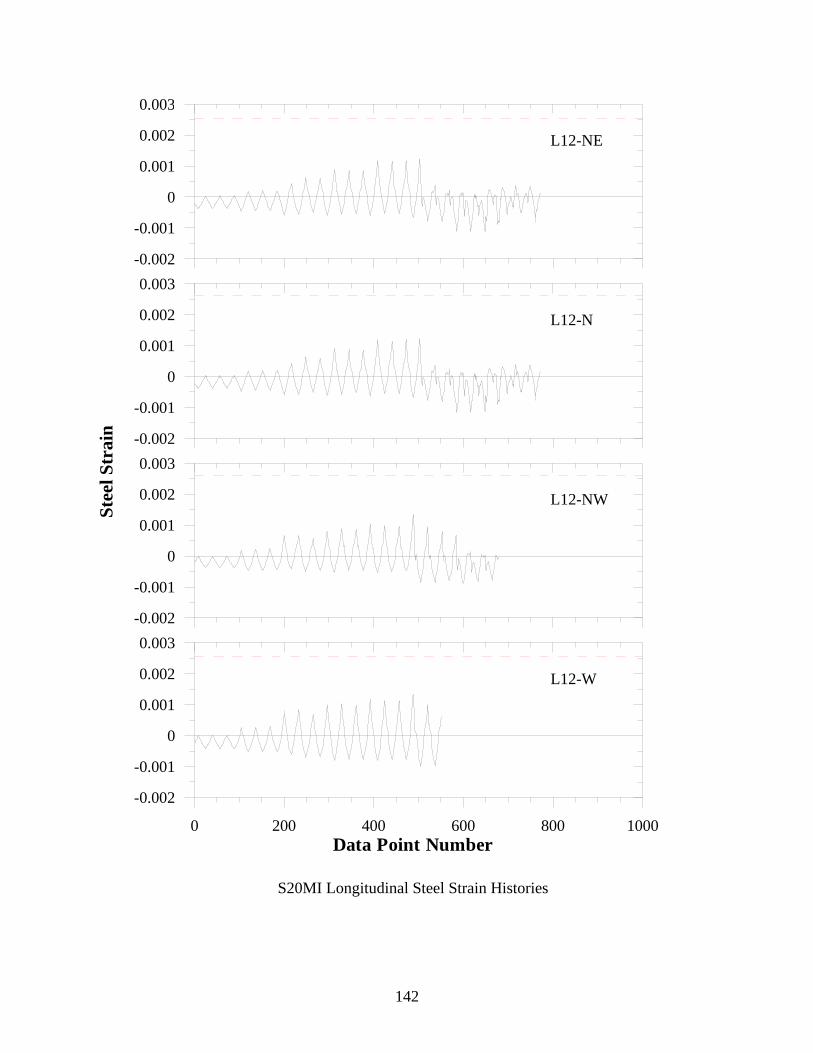
142
-0.002
-0.001
0
0.001
0.002
0.003St
eel S
trai
n -0.002
-0.001
0
0.001
0.002
0.003
-0.002
-0.001
0
0.001
0.002
0.003
0 200 400 600 800 1000Data Point Number
-0.002
-0.001
0
0.001
0.002
0.003
L12-NE
L12-N
L12-NW
L12-W
S20MI Longitudinal Steel Strain Histories
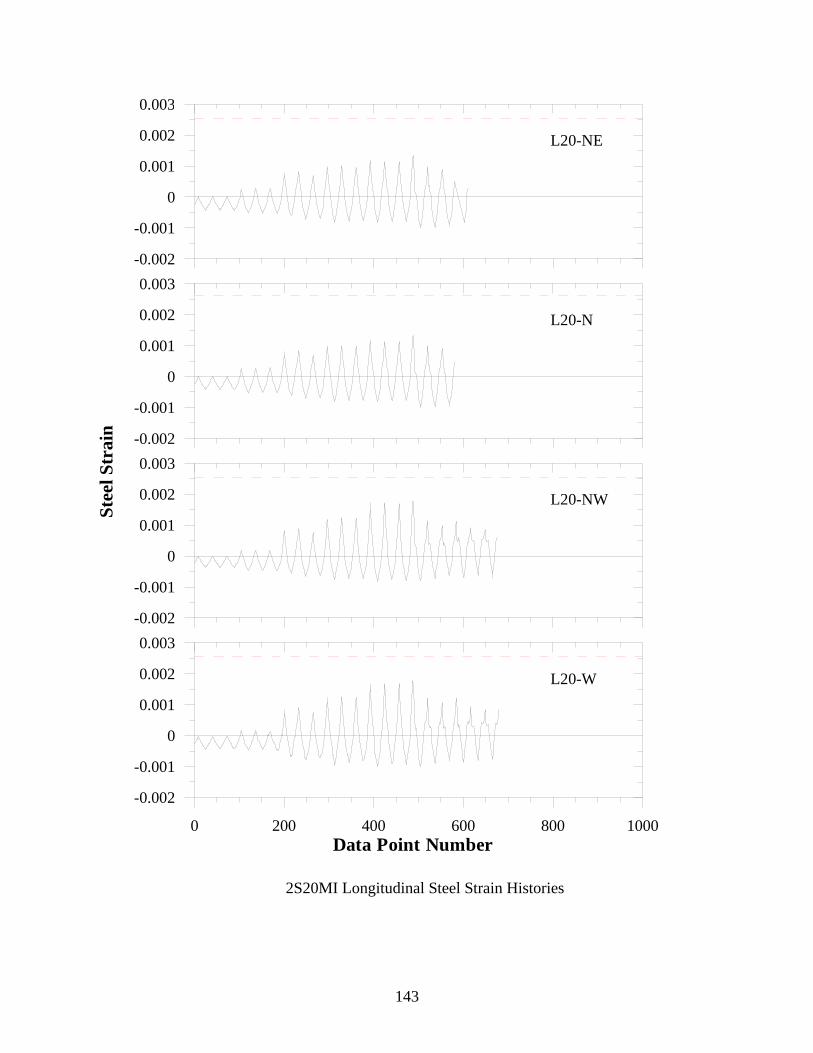
143
-0.002
-0.001
0
0.001
0.002
0.003St
eel S
trai
n -0.002
-0.001
0
0.001
0.002
0.003
-0.002
-0.001
0
0.001
0.002
0.003
0 200 400 600 800 1000Data Point Number
-0.002
-0.001
0
0.001
0.002
0.003
L20-NE
L20-N
L20-NW
L20-W
2S20MI Longitudinal Steel Strain Histories
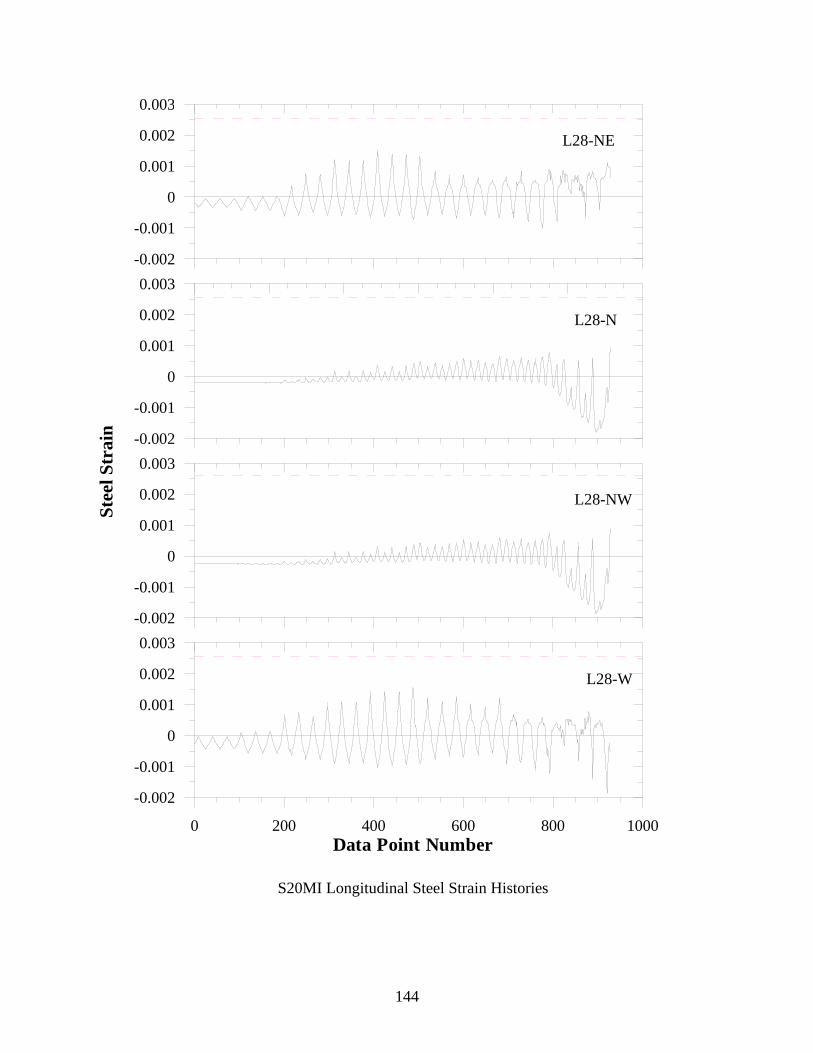
144
-0.002
-0.001
0
0.001
0.002
0.003St
eel S
trai
n -0.002
-0.001
0
0.001
0.002
0.003
-0.002
-0.001
0
0.001
0.002
0.003
0 200 400 600 800 1000Data Point Number
-0.002
-0.001
0
0.001
0.002
0.003
L28-NE
L28-N
L28-NW
L28-W
S20MI Longitudinal Steel Strain Histories
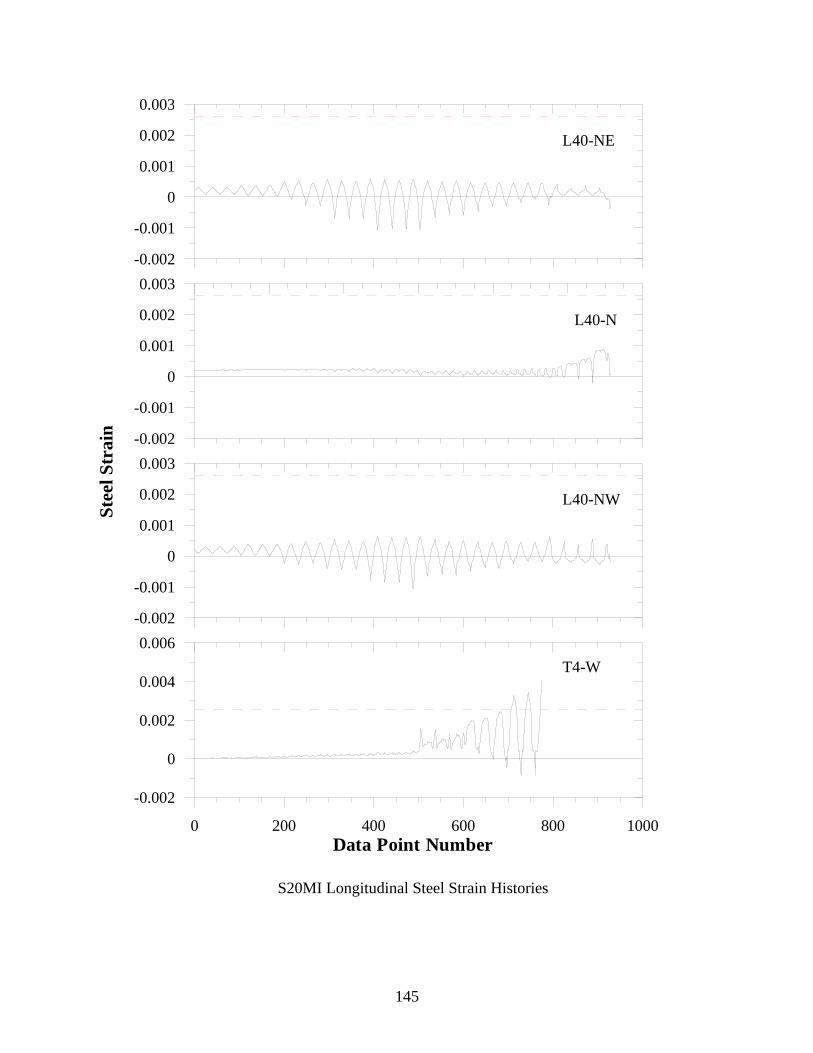
145
-0.002
-0.001
0
0.001
0.002
0.003St
eel S
trai
n -0.002
-0.001
0
0.001
0.002
0.003
-0.002
-0.001
0
0.001
0.002
0.003
0 200 400 600 800 1000Data Point Number
-0.002
0
0.002
0.004
0.006
L40-NE
L40-N
L40-NW
T4-W
S20MI Longitudinal Steel Strain Histories
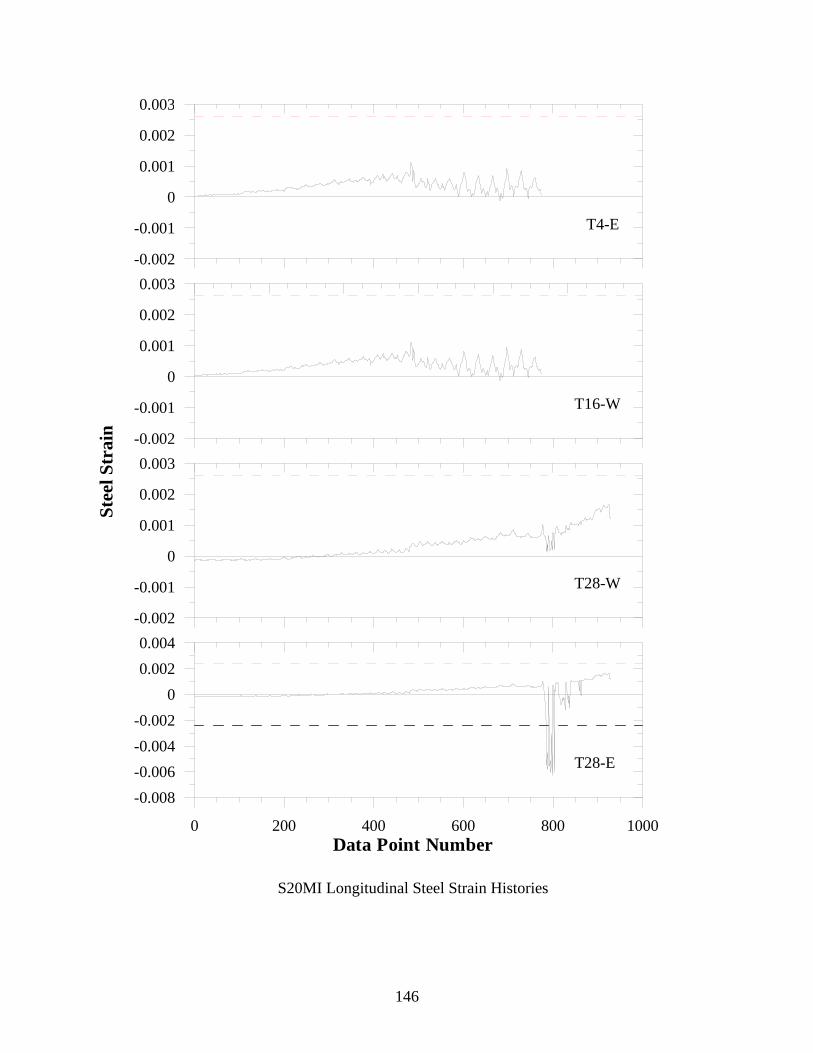
146
-0.002
-0.001
0
0.001
0.002
0.003St
eel S
trai
n -0.002
-0.001
0
0.001
0.002
0.003
-0.002
-0.001
0
0.001
0.002
0.003
0 200 400 600 800 1000Data Point Number
-0.008-0.006-0.004-0.002
00.0020.004
T4-E
T16-W
T28-W
T28-E
S20MI Longitudinal Steel Strain Histories
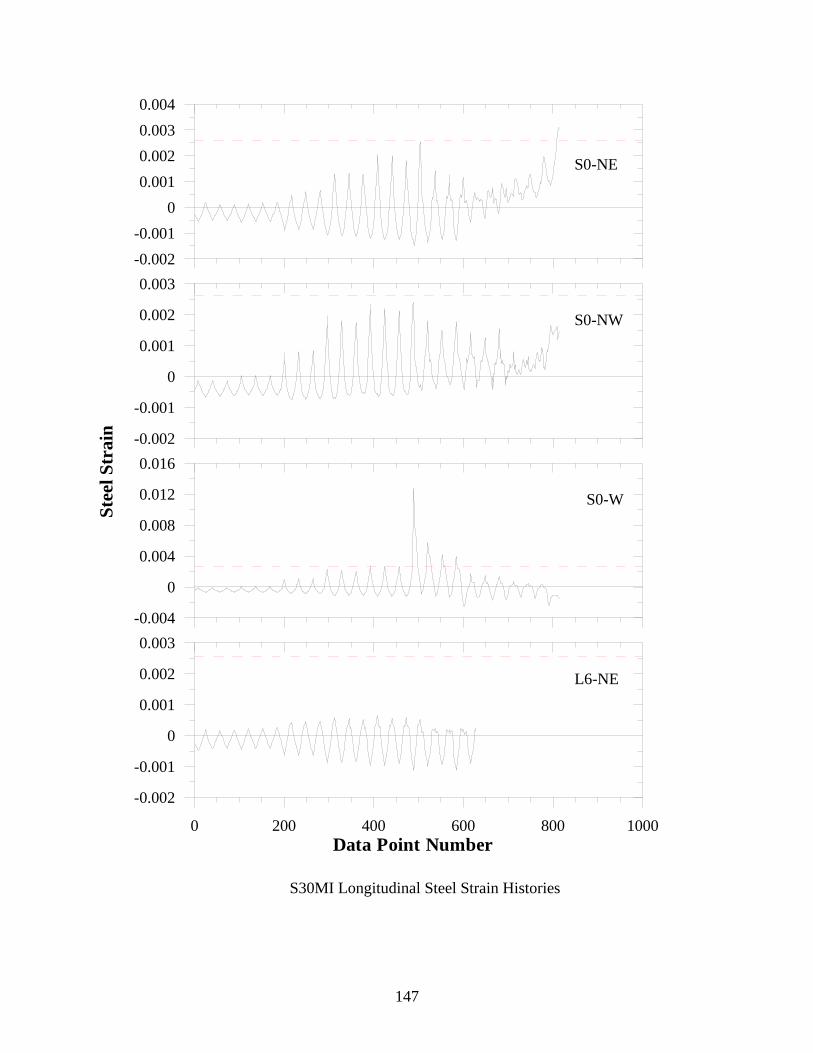
147
-0.002-0.001
00.0010.0020.0030.004
Stee
l Str
ain -0.002
-0.001
0
0.001
0.002
0.003
-0.004
0
0.004
0.008
0.012
0.016
0 200 400 600 800 1000Data Point Number
-0.002
-0.001
0
0.001
0.002
0.003
S0-NE
S0-W
L6-NE
S0-NW
S30MI Longitudinal Steel Strain Histories
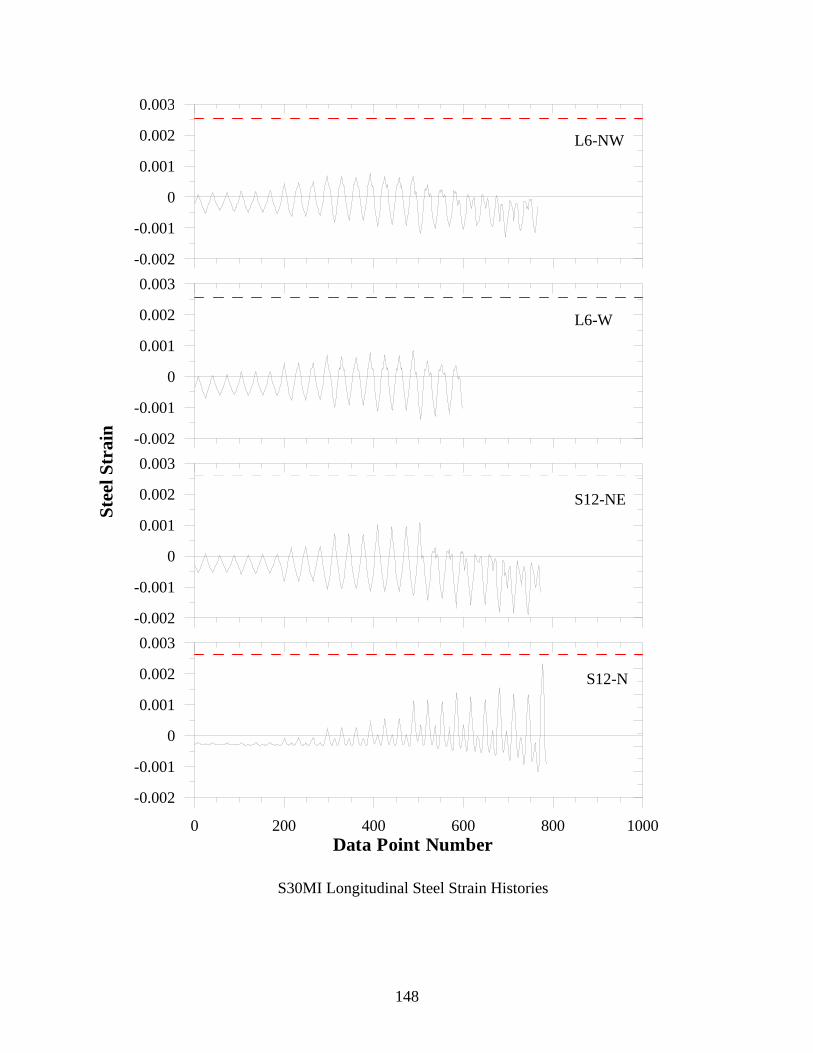
148
-0.002
-0.001
0
0.001
0.002
0.003St
eel S
trai
n -0.002
-0.001
0
0.001
0.002
0.003
-0.002
-0.001
0
0.001
0.002
0.003
0 200 400 600 800 1000Data Point Number
-0.002
-0.001
0
0.001
0.002
0.003
L6-NW
S12-NE
S12-N
L6-W
S30MI Longitudinal Steel Strain Histories
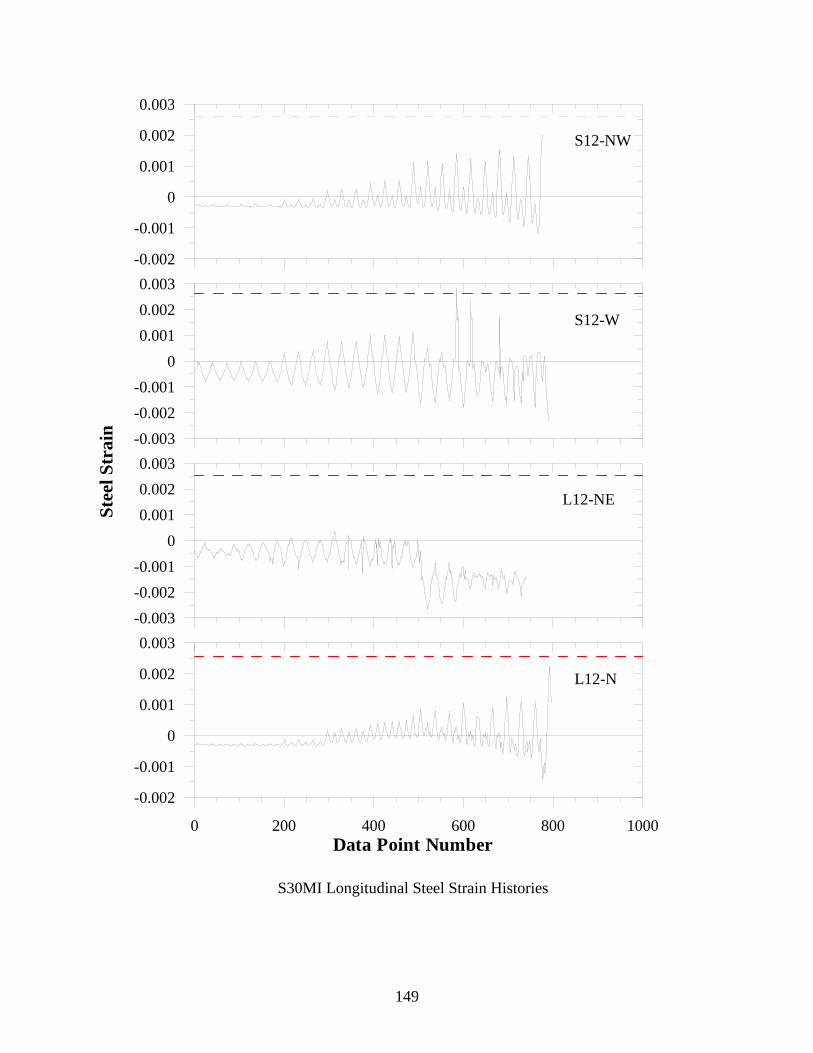
149
-0.002
-0.001
0
0.001
0.002
0.003St
eel S
trai
n -0.003-0.002-0.001
00.0010.0020.003
-0.003-0.002-0.001
00.0010.0020.003
0 200 400 600 800 1000Data Point Number
-0.002
-0.001
0
0.001
0.002
0.003
S12-NW
L12-NE
L12-N
S12-W
S30MI Longitudinal Steel Strain Histories
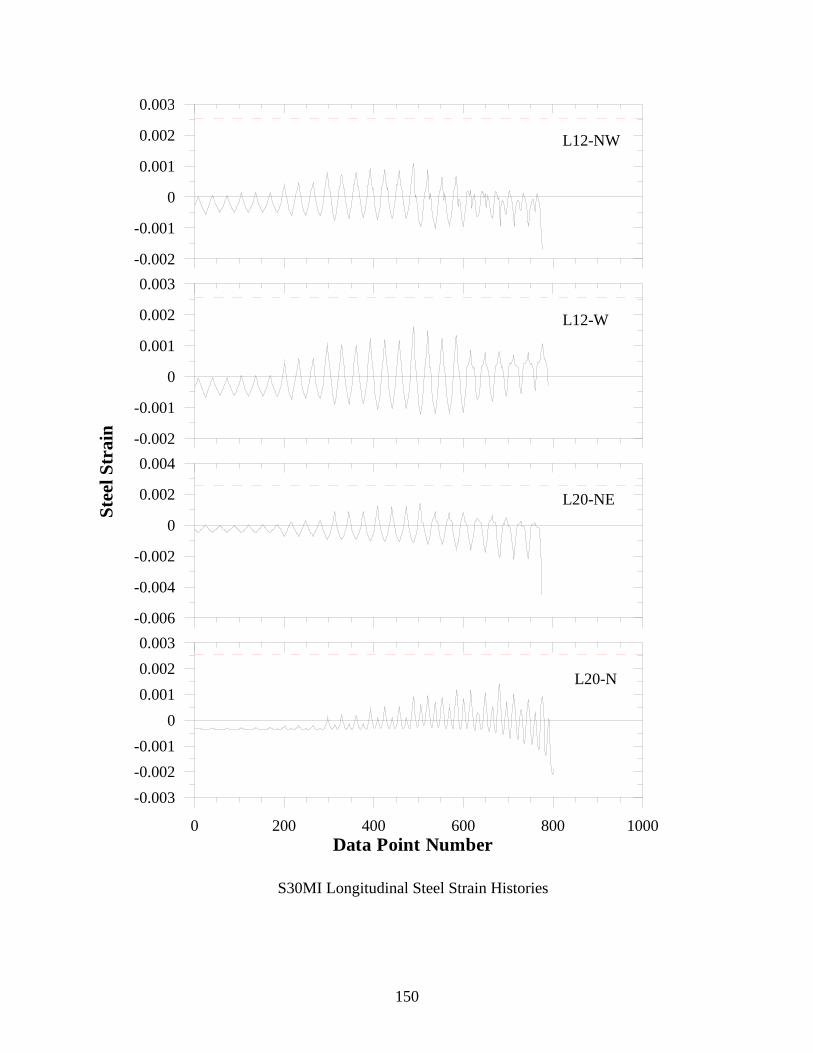
150
-0.002
-0.001
0
0.001
0.002
0.003St
eel S
trai
n -0.002
-0.001
0
0.001
0.002
0.003
-0.006
-0.004
-0.002
0
0.002
0.004
0 200 400 600 800 1000Data Point Number
-0.003-0.002-0.001
00.0010.0020.003
L12-NW
L20-NE
L20-N
L12-W
S30MI Longitudinal Steel Strain Histories

151
-0.002
-0.001
0
0.001
0.002
0.003St
eel S
trai
n -0.002
-0.001
0
0.001
0.002
0.003
-0.002
-0.001
0
0.001
0.002
0.003
0 200 400 600 800 1000Data Point Number
-0.003-0.002-0.001
00.0010.0020.003
L20-NW
L28-NE
L28-N
L20-W
S30MI Longitudinal Steel Strain Histories
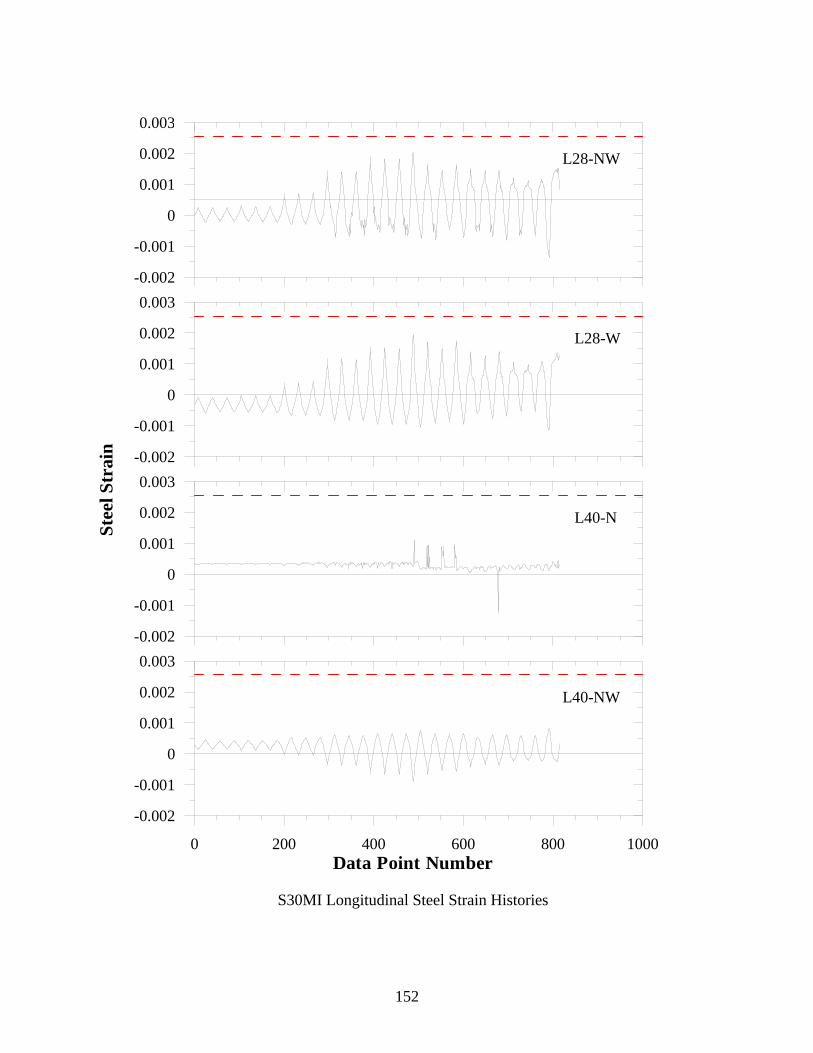
152
-0.002
-0.001
0
0.001
0.002
0.003St
eel S
trai
n -0.002
-0.001
0
0.001
0.002
0.003
-0.002
-0.001
0
0.001
0.002
0.003
0 200 400 600 800 1000Data Point Number
-0.002
-0.001
0
0.001
0.002
0.003
L28-NW
L40-N
L40-NW
L28-W
S30MI Longitudinal Steel Strain Histories
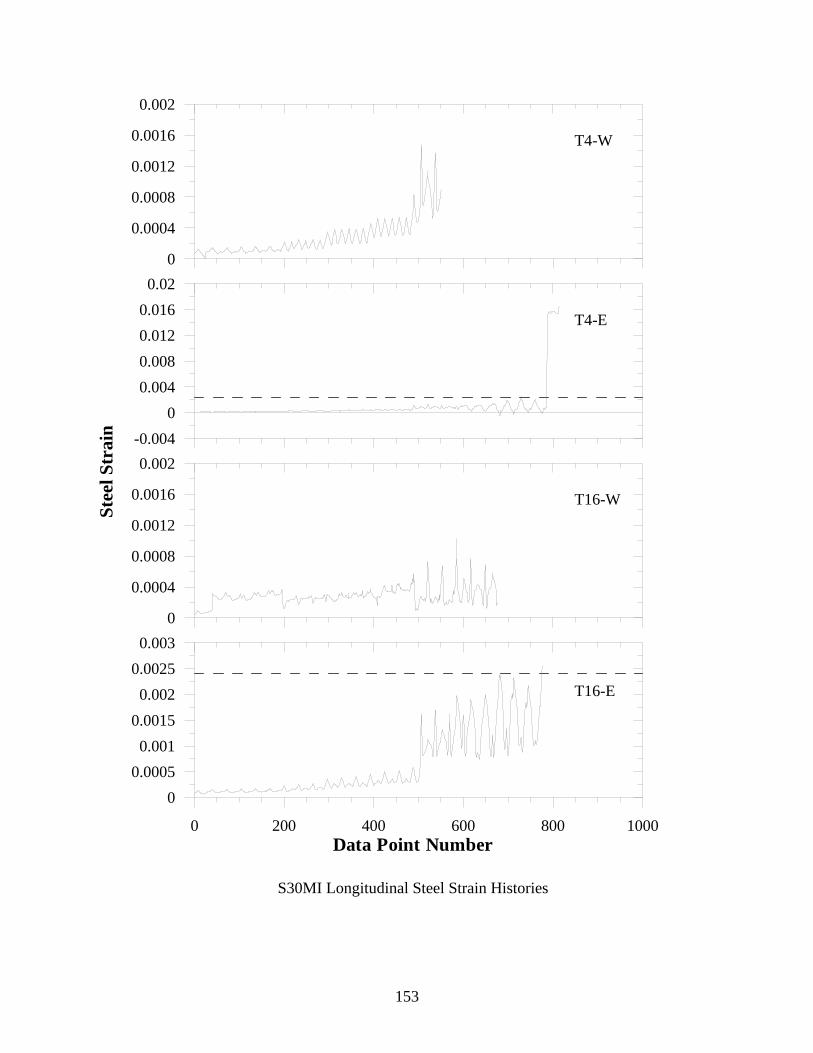
153
0
0.0004
0.0008
0.0012
0.0016
0.002St
eel S
trai
n -0.0040
0.0040.0080.0120.0160.02
0
0.0004
0.0008
0.0012
0.0016
0.002
0 200 400 600 800 1000Data Point Number
00.00050.001
0.00150.002
0.00250.003
T4-W
T16-W
T16-E
T4-E
S30MI Longitudinal Steel Strain Histories
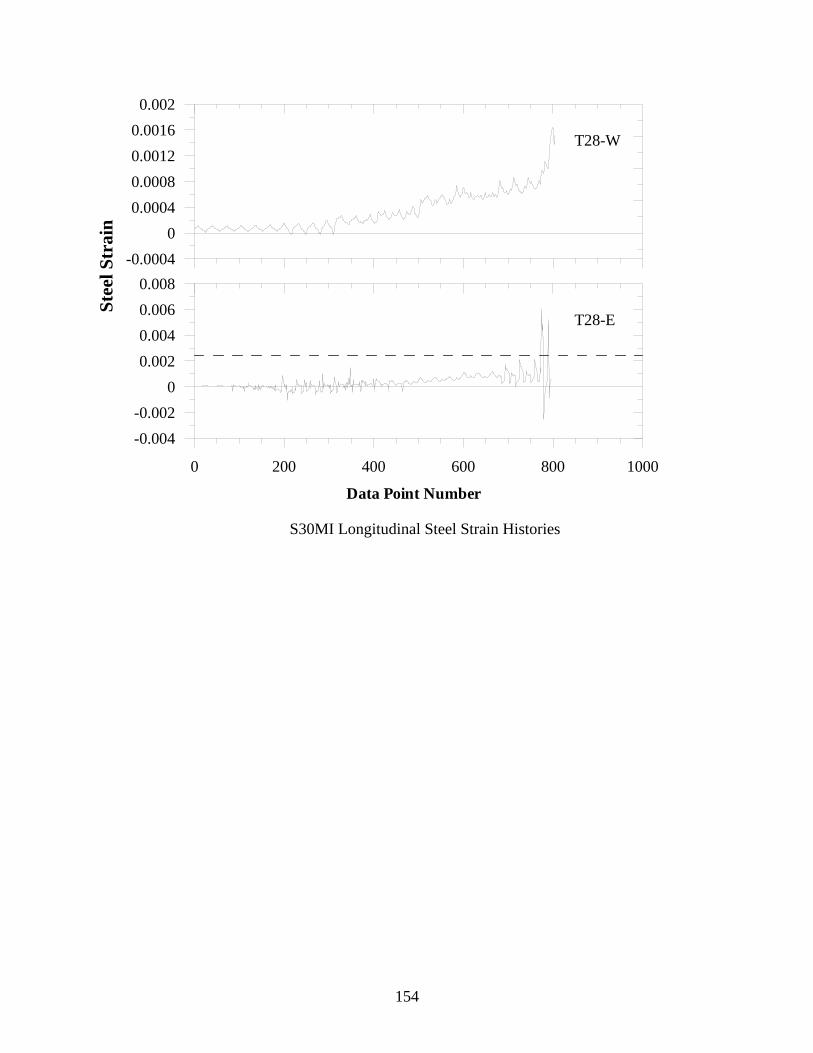
154
-0.00040
0.00040.00080.00120.00160.002
Stee
l Str
ain
0 200 400 600 800 1000
Data Point Number
-0.004-0.002
00.0020.0040.0060.008
T28-W
T28-E
S30MI Longitudinal Steel Strain Histories
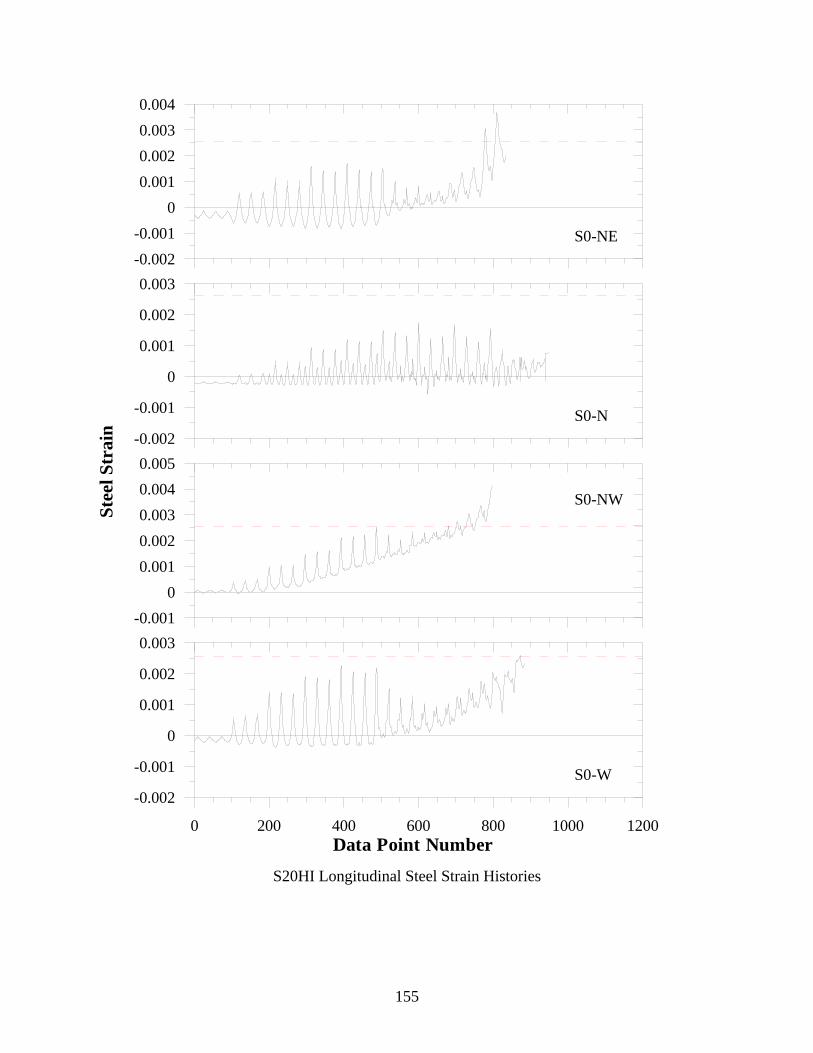
155
-0.002-0.001
00.0010.0020.0030.004
Stee
l Str
ain -0.002
-0.001
0
0.001
0.002
0.003
-0.0010
0.0010.0020.0030.0040.005
0 200 400 600 800 1000 1200Data Point Number
-0.002
-0.001
0
0.001
0.002
0.003
S0-NE
S0-N
S0-NW
S0-W
S20HI Longitudinal Steel Strain Histories
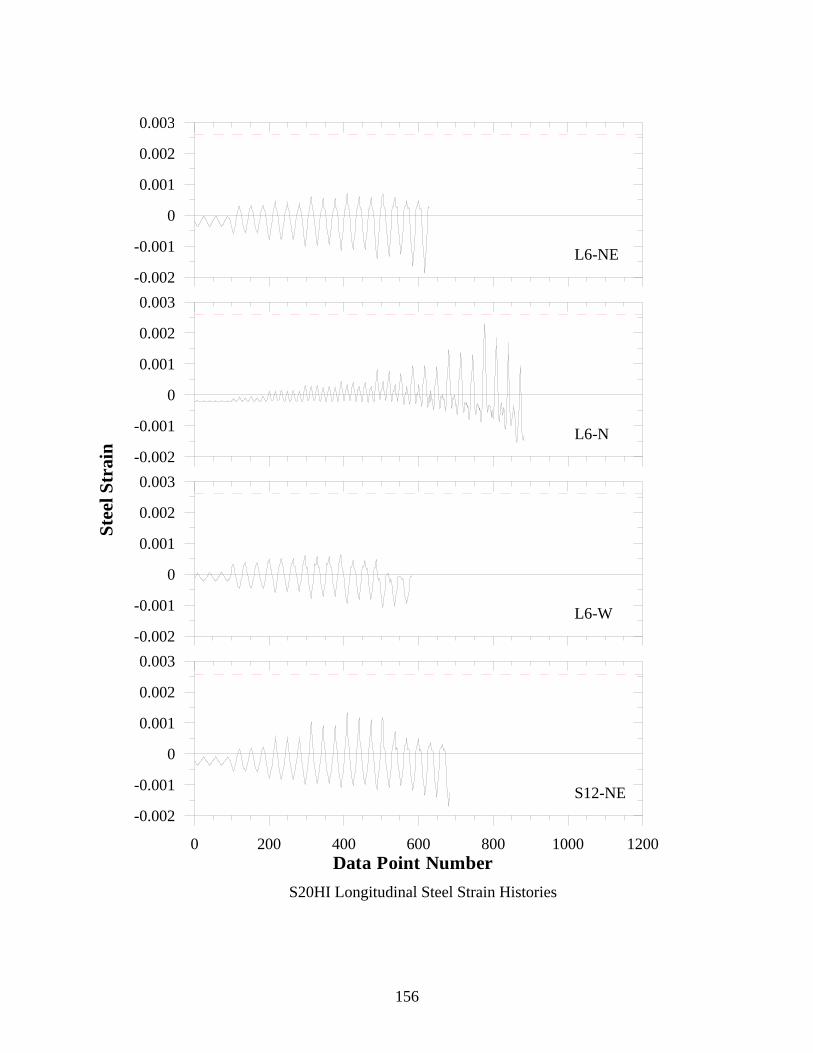
156
-0.002
-0.001
0
0.001
0.002
0.003St
eel S
trai
n -0.002
-0.001
0
0.001
0.002
0.003
-0.002
-0.001
0
0.001
0.002
0.003
0 200 400 600 800 1000 1200Data Point Number
-0.002
-0.001
0
0.001
0.002
0.003
L6-NE
L6-N
L6-W
S12-NE
S20HI Longitudinal Steel Strain Histories
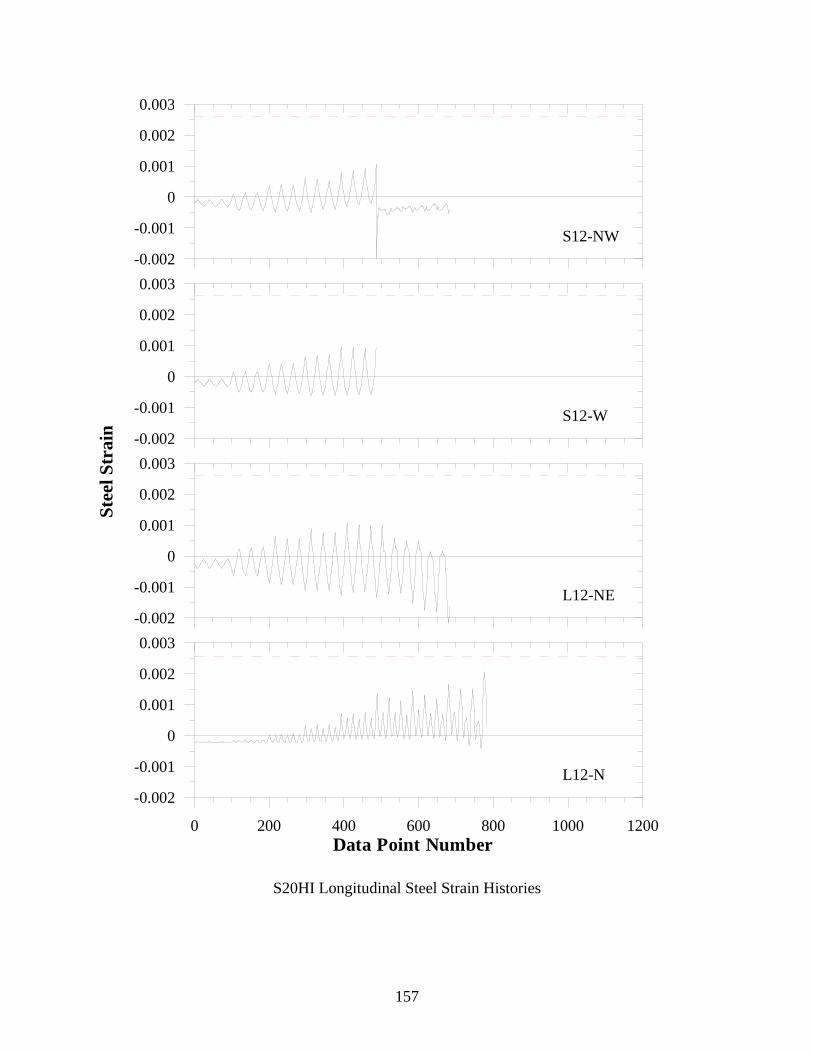
157
-0.002
-0.001
0
0.001
0.002
0.003St
eel S
trai
n -0.002
-0.001
0
0.001
0.002
0.003
-0.002
-0.001
0
0.001
0.002
0.003
0 200 400 600 800 1000 1200Data Point Number
-0.002
-0.001
0
0.001
0.002
0.003
S12-NW
S12-W
L12-N
L12-NE
S20HI Longitudinal Steel Strain Histories
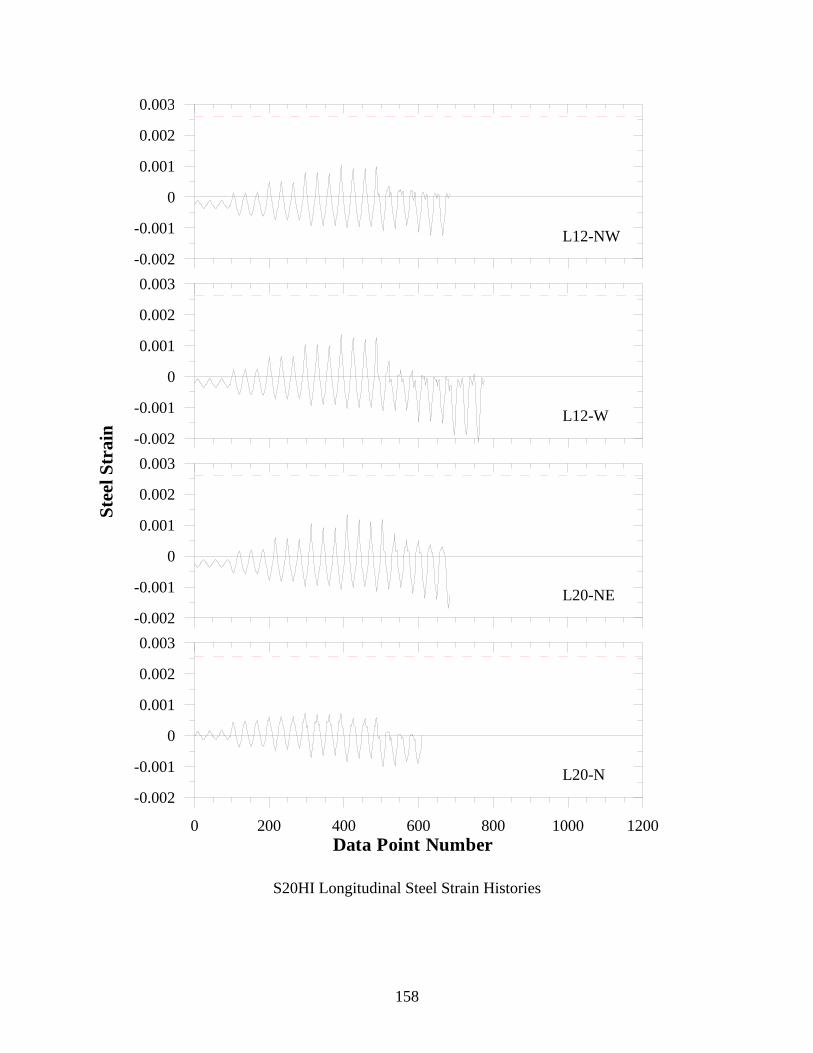
158
-0.002
-0.001
0
0.001
0.002
0.003St
eel S
trai
n -0.002
-0.001
0
0.001
0.002
0.003
-0.002
-0.001
0
0.001
0.002
0.003
0 200 400 600 800 1000 1200Data Point Number
-0.002
-0.001
0
0.001
0.002
0.003
L12-NW
L12-W
L20-N
L20-NE
S20HI Longitudinal Steel Strain Histories
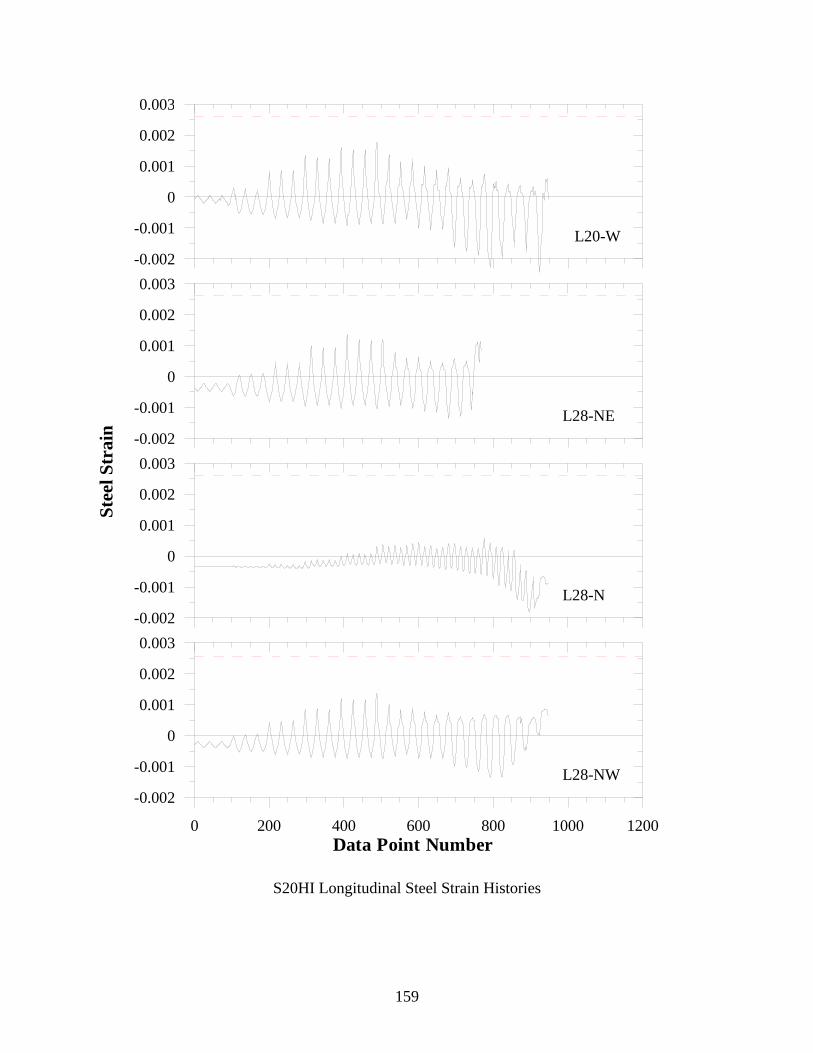
159
-0.002
-0.001
0
0.001
0.002
0.003St
eel S
trai
n -0.002
-0.001
0
0.001
0.002
0.003
-0.002
-0.001
0
0.001
0.002
0.003
0 200 400 600 800 1000 1200Data Point Number
-0.002
-0.001
0
0.001
0.002
0.003
L20-W
L28-NE
L28-N
L28-NW
S20HI Longitudinal Steel Strain Histories

160
-0.002
-0.001
0
0.001
0.002
0.003St
eel S
trai
n -0.004-0.003-0.002-0.001
00.0010.0020.003
-0.002
-0.001
0
0.001
0.002
0.003
0 200 400 600 800 1000 1200Data Point Number
-0.002
-0.001
0
0.001
0.002
0.003
L28-W
L40-NE
L40-N
L40-NW
S20HI Longitudinal Steel Strain Histories
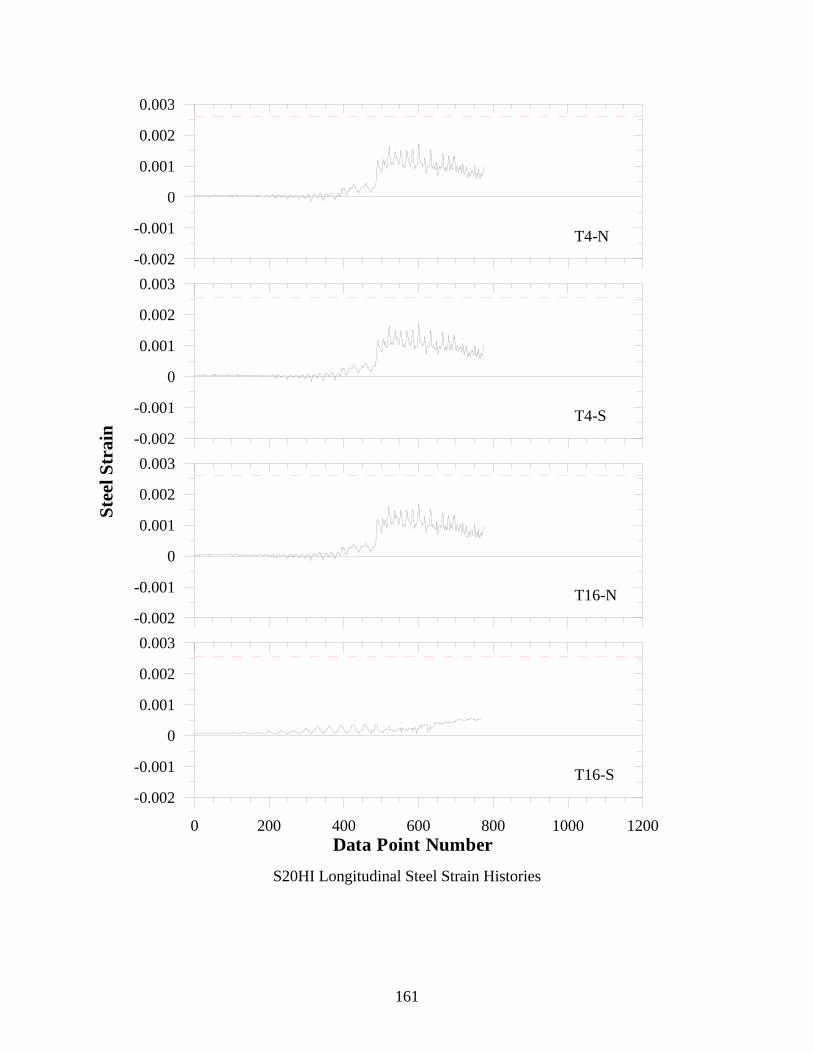
161
-0.002
-0.001
0
0.001
0.002
0.003St
eel S
trai
n -0.002
-0.001
0
0.001
0.002
0.003
-0.002
-0.001
0
0.001
0.002
0.003
0 200 400 600 800 1000 1200Data Point Number
-0.002
-0.001
0
0.001
0.002
0.003
T4-N
T4-S
T16-N
T16-S
S20HI Longitudinal Steel Strain Histories
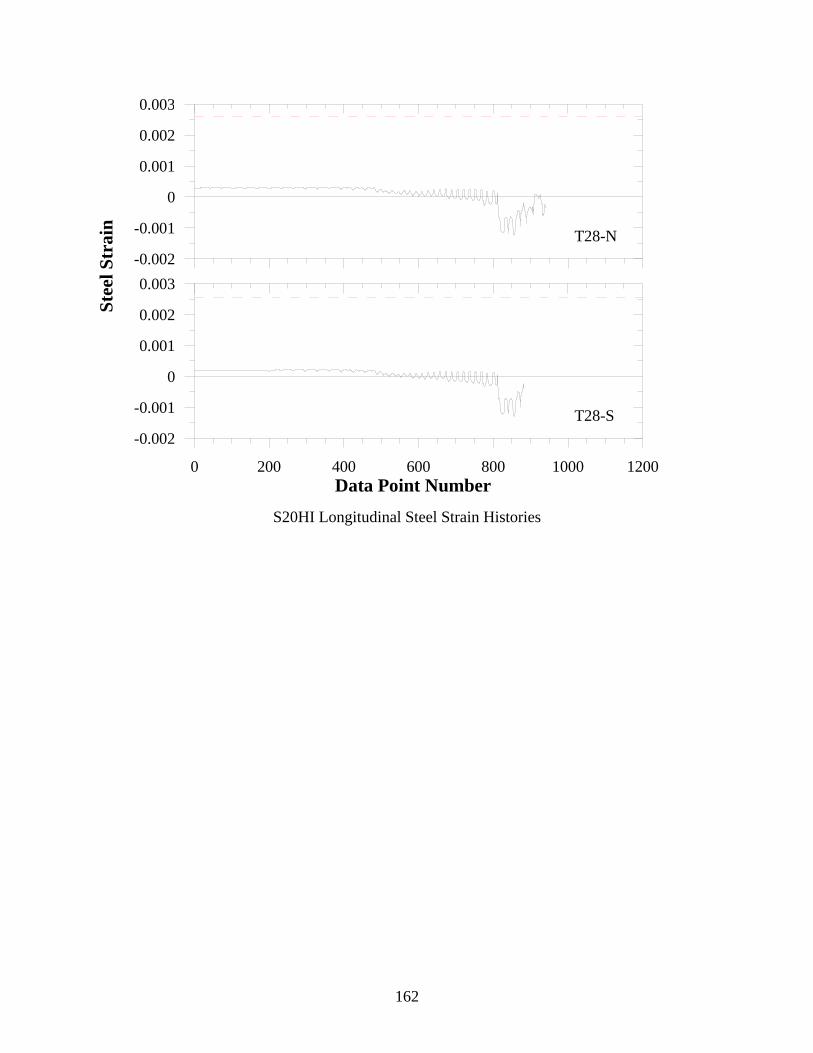
162
-0.002
-0.001
0
0.001
0.002
0.003St
eel S
trai
n
0 200 400 600 800 1000 1200Data Point Number
-0.002
-0.001
0
0.001
0.002
0.003
T28-N
T28-S
S20HI Longitudinal Steel Strain Histories
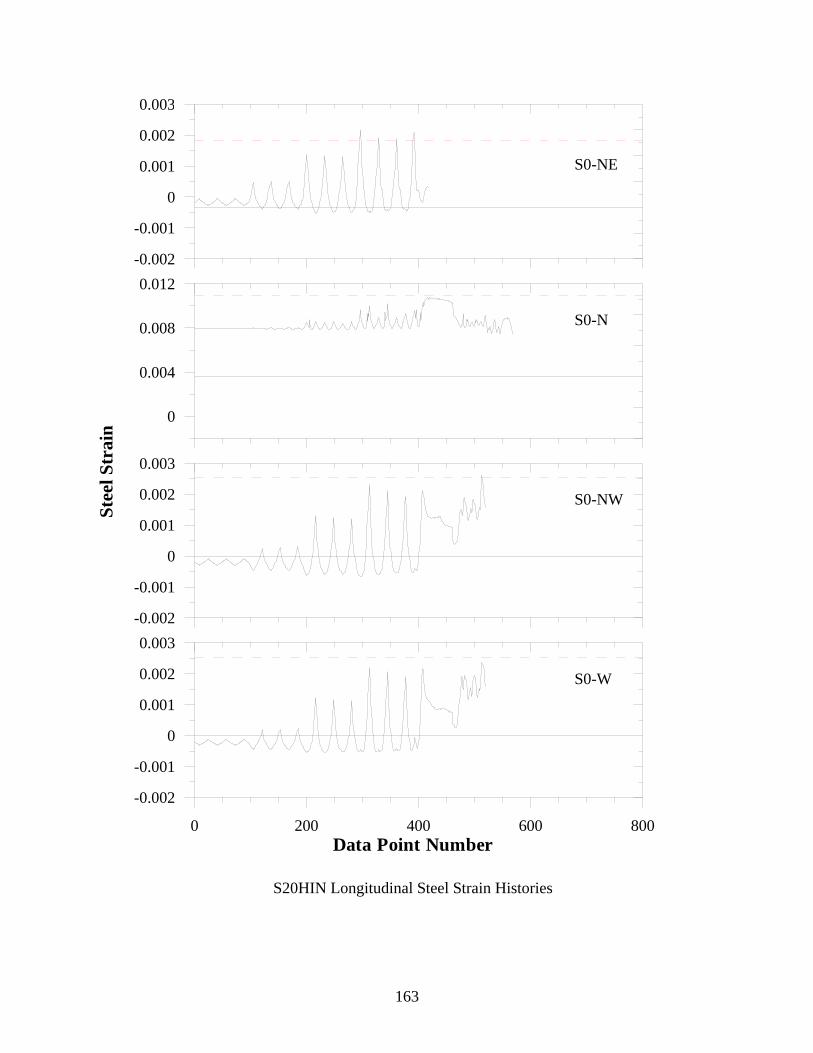
163
-0.002
-0.001
0
0.001
0.002
0.003St
eel S
trai
n
0
0.004
0.008
0.012
-0.002
-0.001
0
0.001
0.002
0.003
0 200 400 600 800Data Point Number
-0.002
-0.001
0
0.001
0.002
0.003
S0-NE
S0-NW
S0-W
S0-N
S20HIN Longitudinal Steel Strain Histories
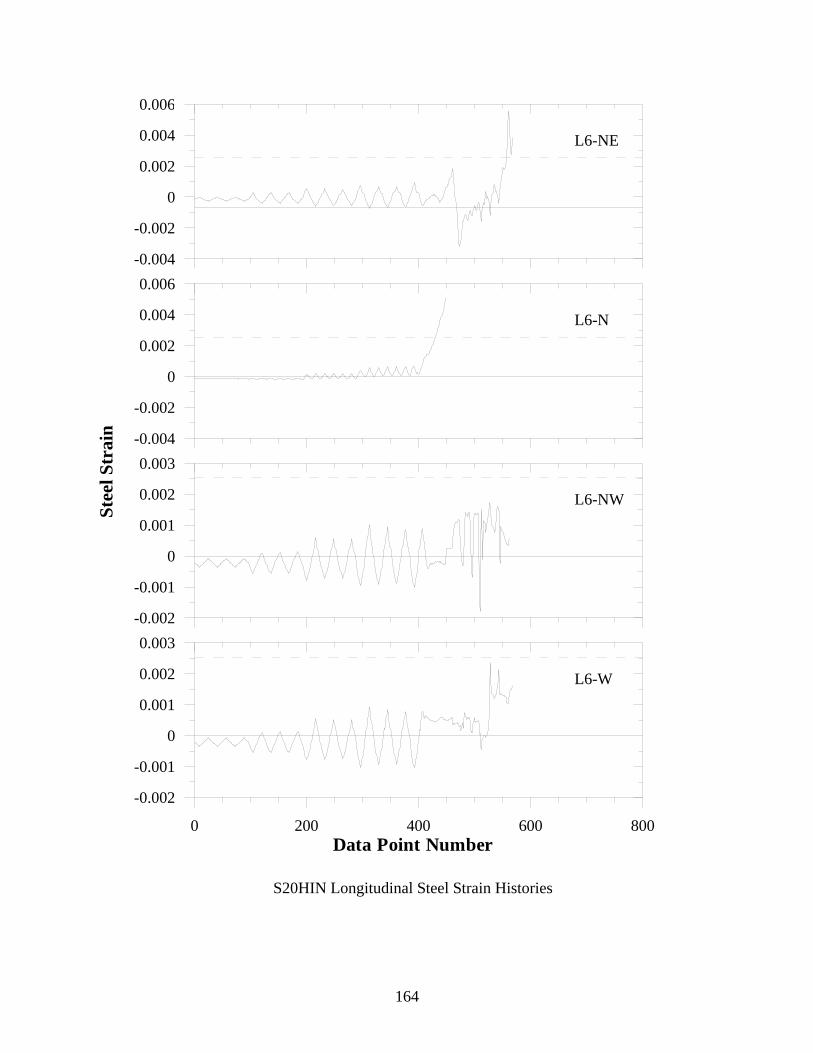
164
-0.004
-0.002
0
0.002
0.004
0.006St
eel S
trai
n -0.004
-0.002
0
0.002
0.004
0.006
-0.002
-0.001
0
0.001
0.002
0.003
0 200 400 600 800Data Point Number
-0.002
-0.001
0
0.001
0.002
0.003
L6-NE
L6-NW
L6-W
L6-N
S20HIN Longitudinal Steel Strain Histories
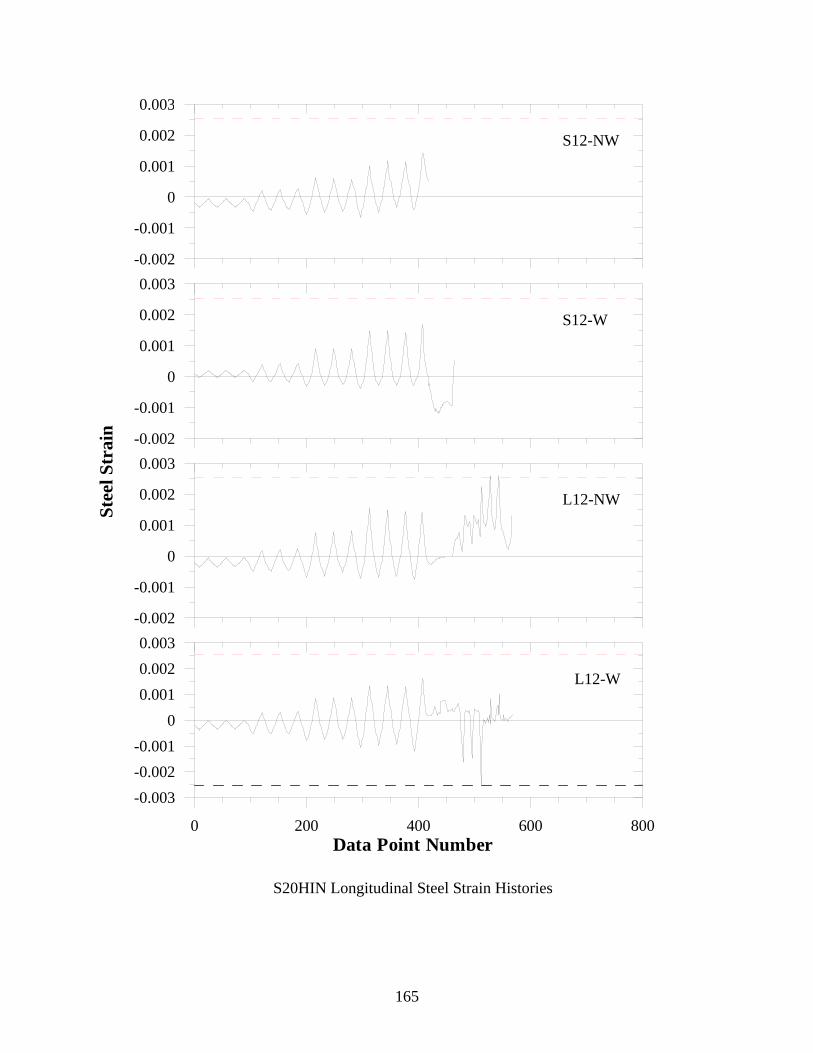
165
-0.002
-0.001
0
0.001
0.002
0.003St
eel S
trai
n -0.002
-0.001
0
0.001
0.002
0.003
-0.002
-0.001
0
0.001
0.002
0.003
0 200 400 600 800Data Point Number
-0.003-0.002-0.001
00.0010.0020.003
S12-NW
L12-NW
L12-W
S12-W
S20HIN Longitudinal Steel Strain Histories
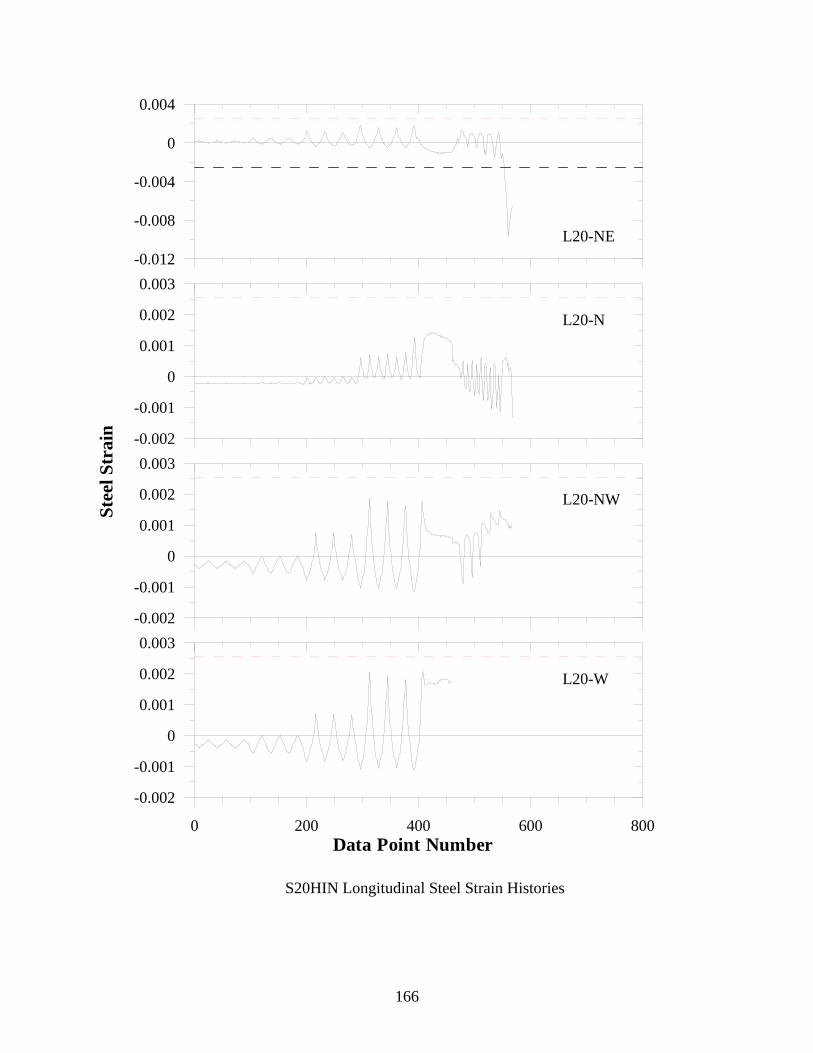
166
-0.012
-0.008
-0.004
0
0.004St
eel S
trai
n -0.002
-0.001
0
0.001
0.002
0.003
-0.002
-0.001
0
0.001
0.002
0.003
0 200 400 600 800Data Point Number
-0.002
-0.001
0
0.001
0.002
0.003
L20-NE
L20-NW
L20-W
L20-N
S20HIN Longitudinal Steel Strain Histories
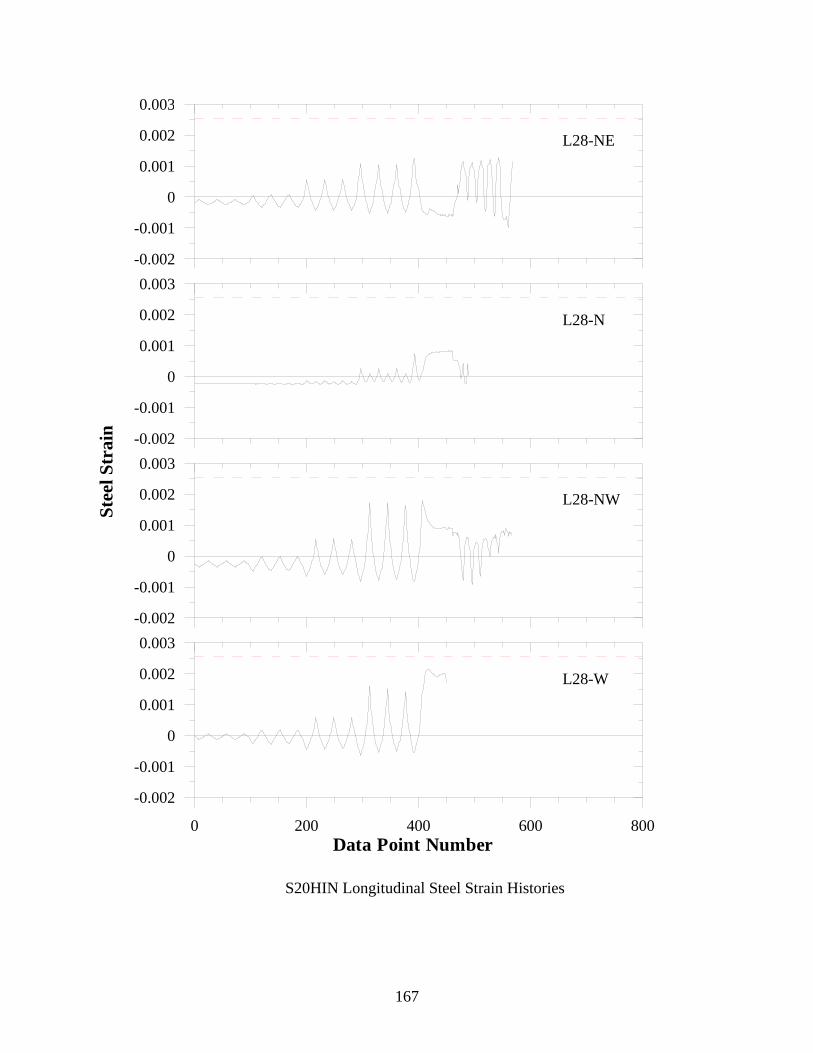
167
-0.002
-0.001
0
0.001
0.002
0.003St
eel S
trai
n -0.002
-0.001
0
0.001
0.002
0.003
-0.002
-0.001
0
0.001
0.002
0.003
0 200 400 600 800Data Point Number
-0.002
-0.001
0
0.001
0.002
0.003
L28-NE
L28-NW
L28-W
L28-N
S20HIN Longitudinal Steel Strain Histories
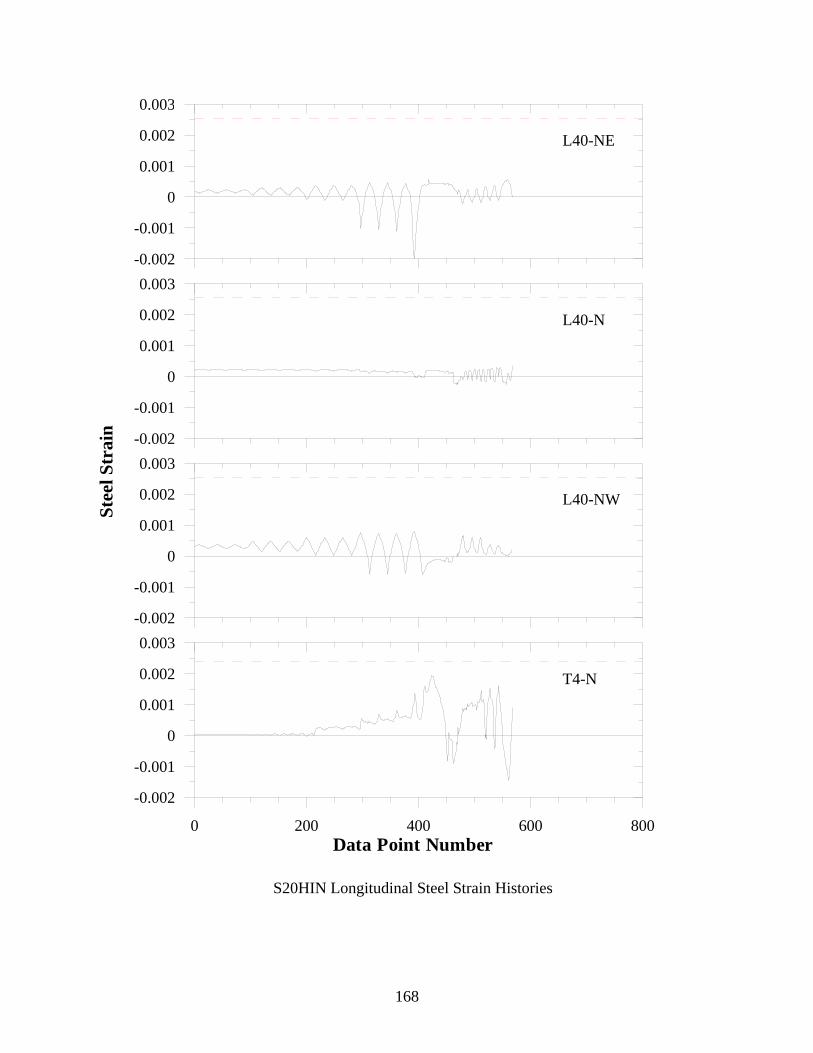
168
-0.002
-0.001
0
0.001
0.002
0.003St
eel S
trai
n -0.002
-0.001
0
0.001
0.002
0.003
-0.002
-0.001
0
0.001
0.002
0.003
0 200 400 600 800Data Point Number
-0.002
-0.001
0
0.001
0.002
0.003
L40-NE
L40-NW
T4-N
L40-N
S20HIN Longitudinal Steel Strain Histories
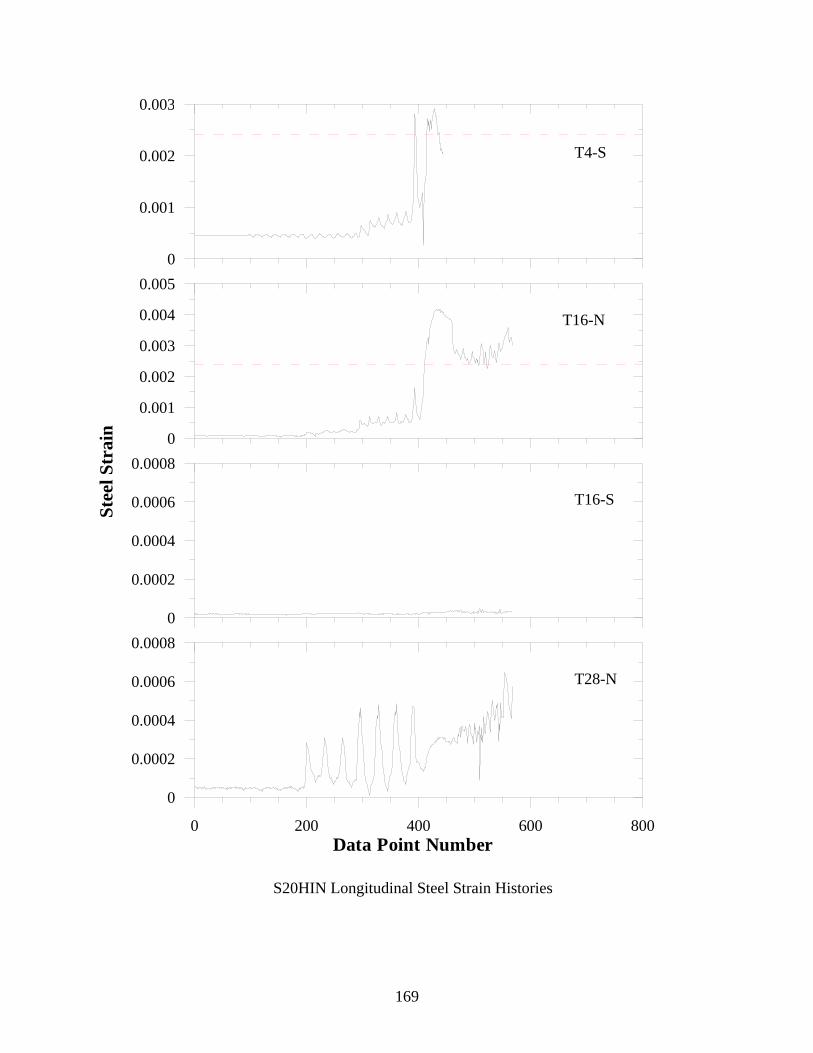
169
0
0.001
0.002
0.003St
eel S
trai
n 0
0.001
0.002
0.003
0.004
0.005
0
0.0002
0.0004
0.0006
0.0008
0 200 400 600 800Data Point Number
0
0.0002
0.0004
0.0006
0.0008
T4-S
T16-S
T28-N
T16-N
S20HIN Longitudinal Steel Strain Histories
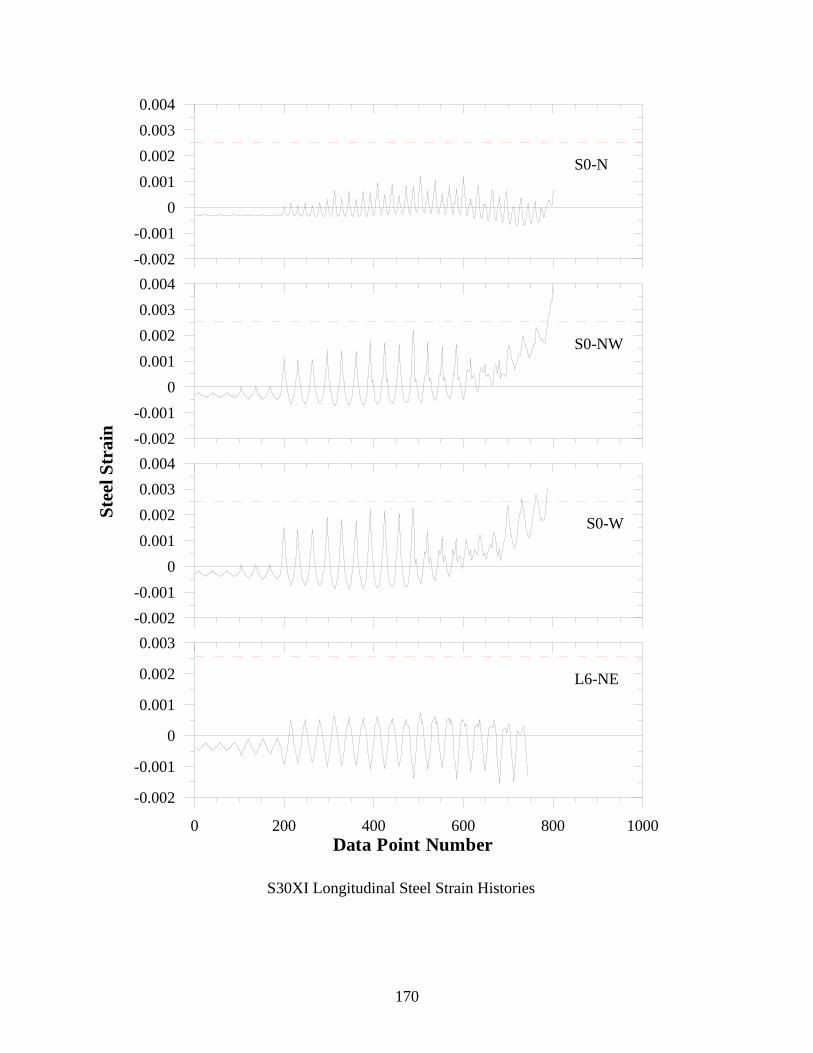
170
-0.002-0.001
00.0010.0020.0030.004
Stee
l Str
ain -0.002
-0.0010
0.0010.0020.0030.004
-0.002-0.001
00.0010.0020.0030.004
0 200 400 600 800 1000Data Point Number
-0.002
-0.001
0
0.001
0.002
0.003
S0-N
S0-W
L6-NE
S0-NW
S30XI Longitudinal Steel Strain Histories
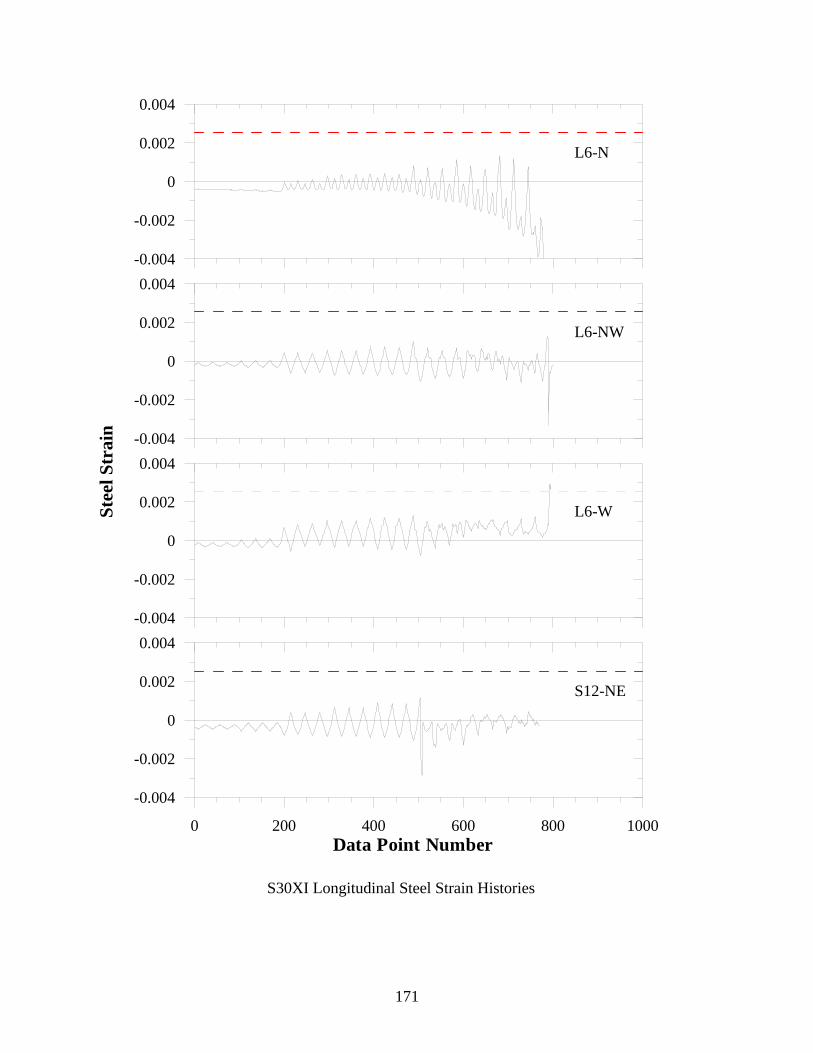
171
-0.004
-0.002
0
0.002
0.004St
eel S
trai
n -0.004
-0.002
0
0.002
0.004
-0.004
-0.002
0
0.002
0.004
0 200 400 600 800 1000Data Point Number
-0.004
-0.002
0
0.002
0.004
L6-N
L6-W
S12-NE
L6-NW
S30XI Longitudinal Steel Strain Histories
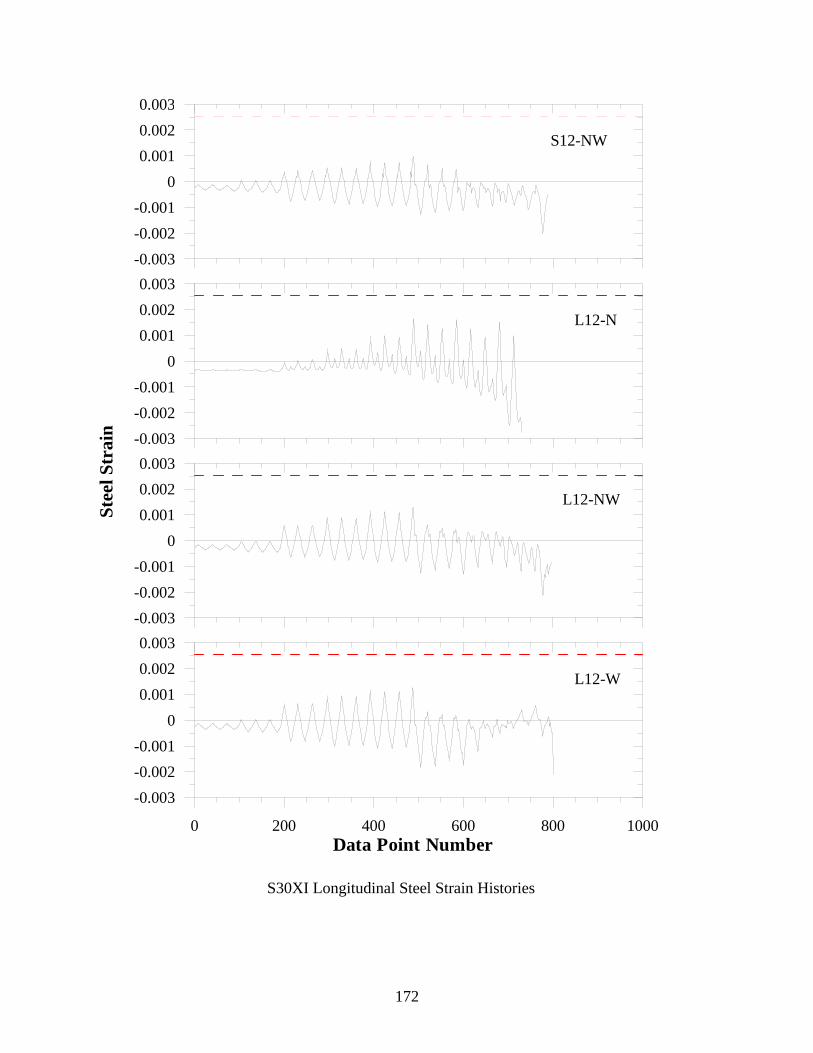
172
-0.003-0.002-0.001
00.0010.0020.003
Stee
l Str
ain -0.003
-0.002-0.001
00.0010.0020.003
-0.003-0.002-0.001
00.0010.0020.003
0 200 400 600 800 1000Data Point Number
-0.003-0.002-0.001
00.0010.0020.003
S12-NW
L12-NW
L12-W
L12-N
S30XI Longitudinal Steel Strain Histories
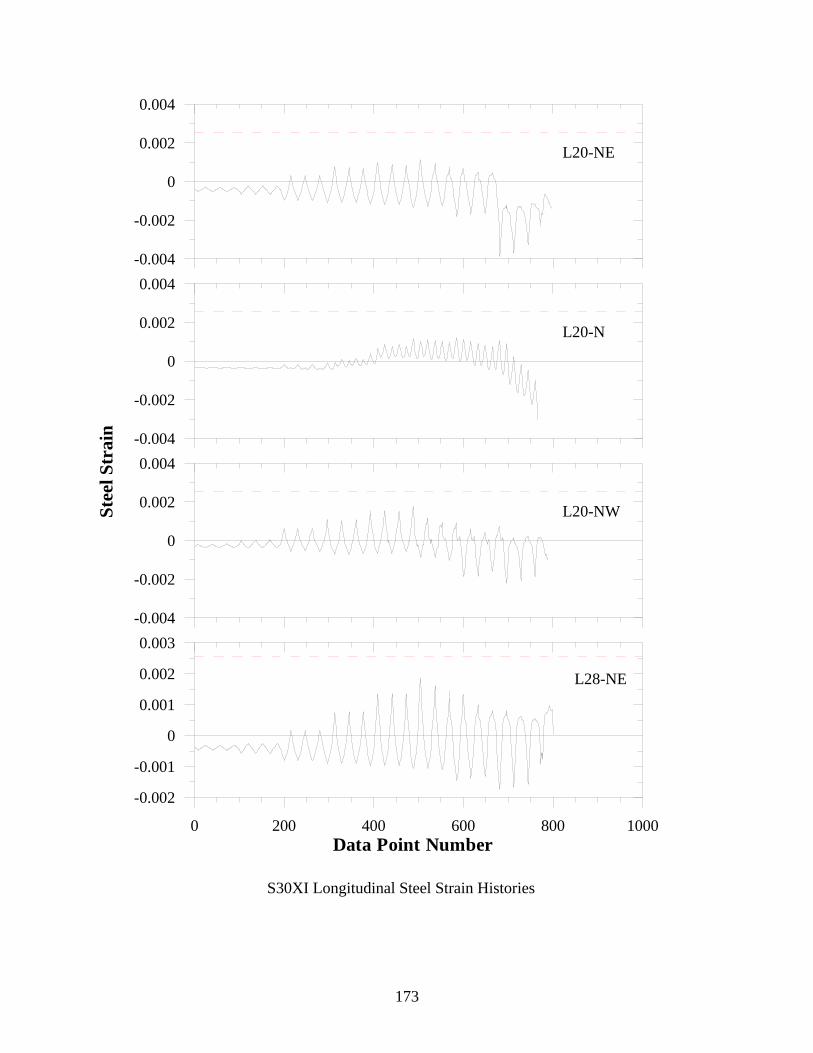
173
-0.004
-0.002
0
0.002
0.004St
eel S
trai
n -0.004
-0.002
0
0.002
0.004
-0.004
-0.002
0
0.002
0.004
0 200 400 600 800 1000Data Point Number
-0.002
-0.001
0
0.001
0.002
0.003
L20-NE
L20-NW
L28-NE
L20-N
S30XI Longitudinal Steel Strain Histories
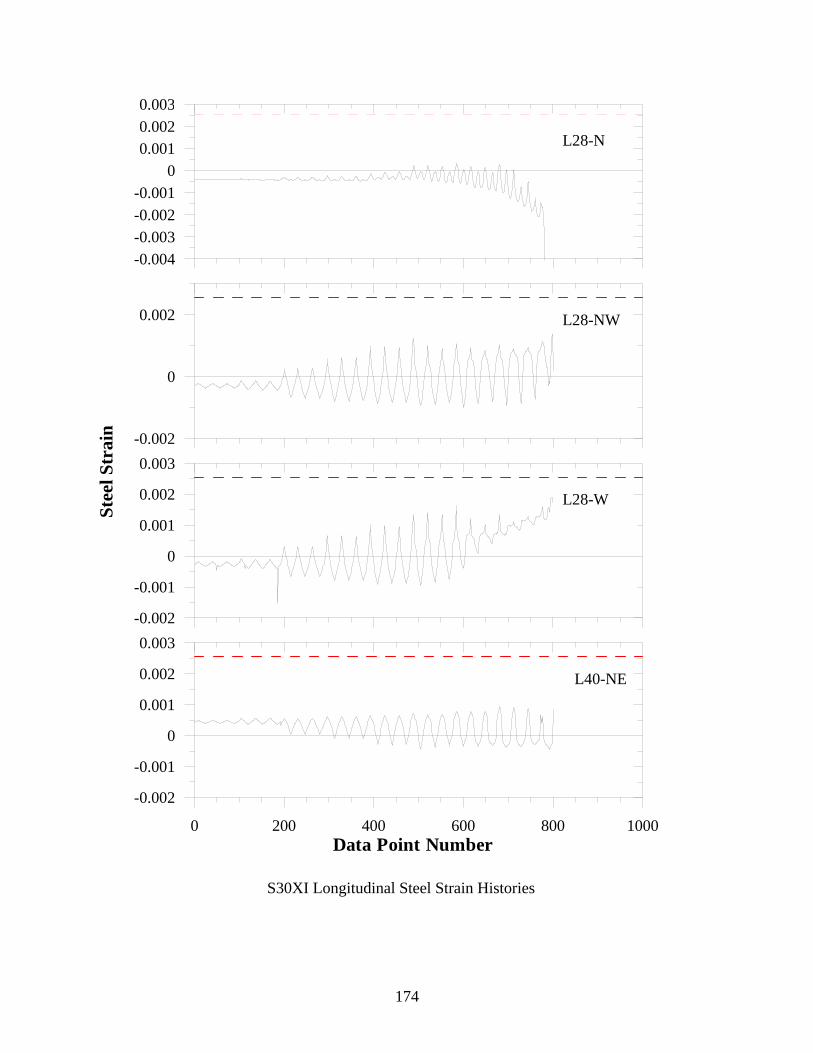
174
-0.004-0.003-0.002-0.001
00.0010.0020.003
Stee
l Str
ain -0.002
0
0.002
-0.002
-0.001
0
0.001
0.002
0.003
0 200 400 600 800 1000Data Point Number
-0.002
-0.001
0
0.001
0.002
0.003
L28-N
L28-W
L40-NE
L28-NW
S30XI Longitudinal Steel Strain Histories
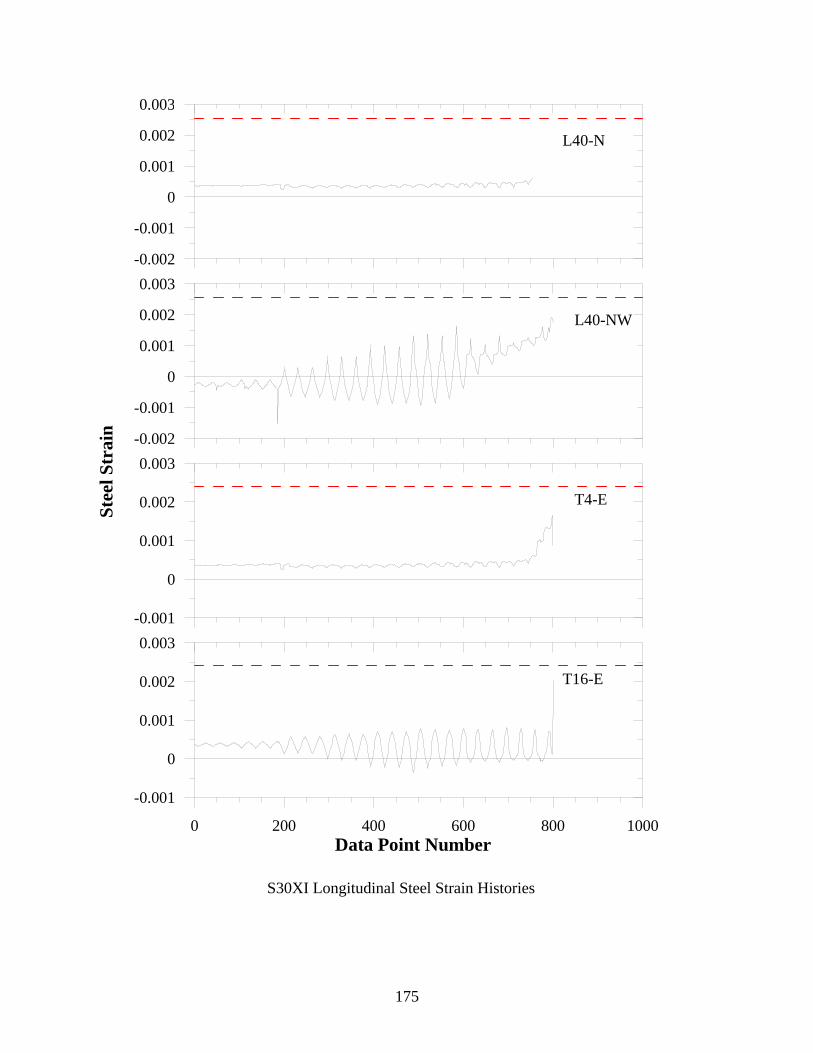
175
-0.002
-0.001
0
0.001
0.002
0.003St
eel S
trai
n -0.002
-0.001
0
0.001
0.002
0.003
-0.001
0
0.001
0.002
0.003
0 200 400 600 800 1000Data Point Number
-0.001
0
0.001
0.002
0.003
L40-N
T4-E
T16-E
L40-NW
S30XI Longitudinal Steel Strain Histories
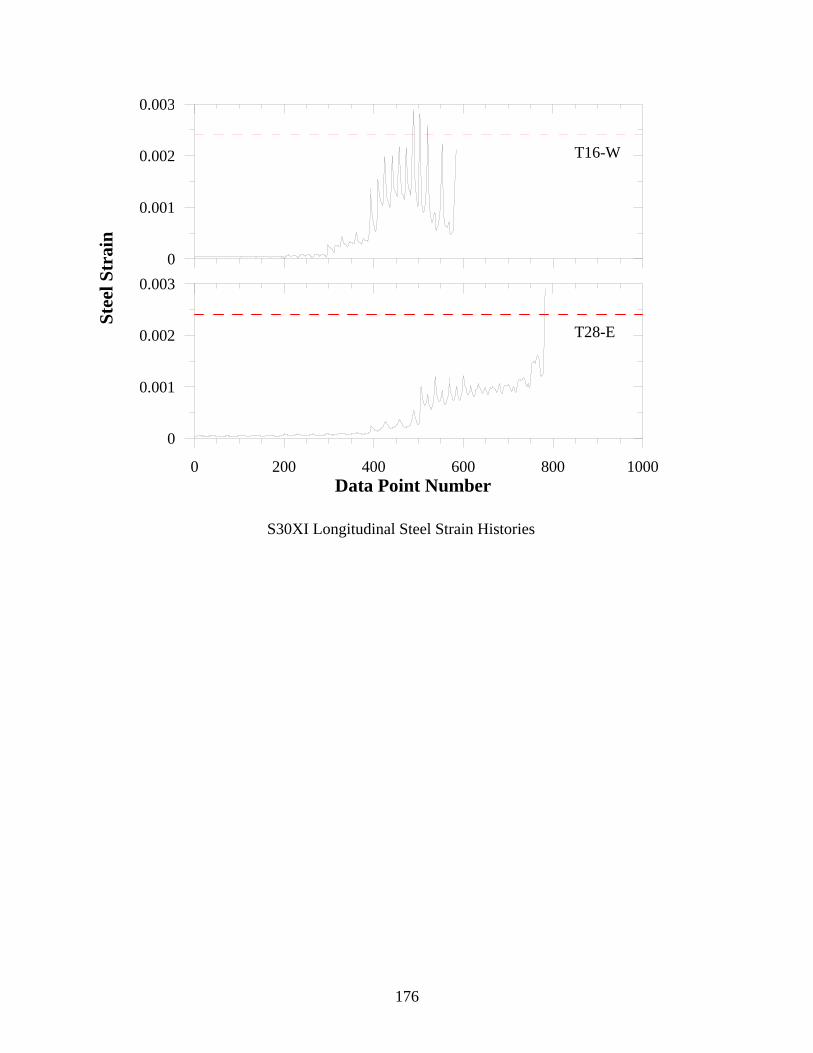
176
0
0.001
0.002
0.003St
eel S
trai
n
0 200 400 600 800 1000Data Point Number
0
0.001
0.002
0.003
T16-W
T28-E
S30XI Longitudinal Steel Strain Histories
PEER REPORTS
PEER reports are available from the National Information Service for Earthquake Engineering (NISEE). To order PEER reports, please contact the Pacific Earthquake Engineering Research Center, 1301 South 46th Street, Richmond, California 94804-4698. Tel.: (510) 231-9468; Fax: (510) 231-9461. PEER 2003/06 Performance of Circular Reinforced Concrete Bridge Columns under Bidirectional
Earthquake Loading. Mahmoud M. Hachem, Stephen A. Mahin, and Jack P. Moehle. February 2003
. PEER 2003/05 Response Assessment of Nonstructural Building Elements. Shahram Taghavi and
Eduardo Miranda. September 2003. PEER 2003/04 Experimental Assessment of Columns with Short Lap Splices Subjected to Cyclic
Loads. Murat Melek, John W. Wallace, and Joel Conte. April 2003. PEER 2003/03 Probabilistic Response Assessment for Building-Specific Loss Estimation. Eduardo
Miranda and Hesameddin Aslani. September 2003. PEER 2003/02 Software Framework for Collaborative Development of Nonlinear Dynamic Analysis
Program. Jun Peng and Kincho H. Law. September 2003. PEER 2002/24 Performance of Beam to Column Bridge Joints Subjected to a Large Velocity Pulse.
Natalie Gibson, André Filiatrault, and Scott A. Ashford. April 2002. PEER 2002/23 Effects of Large Velocity Pulses on Reinforced Concrete Bridge Columns. Greg L.
Orozco and Scott A. Ashford. April 2002. PEER 2002/22 Characterization of Large Velocity Pulses for Laboratory Testing. Kenneth E. Cox
and Scott A. Ashford. April 2002. PEER 2002/21 Fourth U.S.-Japan Workshop on Performance-Based Earthquake Engineering
Methodology for Reinforced Concrete Building Structures. December 2002. PEER 2002/20 Barriers to Adoption and Implementation of PBEE Innovations. Peter J. May. August
2002. PEER 2002/19 Economic-Engineered Integrated Models for Earthquakes: Socioeconomic Impacts.
Peter Gordon, James E. Moore II, and Harry W. Richardson. July 2002. PEER 2002/18 Assessment of Reinforced Concrete Building Exterior Joints with Substandard
Details. Chris P. Pantelides, Jon Hansen, Justin Nadauld, and Lawrence D. Reaveley. May 2002.
PEER 2002/17 Structural Characterization and Seismic Response Analysis of a Highway
Overcrossing Equipped with Elastomeric Bearings and Fluid Dampers: A Case Study. Nicos Makris and Jian Zhang. November 2002.
PEER 2002/16 Estimation of Uncertainty in Geotechnical Properties for Performance-Based
Earthquake Engineering. Allen L. Jones, Steven L. Kramer, and Pedro Arduino. December 2002.

PEER 2002/15 Seismic Behavior of Bridge Columns Subjected to Various Loading Patterns. Asadollah Esmaeily-Gh. and Yan Xiao. December 2002.
PEER 2002/14 Inelastic Seismic Response of Extended Pile Shaft Supported Bridge Structures. T.C.
Hutchinson, R.W. Boulanger, Y.H. Chai, and I.M. Idriss. December 2002. PEER 2002/13 Probabilistic Models and Fragility Estimates for Bridge Components and Systems.
Paolo Gardoni, Armen Der Kiureghian, and Khalid M. Mosalam. June 2002. PEER 2002/12 Effects of Fault Dip and Slip Rake on Near-Source Ground Motions: Why Chi-Chi
Was a Relatively Mild M7.6 Earthquake. Brad T. Aagaard, John F. Hall, and Thomas H. Heaton. December 2002.
PEER 2002/11 Analytical and Experimental Study of Fiber-Reinforced Strip Isolators. James M. Kelly
and Shakhzod M. Takhirov. September 2002. PEER 2002/10 Centrifuge Modeling of Settlement and Lateral Spreading with Comparisons to
Numerical Analyses. Sivapalan Gajan and Bruce L. Kutter. January 2003. PEER 2002/09 Documentation and Analysis of Field Case Histories of Seismic Compression during
the 1994 Northridge, California, Earthquake. Jonathan P. Stewart, Patrick M. Smith, Daniel H. Whang, and Jonathan D. Bray. October 2002.
PEER 2002/08 Component Testing, Stability Analysis and Characterization of Buckling-Restrained
Unbonded BracesTM. Cameron Black, Nicos Makris, and Ian Aiken. September 2002. PEER 2002/07 Seismic Performance of Pile-Wharf Connections. Charles W. Roeder, Robert Graff,
Jennifer Soderstrom, and Jun Han Yoo. December 2001. PEER 2002/06 The Use of Benefit-Cost Analysis for Evaluation of Performance-Based Earthquake
Engineering Decisions. Richard O. Zerbe and Anthony Falit-Baiamonte. September 2001.
PEER 2002/05 Guidelines, Specifications, and Seismic Performance Characterization of
Nonstructural Building Components and Equipment. André Filiatrault, Constantin Christopoulos, and Christopher Stearns. September 2001.
PEER 2002/04 Consortium of Organizations for Strong-Motion Observation Systems and the Pacific
Earthquake Engineering Research Center Lifelines Program: Invited Workshop on Archiving and Web Dissemination of Geotechnical Data, 4–5 October 2001. September 2002.
PEER 2002/03 Investigation of Sensitivity of Building Loss Estimates to Major Uncertain Variables
for the Van Nuys Testbed. Keith A. Porter, James L. Beck, and Rustem V. Shaikhutdinov. August 2002.
PEER 2002/02 The Third U.S.-Japan Workshop on Performance-Based Earthquake Engineering
Methodology for Reinforced Concrete Building Structures. July 2002. PEER 2002/01 Nonstructural Loss Estimation: The UC Berkeley Case Study. Mary C. Comerio and
John C. Stallmeyer. December 2001. PEER 2001/16 Statistics of SDF-System Estimate of Roof Displacement for Pushover Analysis of
Buildings. Anil K. Chopra, Rakesh K. Goel, and Chatpan Chintanapakdee. December 2001.

PEER 2001/15 Damage to Bridges during the 2001 Nisqually Earthquake. R. Tyler Ranf, Marc O.
Eberhard, and Michael P. Berry. November 2001. PEER 2001/14 Rocking Response of Equipment Anchored to a Base Foundation. Nicos Makris and
Cameron J. Black. September 2001. PEER 2001/13 Modeling Soil Liquefaction Hazards for Performance-Based Earthquake Engineering.
Steven L. Kramer and Ahmed-W. Elgamal. February 2001. PEER 2001/12 Development of Geotechnical Capabilities in OpenSees. Boris Jeremic. September
2001. PEER 2001/11 Analytical and Experimental Study of Fiber-Reinforced Elastomeric Isolators. James
M. Kelly and Shakhzod M. Takhirov. September 2001. PEER 2001/10 Amplification Factors for Spectral Acceleration in Active Regions. Jonathan P.
Stewart, Andrew H. Liu, Yoojoong Choi, and Mehmet B. Baturay. December 2001. PEER 2001/09 Ground Motion Evaluation Procedures for Performance-Based Design. Jonathan P.
Stewart, Shyh-Jeng Chiou, Jonathan D. Bray, Robert W. Graves, Paul G. Somerville, and Norman A. Abrahamson. September 2001.
PEER 2001/08 Experimental and Computational Evaluation of Reinforced Concrete Bridge Beam-
Column Connections for Seismic Performance. Clay J. Naito, Jack P. Moehle, and Khalid M. Mosalam. November 2001.
PEER 2001/07 The Rocking Spectrum and the Shortcomings of Design Guidelines. Nicos Makris
and Dimitrios Konstantinidis. August 2001. PEER 2001/06 Development of an Electrical Substation Equipment Performance Database for
Evaluation of Equipment Fragilities. Thalia Agnanos. April 1999. PEER 2001/05 Stiffness Analysis of Fiber-Reinforced Elastomeric Isolators. Hsiang-Chuan Tsai and
James M. Kelly. May 2001. PEER 2001/04 Organizational and Societal Considerations for Performance-Based Earthquake
Engineering. Peter J. May. April 2001. PEER 2001/03 A Modal Pushover Analysis Procedure to Estimate Seismic Demands for Buildings:
Theory and Preliminary Evaluation. Anil K. Chopra and Rakesh K. Goel. January 2001.
PEER 2001/02 Seismic Response Analysis of Highway Overcrossings Including Soil-Structure
Interaction. Jian Zhang and Nicos Makris. March 2001. PEER 2001/01 Experimental Study of Large Seismic Steel Beam-to-Column Connections. Egor P.
Popov and Shakhzod M. Takhirov. November 2000. PEER 2000/10 The Second U.S.-Japan Workshop on Performance-Based Earthquake Engineering
Methodology for Reinforced Concrete Building Structures. March 2000. PEER 2000/09 Structural Engineering Reconnaissance of the August 17, 1999 Earthquake: Kocaeli
(Izmit), Turkey. Halil Sezen, Kenneth J. Elwood, Andrew S. Whittaker, Khalid Mosalam, John J. Wallace, and John F. Stanton. December 2000.
PEER 2000/08 Behavior of Reinforced Concrete Bridge Columns Having Varying Aspect Ratios and Varying Lengths of Confinement. Anthony J. Calderone, Dawn E. Lehman, and Jack P. Moehle. January 2001.
PEER 2000/07 Cover-Plate and Flange-Plate Reinforced Steel Moment-Resisting Connections.
Taejin Kim, Andrew S. Whittaker, Amir S. Gilani, Vitelmo V. Bertero, and Shakhzod M. Takhirov. September 2000.
PEER 2000/06 Seismic Evaluation and Analysis of 230-kV Disconnect Switches. Amir S. J. Gilani,
Andrew S. Whittaker, Gregory L. Fenves, Chun-Hao Chen, Henry Ho, and Eric Fujisaki. July 2000.
PEER 2000/05 Performance-Based Evaluation of Exterior Reinforced Concrete Building Joints for
Seismic Excitation. Chandra Clyde, Chris P. Pantelides, and Lawrence D. Reaveley. July 2000.
PEER 2000/04 An Evaluation of Seismic Energy Demand: An Attenuation Approach. Chung-Che
Chou and Chia-Ming Uang. July 1999. PEER 2000/03 Framing Earthquake Retrofitting Decisions: The Case of Hillside Homes in Los
Angeles. Detlof von Winterfeldt, Nels Roselund, and Alicia Kitsuse. March 2000. PEER 2000/02 U.S.-Japan Workshop on the Effects of Near-Field Earthquake Shaking. Andrew
Whittaker, ed. July 2000. PEER 2000/01 Further Studies on Seismic Interaction in Interconnected Electrical Substation
Equipment. Armen Der Kiureghian, Kee-Jeung Hong, and Jerome L. Sackman. November 1999.
PEER 1999/14 Seismic Evaluation and Retrofit of 230-kV Porcelain Transformer Bushings. Amir S.
Gilani, Andrew S. Whittaker, Gregory L. Fenves, and Eric Fujisaki. December 1999. PEER 1999/13 Building Vulnerability Studies: Modeling and Evaluation of Tilt-up and Steel
Reinforced Concrete Buildings. John W. Wallace, Jonathan P. Stewart, and Andrew S. Whittaker, editors. December 1999.
PEER 1999/12 Rehabilitation of Nonductile RC Frame Building Using Encasement Plates and
Energy-Dissipating Devices. Mehrdad Sasani, Vitelmo V. Bertero, James C. Anderson. December 1999.
PEER 1999/11 Performance Evaluation Database for Concrete Bridge Components and Systems
under Simulated Seismic Loads. Yael D. Hose and Frieder Seible. November 1999. PEER 1999/10 U.S.-Japan Workshop on Performance-Based Earthquake Engineering Methodology
for Reinforced Concrete Building Structures. December 1999. PEER 1999/09 Performance Improvement of Long Period Building Structures Subjected to Severe
Pulse-Type Ground Motions. James C. Anderson, Vitelmo V. Bertero, and Raul Bertero. October 1999.
PEER 1999/08 Envelopes for Seismic Response Vectors. Charles Menun and Armen Der
Kiureghian. July 1999.
PEER 1999/07 Documentation of Strengths and Weaknesses of Current Computer Analysis Methods for Seismic Performance of Reinforced Concrete Members. William F. Cofer. November 1999.
PEER 1999/06 Rocking Response and Overturning of Anchored Equipment under Seismic
Excitations. Nicos Makris and Jian Zhang. November 1999. PEER 1999/05 Seismic Evaluation of 550 kV Porcelain Transformer Bushings. Amir S. Gilani,
Andrew S. Whittaker, Gregory L. Fenves, and Eric Fujisaki. October 1999. PEER 1999/04 Adoption and Enforcement of Earthquake Risk-Reduction Measures. Peter J. May,
Raymond J. Burby, T. Jens Feeley, and Robert Wood. PEER 1999/03 Task 3 Characterization of Site Response General Site Categories. Adrian
Rodriguez-Marek, Jonathan D. Bray, and Norman Abrahamson. February 1999. PEER 1999/02 Capacity-Demand-Diagram Methods for Estimating Seismic Deformation of Inelastic
Structures: SDF Systems. Anil K. Chopra and Rakesh Goel. April 1999. PEER 1999/01 Interaction in Interconnected Electrical Substation Equipment Subjected to
Earthquake Ground Motions. Armen Der Kiureghian, Jerome L. Sackman, and Kee-Jeung Hong. February 1999.
PEER 1998/08 Behavior and Failure Analysis of a Multiple-Frame Highway Bridge in the 1994
Northridge Earthquake. Gregory L. Fenves and Michael Ellery. December 1998. PEER 1998/07 Empirical Evaluation of Inertial Soil-Structure Interaction Effects. Jonathan P.
Stewart, Raymond B. Seed, and Gregory L. Fenves. November 1998. PEER 1998/06 Effect of Damping Mechanisms on the Response of Seismic Isolated Structures.
Nicos Makris and Shih-Po Chang. November 1998. PEER 1998/05 Rocking Response and Overturning of Equipment under Horizontal Pulse-Type
Motions. Nicos Makris and Yiannis Roussos. October 1998. PEER 1998/04 Pacific Earthquake Engineering Research Invitational Workshop Proceedings, May
14–15, 1998: Defining the Links between Planning, Policy Analysis, Economics and Earthquake Engineering. Mary Comerio and Peter Gordon. September 1998.
PEER 1998/03 Repair/Upgrade Procedures for Welded Beam to Column Connections. James C.
Anderson and Xiaojing Duan. May 1998. PEER 1998/02 Seismic Evaluation of 196 kV Porcelain Transformer Bushings. Amir S. Gilani, Juan
W. Chavez, Gregory L. Fenves, and Andrew S. Whittaker. May 1998. PEER 1998/01 Seismic Performance of Well-Confined Concrete Bridge Columns. Dawn E. Lehman
and Jack P. Moehle. December 2000.