pacific northwest regional air quality modeling and...
TRANSCRIPT
Regional Modeling of Nitrogen, Sulfur, and Mercury Atmospheric
Deposition in the Pacific Northwest
Matt Porter, Brian Lamb,Joe Vaughan, Jeremy Avise, and
Jack ChenWashington State UniversityLaboratory for Atmospheric
Research

Regional Interests and Motivation • Regional Deposition Issues
Low pH, elevated N deposition measured in the Columbia River Gorge National Scenic AreaConcern for N, S critical loads in high alpine lakes in the Cascade Mountains (e.g., 1.5 kg-N/ha/yr, 20 kg-S/ha/yr)Elevated Hg levels in southern Idaho reservoirs possibly related to high Hg emissions from Nevada gold mines
• Regional Modeling Approaches
CMAQ Climate Change Modeling Runs (N and S)CMAQ Daily Forecast Runs (HG)
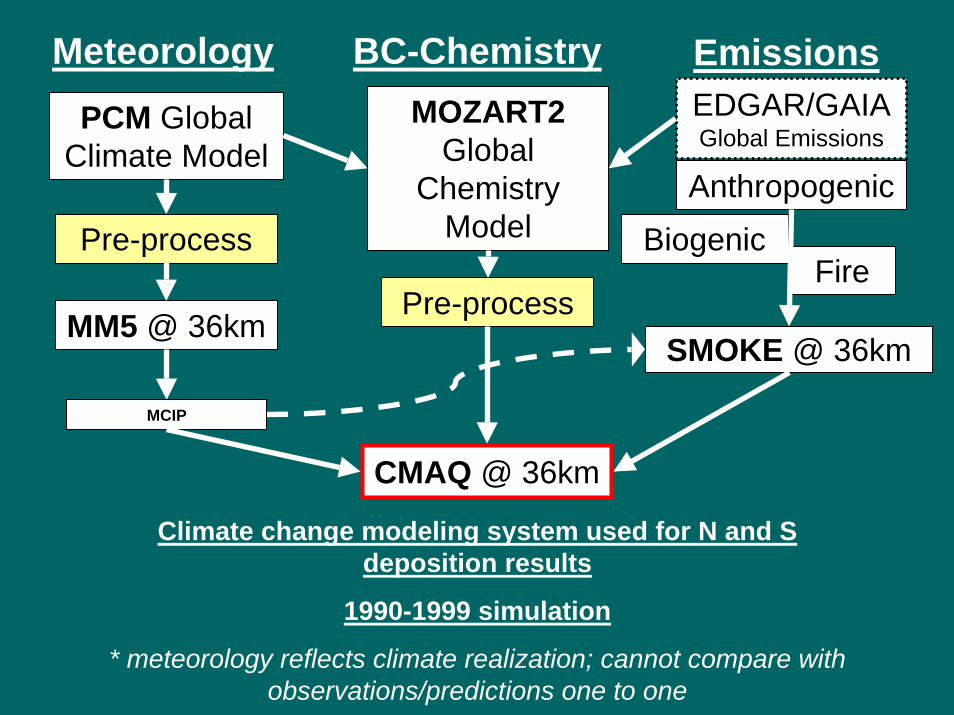
PCM Global Climate Model
Pre-process
MM5 @ 36km
MOZART2 Global
Chemistry Model
Pre-processSMOKE @ 36km
CMAQ @ 36km
Meteorology BC-Chemistry Emissions
Biogenic
Anthropogenic
Fire
MCIP
Climate change modeling system used for N and S deposition results
1990-1999 simulation
* meteorology reflects climate realization; cannot compare with observations/predictions one to one
EDGAR/GAIA Global Emissions

0
0.05
0.1
0.15
0.2
0.25
0.3
0.35
JAN FEB MAR APR MAY JUN JUL AUG SEP OCT NOV DEC
Months of Dry (tan) and Wet (blue) Deposition
Dep
ositi
on (k
g/ha
per
mon
th)
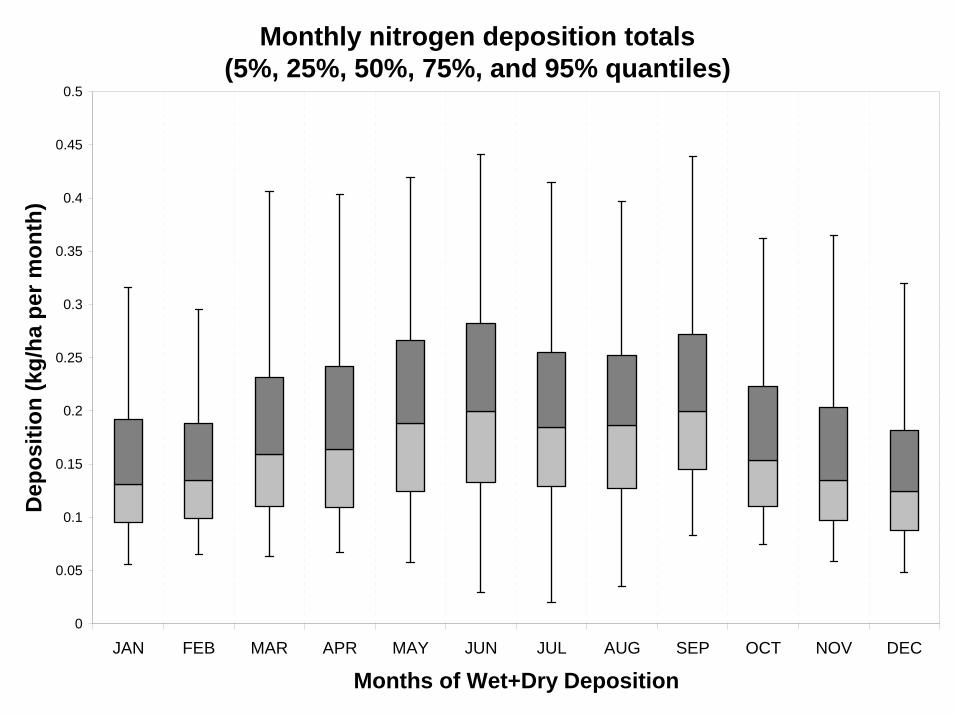
Monthly nitrogen deposition totals(5%, 25%, 50%, 75%, and 95% quantiles)
0
0.05
0.1
0.15
0.2
0.25
0.3
0.35
0.4
0.45
0.5
JAN FEB MAR APR MAY JUN JUL AUG SEP OCT NOV DEC
Months of Wet+Dry Deposition
Dep
ositi
on (k
g/ha
per
mon
th)
Monthly nitrogen deposition totals(5%, 25%, 50%, 75%, and 95% quantiles)
0
0.5
1
1.5
2
2.5
3
3.5
4
4.5
DRY WET WET+DRY
Nitrogen Deposition Pathway
Dep
ositi
on (k
g/ha
per
yea
r)
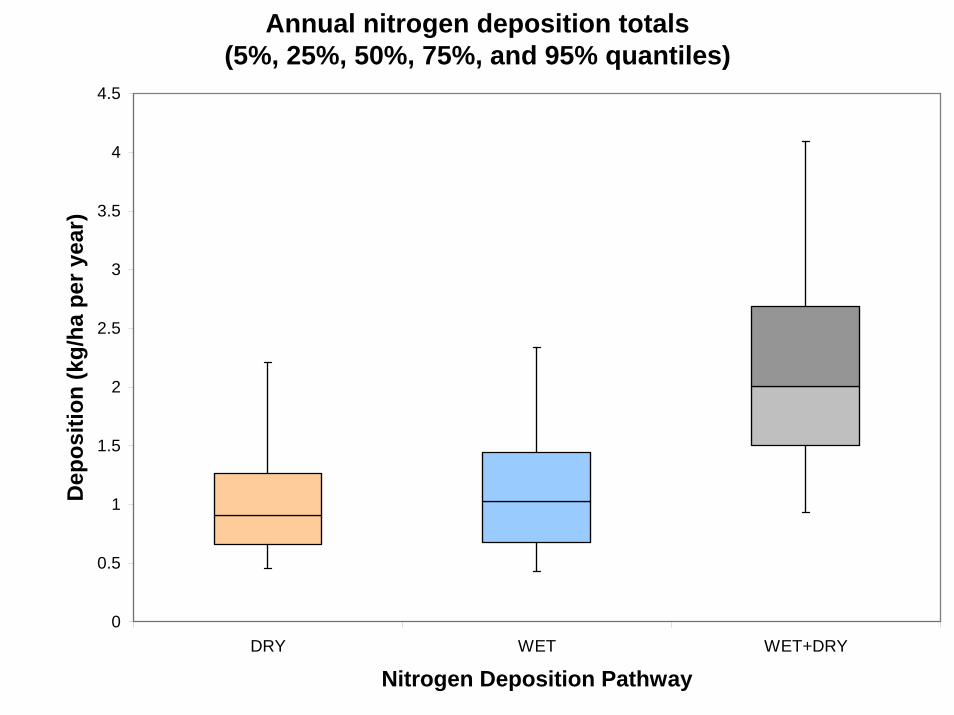
Annual nitrogen deposition totals(5%, 25%, 50%, 75%, and 95% quantiles)
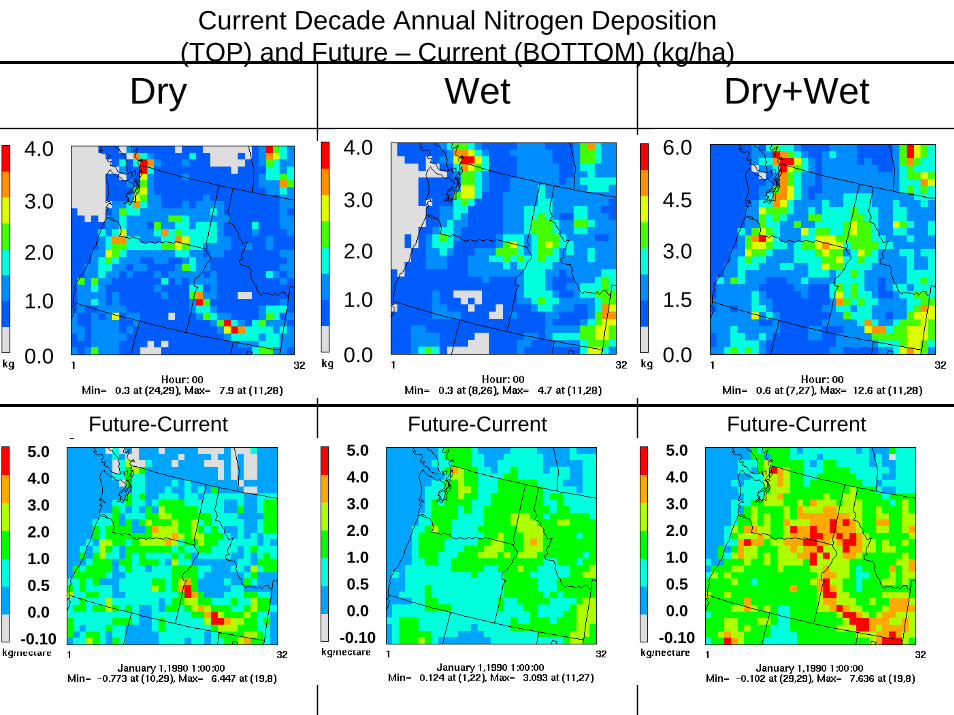
Current Decade Annual Nitrogen Deposition (TOP) and Future – Current (BOTTOM) (kg/ha)
Dry Wet Dry+Wet
Future-Current Future-Current Future-Current5.04.03.02.01.00.50.0
-0.10
5.04.03.02.01.00.50.0
-0.10
5.04.03.02.01.00.50.0
-0.10
0.0
6.0
4.5
3.0
1.5
0.0
4.0
3.0
2.0
1.0
0.0
4.0
3.0
2.0
1.0
0
0.5
1
1.5
2
2.5
3
3.5
DRY WET WET+DRY
Sulfur Deposition Pathway
Dep
ositi
on (k
g/ha
per
mon
th)
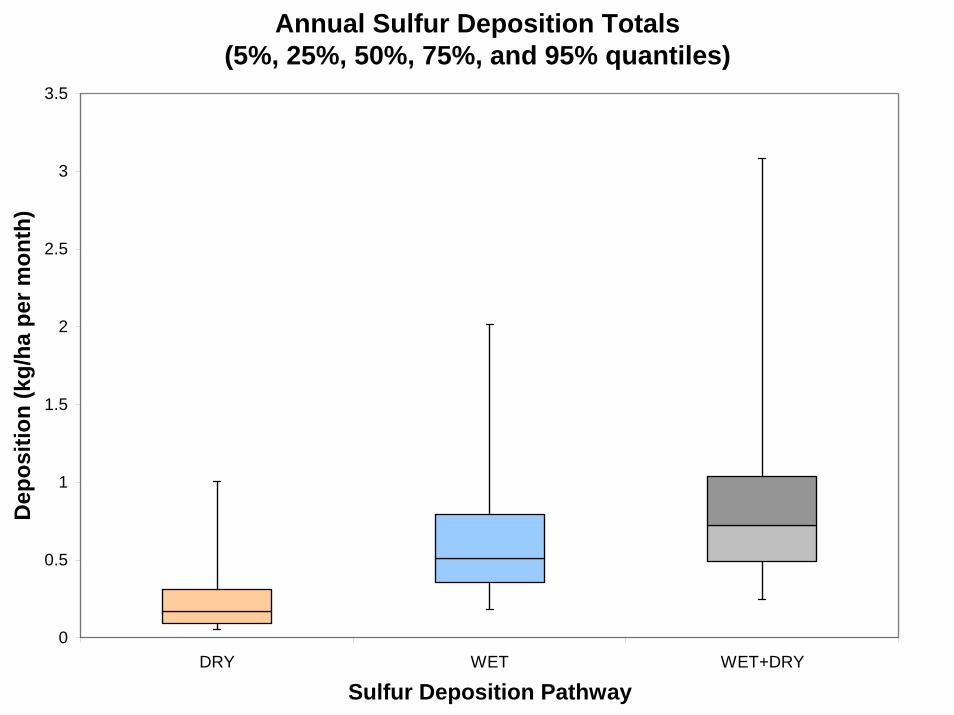
Annual Sulfur Deposition Totals(5%, 25%, 50%, 75%, and 95% quantiles)

NADP and CASTNET Deposition Monitoring Sites
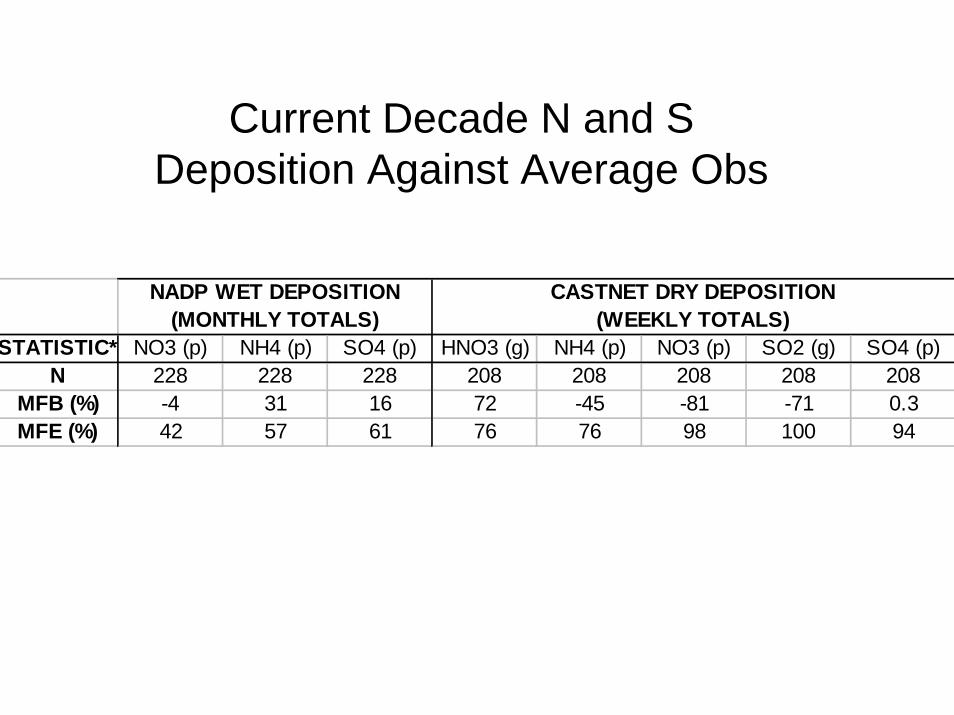
Current Decade N and S Deposition Against Average Obs
NADP WET DEPOSITION (MONTHLY TOTALS)
CASTNET DRY DEPOSITION (WEEKLY TOTALS)
STATISTIC* NO3 (p) NH4 (p) SO4 (p) HNO3 (g) NH4 (p) NO3 (p) SO2 (g) SO4 (p)N 228 228 228 208 208 208 208 208
MFB (%) -4 31 16 72 -45 -81 -71 0.3MFE (%) 42 57 61 76 76 98 100 94

Daily Forecast Run Mercury Deposition Results
Based upon Airpact-3 re-run for Aug-Nov, 2004

GFS GLOBAL MET
Pre-process
Monthly Average from
MOZART2
Pre-process
Real-Time MM5@
12 km
SMOKE @12 km
CMAQ @12 km
Meteorology BC-Chemistry Emissions
Biogenic
Anthropogenic
FireBluesky
MCIP
AIRPACT modeling system used for HG deposition results

NV
ID
OR
WA
AIRPACT-3 Top-End Mercury Point Source Emissions (CAMR 2001)
1
10
100
1000
10000
100000
Em
issi
ons
(lbm
/yr)
P4ProductionLLCPotlachCorpIDDivision-PulpandPaperboardPotlatchCorporationWoodProductsDivisionJERRITTCANYON(MAIN)TWINCREEKS/NEWMONTMININGCORP.BARRICKGOLDSTRIKEMINEOregonSteelMills-Inc.CascadeSteelRollingMills-Inc.AshGroveCementCompanyCovantaMarion-Inc.Boardman PowerPG&EGasTransmission-NorthwestCorp.PortlandGeneralElectricCompanyWeyerhaeuserCompanyGEORGIAPACIFICWESTINCCentralia PowerLONGVIEWFIBRECO.

August 2004 Daily HG-Deposition (mg/ha/day)
0.0
2.0
1.5
1.0
0.5
0.0
2.0
1.5
1.0
0.5
0.0
2.0
1.5
1.0
0.5
0.0
2.0
1.5
1.0
0.5
0.0
4.0
3.0
2.0
1.0
0.0
4.0
3.0
2.0
1.0
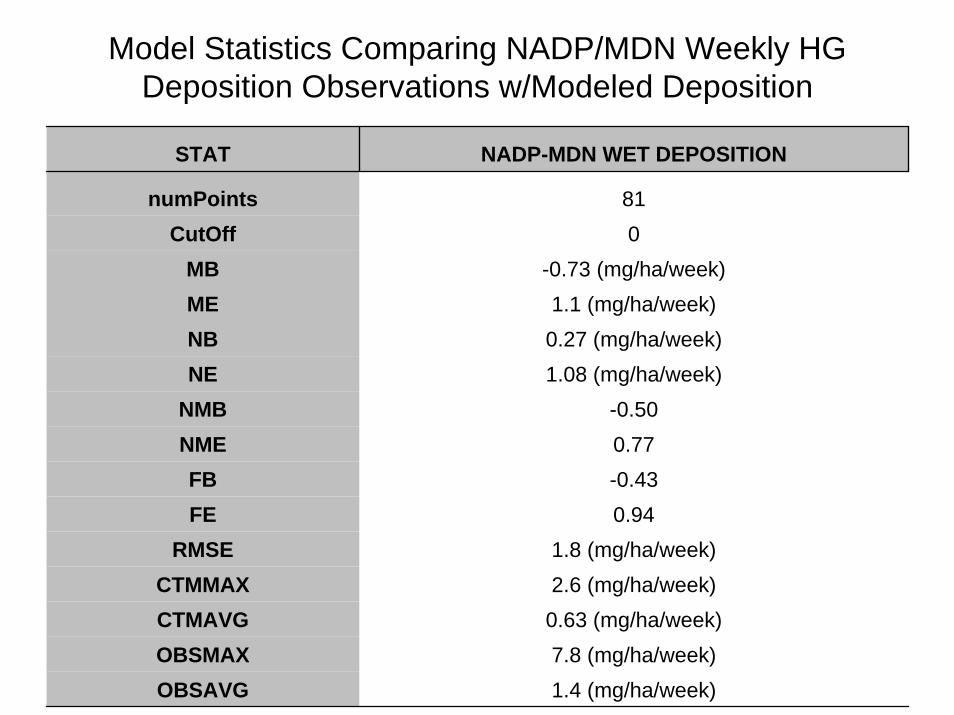
Model Statistics Comparing NADP/MDN Weekly HG Deposition Observations w/Modeled Deposition
STAT NADP-MDN WET DEPOSITION
numPoints 81CutOff 0
MB -0.73 (mg/ha/week)ME 1.1 (mg/ha/week)NB 0.27 (mg/ha/week)NE 1.08 (mg/ha/week)
NMB -0.50NME 0.77FB -0.43FE 0.94
RMSE 1.8 (mg/ha/week)CTMMAX 2.6 (mg/ha/week)CTMAVG 0.63 (mg/ha/week)OBSMAX 7.8 (mg/ha/week)OBSAVG 1.4 (mg/ha/week)

Maximum Total_HG Dry Deposition May 25, 2006, 1100 PST
South
west flo
w
AIRPACT-3 MAX (OVER 5X5 MATRIX) MERCURY DRY DEPOSITION MAY 25, 2006 AT SWAN RANCH
0102030405060
0 5 10 15 20 25
PST (hrs)
Mer
cury
(ug/
ha)
MERCURY

AMBIENT MERCURY MEASUREMENTS AT SALMON CREEK FALLS RESERVOIR, IDAHO, AND MAXIMA FROM AIRPACT, 25MAY06
0
10
20
30
40
50
60
0 5 10 15 20 25PST (hrs)
HG
IIGA
S (p
g/m
^3)
HGIIGAS-obHGIIGAS
Deposition in PNW• Only a first look with the modeling systems• Opportunities for more comparison with lichen
studies and other ecological measurements– Requires higher resolution and long term simulations
• No direct dry deposition measurements available
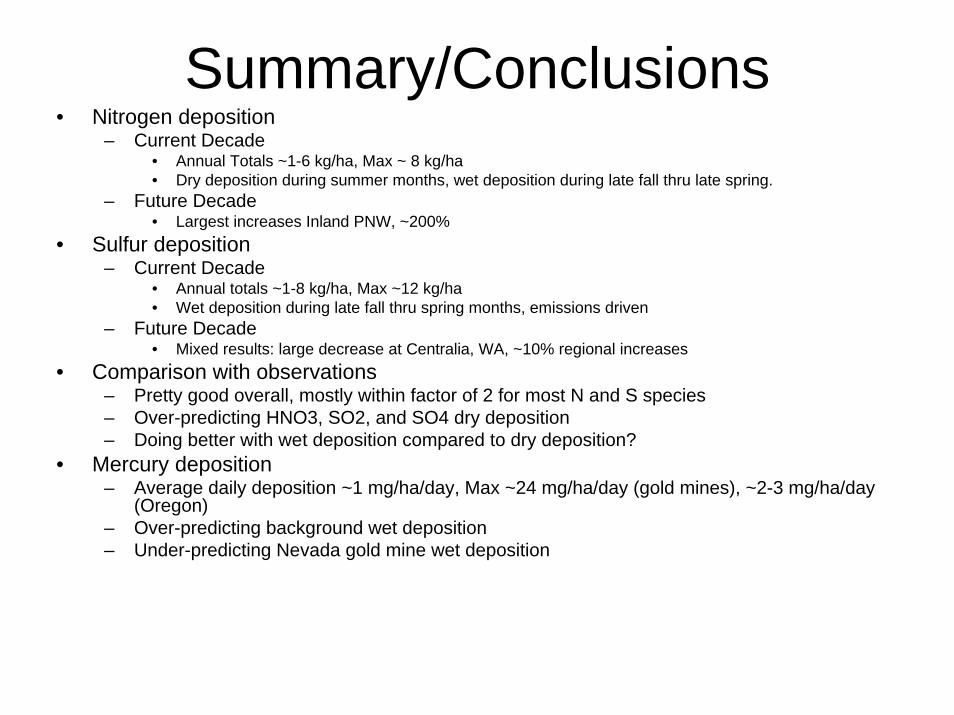
Summary/Conclusions• Nitrogen deposition
– Current Decade• Annual Totals ~1-6 kg/ha, Max ~ 8 kg/ha• Dry deposition during summer months, wet deposition during late fall thru late spring.
– Future Decade• Largest increases Inland PNW, ~200%
• Sulfur deposition– Current Decade
• Annual totals ~1-8 kg/ha, Max ~12 kg/ha• Wet deposition during late fall thru spring months, emissions driven
– Future Decade• Mixed results: large decrease at Centralia, WA, ~10% regional increases
• Comparison with observations– Pretty good overall, mostly within factor of 2 for most N and S species– Over-predicting HNO3, SO2, and SO4 dry deposition– Doing better with wet deposition compared to dry deposition?
• Mercury deposition– Average daily deposition ~1 mg/ha/day, Max ~24 mg/ha/day (gold mines), ~2-3 mg/ha/day
(Oregon)– Over-predicting background wet deposition– Under-predicting Nevada gold mine wet deposition

?Questions
?

August Nitrogen Deposition, 10-year Average
Dry Wet Dry+Wet
0.0
0.5
0.4
0.3
0.1
0.0
0.5
0.4
0.3
0.1
0.0
0.7
0.5
0.3
0.2

March Nitrogen Deposition, 10-year Average (kg/ha)
Dry Wet Dry+Wet
0.0
0.5
0.4
0.3
0.1
0.0
0.5
0.4
0.3
0.1
0.0
0.7
0.5
0.3
0.2

Annual Nitrogen Deposition, 10-year Average (kg/ha)
Dry Wet Dry+Wet
0.0
6.0
4.5
3.0
1.5
0.0
4.0
3.0
2.0
1.0
0.0
4.0
3.0
2.0
1.0

August Sulfur Deposition, 10-year Average (kg/ha)
Dry Wet Dry+Wet
0.0
0.5
0.4
0.3
0.1
0.0
0.5
0.4
0.3
0.1
0.0
1.0
0.5
0.3
0.2
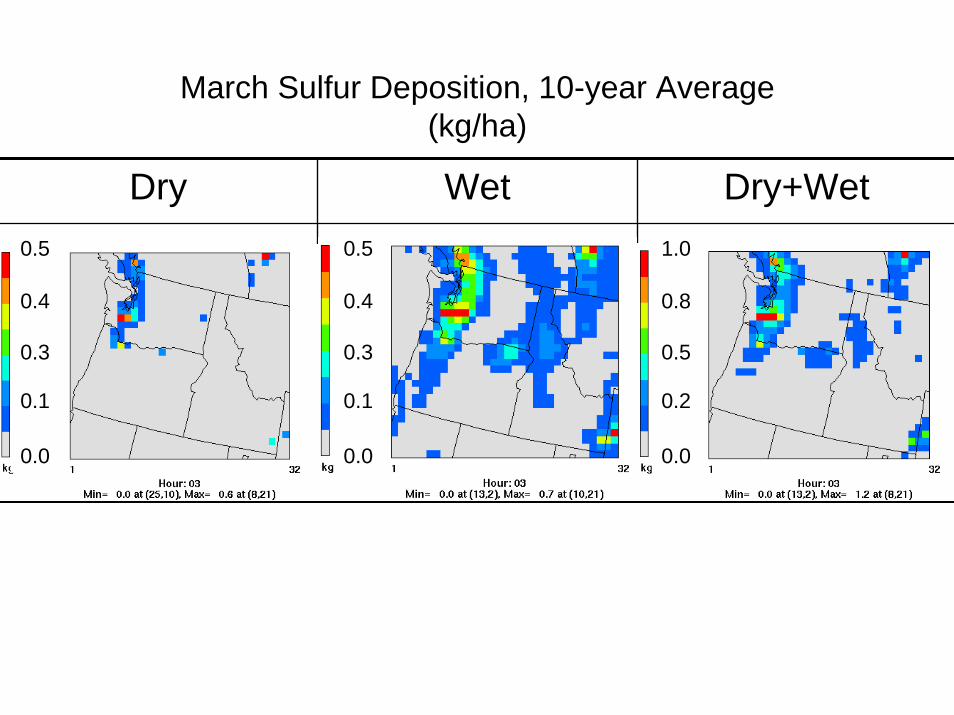
March Sulfur Deposition, 10-year Average (kg/ha)
Dry Wet Dry+Wet
0.0
0.5
0.4
0.3
0.1
0.0
0.5
0.4
0.3
0.1
0.0
1.0
0.8
0.5
0.2

Annual Sulfur Deposition, 10-year Average (kg/ha)
Dry Wet Dry+Wet
0.0
5.0
3.8
2.5
1.3
0.0
3.0
2.3
1.5
0.8
0.0
8.0
6.0
4.0
2.0

Dry Wet Dry+Wet
0.0
0.5
0.4
0.3
0.1
0.0
0.5
0.4
0.3
0.1
0.0
0.7
0.5
0.3
0.2
Current August Nitrogen Deposition (TOP) and Future – Current (BOTTOM) (kg/ha)
Future-Current Future-Current Future-Current
-0.15
0.08
0.05
-0.050.00
0.500.30
0.15
-0.15
0.08
0.05
-0.050.00
0.500.30
0.15
-0.15
0.08
0.05
-0.050.00
0.500.30
0.15

Dry Wet Dry+Wet
Current March Nitrogen Deposition (TOP) and Future – Current (BOTTOM) (kg/ha)
0.0
0.5
0.4
0.3
0.1
0.0
0.5
0.4
0.3
0.1
0.0
0.7
0.5
0.3
0.2
Future-Current Future-Current Future-Current
-0.15
0.08
0.05
-0.050.00
0.500.30
0.15
-0.15
0.08
0.05
-0.050.00
0.500.30
0.15
-0.15
0.08
0.05
-0.050.00
0.500.30
0.15

Monthly Sulfur Deposition Totals(5%, 25%, 50%, 75%, and 95% quantiles)
0
0.05
0.1
0.15
0.2
0.25
0.3
0.35
JAN FEB MAR APR MAY JUN JUL AUG SEP OCT NOV DEC
Months of Wet+Dry Deposition
Dep
ositi
on (k
g/ha
per
mon
th)

Current August Sulfur Deposition (TOP) and Future – Current (BOTTOM) (kg/ha)
Future-Current Future-Current Future-Current
-0.20
0.20
0.00
-0.10
0.10
0.040.015
-0.015-0.04
-0.20
0.20
0.00
-0.10
0.10
0.040.015
-0.015-0.04
-0.20
0.20
0.00
-0.10
0.10
0.040.015
-0.015-0.04
Dry Wet Dry+Wet
0.0
0.5
0.4
0.3
0.1
0.0
0.5
0.4
0.3
0.1
0.0
1.0
0.5
0.3
0.2

Current March Sulfur Deposition (TOP) and Future – Current (BOTTOM) (kg/ha)
Future-Current Future-Current Future-Current
-0.20
0.20
0.00
-0.10
0.10
0.040.015
-0.015-0.04
-0.20
0.20
0.00
-0.10
0.10
0.040.015
-0.015-0.04
-0.20
0.20
0.00
-0.10
0.10
0.040.015
-0.015-0.04
Dry Wet Dry+Wet
0.0
0.5
0.4
0.3
0.1
0.0
0.5
0.4
0.3
0.1
0.0
1.0
0.8
0.5
0.2
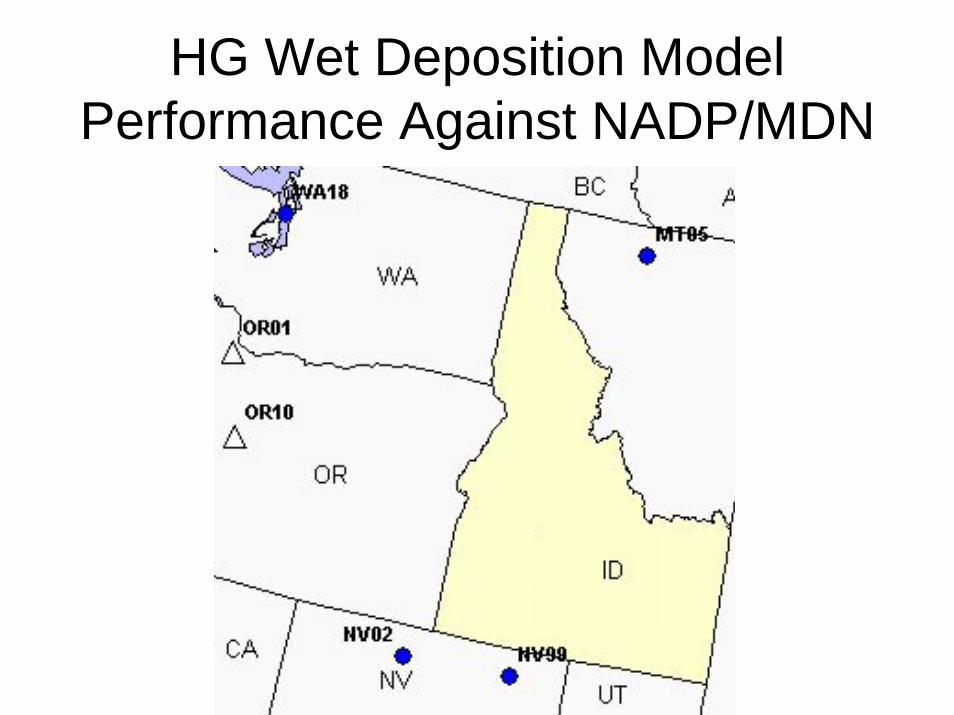
HG Wet Deposition Model Performance Against NADP/MDN

Current Decade Annual Sulfur Deposition (TOP) and Future – Current (BOTTOM) (kg/ha)
Dry Wet Dry+Wet
Future-Current Future-Current Future-Current0.7500.6250.5000.3750.2500.1250.000
-0.125-0.250-0.375-0.500
0.7500.6250.5000.3750.2500.1250.000
-0.125-0.250-0.375-0.500
0.7500.6250.5000.3750.2500.1250.000
-0.125-0.250-0.375-0.500
0.0
5.0
3.8
2.5
1.3
0.0
3.0
2.3
1.5
0.8
0.0
8.0
6.0
4.0
2.0

Monthly Sulfur Deposition Totals(5%, 25%, 50%, 75%, and 95% quantiles)
0
0.05
0.1
0.15
0.2
0.25
JAN FEB MAR APR MAY JUN JUL AUG SEP OCT NOV DEC
Months of Dry (tan) and Wet (blue) Deposition
Dep
ositi
on (k
g/ha
per
mon
th)