package ‘nsroc’ - the comprehensive r archive network · plot plot an roc curve plot plot...
TRANSCRIPT
Package ‘nsROC’June 23, 2017
Type Package
Title Non-Standard ROC Curve Analysis
Version 1.0
Author Sonia Perez Fernandez
Maintainer Sonia Perez Fernandez <[email protected]>
Description Tools for estimating Receiver Operating Characteristic (ROC) curves,building confidence bands, comparing several curves both for dependent andindependent data, estimating the cumulative-dynamic ROC curve in presence ofcensored data, and performing meta-analysis studies, among others.
License GPL (>= 3)
Depends R (>= 2.10)
LazyData TRUE
Imports stats, methods, utils, graphics, sde, survival
Suggests mvtnorm
RoxygenNote 5.0.1
NeedsCompilation no
Repository CRAN
Date/Publication 2017-06-23 12:36:14 UTC
R topics documented:nsROC-package . . . . . . . . . . . . . . . . . . . . . . . . . . . . . . . . . . . . . . . 2cdROC . . . . . . . . . . . . . . . . . . . . . . . . . . . . . . . . . . . . . . . . . . . 4checkROC . . . . . . . . . . . . . . . . . . . . . . . . . . . . . . . . . . . . . . . . . . 7compareROCdep . . . . . . . . . . . . . . . . . . . . . . . . . . . . . . . . . . . . . . 8compareROCindep . . . . . . . . . . . . . . . . . . . . . . . . . . . . . . . . . . . . . 12gROC . . . . . . . . . . . . . . . . . . . . . . . . . . . . . . . . . . . . . . . . . . . . 15interleukin6 . . . . . . . . . . . . . . . . . . . . . . . . . . . . . . . . . . . . . . . . . 18metaROC . . . . . . . . . . . . . . . . . . . . . . . . . . . . . . . . . . . . . . . . . . 19plot . . . . . . . . . . . . . . . . . . . . . . . . . . . . . . . . . . . . . . . . . . . . . 21print . . . . . . . . . . . . . . . . . . . . . . . . . . . . . . . . . . . . . . . . . . . . . 23ROCbands . . . . . . . . . . . . . . . . . . . . . . . . . . . . . . . . . . . . . . . . . . 24
1
2 nsROC-package
Index 28
nsROC-package nsROC
Description
Tools for estimating Receiver Operating Characteristic (ROC) curves, building confidence bands,comparing several curves both for dependent and independent data, estimating the cumulative-dynamic ROC curve in presence of censored data, and performing meta-analysis studies, amongothers.
Details
The basic function of the nsROC package is the gROC function. It will estimate an ROC curve underone of these considerations: larger values of the marker are associated with a higher probability ofbeing positive (right-sided), the opposite (left-sided) or when both smaller and larger values of themarker are associated with having more probability of being positive (both).
Confidence bands for an ROC curve estimate resulting of the previous function can be computedand displayed by the ROCbands function. Three different methods are provided to compute them.
Several paired or unpaired ROC curves can be compared with the compareROCdep or compareROCindepfunction, respectively. In order to compare ROC curves different statistics can be used, and to ap-proximate the distribution of the statistic in the paired case both permutation and bootstrap proce-dures are computed.
Time-dependent ROC curves can be estimated by the cumulative/dynamic approach using the cdROCfunction. In order to deal with the right censored problem three different statistics can be considered.
Meta-analysis of ROC curves following a non-parametric approach can be performed with themetaROC function. Both the fixed-effects and random-effects model can be considered.
Abbreviations
The following abbreviations are frequently used in this package:
• ROC: Receiver Operating Characteristic
• AUC: Area Under the (ROC) Curve
• Sp: Specificity
• Se: Sensitivity
• TPR: True-Positive Rate
• FPR: False-Positive Rate
nsROC-package 3
Functions
gROC ROC curve estimate (generalization included)ROCbands Confidence bands for ROC curvescompareROCdep Comparison of k paired ROC curvescompareROCindep Comparison of k independent ROC curvescdROC Cumulative/dynamic ROC curve estimatemetaROC Non-parametric ROC curve estimate for meta-analysisplot Plot an ROC curveplot Plot confidence bands for an ROC curveplot Plot a time-dependent ROC curveprint Print a groc objectprint Print a rocbands objectprint Print a cdroc objectcheckROC Check the data to compute an ROC curve (internal function)
Dataset
This package comes with a dataset of 9 papers (meta-analysis) with the number of TP (true positive),FP (false positive), TN (true negative) and FN (false negative) about the use of the Interleukin6 (IL6)as a marker for the early detection of neonatal sepsis: interleukin6.
Installing and using
To install this package:
install.packages("nsROC")
To load the package:
library(nsROC)
Author(s)
Sonia Perez-Fernandez
Maintainer: Sonia Perez Fernandez <[email protected]>
See Also
CRAN packages sde and survival employed in this package.
4 cdROC
cdROC Cumulative/dynamic ROC curve estimate
Description
This function estimates a time-dependent ROC curve following the cumulative/dynamic approachand returns a ’cdroc’ object. This object can be printed or plotted. To deal with the rightcensored problem different statistics can be considered: those ones proposed by Martinez-Cambloret al. (2016) based on the hazard Cox regression model (semiparametric) or the Kaplan-Meierestimator (non-parametric); and the one included in Li et al. (2016) based on the kernel-weightedKaplan-Meier method. See References below.
Usage
cdROC(stime, status, marker, predict.time, ...)## Default S3 method:cdROC(stime, status, marker, predict.time, method=c('Cox', 'KM', 'wKM'),
kernel=c('normal', 'Epanechnikov', 'other'), h=1,kernel.fun = function(x,xi,h){u <- (x-xi)/h; 1/(2*h)*(abs(u) <= 1)},ci=FALSE, boot.n=100, conf.level=0.95, seed=2032, ...)
Arguments
stime vector of observed times.
status vector of status (takes the value 0 if the subject is censored and 1 otherwise).
marker vector of (bio)marker values.
predict.time considered time point (scalar).
method procedure used to estimate the probability. One of "Cox" (method based onCox regression), "KM" (method based on Kaplan-Meier estimator) or "wKM"(method based on kernel-weighted Kaplan-Meier estimator).
kernel procedure used to calculate the kernel function. One of "normal", "Epanech-nikov" or "other". Only considered if method='wKM'.
h bandwith used to calculate the kernel function. Only considered if method='wKM'.
kernel.fun if method='wKM' and kernel='other', function used to calculate the kernelfunction. It has three input parameters: x=vector, xi=value around which thekernel weight should be computed, h=bandwidth. Default: Uniform kernel.
ci if TRUE, a confidence interval for the area under the curve is computed.
boot.n number of bootstrap replicates considered to build the confidence interval. De-fault: 100.
conf.level the width of the confidence band as a number in (0,1). Default: 0.95, resultingin a 95% confidence band.
seed seed considered to generate bootstrap replicates (for reproducibility).
... additional arguments for cdROC. Ignored.
cdROC 5
Details
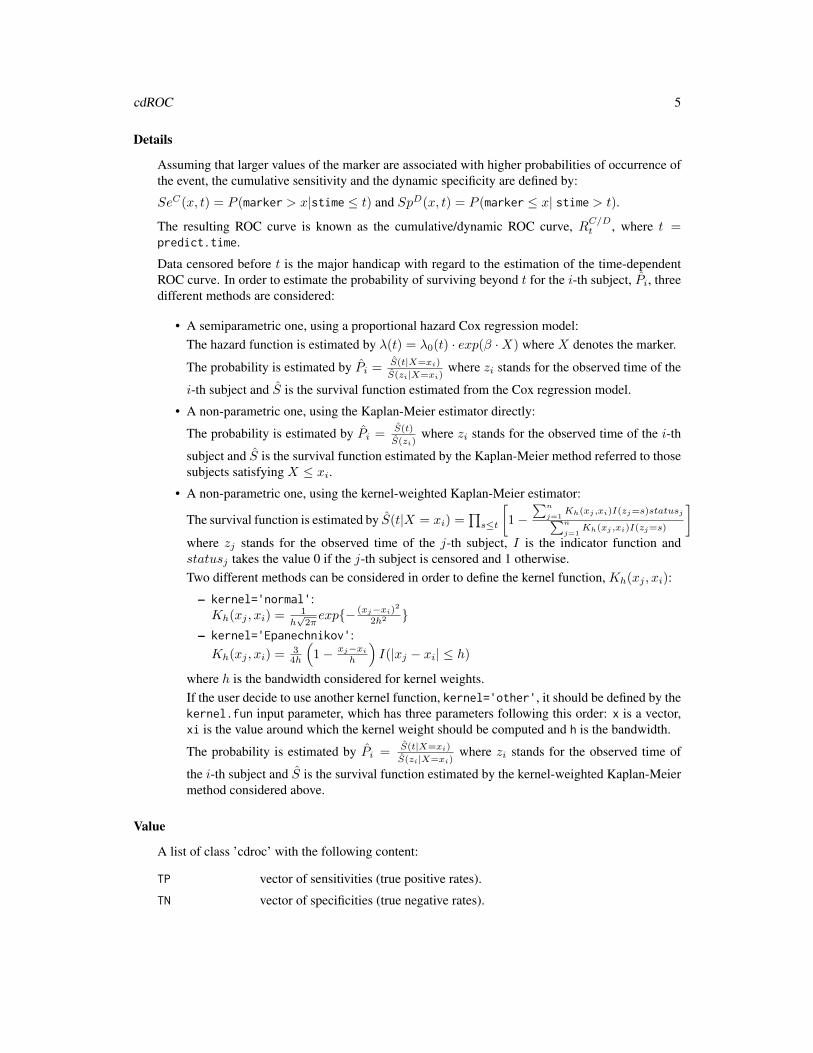
Assuming that larger values of the marker are associated with higher probabilities of occurrence ofthe event, the cumulative sensitivity and the dynamic specificity are defined by:
SeC(x, t) = P (marker > x|stime ≤ t) and SpD(x, t) = P (marker ≤ x| stime > t).
The resulting ROC curve is known as the cumulative/dynamic ROC curve, RC/Dt , where t =predict.time.
Data censored before t is the major handicap with regard to the estimation of the time-dependentROC curve. In order to estimate the probability of surviving beyond t for the i-th subject, Pi, threedifferent methods are considered:
• A semiparametric one, using a proportional hazard Cox regression model:The hazard function is estimated by λ(t) = λ0(t) · exp(β ·X) where X denotes the marker.
The probability is estimated by Pi = S(t|X=xi)
S(zi|X=xi)where zi stands for the observed time of the
i-th subject and S is the survival function estimated from the Cox regression model.
• A non-parametric one, using the Kaplan-Meier estimator directly:
The probability is estimated by Pi = S(t)
S(zi)where zi stands for the observed time of the i-th
subject and S is the survival function estimated by the Kaplan-Meier method referred to thosesubjects satisfying X ≤ xi.
• A non-parametric one, using the kernel-weighted Kaplan-Meier estimator:
The survival function is estimated by S(t|X = xi) =∏s≤t
[1−
∑n
j=1Kh(xj ,xi)I(zj=s)statusj∑n
j=1Kh(xj ,xi)I(zj=s)
]where zj stands for the observed time of the j-th subject, I is the indicator function andstatusj takes the value 0 if the j-th subject is censored and 1 otherwise.Two different methods can be considered in order to define the kernel function, Kh(xj , xi):
– kernel='normal':Kh(xj , xi) = 1
h√
2πexp{− (xj−xi)
2
2h2 }– kernel='Epanechnikov':Kh(xj , xi) = 3
4h
(1− xj−xi
h
)I(|xj − xi| ≤ h)
where h is the bandwidth considered for kernel weights.If the user decide to use another kernel function, kernel='other', it should be defined by thekernel.fun input parameter, which has three parameters following this order: x is a vector,xi is the value around which the kernel weight should be computed and h is the bandwidth.
The probability is estimated by Pi = S(t|X=xi)
S(zi|X=xi)where zi stands for the observed time of
the i-th subject and S is the survival function estimated by the kernel-weighted Kaplan-Meiermethod considered above.
Value
A list of class ’cdroc’ with the following content:
TP vector of sensitivities (true positive rates).
TN vector of specificities (true negative rates).
6 cdROC
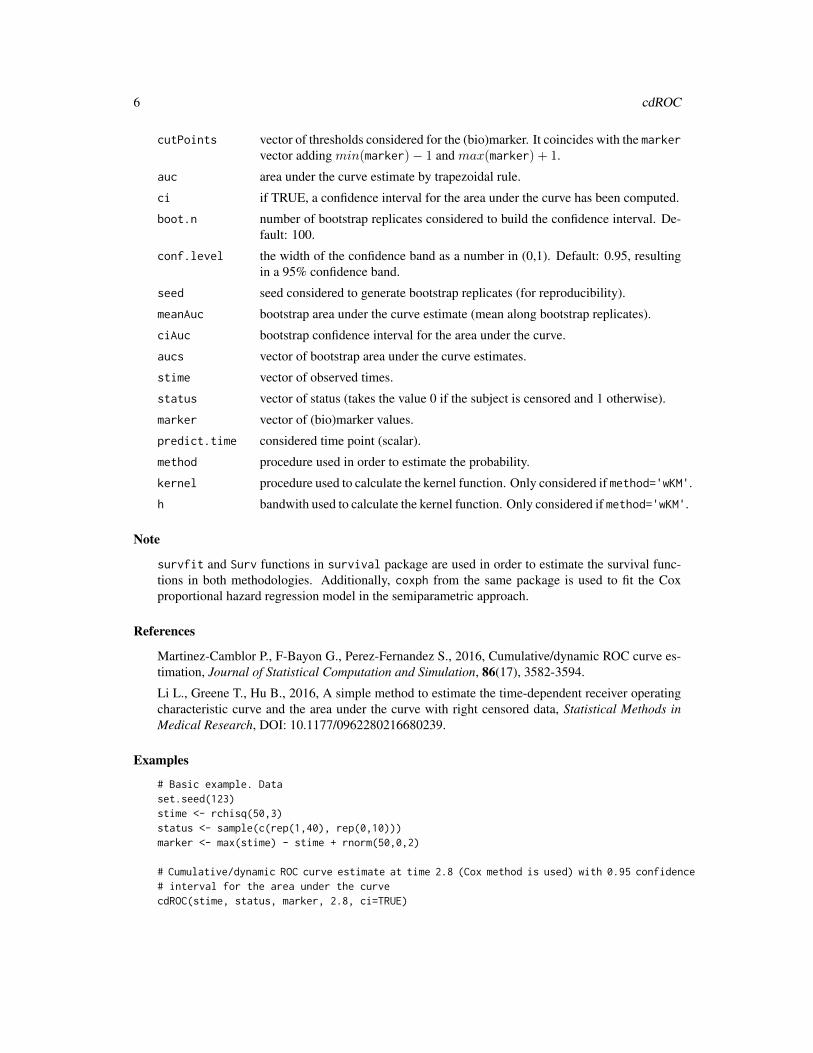
cutPoints vector of thresholds considered for the (bio)marker. It coincides with the markervector adding min(marker)− 1 and max(marker) + 1.
auc area under the curve estimate by trapezoidal rule.
ci if TRUE, a confidence interval for the area under the curve has been computed.
boot.n number of bootstrap replicates considered to build the confidence interval. De-fault: 100.
conf.level the width of the confidence band as a number in (0,1). Default: 0.95, resultingin a 95% confidence band.
seed seed considered to generate bootstrap replicates (for reproducibility).
meanAuc bootstrap area under the curve estimate (mean along bootstrap replicates).
ciAuc bootstrap confidence interval for the area under the curve.
aucs vector of bootstrap area under the curve estimates.
stime vector of observed times.
status vector of status (takes the value 0 if the subject is censored and 1 otherwise).
marker vector of (bio)marker values.
predict.time considered time point (scalar).
method procedure used in order to estimate the probability.
kernel procedure used to calculate the kernel function. Only considered if method='wKM'.
h bandwith used to calculate the kernel function. Only considered if method='wKM'.
Note
survfit and Surv functions in survival package are used in order to estimate the survival func-tions in both methodologies. Additionally, coxph from the same package is used to fit the Coxproportional hazard regression model in the semiparametric approach.
References
Martinez-Camblor P., F-Bayon G., Perez-Fernandez S., 2016, Cumulative/dynamic ROC curve es-timation, Journal of Statistical Computation and Simulation, 86(17), 3582-3594.
Li L., Greene T., Hu B., 2016, A simple method to estimate the time-dependent receiver operatingcharacteristic curve and the area under the curve with right censored data, Statistical Methods inMedical Research, DOI: 10.1177/0962280216680239.
Examples
# Basic example. Dataset.seed(123)stime <- rchisq(50,3)status <- sample(c(rep(1,40), rep(0,10)))marker <- max(stime) - stime + rnorm(50,0,2)
# Cumulative/dynamic ROC curve estimate at time 2.8 (Cox method is used) with 0.95 confidence# interval for the area under the curvecdROC(stime, status, marker, 2.8, ci=TRUE)

checkROC 7
# Cumulative/dynamic ROC curve estimate at time 3.1 (Kaplan-Meier method is used)cdROC(stime, status, marker, 3.1, method="KM")
# Cumulative/dynamic ROC curve estimate at time 3 (kernel-weighted Kaplan-Meier method with# gaussian kernel and bandwidth 1 is used)cdROC(stime, status, marker, 3, method="wKM")
# Cumulative/dynamic ROC curve estimate at time 3 (kernel-weighted Kaplan-Meier method with# biweight kernel and bandwidth equals to 2 is used)cdROC(stime, status, marker, 3, method="wKM", kernel="other", h=2,
kernel.fun = function(x,xi,h){u <- (x-xi)/h; 15/(16*h)*(1-u^2)^2*(abs(u)<=1)})
checkROC Check data to compute an ROC curve
Description
This internal function checks if the data introduced for building the curve is correct or not. It showsif there are some missing marker or response values and whether there are less or more than twolevels at the response vector, D. It also splits the data into two groups: controls and cases, dependingon the corresponding value in the response vector.
Usage
checkROC(X,D)
Arguments
X vector of (bio)marker values. It should be numeric.
D vector of response values. It should contain at least two different levels.
Details
The code will not run and an error will be showed in these cases:
• X or D is missing,
• X or D is NULL or full of NA’s,
• X is not a numeric vector,
• D has less than two different values, and/or
• X and D have different lengths.
If the response vector has more than two different levels, only the two first ones are considered ascontrols and cases, respectively.
If the user does not agree with the codification, it can be changed modifying the order of the levelsusing the factor function; for instance, factor(D, levels=c("1","0")).
8 compareROCdep
Value
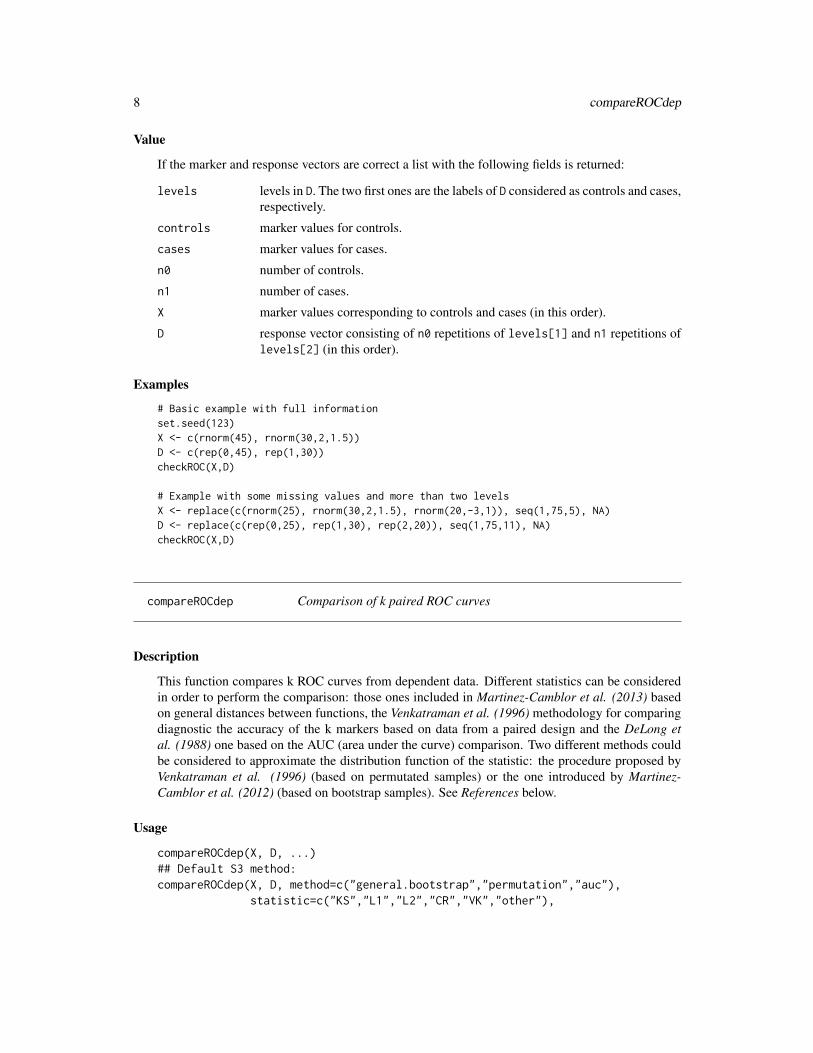
If the marker and response vectors are correct a list with the following fields is returned:
levels levels in D. The two first ones are the labels of D considered as controls and cases,respectively.
controls marker values for controls.
cases marker values for cases.
n0 number of controls.
n1 number of cases.
X marker values corresponding to controls and cases (in this order).
D response vector consisting of n0 repetitions of levels[1] and n1 repetitions oflevels[2] (in this order).
Examples
# Basic example with full informationset.seed(123)X <- c(rnorm(45), rnorm(30,2,1.5))D <- c(rep(0,45), rep(1,30))checkROC(X,D)
# Example with some missing values and more than two levelsX <- replace(c(rnorm(25), rnorm(30,2,1.5), rnorm(20,-3,1)), seq(1,75,5), NA)D <- replace(c(rep(0,25), rep(1,30), rep(2,20)), seq(1,75,11), NA)checkROC(X,D)
compareROCdep Comparison of k paired ROC curves
Description
This function compares k ROC curves from dependent data. Different statistics can be consideredin order to perform the comparison: those ones included in Martinez-Camblor et al. (2013) basedon general distances between functions, the Venkatraman et al. (1996) methodology for comparingdiagnostic the accuracy of the k markers based on data from a paired design and the DeLong etal. (1988) one based on the AUC (area under the curve) comparison. Two different methods couldbe considered to approximate the distribution function of the statistic: the procedure proposed byVenkatraman et al. (1996) (based on permutated samples) or the one introduced by Martinez-Camblor et al. (2012) (based on bootstrap samples). See References below.
Usage
compareROCdep(X, D, ...)## Default S3 method:compareROCdep(X, D, method=c("general.bootstrap","permutation","auc"),
statistic=c("KS","L1","L2","CR","VK","other"),
compareROCdep 9
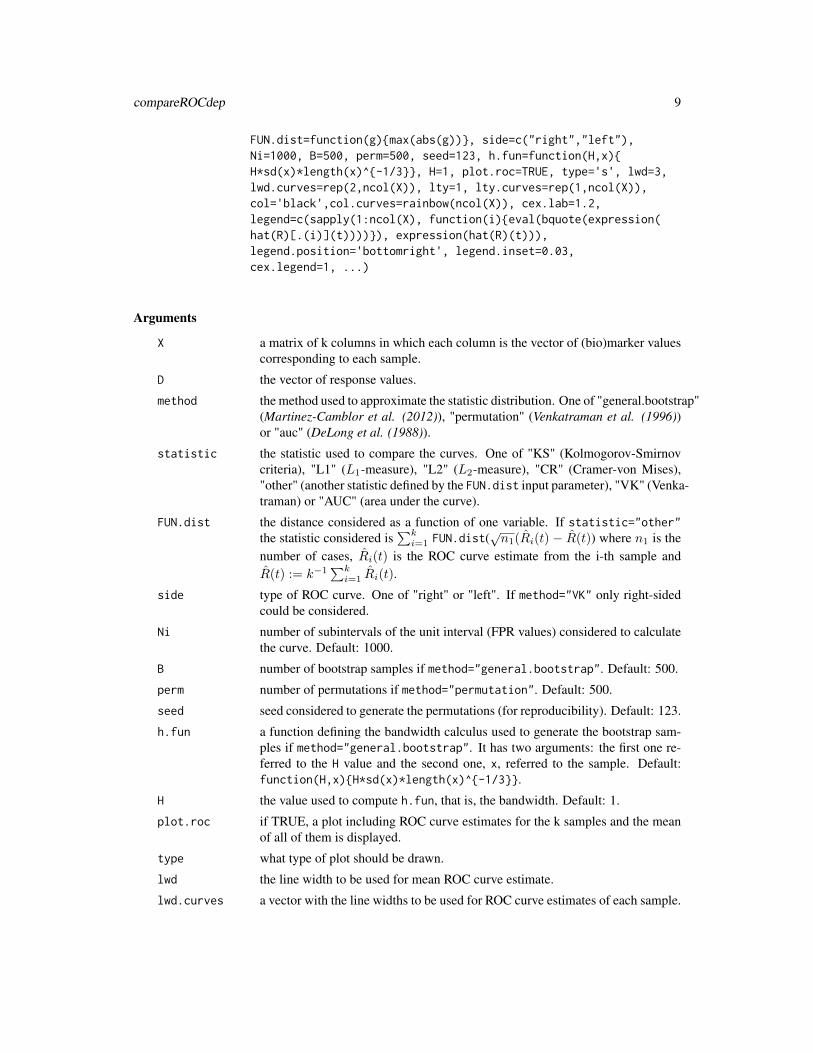
FUN.dist=function(g){max(abs(g))}, side=c("right","left"),Ni=1000, B=500, perm=500, seed=123, h.fun=function(H,x){H*sd(x)*length(x)^{-1/3}}, H=1, plot.roc=TRUE, type='s', lwd=3,lwd.curves=rep(2,ncol(X)), lty=1, lty.curves=rep(1,ncol(X)),col='black',col.curves=rainbow(ncol(X)), cex.lab=1.2,legend=c(sapply(1:ncol(X), function(i){eval(bquote(expression(hat(R)[.(i)](t))))}), expression(hat(R)(t))),legend.position='bottomright', legend.inset=0.03,cex.legend=1, ...)
Arguments
X a matrix of k columns in which each column is the vector of (bio)marker valuescorresponding to each sample.
D the vector of response values.
method the method used to approximate the statistic distribution. One of "general.bootstrap"(Martinez-Camblor et al. (2012)), "permutation" (Venkatraman et al. (1996))or "auc" (DeLong et al. (1988)).
statistic the statistic used to compare the curves. One of "KS" (Kolmogorov-Smirnovcriteria), "L1" (L1-measure), "L2" (L2-measure), "CR" (Cramer-von Mises),"other" (another statistic defined by the FUN.dist input parameter), "VK" (Venka-traman) or "AUC" (area under the curve).
FUN.dist the distance considered as a function of one variable. If statistic="other"the statistic considered is
∑ki=1 FUN.dist(
√n1(Ri(t) − R(t)) where n1 is the
number of cases, Ri(t) is the ROC curve estimate from the i-th sample andR(t) := k−1
∑ki=1 Ri(t).
side type of ROC curve. One of "right" or "left". If method="VK" only right-sidedcould be considered.
Ni number of subintervals of the unit interval (FPR values) considered to calculatethe curve. Default: 1000.
B number of bootstrap samples if method="general.bootstrap". Default: 500.
perm number of permutations if method="permutation". Default: 500.
seed seed considered to generate the permutations (for reproducibility). Default: 123.
h.fun a function defining the bandwidth calculus used to generate the bootstrap sam-ples if method="general.bootstrap". It has two arguments: the first one re-ferred to the H value and the second one, x, referred to the sample. Default:function(H,x){H*sd(x)*length(x)^{-1/3}}.
H the value used to compute h.fun, that is, the bandwidth. Default: 1.
plot.roc if TRUE, a plot including ROC curve estimates for the k samples and the meanof all of them is displayed.
type what type of plot should be drawn.
lwd the line width to be used for mean ROC curve estimate.
lwd.curves a vector with the line widths to be used for ROC curve estimates of each sample.
10 compareROCdep
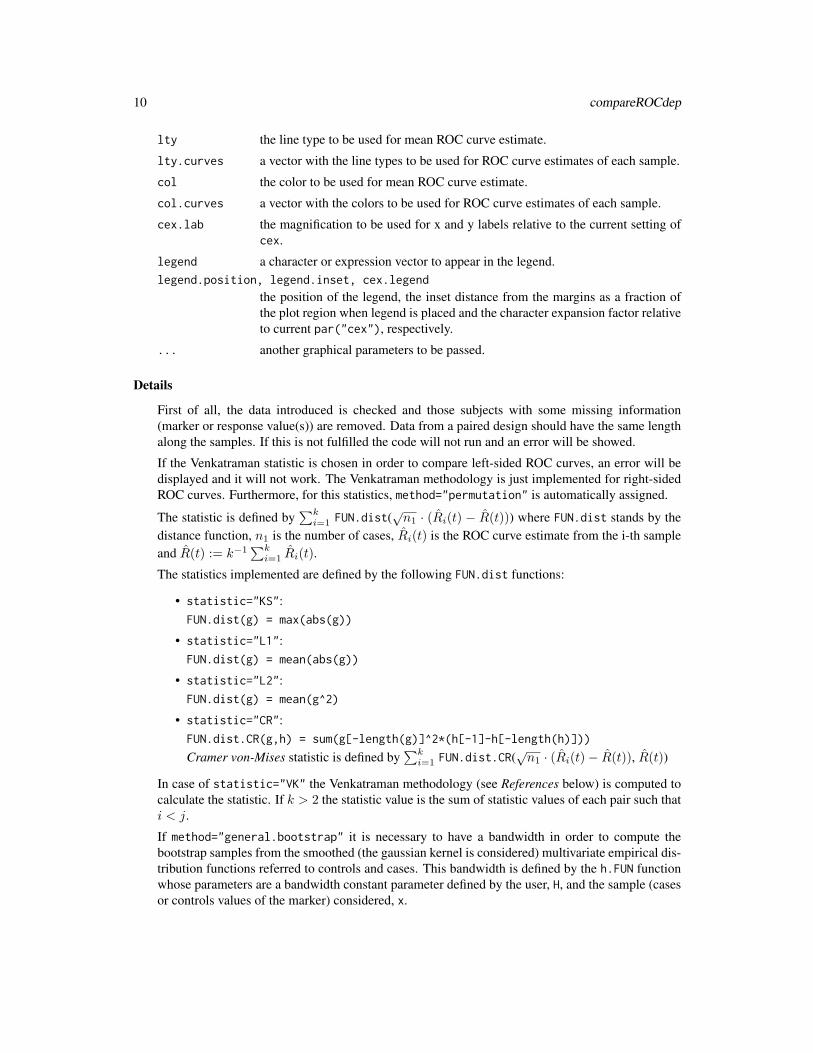
lty the line type to be used for mean ROC curve estimate.
lty.curves a vector with the line types to be used for ROC curve estimates of each sample.
col the color to be used for mean ROC curve estimate.
col.curves a vector with the colors to be used for ROC curve estimates of each sample.
cex.lab the magnification to be used for x and y labels relative to the current setting ofcex.
legend a character or expression vector to appear in the legend.legend.position, legend.inset, cex.legend
the position of the legend, the inset distance from the margins as a fraction ofthe plot region when legend is placed and the character expansion factor relativeto current par("cex"), respectively.
... another graphical parameters to be passed.
Details
First of all, the data introduced is checked and those subjects with some missing information(marker or response value(s)) are removed. Data from a paired design should have the same lengthalong the samples. If this is not fulfilled the code will not run and an error will be showed.
If the Venkatraman statistic is chosen in order to compare left-sided ROC curves, an error will bedisplayed and it will not work. The Venkatraman methodology is just implemented for right-sidedROC curves. Furthermore, for this statistics, method="permutation" is automatically assigned.
The statistic is defined by∑ki=1 FUN.dist(
√n1 · (Ri(t) − R(t))) where FUN.dist stands by the
distance function, n1 is the number of cases, Ri(t) is the ROC curve estimate from the i-th sampleand R(t) := k−1
∑ki=1 Ri(t).
The statistics implemented are defined by the following FUN.dist functions:
• statistic="KS":FUN.dist(g) = max(abs(g))
• statistic="L1":FUN.dist(g) = mean(abs(g))
• statistic="L2":FUN.dist(g) = mean(g^2)
• statistic="CR":FUN.dist.CR(g,h) = sum(g[-length(g)]^2*(h[-1]-h[-length(h)]))
Cramer von-Mises statistic is defined by∑ki=1 FUN.dist.CR(
√n1 · (Ri(t)− R(t)), R(t))
In case of statistic="VK" the Venkatraman methodology (see References below) is computed tocalculate the statistic. If k > 2 the statistic value is the sum of statistic values of each pair such thati < j.
If method="general.bootstrap" it is necessary to have a bandwidth in order to compute thebootstrap samples from the smoothed (the gaussian kernel is considered) multivariate empirical dis-tribution functions referred to controls and cases. This bandwidth is defined by the h.FUN functionwhose parameters are a bandwidth constant parameter defined by the user, H, and the sample (casesor controls values of the marker) considered, x.

compareROCdep 11
If method="auc", the methodology proposed by DeLong et al. is implemented. This option isslower because of the Mann-Whitney statistic inside requires number of cases·number of controlscomparisons. In this case, statistic returns the value of the Mann-Whitney statistic estimate andtest.statistic the final test statistic estimate (formula (5) in the paper) which follows a chi-square distribution.
Value
n.controls the number of controls.
n.cases the number of cases.
controls.k a matrix whose columns are the controls along the k samples.
cases.k a matrix whose columns are the cases along the k samples.
statistic the value of the test statistic.
stat.boot a vector of statistic values for bootstrap replicates if method="general.bootstrap".
stat.perm a vector of statistic values for permutations if method="permutation".test.statistic
statistic estimate given in formula (5) of DeLong et al. (1988) (See Referencesbelow) if method="auc".
p.value the p-value for the test.
References
Venkatraman E.S., Begg C.B., 1996, A distribution-free procedure for comparing receiver operatingcharacteristic curves from a paired experiment, Biometrika, 83(4), 835-848.
Martinez-Camblor P., Corral, N., 2012, A general bootstrap algorithm for hypothesis testing, Jour-nal of Statistical Planning and Inference, 142, 589-600.
Martinez-Camblor P., Carleos C., Corral N., 2013, General nonparametric ROC curve comparison,Journal of the Korean Statistical Society, 42(1), 71-81.
DeLong E.R., DeLong D.M., Clarke-Pearson D.L., 1988, Comparing the areas under two or morecorrelated receiver operating characteristic curves: a nonparametric approach, Biometrics, 44, 837-845.
Examples
n0 <- 45; n1 <- 60set.seed(123)D <- c(rep(0,n0), rep(1,n1))
library(mvtnorm)rho.12 <- 1/4; rho.13 <- 1/4; rho.23 <- 0.5sd.controls <- c(1,1,1)sd.cases <- c(1,1,1)var.controls <- sd.controls%*%t(sd.controls)var.cases <- sd.cases%*%t(sd.cases)sigma.controls <- var.controls*matrix(c(1,rho.12,rho.13,rho.12,1,rho.23,rho.13,rho.23,1),3,3)sigma.cases <- var.cases*matrix(c(1,rho.12,rho.13,rho.12,1,rho.23,rho.13,rho.23,1),3,3)controls <- rmvnorm(n0, mean=rep(0,3), sigma=sigma.controls)
12 compareROCindep
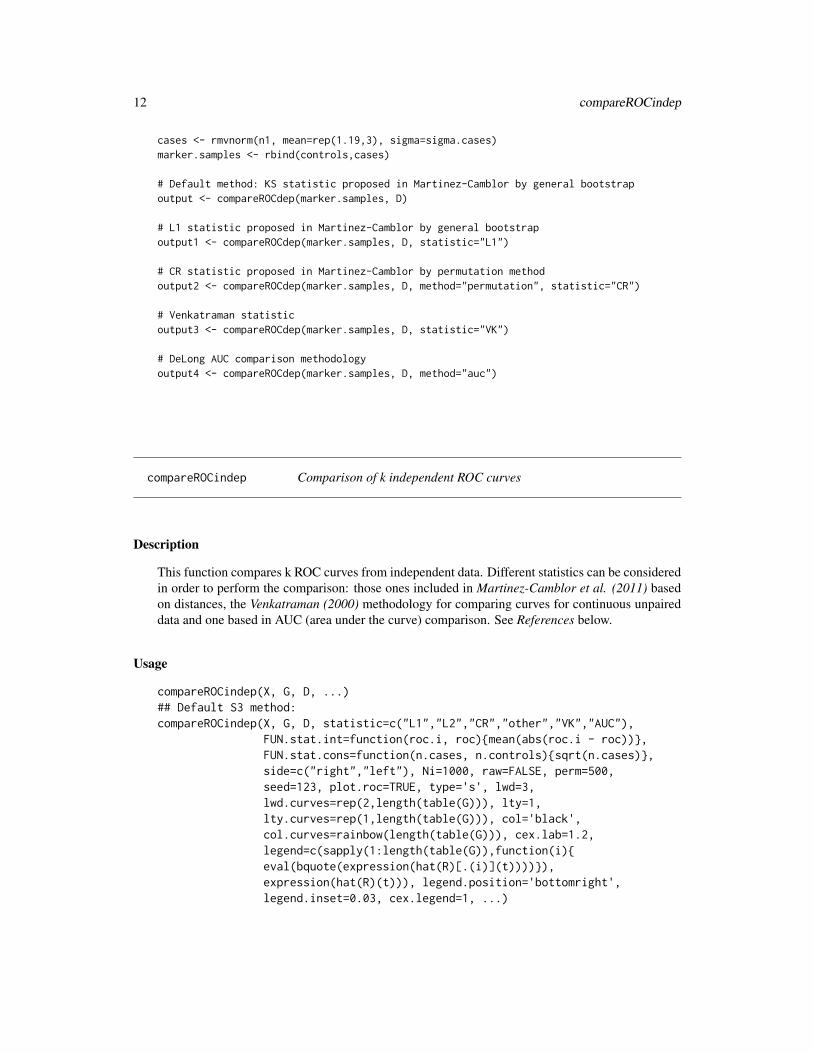
cases <- rmvnorm(n1, mean=rep(1.19,3), sigma=sigma.cases)marker.samples <- rbind(controls,cases)
# Default method: KS statistic proposed in Martinez-Camblor by general bootstrapoutput <- compareROCdep(marker.samples, D)
# L1 statistic proposed in Martinez-Camblor by general bootstrapoutput1 <- compareROCdep(marker.samples, D, statistic="L1")
# CR statistic proposed in Martinez-Camblor by permutation methodoutput2 <- compareROCdep(marker.samples, D, method="permutation", statistic="CR")
# Venkatraman statisticoutput3 <- compareROCdep(marker.samples, D, statistic="VK")
# DeLong AUC comparison methodologyoutput4 <- compareROCdep(marker.samples, D, method="auc")
compareROCindep Comparison of k independent ROC curves
Description
This function compares k ROC curves from independent data. Different statistics can be consideredin order to perform the comparison: those ones included in Martinez-Camblor et al. (2011) basedon distances, the Venkatraman (2000) methodology for comparing curves for continuous unpaireddata and one based in AUC (area under the curve) comparison. See References below.
Usage
compareROCindep(X, G, D, ...)## Default S3 method:compareROCindep(X, G, D, statistic=c("L1","L2","CR","other","VK","AUC"),
FUN.stat.int=function(roc.i, roc){mean(abs(roc.i - roc))},FUN.stat.cons=function(n.cases, n.controls){sqrt(n.cases)},side=c("right","left"), Ni=1000, raw=FALSE, perm=500,seed=123, plot.roc=TRUE, type='s', lwd=3,lwd.curves=rep(2,length(table(G))), lty=1,lty.curves=rep(1,length(table(G))), col='black',col.curves=rainbow(length(table(G))), cex.lab=1.2,legend=c(sapply(1:length(table(G)),function(i){eval(bquote(expression(hat(R)[.(i)](t))))}),expression(hat(R)(t))), legend.position='bottomright',legend.inset=0.03, cex.legend=1, ...)
compareROCindep 13
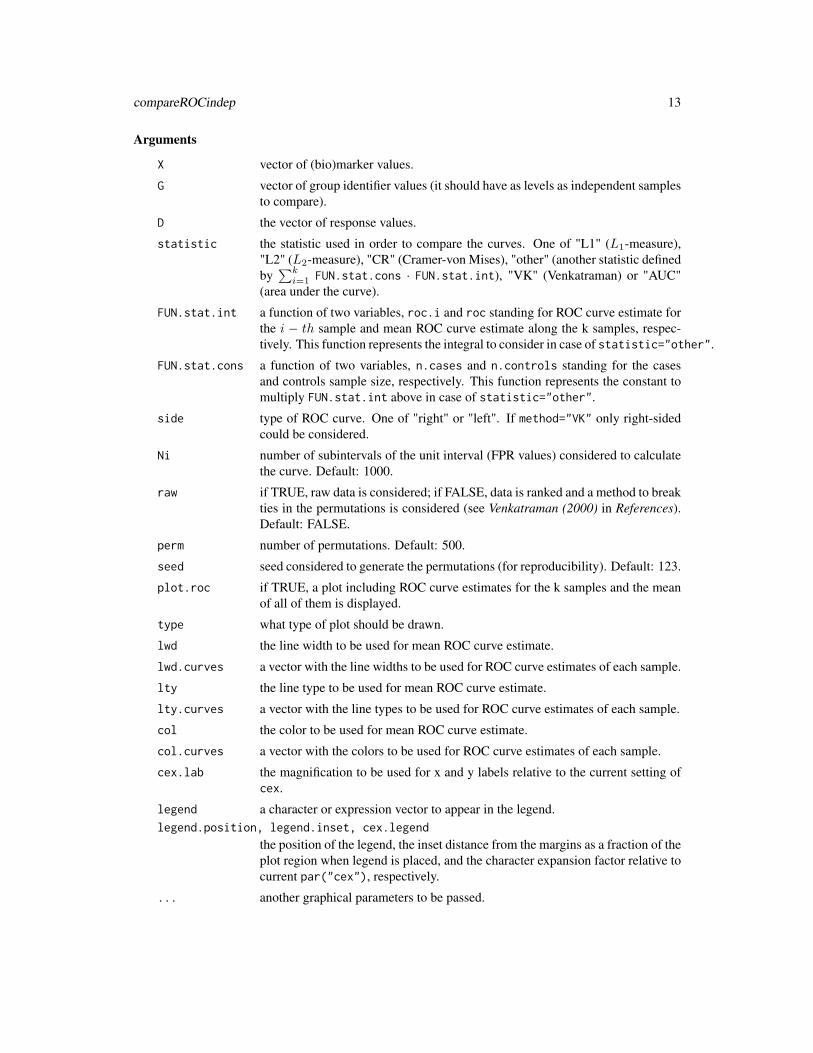
Arguments
X vector of (bio)marker values.
G vector of group identifier values (it should have as levels as independent samplesto compare).
D the vector of response values.
statistic the statistic used in order to compare the curves. One of "L1" (L1-measure),"L2" (L2-measure), "CR" (Cramer-von Mises), "other" (another statistic definedby∑ki=1 FUN.stat.cons · FUN.stat.int), "VK" (Venkatraman) or "AUC"
(area under the curve).
FUN.stat.int a function of two variables, roc.i and roc standing for ROC curve estimate forthe i − th sample and mean ROC curve estimate along the k samples, respec-tively. This function represents the integral to consider in case of statistic="other".
FUN.stat.cons a function of two variables, n.cases and n.controls standing for the casesand controls sample size, respectively. This function represents the constant tomultiply FUN.stat.int above in case of statistic="other".
side type of ROC curve. One of "right" or "left". If method="VK" only right-sidedcould be considered.
Ni number of subintervals of the unit interval (FPR values) considered to calculatethe curve. Default: 1000.
raw if TRUE, raw data is considered; if FALSE, data is ranked and a method to breakties in the permutations is considered (see Venkatraman (2000) in References).Default: FALSE.
perm number of permutations. Default: 500.
seed seed considered to generate the permutations (for reproducibility). Default: 123.
plot.roc if TRUE, a plot including ROC curve estimates for the k samples and the meanof all of them is displayed.
type what type of plot should be drawn.
lwd the line width to be used for mean ROC curve estimate.
lwd.curves a vector with the line widths to be used for ROC curve estimates of each sample.
lty the line type to be used for mean ROC curve estimate.
lty.curves a vector with the line types to be used for ROC curve estimates of each sample.
col the color to be used for mean ROC curve estimate.
col.curves a vector with the colors to be used for ROC curve estimates of each sample.
cex.lab the magnification to be used for x and y labels relative to the current setting ofcex.
legend a character or expression vector to appear in the legend.legend.position, legend.inset, cex.legend
the position of the legend, the inset distance from the margins as a fraction of theplot region when legend is placed, and the character expansion factor relative tocurrent par("cex"), respectively.
... another graphical parameters to be passed.
14 compareROCindep
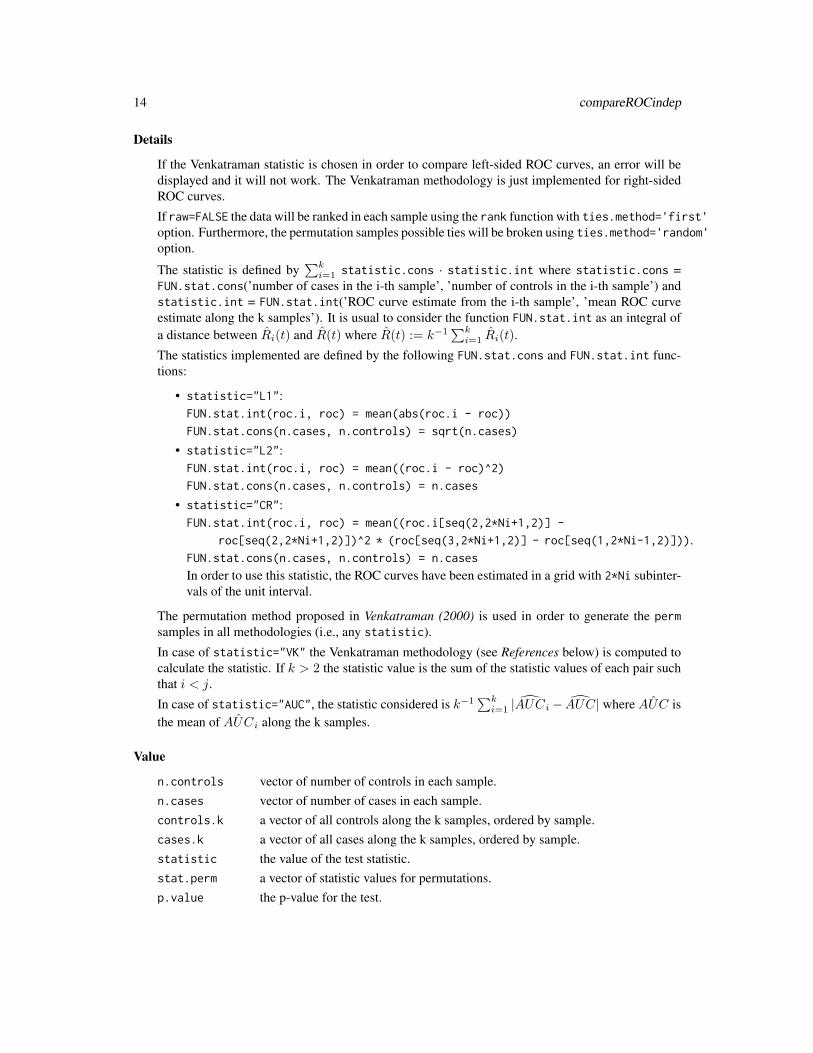
Details
If the Venkatraman statistic is chosen in order to compare left-sided ROC curves, an error will bedisplayed and it will not work. The Venkatraman methodology is just implemented for right-sidedROC curves.
If raw=FALSE the data will be ranked in each sample using the rank function with ties.method='first'option. Furthermore, the permutation samples possible ties will be broken using ties.method='random'option.
The statistic is defined by∑ki=1 statistic.cons · statistic.int where statistic.cons =
FUN.stat.cons(’number of cases in the i-th sample’, ’number of controls in the i-th sample’) andstatistic.int = FUN.stat.int(’ROC curve estimate from the i-th sample’, ’mean ROC curveestimate along the k samples’). It is usual to consider the function FUN.stat.int as an integral ofa distance between Ri(t) and R(t) where R(t) := k−1
∑ki=1 Ri(t).
The statistics implemented are defined by the following FUN.stat.cons and FUN.stat.int func-tions:
• statistic="L1":FUN.stat.int(roc.i, roc) = mean(abs(roc.i - roc))
FUN.stat.cons(n.cases, n.controls) = sqrt(n.cases)
• statistic="L2":FUN.stat.int(roc.i, roc) = mean((roc.i - roc)^2)
FUN.stat.cons(n.cases, n.controls) = n.cases
• statistic="CR":FUN.stat.int(roc.i, roc) = mean((roc.i[seq(2,2*Ni+1,2)] -
roc[seq(2,2*Ni+1,2)])^2 * (roc[seq(3,2*Ni+1,2)] - roc[seq(1,2*Ni-1,2)])).FUN.stat.cons(n.cases, n.controls) = n.cases
In order to use this statistic, the ROC curves have been estimated in a grid with 2*Ni subinter-vals of the unit interval.
The permutation method proposed in Venkatraman (2000) is used in order to generate the permsamples in all methodologies (i.e., any statistic).
In case of statistic="VK" the Venkatraman methodology (see References below) is computed tocalculate the statistic. If k > 2 the statistic value is the sum of the statistic values of each pair suchthat i < j.
In case of statistic="AUC", the statistic considered is k−1∑ki=1 |AUCi− AUC| where ˆAUC is
the mean of ˆAUCi along the k samples.
Value
n.controls vector of number of controls in each sample.n.cases vector of number of cases in each sample.controls.k a vector of all controls along the k samples, ordered by sample.cases.k a vector of all cases along the k samples, ordered by sample.statistic the value of the test statistic.stat.perm a vector of statistic values for permutations.p.value the p-value for the test.
gROC 15
References
Venkatraman E.S., 2000, A permutation test to compare receiver operating characteristic curves,Biometrics, 56, 1134-1138.
Martinez-Camblor P., Carleos C., Corral N., 2011, Powerful nonparametric statistics to compare kindependent ROC curves, Journal of Applied Statistics, 38(7), 1317-1332.
Examples
set.seed(123)X1 <- c(rnorm(45), rnorm(30,2,1.5))D1 <- c(rep(0,45), rep(1,30))X2 <- c(rnorm(45), rnorm(38,3,1.5))D2 <- c(rep(0,45), rep(1,38))X3 <- c(rnorm(30), rnorm(42,3,1))D3 <- c(rep(0,30), rep(1,42))X <- c(X1, X2, X3)D <- c(D1, D2, D3)G <- c(rep(1,75), rep(2,83), rep(3,72))
# Default method: L1 statistic proposed in Martinez-Cambloroutput <- compareROCindep(X, G, D)
# Venkatraman statisticoutput1 <- compareROCindep(X, G, D, statistic="VK")
# DeLong AUC comparison methodologyoutput2 <- compareROCindep(X, G, D, statistic="AUC")
gROC ROC curve estimation (generalization included)
Description
This function estimates the Receiver Operating Characteristic curve and returns a ’groc’ object.This object can be printed or plotted. It is the main function of the package and it includes theROC curve generalization for non-monotone relationships (see References below).
Usage
gROC(X, D, ...)## Default S3 method:gROC(X, D, side=c("auto","right","left","both"), Ni=1000,
plot.roc=FALSE, plot.density=FALSE, ...)
16 gROC
Arguments
X vector of (bio)marker values.
D vector of response values.
side type of ROC curve. One of "auto", "right", "left" or "both". If the user does notspecify the method "auto" is considered, hence one of "right" or "left" is assignedautomatically according to the Wilcoxon statistic. If the estimate is lower thannumber of controls×number of cases
2 , the right-sided ROC curve is computed, oth-erwise the left one is considered.
Ni number of subintervals of the unit interval (FPR values) considered to calculatethe curve. Default: 1000.
plot.roc if TRUE, ROC curve estimate considered is displayed.
plot.density if TRUE, density estimates for the (bio)marker in the positive and negative sub-jects are displayed in the same plot.
... additional arguments for gROC. Ignored.
Details
First of all, the data introduced is checked by the ROCcheck function.
If side is not specified, one of "right" or "left" options is considered according to the comparison ofthe Wilcoxon test estimate and number of controls×number of cases
2 . In this case, Wilcoxon rank testis performed in order to test the alternative hypothesis median(controls) < median(cases) andthe resulting p-value is shown but side selection is just based in the aforementioned comparison,without taking into account the p-value of the test.
The general ROC curve, Rg(.) is estimated using {0, 1e-3, 2e-3, ..., 1} as a grid for γ in the unitinterval.
If both plot.density and plot.roc are TRUE they are displayed in the same window.
Value
A list of class "groc" with the following content:
levels levels in D. The two first ones are the labels of D considered controls and cases,respectively.
controls marker values for controls.
cases marker values for cases.
side direction of the comparison between controls and cases. One of "right", "left" or"both". If side is not specified (or it is auto) in input arguments, the output willbe the one considered by the function (according to the comparison specifiedabove).
pvalue.wilcox p-value of Wilcoxon test performed to compare cases and controls. Alternativehypothesis: median(controls) < median(cases).
points vector of cut-off points of the (bio)marker considered to estimate left or right-sided ROC curves. It corresponds to the sorted marker-values, including −∞and∞.
gROC 17
pairpoints matrix whose rows correspond to each pair of cut-off points (xl,xu) such thatxl<xu of the (bio)marker considered to estimate general ROC curves.
specificities vector of specificities associated to points if left or right-sided ROC curves areconsidered and those ones corresponding to pairpoints in case of general ROCcurves. It could contain repeated values in both cases.
sensitivities vector of sensitivities associated to points if left or right-sided ROC curves areconsidered and those ones corresponding to pairpoints in case of general ROCcurves. It could contain repeated values in both cases.
coordinates matrix whose first column is constituted by the unique values of FPR (1-specificities)and its second column is formed by the corresponding values of TPR (sensitivities).In the case of general ROC curves, several TPR values could be associated withthe same FPR value.
points.coordinates
coordinates of the points (FPR, TPR) where the ROC curve estimate has a stepin case of right or left-sided curves. The first column corresponds to the valuesof the points vector providing these coordinates.
pairpoints.coordinates
coordinates of the points (FPR, TPR) where the ROC curve estimate has a stepin case of general curves. The first and second columns correspond to the valuesof the pairpoints matrix providing these coordinates.
index in general ROC curves, a vector displaying which row(s) of the pairpointsmatrix correspond(s) to pairpoints.coordinates.
area area under the ROC curve estimate by trapezoidal rule.
Ni number of subintervals of the unit interval considered to build the curve.
ROC.t vector of values of R(t) for each t ∈ {0, 1/Ni, 2/Ni, ..., 1}.
References
Martinez-Camblor P., Corral N., Rey C., Pascual J., Cernuda-Morollon E., 2014, ROC curve gener-alization for non-monotone relationships, Statistical Methods in Medical Research, 26(1), 113-123.
Examples
# Basic example (side="auto") -> Output side is "right"set.seed(123)X <- c(rnorm(45), rnorm(30,2,1.5))D <- c(rep(0,45), rep(1,30))gROC(X,D)
# Basic example (side="auto") -> Output side is "left"X <- c(rnorm(45), rnorm(30,-2,1.5))D <- c(rep(0,45), rep(1,30))gROC(X,D)
# General ROC curve exampleX <- c(rnorm(45), rnorm(30,1,4))D <- c(rep(0,45), rep(1,30))gROC(X, D, side="both")
18 interleukin6
# Plot density estimates and ROC curve in the same plotX <- c(rnorm(45), rnorm(30,2,1.5))D <- c(rep(0,45), rep(1,30))gROC(X, D, plot.roc=TRUE, plot.density=TRUE)
interleukin6 Interleukin 6 (IL6) data
Description
This dataset includes the true-positives (TP), false-positives (FP), true-negatives (TN) and false-negatives (FN) reported by 9 different papers which study the use of the Interleukin 6 (IL6) as amarker for the early detection of neonatal sepsis.
Usage
interleukin6
Format
A data frame with 19 observations of the following 5 variables.
Author a vector assigning different numbers to each paper
TP vector of true positives
FP vector of false positives
FN vector of false negatives
TN vector of true negatives
Details
In those papers providing more than one pair of Sensitivity-Specificity all of them are collected.
References
Martinez-Camblor P., 2017, Fully non-parametric receiver operating characteristic curve estimationfor random-effects meta-analysis, Statistical Methods in Medical Research, 26(1), 5-20.
Examples
# Load the datasetdata(interleukin6)
# Plot pairs (FPR, TPR) for each Author
attach(interleukin6)
TPR <- TP/(TP+FN)
metaROC 19
FPR <- FP/(FP+TN)plot(FPR, TPR, xlim=c(0,1), ylim=c(0,1), lwd=10, pch=1, col='gray', xlab="False-Positive Rate",
ylab="True-Positive Rate", main=paste("ROC curve interpolation"))
S <- unique(Author)ind <- order(Author, FPR, TPR)ord.data <- cbind(Author[ind], FPR[ind], TPR[ind])roc.j <- sapply(S, function(j){
lines(c(0,ord.data[Author==j,2],1), c(0,ord.data[Author==j,3],1), col='gray')})for(i in 1:19){text(ord.data[i,2],ord.data[i,3],ord.data[i,1],cex=0.5)}
metaROC Non-parametric ROC curve estimate for meta-analysis
Description
This function performs meta-analytic studies of diagnostic tests for both the fixed and random-effects models. In particular it reports a fully non-parametric ROC curve estimate when data comefrom a meta-analysis study using the information of all cut-off points available in the selectedoriginal studies. The approach considered is the one proposed by Martinez-Camblor et al. (2017)based on weighting each individual interpolated ROC curve. See References below.
Usage
metaROC(data, ...)## Default S3 method:metaROC(data, Ni=1000, model=c("fixed-effects","random-effects"),
plot.Author=FALSE, plot.bands=TRUE, plot.inter.var=FALSE,cex.Author=0.7, lwd.Author=12, col.curve='blue',col.bands='light blue', alpha.trans=0.5, col.border='blue', ...)
Arguments
data a data frame containing at least the following variables (with these names):
• Author: a vector assigning different numbers to each paper/author.• TP: true positives.• FP: false positives.• TN: true negatives.• FN: false negatives.
Ni number of points of the unit interval (FPR values) considered to calculate thecurve. Default: 1000.
model the meta-analysis model used to estimate the ROC curve. One of "fixed-effects"(it only considers the within-study variability) or "random-effects" (it takes intoaccount the variability between the studies).
plot.Author if TRUE, a plot including ROC curve estimates (by linear interpolation) for eachpaper under study is displayed.
20 metaROC
plot.bands if TRUE, confidence interval estimate for the curve is added to the plot of theROC curve estimate.
plot.inter.var if TRUE, a plot including inter-study variability estimate is displayed on an ad-ditional window.
cex.Author the magnification to be used to display the paper/author points labels relative tothe current setting of cex.
lwd.Author the size to be used for the paper/author points.
col.curve the color to be used for the (summary) ROC curve estimate. Default: blue.
col.bands the color to be used for the confidence interval of ROC curve estimate. Default:light blue.
alpha.trans proportion of opacity to be used for the confidence interval of ROC curve esti-mate. A number in the unit interval where 0 means transparent. Default: 0.5.
col.border the color to be used for the border of confidence interval of ROC curve estimate.Default: blue.
... another graphical parameters to be passed.
Details
The slight modification considered to ensure the monotonicity of the summary ROC curve estimateis the following sRA(t) = max(supz∈[0,t]sRA(z), RA(t)).
Some basic information about the model used and the results obtained are printed.
Value
data the data-frame considered ordered by Author-FPR-TPR and including the fol-lowing variables:
• n: positive subjects sample size.• m: negative subjects sample size.• FPR: false positive rate.• TPR: true positive rate.
t values of the unit interval (FPR values) considered to calculate the curve.
model the meta-analysis model used to estimate the ROC curve. One of "fixed-effects"(it only considers the within-study variability) or "random-effects" (it takes intoaccount the variability between the studies).
sRA non-parametric summary ROC curve estimate following the model consideredwith a slight modification to ensure the monotonicity. This is the one reportedin graphics.
RA non-parametric summary ROC curve estimate following the model without mod-ifications.
se.RA standard-error of summary ROC curve estimate.
area area under the summary ROC curve estimate by trapezoidal rule.
youden.index the optimal specificity and sensitivity (in the Youden index sense).
plot 21
roc.j a matrix whose column j contains the estimated ROC curve for the j-th study ineach point t considered.
w.j a matrix whose column j contains the weights in fixed-effects model for the j-thstudy in each point t considered.
w.j.rem a matrix whose column j contains the weights in random-effects model for thej-th study in each point t considered.
inter.var inter-study variability estimate in each point t considered. Only computed ifmodel is "random-effects".
References
Martinez-Camblor P., 2017, Fully non-parametric receiver operating characteristic curve estimationfor random-effects meta-analysis, Statistical Methods in Medical Research, 26(1), 5-20.
Examples
data(interleukin6)
# Fixed-effects meta-analysis showing linear interpolations of the papers considered in the graphicoutput1 <- metaROC(interleukin6, plot.Author=TRUE)
# Random-effects meta-analysis displaying also a window with a plot of the inter-study# variability estimateoutput2 <- metaROC(interleukin6, model="random-effects", plot.Author=TRUE)
plot Plot an ROC curve object
Description
This function plots a ’groc’, ’rocbands’ or ’cdroc’ object.
Usage
## S3 method for class 'groc'plot(x, type='s', lwd=2, xlab="False-Positive Rate",
ylab="True-Positive Rate", main="ROC curve", ...)## S3 method for class 'rocbands'plot(x, type='s', lwd=2, xlim=c(0,1), ylim=c(0,1),
xlab="False-Positive Rate", ylab="True-Positive Rate",main=paste("ROC curve \n (", obj$method, " confidence bands)", sep=""),col='aquamarine3', col.inside="azure2", col.frontier="azure3",lwd.frontier=2, ...)
## S3 method for class 'cdroc'plot(x, type='s', lwd=3, xlab='1 - Specificity',
ylab='Sensitivity', xaxs='i', yaxs='i',main=paste("ROC curve at time", obj$predict.time), ...)
22 plot
Arguments
x a ’groc’, ’rocbands’ or ’cdroc’ object from the gROC, ROCbands or cdROC respec-tively.
type what type of plot should be drawn.
lwd the line width to be used for ROC curve estimate, a positive number. See par.
col the color to be used for ROC curve estimate. See par.
lwd.frontier the line width to be used for ROC curve confidence bands estimate.col.inside, col.frontier
the color to be used for ROC curve confidence bands estimate (col.frontier)and for the area inside (col.inside).
xlim, ylim numeric vectors of length 2, giving the x and y coordinates ranges. See plot.window.
xlab, ylab a title for the x and y axis, respectively. See title.
xaxs, yaxs the style of axis interval calculation to be used for the x and y axis, respectively.See par.
main an overall title for the plot. See title.
... further arguments to be passed to methods, such as graphical parameters. Seepar.
Value
These functions return a plot of the object they were passed.
Examples
# Data generationset.seed(123)X <- c(rnorm(45), rnorm(30,2,1.5))D <- c(rep(0,45), rep(1,30))
# Plot an ROC curvegrocobj <- gROC(X,D)plot(grocobj)
# Plot ROC curve confidence bandsrocbandsobj <- ROCbands(grocobj)plot(rocbandsobj)
# Plot cumulative/dynamic ROC curveset.seed(123)stime <- rchisq(50,3)status <- sample(c(rep(1,40), rep(0,10)))marker <- max(stime) - stime + rnorm(50,0,2)cdrocobj <- cdROC(stime, status, marker, 2.8, ci=TRUE)plot(cdrocobj)
print 23
print Print an ROC curve object
Description
This function prints a ’groc’, ’rocbands’ or ’cdroc’ object.
Usage
## S3 method for class 'groc'print(x, ...)## S3 method for class 'rocbands'print(x, ...)## S3 method for class 'cdroc'print(x, ...)
Arguments
x a ’groc’, ’rocbands’ or ’cdroc’ object from the gROC, ROCbands or cdROC respec-tively.
... further arguments to be passed to other methods. Ignored.
Value
These functions return information about the object they were passed.
See Also
gROC, ROCbands, cdROC
Examples
# Data generationset.seed(123)X <- c(rnorm(45), rnorm(30,2,1.5))D <- c(rep(0,45), rep(1,30))
# Print a groc objectgrocobj <- gROC(X,D)print(grocobj)
# Print an rocbands objectgrocobj <- ROCbands(grocobj)print(grocobj)
# Print a cdroc objectset.seed(123)stime <- rchisq(50,3)status <- sample(c(rep(1,45), rep(0,5)))
24 ROCbands
marker <- max(stime) - stime + rnorm(50,0,2)cdrocobj <- cdROC(stime, status, marker, 3, ci=TRUE)print(cdrocobj)
ROCbands Confidence bands for ROC curves
Description
This function computes and plots confidence bands for ROC curves (both left/right-sided and gen-eral one) using three different procedures. Particularly, one parametric approach assuming thebinormal model (Demidenko) and two non-parametric techniques (Jensen et al. and Martinez-Camblor et al.). See References below.
Usage
ROCbands(groc, ...)## Default S3 method:ROCbands(groc, method=c("PSN","JMS","DEK"), conf.level=0.95, B=500,
bootstrap.bar=TRUE, alpha1=NULL, s=1, a.J=1/1000, b.J=1-1/1000,plot.bands=FALSE, plot.var=FALSE, ...)
Arguments
groc a ’groc’ object from the gROC function.
method method used to compute the confidence bands. One of "PSN" (Martinez-Cambloret al.), "JMS" (Jensen et al.) or "DEK" (Demidenko).
conf.level the width of the confidence band as a number in (0,1). Default: 0.95, resultingin a 95% confidence band.
B number of bootstrap replicates. Default: 500 (only used in "PSN" and "JMS"methods).
bootstrap.bar if TRUE, a bar showing bootstrap replication progress is displayed.
alpha1 α1 in "PSN" approach a number in (0,1) affecting the width between the lowerband and the ROC curve estimate. Default: NULL, the one which minimizesthe theoretical area between lower and upper bands is considered.
s scale parameter used to compute the smoothed kernel distribution functions in"PSN" method. The bandwidth h = s ·min(m,n)1/5 · σ where m and n standby the number of controls and cases, respectively, is considered. Default: 1.
a.J, b.J extremes of interval in (0,1) in which compute the regional confidence bands by"JMS" methodology. Default: (0.001, 0.999).
plot.bands if TRUE, confidence bands at level conf.level are displayed.
plot.var if TRUE, a plot of σ∗,1n (t) with t in [0,1] (if "PSN" method is selected) orV ar(Ψ(p)) with p in (a.J, b.J) (if "JMS" method is selected) is displayed.
... additional arguments for ROCbands. Ignored.
ROCbands 25
Details
• Martinez-Camblor et al. methodology - "PSN" methodThe theoretical.area is computed as (cα1
− cα2)n−1/2
∫σ∗n(t)dt where σ∗n(t) is the stan-
dard deviation estimate of√n[R(ω, .)−R(.)] and n is the cases sample size.
Due to computation can take some time depending on the number of bootstrap replicatesconsidered, a progress bar is shown.Confidence bands are truncated in the following way: on one hand, if the lower band is lowerthan 0 or higher than 0.95 it is forced to be 0 or 0.95, respectively; on the other hand, if theupper band is higher than 1 or lower than 0.05 it is forced to be 1 or 0.05, respectively.
• Jensen et al. methodology - "JMS" method
Kαa,b denote the upper α/2-quantile of the distribution of supa≤p≤b
|Ψ(p)|√V arΨ(p)
where (a, b)
is the interval in which the regional confidence bands are calculated and Ψ(.) is the limitingprocess of the stochastic process ∆N =
√N [R(ω, .) − R(.)] with N being the total sample
size.Extremes of the interval (a.J, b.J) used in order to display the regional confidence bandsmust be divisors of Ni in the interval [0, 1].Confidence bands are truncated in a similar way as in "PSN" method in order not to havebands lower than 0 or higher than 1.
• Demidenko methodology - "DEK" methodDemidenko ROC curve estimate does not correspond to the empirical one due to the fact thatthe (bio)marker values in controls and cases are supposed to come from a normal distributionis exploited.
Value
A list of class ’rocbands’ with the following content:
method method used to compute the confidence bands. One of "PSN" (Martinez-Cambloret al.), "JMS" (Jensen et al.) or "DEK" (Demidenko).
conf.level the width of the confidence band as a number in (0,1).
B number of bootstrap replicates used in "PSN" and "JMS" methods.
L, U vectors containing the values of lower and upper bands, respectively, for eacht ∈ {0, 1/Ni, 2/Ni, ..., 1}. In case of "JMS" method p is considered as t.
practical.area
area between lower and upper bands (L and U) computed by trapezoidal rule.
Ni number of subintervals of the unit interval considered to build the curve.
ROC.t vector of values of R(t) for each t ∈ {0, 1/Ni, 2/Ni, ..., 1}.
If the method is "PSN":
s scale parameter used to compute the smoothed kernel distribution functions.alpha1, alpha2
if the alpha1 input argument is not specified, α1 and α2 values which minimizearea between bands are automatically computed. If alpha1 is chosen by theuser, alpha2 is computed by alpha1 = (1 - conf.level) - alpha1.
26 ROCbands
fixed.alpha1 if TRUE, alpha1 has been fixed by the user.
c1, c2 cα1and cα2
resulting from the algorithm to compute confidence bands.
ROC.B matrix of size Ni+1, B whose columns contain the ROC curve estimate for eachbootstrap sample.
sd.PSN vector σ∗n(t) which is the estimate of the standard deviation of the empiricalprocess considered.
theoretical.area
theoretical area between confidence bands by trapezoidal rule.
If the method is "JMS":
a.J, b.J extremes of the interval in which the regional confidence bands have been com-puted.
p vector of FPR points considered in the interval (a.J, b.J).
smoothROC.p smooth ROC curve estimate for each value of p.
K.alpha value of Kαa,b computed to calculate confidence bands (see Details above).
var.JMS value of V ar(Ψ(p)) estimated from the formula given by Hsieh and Turnbull(see Jensen et al. in References).
If the method is "DEK":
DEK.fpr, DEK.tpr
values of FPR and TPR computed to calculate the Demidenko confidence bandstaking into account that it is a binormal technique.
Note
Brownian bridges needed to estimate Ψ(.) in "JMS" method are computed using the BBridge func-tion in the sde package.
It should be noted that both the "PSN" and "JMS" methods are non-parametric, while the "DEK"approach is designed assuming the binormal model, so it is not convenient to use this method whendistribution assumptions are not fulfilled. Furthermore, both the "JMS" and "DEK" methodologiesare implemented just for the right-sided ROC curve. If side is left or both only the "PSN" methodprovides confidence bands.
References
Martinez-Camblor P., Perez-Fernandez S., Corral N., 2016, Efficient nonparametric confidencebands for receiver operating-characteristic curves, Statistical Methods in Medical Research, DOI:10.1177/0962280216672490.
Jensen K., Muller H-H., Schafer H., 2000, Regional confidence bands for ROC curves, Statisticalin Medicine, 19, 493-509.
Demidenko E., 2012, Confidence intervals and bands for the binormal ROC curve, Journal of Ap-plied Statistics, 39(1), 67-79.
ROCbands 27
Examples
# Basic exampleset.seed(123)X <- c(rnorm(45), rnorm(30,2,1.5))D <- c(rep(0,45), rep(1,30))groc.obj <- gROC(X,D)
# PSN confidence bands with conf.level=0.95ROCbands(groc.obj)# Plot standard deviation estimate of the curve and confidence bands in the same windowROCbands(groc.obj, plot.bands=TRUE, plot.var=TRUE)# PSN confidence bands with alpha1 fixed (alpha1=0.025)ROCbands(groc.obj, alpha1=0.025)
# JMS confidence bands in (0.2,0.7) intervalROCbands(groc.obj, method="JMS", a.J=0.2, b.J=0.7)# Plot variance estimate of the curve and confidence bands in the same windowROCbands(groc.obj, method="JMS", a.J=0.2, b.J=0.7, plot.bands=TRUE, plot.var=TRUE)
# DEK confidence bands with conf.level=0.99ROCbands(groc.obj, method="DEK", conf.level=0.99)
Index
∗Topic comparisoncompareROCdep, 8compareROCindep, 12
∗Topic confidenceROCbands, 24
∗Topic datasetsinterleukin6, 18
∗Topic generalROCgROC, 15
∗Topic meta-analysismetaROC, 19
∗Topic packagensROC-package, 2
∗Topic plotplot, 21
∗Topic printprint, 23
∗Topic time-dependentcdROC, 4
cdROC, 2, 3, 4, 23checkROC, 3, 7compareROCdep, 2, 3, 8compareROCindep, 2, 3, 12
gROC, 2, 3, 15, 23
interleukin6, 3, 18
metaROC, 2, 3, 19
nsROC (nsROC-package), 2nsROC-package, 2
par, 22plot, 3, 21print, 3, 23
ROCbands, 2, 3, 23, 24
28