packet reordering measurement and simulation simulation on ipg, packet delay and packet reordering,
TRANSCRIPT

Measurement & Evaluation of Packet Reordering Over Internet
Advisor: Professor Anura P. JayasumanaBin YeECE
Colorado State University Nov. 3rd 2006

Outline
2
• Introduction • Contribution• Part I – Measurement of Packet Reordering over Internet • Part II – Cascade of n Similar Subnet Problem• Part III – Packet Reordering & Packet Delay• Summary

Outline
3
• Introduction • Contribution• Part I – Measurement of Packet Reordering over Internet • Part II – Cascade of n Similar Subnet Problem• Part III – Packet Reordering & Packet Delay• Summary

Internet
4
• Big• Heterogeneity• Time-varying Behavior

Internet is still growing !
5
• Internet traffic growth • Internet hosts growth
Trend Doubling period
Semiconductor performance
18 months(Moore’s law)
Internet traffic(1969-1982)
21 months
Internet traffic (1983-1997)
9 months
Internet traffic (1997 -2008)
6 months

Packet Reordering
6
• Packet send in order do not reach the receiver in order
NETWORKNETWORK10,9,8,7,6,5,4,3,2,1 10,9,5,8,7,6,2,4,3,1
Sender Host
NETWORKNETWORK10,9,8,7,6,5,4,3,2,1 10,9,5,8,7,6,2,4,3,1
Sender Host Receiver Host

Effect of Reordering
7
• Affects TCP performance– Forces TCP into false retransmissions– That reduces the congestion window size– That reduces the bandwidth utilization
• Affects UDP application performance– Applications have to re-sequence packets– Affects performance of real-time applications such as
IP telephony and live streaming video

Causes of Packet Reordering
8
• Parallel processing• Multi-path routing • Diffserv Scheduling• Mobile Ad-hoc network

Reorder Density
9
(m + dm)Arrival 1 2 4 5 3 7 6
Receive_index 1 2 3 4 5 6 7
Packet Reordering:
Displacement (dm)
0 0 -1 -1 2 -1 1
m
• Reorder Event r(m, dm): If the receive_index assigned to packet m is (m+dm), with dm ≠ 0 then a reordered event r(m, dm) has occurred
• Earliness/Lateness: A packet is late if dm > 0, and early if dm < 0

Reorder Density – (2)
10
• Packet Reordering: Packet reordering is completely represented by the union of reorder events,
• For the above sequence R = {(3, 2), (4, -1), (5, -1), (6, 1), (7, -1)}
• DT : A threshold on the displacement of packets that allows the metric (RD) to classify a packet as lost or duplicate.
{ ( , ) | 0}m mm
R r m d d= ≠U

Reorder Density – (3)
11
[ ] { ( , ) | }m mS k r m d d k= =
• Let S[k] be a subset of R s.t.
• Then
RD [k] = |S[k]| / N' for k ≠ 0• Where N' is the total non-duplicate packets received and
|S[k]| is cardinality of set S[k].
RD[0] = 1 -k 0
|S[k]|/N'≠∑
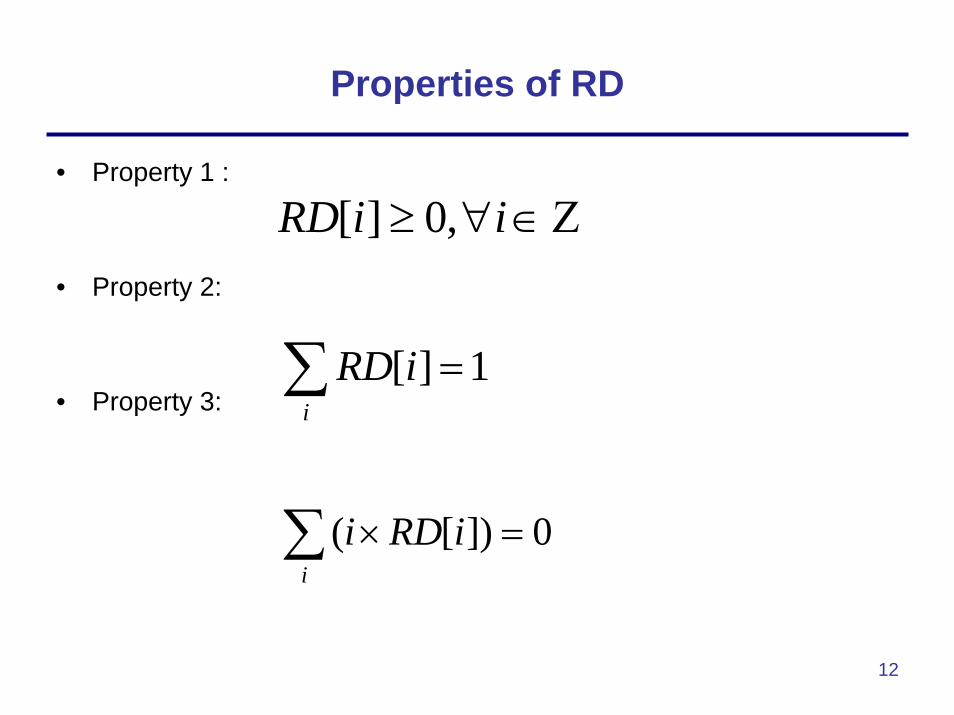
Properties of RD
12
• Property 1 :
• Property 2:
• Property 3:
Ζ∈∀≥ iiRD ,0][
[ ] 1i
RD i =∑
( [ ]) 0i
i RD i× =∑

Outline
13
• Introduction • Contribution• Part I – Measurement of Packet Reordering over Internet • Part II – Cascade of n Similar Subnet Problem• Part III – Packet Reordering & Packet Delay• Summary

Contribution
14
• New singleton packet reordering metrics– PL and PE– MD, ML and ME– ER
• Measurement of packet reordering over Internet for 336 hours• Give the general expression of RD on CNSS problem• Provide the estimation of ER on CNSS problem• Simulation study on the relation between end-to-end packet
delay, end-to-end packet reordering and Inter Packet Gap• Related Publications
– B. Ye, A. P. Jayasumana and N. M. Piratla, "On End-to-End Monitoring of Packet Reordering over the Internet," Proc. International Conference on Networking and Services (ICNS 2006), Silicon Valley, USA, Jul. 2006 (BibTex).

Outline
15
• Introduction • Contribution• Part I – Measurement of Packet Reordering over Internet• Part II – Cascade of n Similar Subnet Problem• Part III – Packet Reordering & Packet Delay• Summary

Why we need more metrics?
16
• Long time period observation, capture the variation of packet reordering
• Different angle• Bridge to an existing theory

Singleton Metrics (1)
17
• Percentage of Late Packets (PL)
• Percentage of Early Packets (PE)
1[ ]
Ti D
Li
P RD i=
=+
= ∑
1
[ ]T
i
Ei D
P RD i=−
=−
= ∑
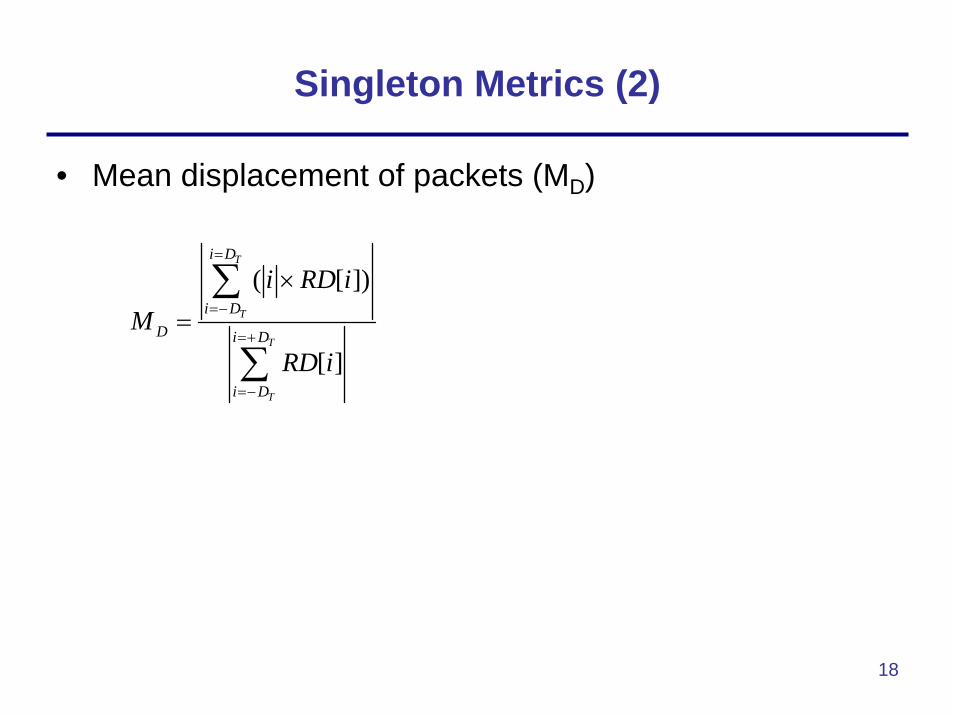
Singleton Metrics (2)
18
• Mean displacement of packets (MD)
( [ ])
[ ]
T
T
T
T
i D
i DD i D
i D
i RD iM
RD i
=
=−
=+
=−
×
=∑
∑

Singleton Metrics (3)
19
• Mean displacement of late packets (ML)
• Mean displacement of early packets (ME)
1
1
( [ ])
[ ]
T
T
i D
iL i D
i
i RD iM
RD i
=+
=
=+
=
⎡ ⎤×⎢ ⎥
⎣ ⎦=⎡ ⎤⎢ ⎥⎣ ⎦
∑
∑
1
1
[ ]
[ ]
T
T
i
i DE i
i D
i RD iM
RD i
=−
=−
=−
=−
⎡ ⎤×⎢ ⎥
⎣ ⎦=⎡ ⎤⎢ ⎥⎣ ⎦
∑
∑

Singleton Metrics (4)
20
• Reorder Entropy (ER)
• When
• Maximum ER :
( 1) ( [ ] log ( [ ]))T
T
i D
R ei D
E RD i RD i=+
=−
= − × ×∑
1[ ] , [ , ](2 1) T T
T
RD i i D DD
= ∈ −+
log (2 1)R e TE D= +

Websites for measurement
21

Results (1)
22
• ER get the maximum value
• ER =0
-25 -20 -15 -10 -5 0 5 10 15 20 250.000
0.005
0.010
0.015
0.020
0.025
0.030
0.035
0.040
RD
Displacement
-25 -20 -15 -10 -5 0 5 10 15 20 250.0
0.2
0.4
0.6
0.8
1.0
1.2
RD
Displacement
Reorder Density on Net-5 observed at 9:52am August 26, 2005 (DT = 25)
Reorder Density on Net-5 observed at 8:00am Sep 24, 2005 (DT = 25)

Results (2)
23
• ML=ME = 1 • ML > ME
-25 -20 -15 -10 -5 0 5 10 15 20 250.0000.0020.0040.0060.0080.0100.0120.0140.0160.018
0.2
0.4
0.6
0.8
1.0
RD
Displacement
-25 -20 -15 -10 -5 0 5 10 15 20 250.00000.00020.00040.00060.00080.00100.00120.00140.00160.0018
0.2
0.4
0.6
0.8
1.0
RD
Displacement
Reorder Density on Net-5 observed at12:00am Sep
24, 2005 (DT = 25)
Reorder Density on Net-5 observed at 8:00am Sep 24,
2005 (DT = 25)

Statistic Data about 5 Websites
24

Result – (3)
25
0 50 100 150 200 250 300 3500
2
4
6
8
Mag
nitu
de
Event
ML
ME
0 5 0 1 0 0 1 5 0 2 0 0 2 5 0 3 0 0 3 5 0
0 . 0
0 . 1
0 . 2
0 . 3
0 . 4
0 . 5
B
A
Mag
nitu
de
E v e n t
E R
P L
- 2 5 - 2 0 - 1 5 - 1 0 - 5 0 5 1 0 1 5 2 0 2 50 . 0 0 0
0 . 0 0 1
0 . 0 0 2
0 . 2
0 . 4
0 . 6
0 . 8
1 . 0
RD
D is p la c e m e n t
A B
RD of points A and B (A –Oct 3rd 23:00 on Net –5, B – Oct 4th 23:00 on Net - 5)

Result – (4)
26
Week Trend
0
0.05
0.1
0.15
0.2
0.25
0.3
0.35
0.4
0.45
0.5
7:00
16:0
0
1:00
10:0
0
19:0
0
4:00
13:0
0
22:0
0
7:00
16:0
0
1:00
10:0
0
19:0
0
4:00
13:0
0
22:0
0
7:00
16:0
0
1:00
Time
E R
1st week2nd week
Monday
0
0.05
0.1
0.15
0.2
0.25
0.3
0.35
0.4
0.45
0:00
2:00
4:00
6:00
8:00
10:00
12:00
14:00
16:00
18:00
20:00
22:00
Time
E R
1st Monday2nd Monday
Tuesday
0
0.05
0.1
0.15
0.2
0.25
0.3
0.35
0.4
0:00
2:00
4:00
6:00
8:00
10:00
12:00
14:00
16:00
18:00
20:00
22:00
Time
E R
1st Tuesday2nd Tuesday
Wednesday
0
0.05
0.1
0.15
0.2
0.25
0.3
0.35
0.4
0.45
0:00
2:00
4:00
6:00
8:00
10:00
12:00
14:00
16:00
18:00
20:00
22:00
Time
E R
1st Wednesday2nd Wednesday
Observation over 2 weeks on Net – 5 (Sep 24 – Oct 8, 2005)

Outline
27
• Introduction • Contribution• Part I – Measurement of Packet Reordering over Internet • Part II – Cascade of n Similar Subnet Problem• Part III – Packet Reordering & Packet Delay• Summary

AS Topology View of Internet
28
hosts/endsystems
routers
domains/autonomous systems
border routers
hosts/endsystems
routers
domains/autonomous systems
border routers

Convolution between 2 subnets
29
• Theorem: The reorder response J[k] of a network formed by cascading two subnets, with reorder responses J1[k] and J2[k], respectively, is given by the convolution of J1[k] and J2[k] , i.e., J[k] = J1[k] * J2 [k].

Verification over Internet
30
-1 0 1 2 30.0000
0.0002
0.0004
0.0006
0.20.40.60.81.01.2
RD
Displacement
Experiment Theorem
[ - 1 ] [ 0 ] [ 1 ] [ 2 ] [ 3 ] [ 4 ]0 . 0 0 0 00 . 0 0 0 40 . 0 0 0 80 . 0 0 1 20 . 0 0 1 60 . 0 0 2 00 . 0 0 2 4
0 . 2
0 . 4
0 . 6
0 . 8
1 . 0
RD
D is p la c e m e n t
E x p e r im e n t T h e o r y

CNSS Statement
31
• For ,
• Question: Can we evaluate following parameters ?
• Conditions:
Var(Di) = ( )ABRE( )ABRD
20σ
{ } [ ], , ,...,0..., ,i T TP D j RD j j j D D= = ∀ ∈ = −iRD
1
n
ii
Y D=
= ∑
Ζ∈∀= jiRDRD ji ,,

Simulation Result On CNSS
32
• Symmetric Group• Symmetric means RD is
about RD[0]• n = 80

Simulation Result On CNSS
33
• Asymmetric Group • n = 80
0 20 40 60 80
0.5
1.0
1.5
2.0
2.5
3.0
3.5
4.0
E R(A
B)
n
u1 u2 u3 u4

Simulation Result On CNSS
34
- 3 - 2 - 1 0 1 2 3 4 50 . 0
0 . 1
0 . 2
0 . 3
0 . 4
0 . 5
0 . 6
0 . 7
0 . 8
0 . 9
RD
D i s p la c e m e n t
s 1 t1 t2 t3 t4

Theoretical Analysis
35
• General Expression of RD on CNSS (By generation function express)
• Where
• Estimate of Reorder Entropy on CNSS
1
1 2 3, , , , 1 2 3
( [ ] ) ( [0]) ( [ ] ), , ,...,
i mT T
m
k kD k DT T
k k k k m
nRD D s RD RD D s
k k k k−⎛ ⎞
−⎜ ⎟⎝ ⎠
∑L
L L
( )0
1 1 1(ln 2 ) (ln ) ln( )2 2 2
ABRE nπ σ= + + +
1
m
ii
k n=
=∑ 1 2 3 1 2 3
!, , ,..., ! ! ! !m m
n nk k k k k k k k⎛ ⎞
=⎜ ⎟⎝ ⎠ L

Comparison
36
• s1 • s2
0 5 0 1 0 0 1 5 0 2 0 0 2 5 0 3 0 0
0 . 5
1 . 0
1 . 5
2 . 0
2 . 5
3 . 0
3 . 5
4 . 0
4 . 5
E R
(AB
)
n
E s t i m a t i o n E x p e r i m e n t
0 1 0 2 0 3 0 4 0 5 0 6 0 7 0 8 0 9 0
0 . 5
1 . 0
1 . 5
2 . 0
2 . 5
3 . 0
E R
(AB)
n
E s t i m a t i o n E x p e r i m e n t
• t1 • t4
0 2 0 4 0 6 0 8 00 . 5
1 . 0
1 . 5
2 . 0
2 . 5
3 . 0
E R
(AB)
n
E s t i m a t i o n E x p e r i m e n t
0 2 0 4 0 6 0 8 0- 0 . 5
0 . 0
0 . 5
1 . 0
1 . 5
2 . 0
2 . 5
3 . 0
3 . 5
E R
(AB
)
n
E s t i m a t i o n E x p e r i m e n t

Estimation on RD[0]
37
[0] ( 0) ( 1)RD P Y P Y= > − >
0 0
1 0( ) ( )nm nmn nσ σ
− −= Φ −Φ
0
1( ) (0)nσ
= Φ −Φ

Outline
38
• Introduction • Conclusion• Part I – Measurement of Packet Reordering over Internet • Part II – Cascade of n Similar Subnet Problem• Part III – Packet Reordering & Packet Delay• Summary

Simulation Parameters
39
• Gamma Distribution• BestFit 4.0 generate the
Independent packet delay
• Use Reorder Entropy to evaluate packet reordering
• Changing the Inter Packet Gap
• Strategy
• Gamma Distribution
• Parameters
1( ; , ) , 0( )
x
kk
ef x k x xk
θ
θθ
−
−= ∀ >Γ

Simulation Result
40
• Gamma-distribution parameters for Group 1 with fixing the mean at a constant value of 1008 millisecond (ms)
1.95 3.95 5.95 7.95 9.95-0.5
0.0
0.5
1.0
1.5
2.0
2.5
3.0
3.5
E R
IPG (ms)
0.51248

Simulation Result
41
• Gamma-distribution parameters for Group 2 with fixing the SD at a constant value of 615 millisecond
0.0 2.5 5.0 7.5 10.0
1
2
3
E R
IPG (ms)
0.5 1 2 4 8

Outline
42
• Introduction • Conclusion• Part I – Measurement of Packet Reordering over Internet • Part II – Cascade of n Similar Subnet Problem• Part III – Packet Reordering & Packet Delay• Summary

Summary
43
• Some Internet path display the weekly and daily trend on packet reordering, where others are in random. Packet reordering is time varying
• Give the general expression of Reorder Density on CNSS and Estimation of Reorder Entropy of CNSS
• Simulation on IPG, packet delay and packet reordering, shows that higher SD of end-to-end packet delay results in a higher level of packet reordering. For the same packet delay distribution, the level of packet reordering decreases with the increase in Inter Packet Gap.

Future
44
• Could the Internet be an application of existing theory about entropy ?
• Is it possible to predict the network condition by packetreordering?

45
• Questions ?• Thank You