pad: performance anomaly detection in multi-server distributed systems
TRANSCRIPT

PAD: Performance Anomaly Detection in Multi-Server
Distributed Systems
Manjula Peiris, James H. Hill, Jorgen Thelin, Gabriel Kliot, Sergey Bykov & Christian Konig
The 7th IEEE International Conference on Cloud Computing (IEEE CLOUD 2014) 28TH JUN – 2ND JUL,
ALASKA, USA

Multi-Server Distributed Systems
Servers
Data Center
Servers
Data Center
Clients
Identification of performance anomalies and root causes of those anomalies are very important
• Data centers contain thousands of machines• Highly Scalable• Need to achieve high throughputs with low latencies
Manual analysis • Time consuming• Thousands of logs to inspect• Error prone
Performance anomaly detection process need to be automated, if not semi-automated !

Goals of Performance Anomaly Detection (PAD)
• For Distributed System developers and users:– Get insights from performance data about performance
issues and optimizations of the system
– Minimize developer time required to analyze large amounts of performance data generated across hundreds to thousands of servers
– Assist in troubleshooting performance related issues and finding root causes
– Production Service Intelligence (Use of statistical techniques in the context of performance analysis)

Application Domain: Orleans Project
• Distributed Actor Programming Model
• Provides a programming model and a runtime to construct highly scalable distributed systems
• Need to achieve high throughputs and low latencies
• Difficult to detect performance anomalies (typical deployment contains hundreds of servers)
http://research.microsoft.com/en-us/projects/orleans/

Some example performance issues from Orleans Project
• Stuck Random Number Generator– Lower throughput and a higher number of failed requests
– Diagnosis requires comparing performance data in different server logs at different time points
– Key : The time point most number of requests are getting time outs
– Root cause : Thread unsafe random number generator
• Leaking Buffer pool
– Lower throughput with higher response times
– Key : Correlation between performance degradation and a memory issue
– Root cause : A memory leak in a custom memory allocator
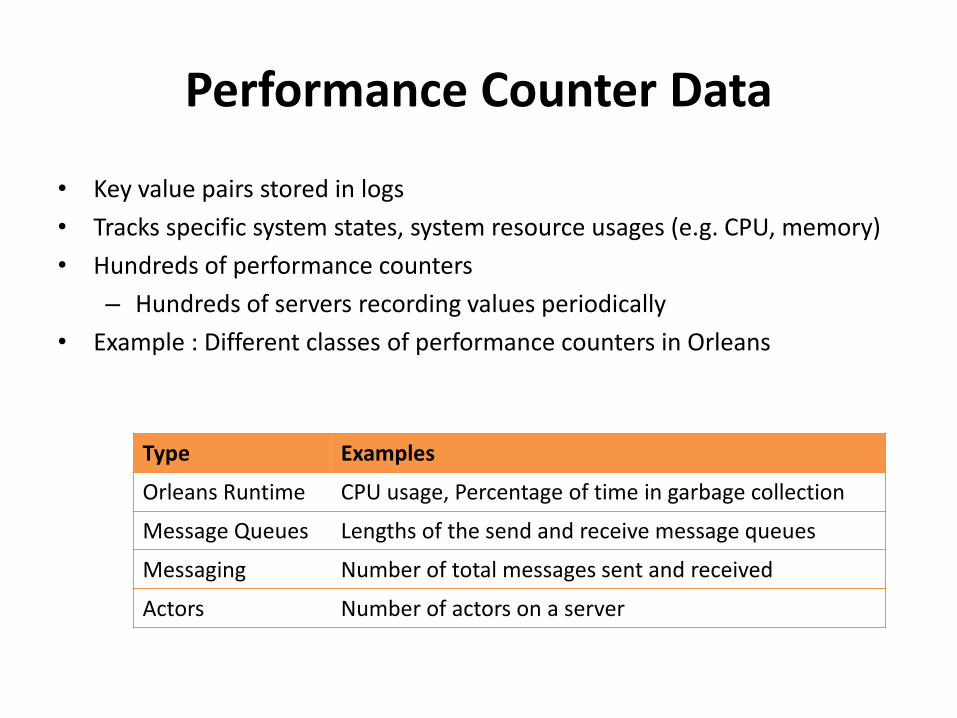
Performance Counter Data
• Key value pairs stored in logs
• Tracks specific system states, system resource usages (e.g. CPU, memory)
• Hundreds of performance counters
– Hundreds of servers recording values periodically
• Example : Different classes of performance counters in Orleans
Type Examples
Orleans Runtime CPU usage, Percentage of time in garbage collection
Message Queues Lengths of the send and receive message queues
Messaging Number of total messages sent and received
Actors Number of actors on a server
Requirements for PAD
• Quickly finding the deviations of performance data using visualizations
• Automatically finding the performance counters that exhibits large deviations
• Ability to compare performance counters of different logs of different system executions
• Ability to compare logs of different servers in the same execution

Challenges for PAD
• Large data volumes to look at– Which set of performance counters to consider
– Whether to consider performance counters of all servers at a particular time or particular server across time or both
• Insufficient training data– Performance data is available but not a labeled data set
– Hard to apply machine learning based classification techniques
• Time correlation– Large number of physical machines, Clocks are not
synchronized
– Some performance counters are sensitive to time

PAD-Assisted Investigation
• Step 1 : Performance data collection
• Step 2 : Data visualization
• Step 3 :Threshold analysis
! "#"$%&''( )#&*$
+, $- ( - &*. $/ ( *0&*- ", ) ( $)&1, #( *$2"#"$
3$
43$
533$
3$
63$
73$
83$
93$
533$
563$
< *'( ", =$'&>=$
?@1*( $: #&*">( $
? , "'. @( *=$
A"*=( $
B1( *. $
%*( "#( =$
? , "'. @( $
C( /&*#=$
? , &- "'&1=$A( *0&*- ", ) ( $%&1, #( *=$
D;=1"';@
"E&, =$
• Step 4 :Correlation analysis• Step 5 : Comparative analysis

Step 2: Data Visualization
Time view
Server viewDetail view
• Detail view provide the overall trend• Server view shows the anomalous servers• Time view shows the anomalous time points• Time and Server view are based on summary statistics• Helps developers reduce the problem space

Step 3 : Threshold Analysis<PerformanceCounter Name="Runtime.GC.PercentOfTimeInGC">
<Rules><Rule AppliesTo=”Detail">
<Name>1</Name><Statistic>Any</Statistic><ExpectedValue>30</ExpectedValue><ComparisonOperator>GreaterThan</ComparisonOperator>
</Rule></Rules>
</PerformanceCounter>
<PerformanceCounter Name="Scheduler.PendingWorkItems"><Rules>
<Rule AppliesTo="Time"><Name>1</Name><Statistic>Average</Statistic><ExpectedValue>5</ExpectedValue><ComparisonOperator>GreaterThan</ComparisonOperator>
</Rule></Rules>
</PerformanceCounter>
<PerformanceCounter Name="Messaging.Sent.Messages.Delta"><Rules>
<Rule AppliesTo=”Server"><Name>1</Name><Statistic>Median</Statistic><ExpectedValue>100</ExpectedValue><ComparisonOperator>GreaterThan</ComparisonOperator>
</Rule></Rules>
</PerformanceCounter></StatConfiguration>
A Global rule irrespective of time and server
A Time rule irrespective of server
A Server rule irrespective of time
Goals:
• Filter the performance counters based on developer expertise knowledge• Identify abnormal servers or time points for performance counters developer suspects

Step 4 : Correlation Analysis
• Previous steps help developers find abnormal counters• What has happened in the system to cause this undesired behavior ? (Root
cause analysis)• Statistical correlation techniques
– Pearson coefficient– Spearman coefficient
• Explanatory performance counters• E.g. Number of queued request in a particular server is positively correlated
to time spend in garbage collection in that server.

Step 5 : Comparative Analysis
• Which set of performance counters to analyze ?
• Hundreds of performance counters - visualizing every performance counter is not scalable
• Finding the suspicious counters using comparisons
Comparative analysis within a dataset
• Statistical properties of certain servers, time points can be abnormal compared to the others
X = |GlobalMedian - LocalMedian |
GlobalStandardDeviation
Comparative analysis between datasets
• Compare statistical properties of two different executions
X = |RefDataSetMedian - DataSetMedian|
RefDataSetStdDev
Applications of PAD to Orleans
• Unbalance Distributed Hash Table (DHT) problem– Similar to Stuck Random Number generation problem
– One server was serving many requests
– Eventually degrade the throughput
– Comparative and Visualization analysis are applied.
• Performance bottleneck and Tuning analysis– Uses PAD to analyze the impacts of different performance
optimization techniques
– Inspected the impact of a certain batching algorithms
– PAD helped to assess the effectiveness of various optimization techniques

Related Work
• Approaches rely on historical performance data and known performance problems– Considers older versions of a system as baselines and evaluate newer
versions– Only provide comparative analysis– Uses historical performance crisis to create finger prints of
performance data
• Approaches that do not require historical performance data– Uses Principal Component Analysis (PCA)– Performance counters with high variance --> anomalies– Root cause analysis using Dynamic Binary Instrumentation (DBI)– Detecting performance anti-patterns

Lessons learned
• PAD setup the stage for developers to do deeper analysis of performance counter data
• Visualization and summary statistic is a key part in performance anomaly detection
• Reducing the number of performance counters is important
• Fully automated root cause analysis for performance anomalies is hard

Questions

Thank You !