page 1 of 17 - brighton and sussex university hospitals ... · pdf filepage 1 of 17 to: board...
TRANSCRIPT

Page 1 of 17
To: Board of Directors
Date of Meeting: 26 July 2017 Agenda Item: 6b
Title
Patient Experience, PALS and Complaints Annual Report 2016/17
Responsible Executive Director
Nicola Ranger, Chief Nurse
Prepared by
Jane Carmody, Head of Patient Experience, PALS and Complaints
Status
Public
Summary of Proposal
The purpose of this report is to bring to the attention of the Board information relating to informal and formal concerns and patient experience feedback received by the Trust between the 1 April 2016 and the 31 March 2017.
Implications for Quality of Care
This report seeks to provide assurance that enquiries and concerns are managed in a timely manner and that lessons are identified, acted upon and disseminated across the organisation to ensure high quality patient experience
Link to Strategic Objectives/Board Assurance Framework
The report supports the Trust objectives of: excellent outcomes and great experience.
Financial Implications
-
Human Resource Implications
-
Recommendation
The Board/Committee is asked to NOTE the report and AGREE any necessary actions
Communication and Consultation
-
Appendices
None
Page 2 of 17
Report to the Board of Directors, 26th July 2017
Patient Experience, PALS and Complaints Annual Report 2016/17
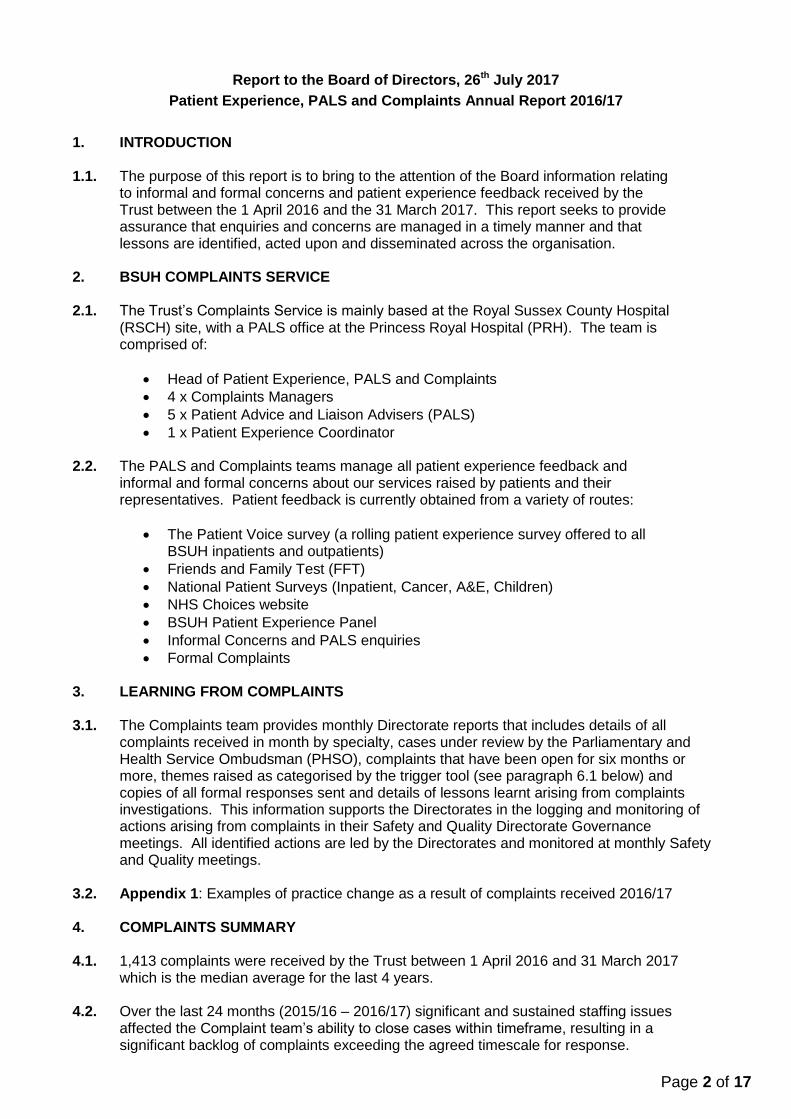
1. INTRODUCTION 1.1. The purpose of this report is to bring to the attention of the Board information relating
to informal and formal concerns and patient experience feedback received by the Trust between the 1 April 2016 and the 31 March 2017. This report seeks to provide assurance that enquiries and concerns are managed in a timely manner and that lessons are identified, acted upon and disseminated across the organisation.
2. BSUH COMPLAINTS SERVICE 2.1. The Trust’s Complaints Service is mainly based at the Royal Sussex County Hospital
(RSCH) site, with a PALS office at the Princess Royal Hospital (PRH). The team is comprised of:
Head of Patient Experience, PALS and Complaints
4 x Complaints Managers
5 x Patient Advice and Liaison Advisers (PALS)
1 x Patient Experience Coordinator
2.2. The PALS and Complaints teams manage all patient experience feedback and informal and formal concerns about our services raised by patients and their representatives. Patient feedback is currently obtained from a variety of routes:
The Patient Voice survey (a rolling patient experience survey offered to all BSUH inpatients and outpatients)
Friends and Family Test (FFT)
National Patient Surveys (Inpatient, Cancer, A&E, Children)
NHS Choices website
BSUH Patient Experience Panel
Informal Concerns and PALS enquiries
Formal Complaints
3. LEARNING FROM COMPLAINTS 3.1. The Complaints team provides monthly Directorate reports that includes details of all
complaints received in month by specialty, cases under review by the Parliamentary and Health Service Ombudsman (PHSO), complaints that have been open for six months or more, themes raised as categorised by the trigger tool (see paragraph 6.1 below) and copies of all formal responses sent and details of lessons learnt arising from complaints investigations. This information supports the Directorates in the logging and monitoring of actions arising from complaints in their Safety and Quality Directorate Governance meetings. All identified actions are led by the Directorates and monitored at monthly Safety and Quality meetings.
3.2. Appendix 1: Examples of practice change as a result of complaints received 2016/17 4. COMPLAINTS SUMMARY 4.1. 1,413 complaints were received by the Trust between 1 April 2016 and 31 March 2017
which is the median average for the last 4 years. 4.2. Over the last 24 months (2015/16 – 2016/17) significant and sustained staffing issues
affected the Complaint team’s ability to close cases within timeframe, resulting in a significant backlog of complaints exceeding the agreed timescale for response.

Page 3 of 17
4.3. In light of these issues, the Patient Experience, PALS and Complaints service was restructured in April 2017 to allow for a more innovative approach to the management of formal concerns raised about Trust services. This has allowed different ways of working and has enabled a timelier, more accessible and more flexible response to patient experience at our hospitals.
4.4. The restructure has increased the capacity of the PALS team by 40%. All formal concerns
are now directed to the PALS team in the first instance who will seek to quickly resolve the issues raised wherever possible and appropriate. This means that PALS Advisers now take forward concerns that require more comprehensive investigation and would previously have been managed via the formal complaints process as an Early Resolution. PALS Advisers work closely with the specialties to ensure that such concerns are resolved swiftly and efficiently and without the need for a formal written response from the Chief Executive Officer (CEO) or her representative.
4.5. Early Resolutions represent a significant percentage of our workload and in 2016/17 there
was a 33% increase in formal concerns being managed in this way. Approximately half of all formal complaints received by the Trust are now managed as an Early Resolution which includes a variety of interventions such as telephone feedback, meetings with clinical staff and listening to and gathering personal narratives for teaching, without the need for a formal written response from the CEO or her representative.
4.6. From April 2017, following the restructuring of the PALS and Complaints service, data
reports will reflect these changes to practice. Formal and informal concerns will be reported separately with formal complaint data only including those complaints requiring a written response from the CEO. Early Resolution data will include all other concerns resolved locally by the PALS and Complaints teams and without the need for a formal written response.
4.7. The PALS service has seen an 18% increase in contacts in the years 2015/16 and 2016/17.
In the three months following the restructure there has been a reduction in the number of formal complaints received by 45% compared to the same period in 2015/16.
4.8. It is important to note that, as envisaged, since the restructuring and expansion of the PALS
team there has been a 70% reduction in the backlog of formal complaints exceeding the agreed timescale for response.
4.9. The changes described have already significantly and positively impacted on the service
and response times are showing a steady improvement. The Trust is now responding to 62% of formal complaints within 40 working days and, whilst this remains below our local response target of 85%, we project that by 2017/18 year end this target will be consistently achieved.
5. ACTIVITY 5.1. 2016/17 data reflects previous practice and patient complaints managed via the PALS team
(Early Resolutions) are counted within Formal Complaints.
5.2. Table 1: Formal Complaints received by year
Formal Complaints received
Early Resolutions
% closed by ER
Closed within 40 WD
% closed within 40 WD
No reopened
% reopened
2013/14 1,298 653 51% 841 48% 154 11%
2014/15 1,305 564 43% 830 64% 184 12%
2015/16 1,036 394 38% 684 66% 172 17%
2016/17 1,347 619 46% 690 63% 125 9%

Page 4 of 17
5.3. Graph 1: Informal concerns and formal complaints received March 2016 – March 2017
5.4. Graph 2: First three months of 2017/18
5.5. Table 2 / Graph 3: Percentage of all patients raising informal concerns and formal complaints as a ratio of all BSUH activity
By Directorate %
Abdominal Surgery and Medicine 0.94%
Acute Floor 1.87%
Cancer 0.19%
Cardiovascular 0.38%
Central Clinical Services 0.25%
Children's Services 0.47%
Head and Neck 0.28%
Musculo Skeletal 0.84%
Neurosciences and Stroke Services 1.78%
Perioperative 0.82%
Specialty Medicine 0.74%
Women's Services 0.27%
5.6. Appendix 2: Complaints and PALS contacts by Directorate December 2015 – March 2017
6. CATEGORISATION OF COMPLAINTS 6.1. Each complaint received by the Trust is assigned a trigger according to the issues
raised in the complaint to ensure that themes and trends are easily identified, reported and acted upon.
0
100
200
300
400
500
201603
201604
201605
201606
201607
201608
201609
201610
201611
201612
201701
201702
201703
Complaint
PALS
0
100
200
300
400
500
Apr-17 May-17 Jun-17
No of Complaints
No of Early Resolutions

Page 5 of 17
6.2. All complaints received are also categorised as either being upheld or not upheld
against the triggers ascribed to them which provides additional, valuable information regarding where service improvement is required.
6.3. Between 1 April 2016 and 31 March 2017 2,443 triggers have been reported of which
870 (36%) have been upheld. Whilst complaints regarding clinical treatment and care are routinely amongst the top three reported triggers (318 in 2016/17) only 12% of these have been upheld to date. A number of the lesser reported triggers do, however, identify significant areas for improvement. In 2016/17 40% of complaints about patient pathway issues and 61% of complaints about administration errors were also upheld.
6.4. Abdominal, Musculoskeletal and Neurosciences & Stroke Services have received the
most complaints in 2016/17.
6.5. Table 3: Highest number of complaints received and Trigger
6.6. Table 4: Top 10 Complaints Upheld by Trigger
Trigger Upheld
Communication 435 279
Wait for OP appointment 338 88
Wait for surgery date 168 48
Cancellation 142 46
Any complaints relating to care of the elderly upheld 119 44
Administrative failings/errors 117 38
Clinical care/treatment 108 36
Attitude of staff 97 33
Nursing care 87 24
Patient pathway failures 76 19
6.7. Complaints about staff attitude that involve a difference in recollection and opinion,
and where there is no witness to clarify the nature of the interaction, are recorded as not upheld. We recognise that this has the potential to lead to under reporting of such incidents and, to help mitigate this risk, the incident is shared with the staff member’s Line Manager in order that any future concerns raised are quickly identified and can be used to inform one to one reflective meetings and the appraisal process.
7. TRIGGER THEME – Staff Attitude 7.1. Organisational culture and staff attitude are vital to the delivery of good care and the
2016 National Adult Inpatient Survey found that 85% of patients surveyed felt they were treated with dignity and respect by our staff.
Abdominal Surgery and Medicine
Musculoskeletal Services Neurosciences and Stroke Services
Communication Communication Wait for outpatient appointment
Wait for surgery date Clinical care/treatment Communication
Clinical care/treatment Wait for outpatient appointment Cancelled
Wait for outpatient appointment Wait for surgery date Wait for surgery date

Page 6 of 17
7.2. However, the trigger ‘Staff Attitude’ was cited in 9% of all complaints received by the
Trust with the highest percentage being seen in:
21% Obstetrics (PRH 11% RSCH 10%)
20% RSCH Intensive Care Unit
20% Cancer Services
18% Emergency Department (PRH 5% RSCH 13%)
7.3. 83% of complaints about staff attitude were resolved via Early Resolution either through a telephone conversation between the Complaints Investigation Manager/PALS Adviser, a meeting with clinical staff or by a letter directly from the clinician involved. Complaints about named clinical staff are recorded on Datix and reported via MAARS to help inform the medical appraisal process. In instances where there are repeated concerns raised about a named individual this will be escalated by the Head of Patient Experience, PALS and Complaints to the appropriate line manager.
7.4. In order to support staff learning and personal development from such feedback the
Complaints team recommends that specialties ensure that a reflective meeting is routinely held with the staff member involved. It is also recommended that the staff member writes a reflection on the events described to form part of their appraisal and that evidence of this is provided to ensure accountability at all levels.
7.5. Table 5: Complaints about staff attitude by Directorate
7.6. Appendix 3: Complaints about staff attitude by Directorate and Specialty
Complaints about staff attitude received 1 April 2016 - 30 March 2017
04/16
05/16
06/16
07/16
08/16
09/16
10/ 16
11/ 16
12/ 16
01/ 17
02/ 17
03/ 17
Total % of total
complaints received
Acute Floor 2 7 1 3 2 1 4 5 3 2 1 1 32 13%
Women’s Services 0 2 2 3 2 0 2 4 4 4 0 0 23 14%
Speciality Medicine 0 2 2 1 2 3 4 0 2 0 2 1 19 9%
Musculo Skeletal 3 0 0 3 2 3 1 0 1 4 0 0 17 9%
Head and Neck 2 2 2 2 2 1 0 1 0 1 2 1 16 13%
Neurosciences and Stroke Services 0 1 0 1 1 2 0 3 1 0 3 0 12
6%
Central Clinical Services 2 0 1 2 0 2 0 0 0 1 1 1 10
14%
Cardiovascular 1 0 2 1 0 1 0 1 1 0 0 2 9 6%
Children's Services 0 4 0 1 0 2 0 0 0 0 0 2 9 12%
Abdominal Surgery and Medicine 0 0 0 0 2 1 1 1 1 2 0 0 8
3%
Cancer 2 1 2 0 0 1 0 0 0 0 1 1 8 15%
Page 7 of 17
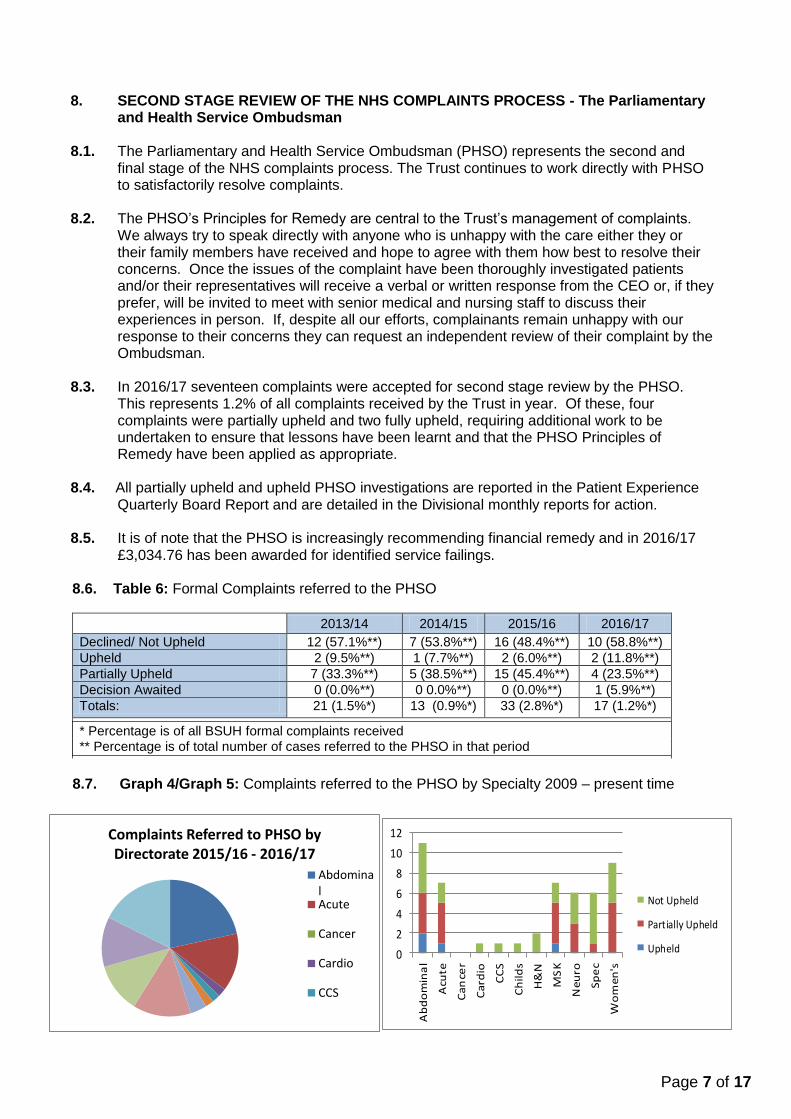
8.6. Table 6: Formal Complaints referred to the PHSO
2013/14 2014/15 2015/16 2016/17
Declined/ Not Upheld 12 (57.1%**) 7 (53.8%**) 16 (48.4%**) 10 (58.8%**)
Upheld 2 (9.5%**) 1 (7.7%**) 2 (6.0%**) 2 (11.8%**)
Partially Upheld 7 (33.3%**) 5 (38.5%**) 15 (45.4%**) 4 (23.5%**)
Decision Awaited 0 (0.0%**) 0 0.0%**) 0 (0.0%**) 1 (5.9%**)
Totals: 21 (1.5%*) 13 (0.9%*) 33 (2.8%*) 17 (1.2%*)
* Percentage is of all BSUH formal complaints received ** Percentage is of total number of cases referred to the PHSO in that period
8.7. Graph 4/Graph 5: Complaints referred to the PHSO by Specialty 2009 – present time
Complaints Referred to PHSO by Directorate 2015/16 - 2016/17
AbdominalAcute
Cancer
Cardio
CCS
8. SECOND STAGE REVIEW OF THE NHS COMPLAINTS PROCESS - The Parliamentary
and Health Service Ombudsman 8.1. The Parliamentary and Health Service Ombudsman (PHSO) represents the second and
final stage of the NHS complaints process. The Trust continues to work directly with PHSO to satisfactorily resolve complaints.
8.2. The PHSO’s Principles for Remedy are central to the Trust’s management of complaints.
We always try to speak directly with anyone who is unhappy with the care either they or their family members have received and hope to agree with them how best to resolve their concerns. Once the issues of the complaint have been thoroughly investigated patients and/or their representatives will receive a verbal or written response from the CEO or, if they prefer, will be invited to meet with senior medical and nursing staff to discuss their experiences in person. If, despite all our efforts, complainants remain unhappy with our response to their concerns they can request an independent review of their complaint by the Ombudsman.
8.3. In 2016/17 seventeen complaints were accepted for second stage review by the PHSO.
This represents 1.2% of all complaints received by the Trust in year. Of these, four complaints were partially upheld and two fully upheld, requiring additional work to be undertaken to ensure that lessons have been learnt and that the PHSO Principles of Remedy have been applied as appropriate.
8.4. All partially upheld and upheld PHSO investigations are reported in the Patient Experience
Quarterly Board Report and are detailed in the Divisional monthly reports for action. 8.5. It is of note that the PHSO is increasingly recommending financial remedy and in 2016/17
£3,034.76 has been awarded for identified service failings.
0
2
4
6
8
10
12
Ab
do
min
al
Acu
te
Ca
nce
r
Ca
rdio
CC
S
Ch
ild
s
H&
N
MS
K
Ne
uro
Sp
ec
Wo
me
n's
Not Upheld
Partially Upheld
Upheld

Page 8 of 17
020406080
100120140160
14/15
15/16
16/17
9. PLAUDITS
9.1. Many patients, their families and visitors to the Trust take the time to give thanks for the care they or their loved one has received. It is just as important for our staff to know when they have done things well and there is valuable learning from the positive feedback received.
9.2. All plaudits are logged on our central complaints system, shared with the CEO and the teams involved, and are appropriately acknowledged by the Patient Experience Team or
the CEO.
9.3. Table 7: Plaudits received by Directorate and Year received
9.4. Examples of Plaudits received AMU - “We are so grateful for the care, compassion and sensitivity you showed to
our dad and to us. It was a harrowing day and yet we look back with the knowledge and certainty that he was in the hands of amazing people who really care.”
Renal - “after an apprehensive stay on the kidney ward recently I must say all staff from porters to consultants could not have done more or worked harder to make my stay more comfortable. They were tireless in their effort. So grateful.”
RSCH ED - “The hospital was extremely busy and the staff were so hard working but treated all patients and families with such compassion. I thought they were truly inspirational, a credit to the NHS and a credit to the hospital.”
Cardiac - I unfortunately suffered a heart attack and was taken to your Cardiac Unit by ambulance. From the moment I arrived the treatment I received can only be described as outstanding! Although many of your dedicated professionals were involved in my treatment, I would particularly like to thank the nurses in the Cardiac Unit for their care and attention after my stent was fitted. They all deserve a medal as nothing was too much trouble and they managed to reassure me at a time when, to be honest, I was at a very low point. Please keep up the good work you do, it is very much appreciated and, once again, thank you all for fixing me.”
Support services – “The portering staff are a credit to the hospital and the unsung heroes of the Trust - I must congratulate you on your porter staff. We have found them to be the most caring, compassionate and professional individuals in the hospital who dealt with my mother on a very bad day and were most careful and empathetic to her needs transporting her with a spinal injury with the utmost consideration and respect for her dignity. I believe they do a fabulous job – thank you to all the porters.

Page 9 of 17
10. PATIENT AND PUBLIC ENGAGEMENT 10.1. Patient Experience Panel (PEP)
The Trust runs two Patient Experience Panels, one for the RSCH site and one for PRH. The Panels meet on a quarterly basis, in turn, so that along with the Patient Experience Committee, there is a meeting focussed on some aspect of patient experience every month. The Panels are the key vehicle for patient representation / participation, and the Committee is a formal, business/assurance Committee comprised mainly of Trust staff, but including Healthwatch representatives.
10.2. The role of the PEP is to:
Advise the Trust on issues of concern to local people/ patients
Form patient/representative led working groups to help develop priorities for action and ensure regular feedback on outcomes of actions
Help develop Trust strategies, appraise information for the public developed by the Trust and help determine priorities for patient engagement
Consider service changes and proposals for local NHS services and participate in a range of schemes to gather patient/ carer intelligence on Trust services including surveys, walkabouts, fly on the wall observations and ward visits
10.3. The Panels have a maximum of 8 patient/carer representatives who have demonstrable links to allow feedback to other parts of the community and each meeting is themed to concentrate on a specific topic.
10.4. The PEP reports to the Patient Experience Committee as a sub-Committee of the
Board’s Quality & Performance Committee. 10.5. The Patient Experience Committee meets on a quarterly basis to:
Review performance in connection with the complaints procedure
Monitor trends in complaints and feedback
Ensure the effective implementation of action plans arising from individual complaints or themes arising from a number of complaints
Share and promote good practice in connection with patient experience
11. NHS Choices
NHS Choices is a website where patients and the public can comment on any NHS service. Positive and negative comments are posted, usually anonymously, and the site is monitored by the Care Quality Commission (CQC). The CQC monitors issues and concerns raised and the responses from the service provider. Patients are able to provide feedback on the care they have received at our hospitals via the NHS Choices website. This is reviewed several times a week by the Patient Experience Co-Ordinator and all posts are responded to, both thanking plaudits and sharing them with the staff teams involved or inviting further contact from those patients reporting a poor experience.
12. Healthwatch Peer Review Panel
Since 2014, following a recommendation of the Francis Report, the Patient Experience Team have allowed access to anonymised information about complaints with the local health watchdog, Healthwatch Brighton & Hove. During this time Healthwatch volunteers have undertaken a quarterly review of anonymised complaints, providing feedback to the Trust on the standard and quality of the response which is used to inform future complaints practice.

Page 10 of 17
13. Friends and Family Test (FFT)
13.1. Since April 2013, patients have been asked whether they would recommend the hospital ward they were discharged from or the A&E department they were treated in to their friends and family, if they needed similar care or treatment. This allows patients to give feedback on the quality of the care they receive and provides an opportunity for the Trust to better understand the needs of our patients and enabling improvements.
13.2. Since 2013 Inpatient and Outpatient FFT data has been collected internally and has
been run collaboratively by the Patient Experience and Patient Safety team without any dedicated resource. The Trust employs an external contractor, who is the market leader in providing acute Trusts with FFT services, to collect and analyse FFT data in our ED and maternity services. The data is then provided to the Trust’s Central Information Unit for the reporting of the monthly return to NHS England.
13.3. Inpatient and Outpatient FFT data is reported to every ward on a monthly basis including feedback from the Patient Voice survey plus free text comments on what the hospital can do to improve care as part of the Nursing Metrics programme.
13.4. The ED and maternity departments are provided with a live dashboard of their results, accessible online, detailing comments and voice recordings, gathered through paper surveys, voicemail and a texting service.
13.5. FFT data is not, currently, accessible to patients via the Trust’s website and there remains a challenge to the Trust in converting its understanding of what is driving the FFT score into tangible actions.
13.6. The Patient Experience team requests that consideration is given to introducing a single system for the gathering of FFT data across Trust wards and services. This would allow a clear and consistent approach to the collection and analysis of FFT data which can then be used to inform the patient experience agenda within the Trust.
13.7. Table: 8 Inpatient and Emergency Department response rates 2016/17 and % measures of all services surveyed
% Response
Rate
Inpatient Percentage Measures
A&E Percentage Measures
Outpatients Percentage Measures
Maternity Percentage Measures
A&
E
Inp
atie
nt
Reco
mm
en
d %
No
t Reco
mm
en
d
%
Reco
mm
en
d %
No
t Reco
mm
en
d
%
Reco
mm
en
d %
No
t Reco
mm
en
d
%
Reco
mm
en
d %
No
t Reco
mm
en
d
%
2016-17 18.4% 12.4% 95.3% 1.6% 87.8% 7.2% 93.4% 2.7% 93.8% 4.0%
13.8. Currently Trusts are only required to report ED and Inpatient FFT response rates to
the DoH. Internal targets should, however, be introduced for all services to ensure validity of the data and for performance management purposes.
13.9. Emergency Department FFT
Since commissioning the external contractor there has been a significant and sustained improvement in ED FFT data and in 2016/17 the response rate for BSUH was 18.4% compared to the national average of 12.7%.

Page 11 of 17
13.10. Key themes of dissatisfaction are waiting times, lack of information about waiting times and the comfort of the chairs in the Urgent Care Centre (UCC) at RSCH. This feedback has been used as part of the UCC improvement plan, which includes new room configuration to make the staff more visible, new chairs and
television screens displaying accurate waiting times. 14. Patient Voice 14.1. The Parliamentary report ‘A Review of the NHS Hospitals Complaints System -
Putting Patients Back in the Picture’ (Clwyd Report, October 2013) considered the handling of concerns and complaints in NHS hospitals. One of the key recommendations was that Trusts should provide patients with an easy way of feeding back comments and concerns about their care on the ward, including simple steps such as putting a pen and paper by the bedside and making sure patients know who to speak to if they have a concern.
14.2. The Patient Voice survey is made available to all inpatients upon discharge from our
wards and asks a number of questions relating to the care they have received. The questions asked compare to the national patient surveys and provide a monthly snapshot of our patients’ experience throughout the adult inpatient wards.
14.3. Patient Voice feedback is shared with all ward managers, matrons, directorate lead
nurses, the Deputy Chief Nurse for Patient Experience and the Chief Nurse via the monthly Safety and Quality Nursing Metrics report. This provides Patient Voice data and narrative, details of complaints and PALS contacts received; Patient Safety incidents, the Safety Thermometer, pressure damage, c-difficile infection rates and falls data. The information is also shared via the Staff Handbook (a quality and safety folder available to staff) on all wards. This also forms part of the agenda for directorate safety and quality meetings.
15. National Patient Surveys 15.1. The Trust commissioned Picker to run four national patient surveys in 2016/17: the
Adult Inpatient Survey, Emergency Department Survey, Children’s and Young People’s Services and Maternity Services.
15.2. Four key quality indicators have been identified from these surveys requiring urgent
improvement: communication - at pre-operative assessment and the ability for patients to speak with someone on the ward; discharge - not enough information provided, patients are not always involved enough in decision making, and delays in the discharge process; Food - improvement in quality, help at meal times initiatives and protected meal times and mixed sex bathrooms.
15.3. Appendix 4: National Patient Survey data

Page 12 of 17
Appendix 1: Examples of practice change as a result of complaints received 2016/17
ID Concern Outcome Directorate 21999 Delay in reporting MRI and lack
of clarity regarding the process for obtaining results
The MRI reporting process has been refreshed. All clinical and ward staff now use a centralised imaging results email address allowing clarity and more timely access to patient information.
Central Clinical Services
23111 Delayed subsistence payments to organ donors
BSUH is now working closely with NHS South East Coast to ensure that patient claims for expenses when donating an organ are processed in a timely manner.
Cardiovascular and Renal Services
23583 Poor communication regarding a dementia patient’s delay to surgery
As a result of this complaint the Theatre team has introduced a communication process to ensure that they are made aware of the specific needs of MSK patients (eg, dementia) to improve the patient’s pathway
Musculoskeletal (MSK) Fracture Clinic
20499 Poor communication resulting in failure to progress onward referral for Video-assisted Thoracoscopic surgery (VATS)
This procedure is now undertaken within BSUH services
Cardiovascular
19696 A delay in the time taken to confirm the nature of a malignancy and the pathway between being seen at the chest clinic and starting treatment
Part of this delay was due to the patient having to attend Guys and St Thomas’ Hospital to undertake an EBUS procedure (biopsy of the lungs via ultrasound scan). BSUH now operates an EBUS service.
Cancer Services
26615 Neonatal femoral arterial line requiring vascular management
On those occasions where a femoral arterial line is unavoidable the Consultant Pediatrician will now discuss and agree with the Consultant Anesthetist the most appropriate site and a plan will be made for the limbs to be inspected regularly for signs of complication
Children’s Services
24586 Missed neck fracture Scanning protocols amended to ensure that patients over the age of 65 and presenting with a significant head injury will routinely receive both a CT brain scan and a CT neck scan in the ED
Acute Floor
21463 Delay in operating, failure to give broad spectrum of drugs for sepsis and poor communication with family about deteriorating condition
This complaint was investigated by the Patient Safety team as a Serious Incident. Improvements have since been made at each stage of the emergency laparotomy process and outcome results have significantly improved. Since the implementation of the action plan resulting from the SI investigation risk adjusted mortality rates for this procedure have decreased from 11% to less than 3% since September 2014 and the average length of stay in hospital for this patient group has also decreased by six days
Abdominal Surgery
22282 Failed mammography and poor communication with patient who has dementia
Staff guidelines and patient information developed to help women, carers and staff establish whether a mammogram is technically possible.
Cancer Service

Page 13 of 17
Appendix 2: Complaints and PALS contacts by Directorate December 2015 – March 2017
Abdominal Services Complaints & PALS
Acute
Cancer Cardio
Central Clinical Children’s
Head & Neck MSK
Neuro Perioperative
Speciality Women’s

Page 14 of 17
Appendix 3: Complaints citing staff attitude by Directorate and Specialty
Acute Floor Directorate: Complaints about Attitude
2016 04
2016 05
2016 06
2016 07
2016 08
2016 09
2016 10
2016 11
2016 12
2017 01
2017 02
2017 03
Total
% of total complaints received
Emergency Departments 2 6 1 2 1 1 3 4 3 2 1 1 27
18%
Acute Medicine 0 0 0 1 1 0 0 0 0 0 0 0 2
6%
Intensive Care Unit 0 0 0 0 0 0 1 1 0 0 0 0 2
20%
Urgent Care 0 1 0 0 0 0 0 0 0 0 0 0 1
100%
Head & Neck Directorate: Complaints about Attitude
2016 04
2016 05
2016 06
2016 07
2016 08
2016 09
2016 10
2016 11
2016 12
2017 01
2017 02
2017 03
Total
% of total complaints received
Audiology 0 0 1 0 0 0 0 0 0 0 0 0 1 33%
Dental Surgery 0 0 0 0 0 0 0 0 0 1 0 0 1
50%
Ear Nose & Throat 0 2 0 2 1 0 1 0 1 0 0 2 9
56%
Ophthalmology 2 0 1 0 0 1 0 1 0 0 2 0 7
18%
Maxillofacial/Oral Surgery 0 0 0 0 1 0 0 0 1 0 0 0 2
11%
Women’s Service Directorate: Complaints about Attitude
2016 04
2016 05
2016 06
2016 07
2016 08
2016 09
2016 10
2016 11
2016 12
2017 01
2017 02
2017 03
Total
% of total complaints received
Breast Surgery 0 0 1 0 0 0 0 0 0 0 0 0 1
25%
Colposcopy 0 0 1 0 0 0 0 0 0 0 0 0 1
100%
Community Midwifery 0 0 0 0 0 0 0 0 1 0 0 0 1
25%
Gynaecology 0 1 0 1 0 0 0 0 1 1 0 0 4 13%
Obstetrics 0 1 0 2 2 0 1 4 2 3 0 0 15 21%

Page 15 of 17
Neurosciences and Stroke Directorate: Complaints about Attitude
2016 04
2016 05
2016 06
2016 07
2016 08
2016 09
2016 10
2016 11
2016 12
2017 01
2017 02
2017 03
Total
% of total complaints received
Neuro Medicine 0 0 0 0 0 1 0 0 0 0 1 0 2
29%
Neuro Out Patients 0 0 0 1 0 0 0 0 1 0 1 0 3
9%
Neurophysiology 0 0 0 0 0 0 0 1 0 0 0 0 1
100%
Neuro Surgery 0 1 0 0 1 1 0 2 0 0 0 0 5 12%
Rehabilitation 0 0 0 0 0 0 0 0 0 0 1 0 1 17%
Neurosciences and Stroke Directorate: Complaints about Attitude
2016 04
2016 05
2016 06
2016 07
2016 08
2016 09
2016 10
2016 11
2016 12
2017 01
2017 02
2017 03
Total
% of total complaints received
Paediatric A and E 0 1 0 0 0 0 0 0 0 0 0 1 2
15%
Paediatric Medicine 0 1 0 0 0 1 0 0 0 0 0 0 2
17%
Paediatrics Outpatients 0 2 0 1 0 1 0 0 0 0 0 1 4
24%
Cancer Directorate: Complaints about Attitude
2016 04
2016 05
2016 06
2016 07
2016 08
2016 09
2016 10
2016 11
2016 12
2017 01
2017 02
2017 03
Total
% of total complaints received
Cancer 1 1 1 0 0 1 0 0 0 0 0 1 5 20%
Haematology Medicine 1 0 0 0 0 0 0 0 0 0 0 0 1
14%
Breast Screening 0 0 1 0 0 0 0 0 0 0 0 0 1
50%
15.4. Inpatient
15.5. The response rate in 2016 was 41% compared to 48% for 2015, a decrease in response
rates were seen across other Trusts involved in the survey.
15.6. The survey highlighted several areas as being positive aspects of the patient experience, these include:
Overall: 85% rated care 7+ out of 10
Overall: treated with respect and dignity 85%
Doctors: always had confidence and trust 83%
Hospital: room or ward was very/fairly clean 97%
Hospital: toilets and bathrooms were very/fairly clean 96%
Care: always enough privacy when being examined or treated 91%
Page 16 of 17
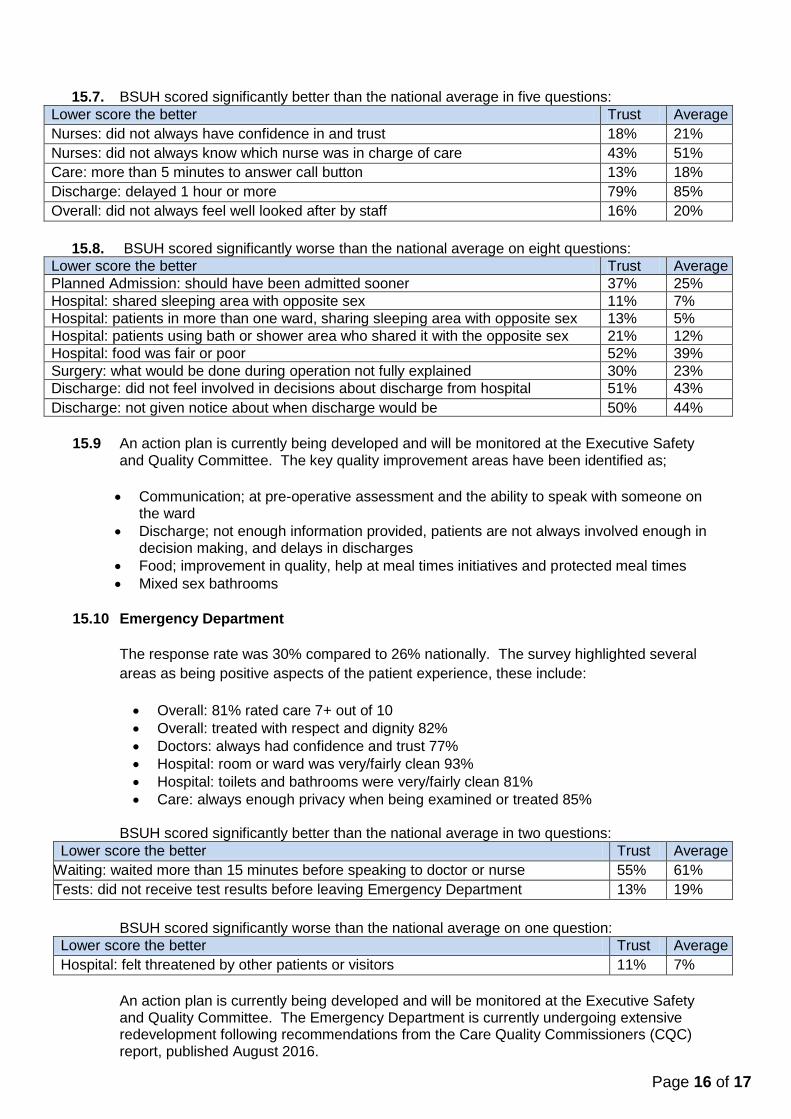
15.7. BSUH scored significantly better than the national average in five questions:
Lower score the better Trust Average
Nurses: did not always have confidence in and trust 18% 21%
Nurses: did not always know which nurse was in charge of care 43% 51%
Care: more than 5 minutes to answer call button 13% 18%
Discharge: delayed 1 hour or more 79% 85%
Overall: did not always feel well looked after by staff 16% 20%
15.8. BSUH scored significantly worse than the national average on eight questions:
Lower score the better Trust Average
Planned Admission: should have been admitted sooner 37% 25%
Hospital: shared sleeping area with opposite sex 11% 7%
Hospital: patients in more than one ward, sharing sleeping area with opposite sex 13% 5%
Hospital: patients using bath or shower area who shared it with the opposite sex 21% 12%
Hospital: food was fair or poor 52% 39%
Surgery: what would be done during operation not fully explained 30% 23%
Discharge: did not feel involved in decisions about discharge from hospital 51% 43%
Discharge: not given notice about when discharge would be 50% 44%
15.9 An action plan is currently being developed and will be monitored at the Executive Safety
and Quality Committee. The key quality improvement areas have been identified as;
Communication; at pre-operative assessment and the ability to speak with someone on
the ward
Discharge; not enough information provided, patients are not always involved enough in decision making, and delays in discharges
Food; improvement in quality, help at meal times initiatives and protected meal times
Mixed sex bathrooms
15.10 Emergency Department
The response rate was 30% compared to 26% nationally. The survey highlighted several
areas as being positive aspects of the patient experience, these include:
Overall: 81% rated care 7+ out of 10
Overall: treated with respect and dignity 82%
Doctors: always had confidence and trust 77%
Hospital: room or ward was very/fairly clean 93%
Hospital: toilets and bathrooms were very/fairly clean 81%
Care: always enough privacy when being examined or treated 85%
BSUH scored significantly better than the national average in two questions:
Lower score the better Trust Average
Waiting: waited more than 15 minutes before speaking to doctor or nurse 55% 61%
Tests: did not receive test results before leaving Emergency Department 13% 19%
BSUH scored significantly worse than the national average on one question:
Lower score the better Trust Average
Hospital: felt threatened by other patients or visitors 11% 7%
An action plan is currently being developed and will be monitored at the Executive Safety and Quality Committee. The Emergency Department is currently undergoing extensive redevelopment following recommendations from the Care Quality Commissioners (CQC) report, published August 2016.

Page 17 of 17
15.11 Children and Young People
The Trusts response rate for the results collected in March 2017 was 33% compared to 26%
nationally. The survey highlighted several areas as being positive aspects of the patient and
parents experience, these include:
Overall: 92% of parents rated care 7 or more out of 10.
Hospital staff: 88% of parents always had confidence and trust in the members of staff treating their child (0-15 years).
Overall: 93% of parents stated they were always treated with dignity and respect by the people looking after their child (0-7 years).
BSUH scored significantly better than the national average in thirty one questions:
Lower score the better Trust Average
Planned admissions: not given choice of admission date 45% 56%
Staff did not play with child but parent would have liked this 17% 24%
New members of staff did not always introduce themselves to parent 15% 20%
Staff did not always provide clear information to parent about their child's care and treatment
10% 16%
Staff did not fully talk to child about how they were going to care for them* 7% 13%
Child felt staff did not always communicate with child in a way that they could understand*
23% 30%
Staff did not agree a plan with parent for their child's care 5% 8%
Parents did not always have confidence and trust in staff members treating child 15% 20%
Staff did not give parents enough information to be involved in decisions about child's care or treatment
18% 23%
Staff did not keep parent fully informed about what was happening whilst child was in hospital
22% 28%
Parents were not always able to ask staff questions about their child's care 16% 20%
Children did not feel able to ask staff questions* 2% 5%
Staff gave conflicting information 27% 33%
Staff were not fully aware of child's medical history 29% 35%
Staff did not fully know how to care for child's individual or special needs 17% 24%
Parent felt child not always given enough privacy when receiving care and treatment 11% 17%
Staff were not always available when child needed attention 27% 34%
Staff caring for child did not always work well together 16% 23%
Parent did not have access to hot drinks facilities in the hospital 7% 15%
Parents not able to prepare food in the hospital but wanted to 45% 62%
Staff did not do everything they could to help ease their child's pain 15% 26%
Staff did not fully explain to parent what would be done during the operation/procedure 5% 9%
Staff did not distract the children from procedures or operations when this was necessary
23% 35%
Staff did not fully explain to parent how the operation or procedure had gone 15% 21%
Child not always given advice on how to look after themselves when they went home* 14% 20%
Parent did not receive written information but would have liked it 15% 20%
Parent felt that they were not always listened to 14% 25%
Parent felt that staff were not always friendly 9% 18%
Parent felt that child was not always looked after well by staff 10% 17%
Parent did not always feel well looked after by staff 26% 33%
Parent did not always feel treated with respect and dignity by staff 7% 15%
* child and young person data rather than parent data
BSUH did not score significantly worse on any question. An action plan is currently being developed and will be monitored at the Executive Safety and Quality Committee.